 Sofie Vettori1,2*
 Milena Dzhelyova2,3
 Stephanie Van der Donck1,2
 Corentin Jacques1,3
 Jean Steyaert1,2Bruno Rossion3,4,5Bart Boets1,2
- 1Center for Developmental Psychiatry, Department of Neurosciences, KU Leuven, Leuven, Belgium
- 2Leuven Autism Research (LAuRes), KU Leuven, Leuven, Belgium
- 3Institute of Research in Psychological Science, Institute of Neuroscience, University of Louvain, Louvain-La-Neuve, Belgium
- 4Université de Lorraine, CNRS, CRAN-UMR 7039, Nancy, France
- 5Université de Lorraine, CHRU-Service de Neurologie, Nancy, France
Individuals with autism spectrum disorder (ASD) have difficulties with social communication and interaction. The social motivation hypothesis states that a reduced interest in social stimuli may partly underlie these difficulties. Thus far, however, it has been challenging to quantify individual differences in social orientation and interest, and to pinpoint the neural underpinnings of it. In this study, we tested the neural sensitivity for social versus non-social information in 21 boys with ASD (8-12 years old) and 21 typically developing (TD) control boys, matched for age and IQ, while children were engaged in an orthogonal task. We recorded electroencephalography (EEG) during fast periodic visual stimulation (FPVS) of social versus non-social stimuli to obtain an objective implicit neural measure of relative social bias. Streams of variable images of faces and houses were superimposed, and each stream of stimuli was tagged with a particular presentation rate (i.e., 6 and 7.5 Hz or vice versa). This frequency-tagging method allows disentangling the respective neural responses evoked by the different streams of stimuli. Moreover, by using superimposed stimuli, we controlled for possible effects of preferential looking, spatial attention, and disengagement. Based on four trials of 60 s, we observed a significant three-way interaction. In the control group, the frequency-tagged neural responses to faces were larger than those to houses, especially in lateral occipito-temporal channels, while the responses to houses were larger over medial occipital channels. In the ASD group, however, faces and houses did not elicit significantly different neural responses in any of the regions. Given the short recording time of the frequency-tagging paradigm with multiple simultaneous inputs and the robustness of the individual responses, the method could be used as a sensitive marker of social preference in a wide range of populations, including younger and challenging populations.
Introduction
Individuals with autism spectrum disorder (ASD) are characterized by impairments in social communication and interaction, and the presence of restricted and repetitive patterns of interests and behavior. They often struggle with social interactions in daily life (1). Several developmental accounts [e.g., (2–4)] propose a developmental cascade in which early-onset impairments in social attention deprive children of adequate social learning experiences necessary for the development of successful social interactions (5). As a result, the classical preference for social over non-social stimuli (e.g., faces over artefacts) that is observed in early life and throughout development [e.g., (6–9)] might not arise, further disrupting the development of social skills and social cognition, and ultimately social functioning and interaction. Due to differences in neural reward processing, autistic people may not experience social stimuli as rewarding as neurotypical people do [e.g., (10–12)]. However, findings on this matter have not been entirely consistent. While Zeeland et al. (12), find that the response to social rewards is particularly decreased in children with ASD in relation to social reciprocity, reward responses to non-social stimuli were also reduced. Therefore, whether aberrant reward processing in ASD is confined to social stimuli or reflects a more general deficit in stimulus-reward associations remains unclear. Likewise, whether attentional processing is particularly impaired for social stimuli or for more complex stimuli in general, remains inconclusive (13).
Empirical evidence from eye-tracking studies confirms that the classical attentional preference for social versus non-social stimuli in the general population is reduced or even absent in individuals with ASD. While evidence is mixed during the first months of life, infants who later develop autism symptoms show reduced social orienting by the end of the first year (14, 15). Recently, a large cohort study (16) with toddlers (12–48 months old) reported enhanced preference for visual stimuli displaying geometric repetition as compared to social stimuli (e.g., videos of playing children) in children later diagnosed with ASD, in particular for an ASD subtype with more severe symptoms. These results suggest that perhaps, the decreased social engagement observed by the end of the first year of life is the developmental consequence of impairments in a different functional system during infancy. Hence, an alternative hypothesis is that decreased social orienting and motivation could, for example, be a consequence of difficulties in processing the incoming social information, rather than their cause (14, 15).
In a meta-analysis, Frazier and colleagues (17) analyzed and integrated results of 122 independent studies investigating gaze patterns in infants, children, and adults with ASD as compared to TD individuals. They concluded that individuals with ASD show a basic difficulty selecting socially relevant versus socially irrelevant information. Moreover, gaze abnormalities persist across age and worsen during the perception of human interactions. Other meta-analyses of eye-tracking studies report similar evidence for decreased visual attention to social stimuli in individuals with ASD (18, 19), and demonstrate that an increase in social load, either by including child directed speech or by including several persons interacting with each other, further results in decreased attention to social stimuli in participants with ASD. Thus, generally, eye-tracking research supports a reduced preferential looking bias for social stimuli in ASD. However, effect sizes are moderate and vary across studies, stimuli, and designs (18, 19).
Eye-tracking, often the methodology of choice to study social preference, conveys information about overt orienting processes. However, covert attention is not assessed by eye-tracking studies, possibly resulting in an underestimation of the social bias in studies comparing individuals with and without ASD. The covert processing of social information in ASD has been mostly studied via event-related potentials (ERPs) extracted from electroencephalography (EEG) [e.g., (20–26)]. The vast majority of studies focused on the N170, a negative ERP peaking at about 170 ms over occipito-temporal sites following the sudden onset of a face stimulus (27). This component is particularly interesting since it differs reliably between faces and other stimuli in neurotypical individuals (see 28 for review) and reflects the interpretation of a stimulus as a face, beyond the physical characteristics of the visual input (29–31). An extensive amount of research has investigated how the N170 may be different in individuals with ASD versus TD controls. A recent meta-analysis pointed to a small but significant delay in N170 latency in response to faces in ASD compared to TD controls (32). However, the effect is not systematically found and does not relate to behavioral measures of social functioning in ASD (33). Moreover, its specificity is questionable, since it may reflect the generally slower processing of meaningful, even non-social, visual stimuli (34). Neural processing of social and nonsocial stimuli has also been studied through functional near-infrared spectroscopy (fNIRS). Atypicalities in the neural processing of social information in 4–6 month old infants at high familial risk for ASD were demonstrated (35) and replicated in an independent sample (36). While these methods provide information about the covert processing of social and nonsocial information, they are limited by the need to present social and nonsocial stimuli at different times, in order to isolate and compare neural responses to each of them.
To address this limitation, our recent study (37) relied on an EEG frequency-tagging approach [(38), see (39) for review] to investigate to what extent school-aged boys with and without ASD show a bias toward social stimuli. Specifically, we simultaneously presented two stimulation streams of widely varying images of faces or houses, tagged at different frequency rates, next to each other. With eye-tracking, we measured the fixations within specific areas of interest spanning each stimulus type, thereby offering an index of the overt attentional preference. With EEG, we measured the amplitude of the frequency-tagged electroencephalographic response to each of the stimulus types, thereby offering an index of the neural saliency of each type of stimuli. Frequency-tagged EEG showed enhanced neural responses for faces versus houses in the TD group, and a significant reduction of this social bias in boys with ASD as compared to TD boys. Importantly, this reduced social bias in ASD, as indexed by a group by stimulus type interaction, was already significant after only 5 s of stimulus presentation. Frequency-tagging EEG responses and eye tracking results (i.e., proportional looking times) were highly correlated, implying that individuals who looked relatively more at the stream of faces also showed higher face-tagged EEG responses. However, solely based on the eye-tracking results, we could not conclude that social preference was significantly reduced in the ASD group. Thus, the eye-tracking preferential looking data did not differentiate significantly between both groups, whereas the frequency-tagging EEG data did. Moreover, and unfortunately, participants looked in between both streams of stimuli for a large proportion of time. Another issue is that individual differences in spatial attention and attentional disengagement might also have affected the amplitude of the neural responses, and individuals with ASD have been reported to present alterations in both these domains. Indeed, orienting to a visual stimulus outside the current focus of attention requires two (potentially separable) components: First, one must disengage from whatever currently occupies one’s attention, and, second, one must shift to the peripheral stimulus (40, 41). Pertaining to visuo-spatial attention, individuals with ASD have been reported to present a sharper focus of attention (42) and they may benefit less and more slowly from a spatial cue in a Posner task (43). Pertaining to attentional disengagement, and in line with the restricted and repetitive behaviors and the characteristic difficulties in flexibility in ASD, a systematic review (41) concluded that there is robust behavioral and electrophysiological evidence from infants, children, and adults that autistic individuals have difficulties with disengagement. Mo et al. (44) further showed that this difficulty with attentional disengagement is rather domain-general and not specific to social stimuli.
Based on these considerations, the present study aims at improving our measures and strengthen our previous observations by spatially superimposing the two types of stimulus streams, so that differences in looking patterns, spatial attention, and disengagement cannot influence the processing saliency of each stimulus category. More precisely, while recording EEG signals, we present two streams of widely varying images of faces and houses, tagged at different frequency rates, simultaneously and superimposed at exactly the same position (Figure 1; Movie S1). Combining frequency-tagging with EEG allows disentangling neural responses to each of the stimulation streams, even when they are superimposed. Previous frequency-tagging EEG research with superimposed stimuli has shown that attention can modulate neural processing in a nonspatial manner. Enhanced processing (indicated by increased frequency-tagging EEG responses) of particular visual features (e.g., color, orientation, or direction of motion) or objects has been reported when those are attended, even when they are spatially overlapping [e.g., (45–49)]. In particular, one study presented spatially overlapping frequency-tagged face and house images while magnetoencephalography (MEG) responses were monitored as participants attended to the overlapping streams for cued targets. By combining the frequency-tagged MEG responses with functional ROIs defined from functional MRI (fMRI), the researchers found that attention to faces resulted in enhanced sensory responses in a face-selective region of the fusiform gyrus, whereas attention to houses resulted in increased responses in a place-selective region of the parahippocampal gyrus (50).
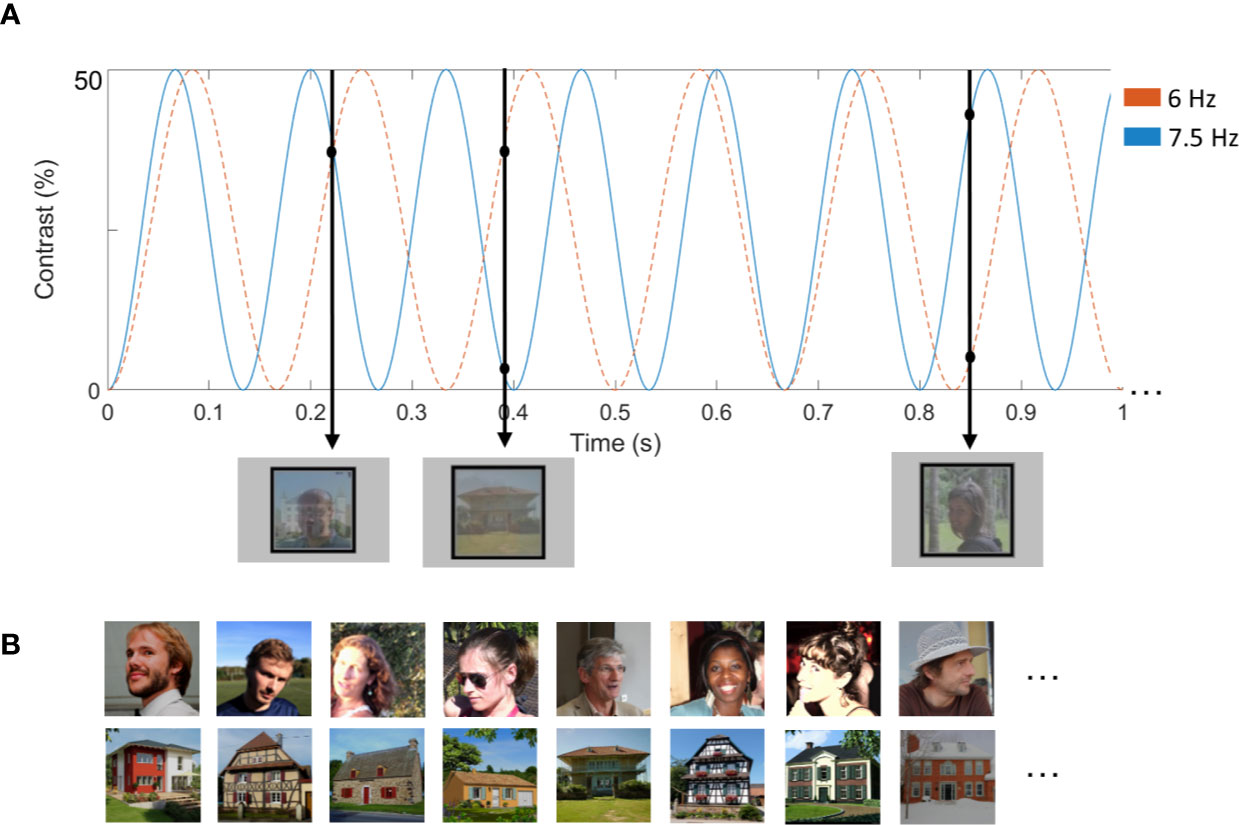
Figure 1 (A) Illustration of a stimulation sequence. The total experiment consisted of four sequences of 60 s. We counterbalanced frequencies (6 and 7.5 Hz) of the stimuli. In the illustrated example, images of houses were presented at 6 Hz, while images of faces were presented at 7.5 Hz. In the other two trials, faces were presented at 6 Hz and houses at 7.5 Hz. Images were contrast-modulated from 0 to 50%. The first black arrow depicts what was presented at 0.22 s. At this time point, the second face is presented at approximately 30% contrast, while the second house is also presented at 30% contrast. (B) Examples of face and house stimuli. Written informed consent was obtained from the individuals for the publication of the images.
In the current study, images of natural faces (highly varying across viewpoint, luminance etc …) were used as a prototype of the social category. Pictures of houses were used as the non-social category, as often used in neuroimaging and electrophysiology research to compare to faces, including recent studies in ASD (33). Pictures of houses are typically associated with responses in medial regions of the ventral occipitotemporal cortex, such as the collateral sulcus and the parahippocampal gyrus (50–54) whereas faces typically elicit responses in the lateral parts of the middle fusiform gyrus (latFG) and in the inferior occipital gyrus (IOG) of the ventral occipito-temporal cortex (VOTC) (55–58) [see (59) for a direct comparison using human intracerebral recording data]. Moreover, faces and houses evoke quantitatively and qualitatively different category-selective responses in scalp EEG (60).
In general, we expect to find a strong social bias in TD children, as indicated by larger frequency-tagged EEG amplitudes in response to face stimuli as compared to house stimuli. Based on the literature and in accordance with our previous study (37), we expect that children with ASD will show a reduced social bias compared to TD children, or even that the social bias may be absent.
Material and Methods
Participants
We recruited 47 boys, aged 8-to-12 years old. To match the groups on verbal and performance IQ (VIQ, PIQ) five participants (two from the TD group, three from the ASD group) were a priori excluded from the reported analyses, resulting in a sample of 21 typically developing (TD) boys (mean age = 11.0 years ± SD = 1.2) and 21 boys with ASD (mean age = 10.9 ± 1.5, Table 1). However, inclusion of these participants did not change any results of the analyses. The sample in this study is identical to the one in the previous study (37), where social and non-social stimuli were presented side-by-side. All participants had normal or corrected-to-normal vision, and had a verbal and performance IQ above 80. Thirty-nine participants were right-handed. Participants with ASD were recruited through the Autism Expertise Center of the University Hospitals Leuven, Belgium. TD participants were recruited through elementary schools and sports clubs.
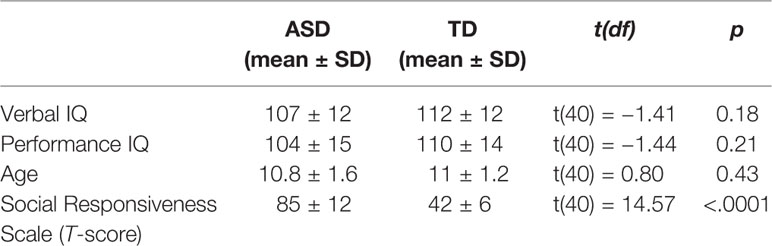
Table 1 Participant characteristics.
Participant exclusion criteria were the presence or suspicion of a psychiatric, neurological, learning, or developmental disorder [other than ASD or comorbid attention deficit hyperactivity disorder (ADHD) in ASD participants] in the participant or in a first- or second-degree relative. This was assessed with a checklist filled out by the parents. Inclusion criteria for the ASD group were a formal diagnosis of ASD made by a multidisciplinary team in a standardized way according to DSM-IV-TR or DSM-5 criteria (1) and a total T-score above 60 on the Social Responsiveness Scale [SRS parent version (61)]. Seven participants with ASD took medication to reduce symptoms related to ASD and/or ADHD (Rilatine, Concerta, Aripiprazol). The TD sample comprised healthy volunteers, matched on age, verbal and performance IQ. Parents of the TD children also completed the SRS questionnaire to exclude the presence of substantial ASD symptoms. Descriptive statistics for both groups are displayed in Table 1, showing that they did not differ for age and IQ. Evidently, both groups differed highly significantly on SRS scores.
The Medical Ethical Committee of the university hospital approved the study, and the participants as well as their parents provided informed consent according to the Declaration of Helsinki. All participants received a monetary reward and a small present of their choice. The experiment was embedded in a larger research project consisting of three testing sessions. Intellectual abilities were assessed in a separate session. The current frequency-tagging experiment was included in the third session.
IQ Measures
An abbreviated version of the Dutch Wechsler Intelligence Scale for Children, Third Edition [WISC-III-NL; (62, 63)] was administered. Performance IQ was estimated by the subtests Block Design and Picture Completion, verbal IQ by the subtests Vocabulary and Similarities (64).
Frequency Tagging Experiment
Stimuli
Forty-eight color images of faces and 48 images of houses were used, all within their original background, making the images widely variable. Stimuli were selected from (65) and (60). Amplitude spectra of the face and house stimuli are available in supplementary material (Figure S1 and Figure S2, Supplementary Material). The spectral analyses show that house stimuli have more energy in higher spatial frequencies and cardinal orientations. Faces and houses were presented superimposed on the screen, with a broad rectangular outline around them (Figure 1): one stimulation stream presented faces, and the other stream presented houses. All images differed highly in terms of viewpoint, lighting conditions and background. All stimuli were resized to 250 x 250 pixels, had equal pixel luminance and root-mean-square contrast on the whole image. Shown at a distance of 60 cm, and at a resolution of 1,920 x 1,200, the stimuli subtended approximately 13° of visual angle. Both the face and the object images were presented in a random order.
Procedure
After electrode-cap placement, participants were seated at a viewing distance of 60 cm and were instructed to maintain a constant distance. Stimuli were displayed on the screen [24-in. light-emitting diode (LED)-backlit liquid crystal display (LCD) monitor] through sinusoidal contrast modulation on a light grey background using Java. We used a screen with a refresh rate of 60 Hz, ensuring that the refresh rate was an integer multiple of the presentation frequencies. A sequence lasted 64 s, including 60 s of stimulation at full contrast, flanked by 2 s of fade-in and fade-out, with contrast gradually increasing and decreasing between 0 and 50%. Fade-in and fade-out were used to avoid abrupt eye movements and eye blinks due to the sudden appearance or disappearance of flickering stimuli. In total, there were four sequences, hence the total duration of the stimulus presentation was about 4 minutes.
Figure 1 and Movie S1 (Supplementary Material) illustrate a sequence, consisting of two streams of simultaneously presented series of images. In each sequence, images of one stimulus category were presented at 6 Hz and images of the other category at 7.5 Hz. The two streams of images were superimposed to one another and shown at the center of the screen. All images were drawn randomly from their respective categories, cycling through all available images before any image repetition. The presentation rate (6 vs. 7.5 Hz) was counterbalanced across both stimulus types (faces vs. houses), resulting in two conditions presented in a randomized order. The presentation frequencies were selected so that they are close to each other, in order to minimize differences in absolute EEG response (39, 66, 67).
Participants were instructed to look freely at the images on the screen and to press a key whenever they detected brief (300 ms) changes in the color of the rectangular outline surrounding the images. These color changes occurred randomly, 15 times per sequence. This task was orthogonal to the effect/manipulation of interest and ensured that participants maintained a constant level of attention throughout the entire experiment.
Electroencephalography Recording
EEG was recorded using a BioSemi ActiveTwo amplifier system with 64 Ag/AgCl electrodes. During recording, the system uses two additional electrodes for reference and ground (CMS, common mode sense, and DRL, driven right leg). Horizontal and vertical eye movements were recorded using four electrodes placed at the outer canthi of the eyes and above and below the right orbit. The EEG was sampled at 512 Hz.
Electroencephalography Analysis
Preprocessing
All EEG processing was performed using Letswave 6 (https://www.letswave.org/) and MATLAB 2017 (the MathWorks). EEG data was segmented in 67-s segments (2s before and 5s after each sequence), bandpass filtered (0.1 to 100 Hz) using a fourth-order Butterworth filter, and downsampled to 256 Hz. Next, noisy electrodes were linearly interpolated from the three spatially nearest electrodes (not more than 5% of the electrodes, -i.e., three electrodes, were interpolated). All data segments were re-referenced to a common average reference. While in frequency-tagging studies we typically apply blink correction (using ICA) for any participant blinking more than 2 SD above the mean [e.g., (68–70)], in the present study we did not perform any blink correction as none of the participants blinked excessively, i.e., more than two standard deviations above the mean across all participants (0.36 times per second). Note that frequency-tagging yields responses with a high SNR at specific frequency bins, while blink artefacts are broadband and thus do not generally interfere with the responses at the predefined frequency (67). Hence, blink correction (or removal of trials with many blinks) is not systematically performed in such studies [e.g., (71–73)].
Frequency-Domain Analysis
Preprocessed segments were further cropped to contain an integer number of 1.5 Hz cycles (i.e., largest common divisor of both 6 and 7.5 Hz), beginning after fade-in and until 59.38 s (15,203 time bins). The resulting segments were averaged per condition (i.e., segments with the same combination of stimulus category and presentation rate) in the time domain to preserve the complex phase of the response and reduce EEG activity out-of-phase with the stimulation (i.e., noise). The averaged waveforms were transformed into the frequency domain using a Fast Fourier transform (FFT), and the amplitude spectrum was computed with a high spectral resolution (0.017 Hz, 1/59.38 s) resulting in a very high signal-to-noise ratio (SNR) (39, 67).
The recorded EEG contains signal at harmonics frequencies (i.e., integer multiples) of the frequencies at which images are presented (6 and 7.5 Hz) (39, 67). We used two measures to describe the response in relation to the noise level: signal-to-noise ratio (SNR) to better visualize the data [e.g., (74)] and baseline-corrected amplitudes to quantify the response across harmonics (65). SNR spectra were computed for each electrode by dividing the value at each frequency bin by the average value of the 20 neighboring frequency bins (12 bins on each side, i.e., 24 bins, but excluding the 2 bins directly adjacent and the 2 bins with the most extreme values). Figure 2 displays the SNR spectra. We computed baseline-corrected amplitudes in a similar way by subtracting the average amplitude of the 20 surrounding bins. For group visualization of topographical maps (Figure 3), we computed across-subjects averages of the baseline-corrected amplitudes for each condition and electrode separately.
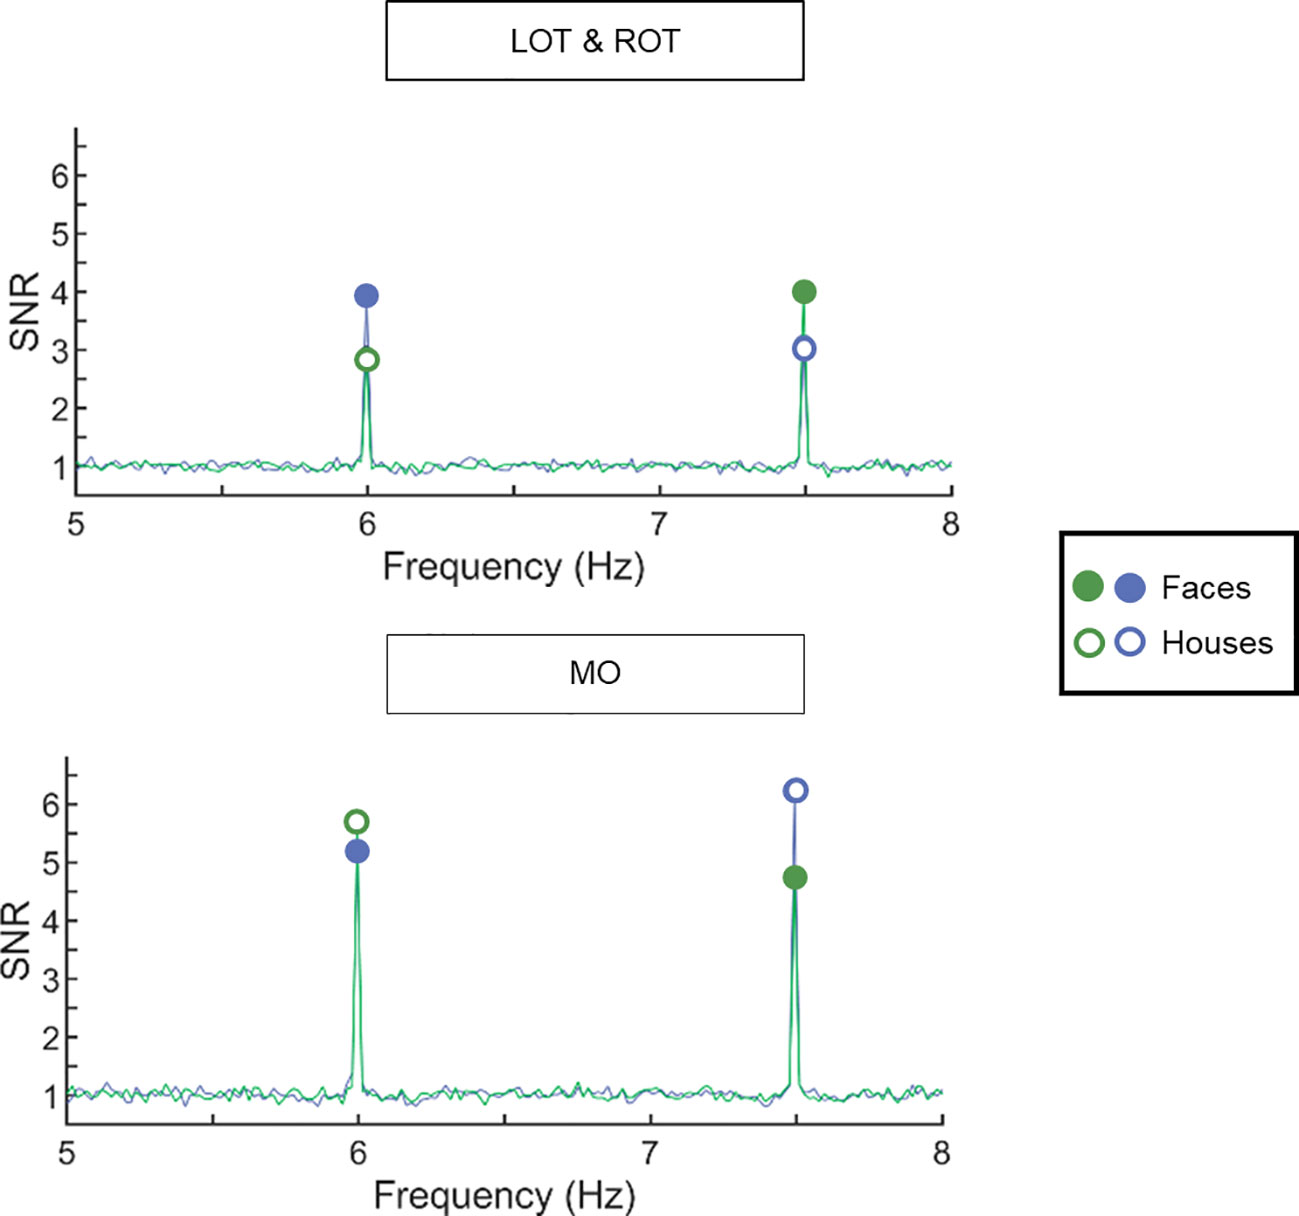
Figure 2 Signal-to-noise ratio (SNR) spectra averaged across all participants (across the two groups) show clear responses at the first harmonic frequencies of interest. Data are plotted for the left and right occipito-temporal region (upper panel) and the medial occipital region (lower panel). The frequency spectrum is plotted from 5 to 8 Hz. In green, images of houses are presented at 6 Hz, while images of faces were presented at 7.5 Hz. In blue, the frequencies were reversed. Full circles display the neural response for faces, empty circles display the neural response for houses. In left and right occipito-temporal ROIs, the response to faces is larger than to houses. In the medial occipital ROI, the response to houses is larger than the response to faces.
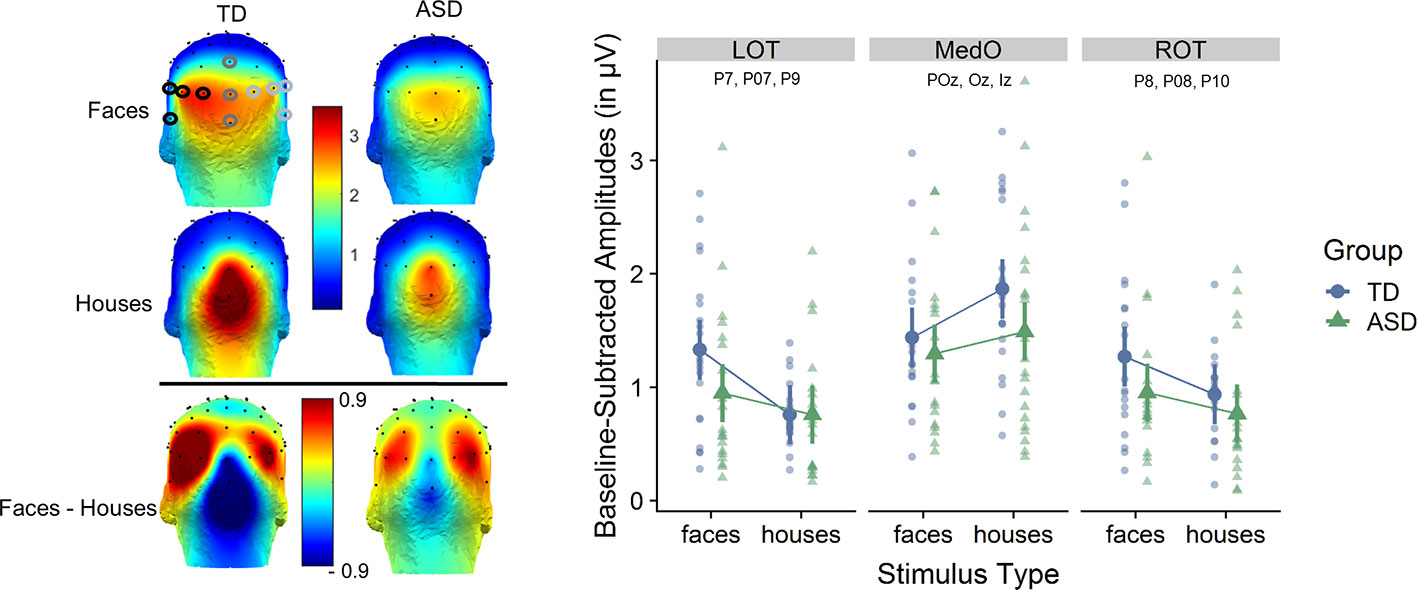
Figure 3 Left: scalp distribution of the electroencephalography (EEG) signal during fast periodic visual stimulation (baseline subtracted amplitudes in µV). Frequency-tagged neural responses to the streams of periodically presented faces and houses are shown for each participant group, as well as the differential response for faces minus houses. The analysis of the response to both types of stimuli focused on three regions of interests (ROIs): medial occipital (MO: Iz, Oz, POz), left occipito-temporal (LOT: O1, PO7, P7, P9), and right occipito-temporal (ROT: O2, PO8, P8, P10). Right: averaged baseline-subtracted amplitudes for each stimulus condition (faces or houses) for each group and for each ROI. The individual subject data is displayed in the background. Statistical analysis shows an interaction between group, stimulus type and ROI.
Since the response is inherently distributed over multiple harmonics and all the harmonic frequencies represent some aspect of the periodic response, we combine the response amplitudes across all those harmonics whose response amplitude is significantly higher than the amplitude of the surrounding noise bins [as recommended in (65)]. To define the harmonics that were significantly above noise level, we computed Z-score spectra on group-level data for each stimulation frequency (60, 68, 74, 75). We averaged the FFT amplitude spectra across electrodes in the relevant regions-of-interest (ROIs) based on topographical maps, and transformed these values into Z-scores (i.e., the difference between the amplitude at each frequency bin and the mean amplitude of the corresponding 20 surrounding bins, divided by the SD of the amplitudes in these 20 surrounding bins). For 6 Hz, Z-scores were significant (i.e., Z > 2.32 or p < 0.01) until the 5th harmonic (30 Hz) and for 7.5 Hz, Z-scores until the fourth harmonic (30 Hz) were significant. To include an equal number of harmonics for both stimulation frequencies and to exclude shared harmonics (30 Hz), we selected the first three harmonics for both frequencies and summed the baseline-corrected amplitudes of those for each frequency and each condition separately. Hence, we quantified neural responses to faces and houses at 6 Hz and at 7.5 Hz by summing the baseline-subtracted responses for 3 harmonics: 6, 12, and 18 Hz for the 6 Hz stimulation frequency; and 7.5, 15, and 22.5 Hz for the 7.5 Hz stimulation frequency. Therefore, we obtained an index of neural saliency per stimulus type (i.e., houses versus faces) and per presentation rate.
Based on a priori knowledge, in accordance with previous studies and confirmed by visual inspection of the topographical maps of both groups (Figure 3), we identified regions of interest (ROI) in which the signal was maximal and averaged the signal at these nearby electrodes. The analysis of the response to both types of stimuli focused on three ROIs: medial occipital (MO: Iz, Oz, POz), left occipito-temporal (LOT: O1, PO7, P7, P9) and right occipito-temporal (ROT: O2, PO8, P8, P10) (Figure 3).
Statistical Analysis
We statistically analyzed the baseline-corrected amplitudes in each ROI and at each presentation frequency for each stimulus type at the group-level using general linear mixed-effects models (LMEMs) using the AFEX package v0.22-1 (76) in R v3.4.3 (R Core Team, 2012). In particular, we examined the neural responses (i.e., baseline-subtracted amplitudes) with stimulus type (houses vs. faces) and ROI (MO, LOT, ROT) as within-subject factors, and group (ASD vs. TD) as a between-subject factor. We included a random intercept per participant in the model. Post-hoc T-tests were performed on the fitted model using the emmeans package (77). Tukey-corrected p-values were used to compare means and unstandardized effect sizes are reported [cf. (78, 79)].
In addition, we determined the significance of responses for each individual participant and each stimulus type as follows [e.g., (66, 69, 71)]: 1) the raw FFT amplitude spectrum was averaged across electrodes per ROI, and 2) cut into segments centered on the target frequency bin and harmonics (i.e., 6, 12, 18 Hz or 7.5, 15, 22.5 Hz), surrounded by 20 neighboring bins on each side; 3) the amplitude values across the segments of FFT spectra were summed; 4) the summed FFT spectrum was transformed into a z-score using the 20 surrounding bins (see above). Responses of a given participant were considered significant if the z-score at the target frequency bin exceeded 1.64 (i.e., p < 0.05 one-tailed: signal > noise). Finally, we computed spearman correlations between the neural measures and the scores on the Social Responsiveness Scale (SRS). To this end, we used the corrplot package in R (78).
Results
No Group Difference in Orthogonal Task Performance
Both groups performed equally on the behavioral color change detection task, suggesting a similar level of attention throughout the experiments. Both groups showed accuracies between 97 (SD = 6%) and 97.1% (SD = 3.9%) with mean response times between 0.47 (SD = 0.07) and 0.46 (SD = 0.04) seconds, for ASD and TD respectively. Statistical analyses (two-sided t-tests) showed no significant differences between the ASD group and the TD group [accuracy: t(36) = -0.03, p = 0.49; response times t(36)= 0.71, p = 0.24].
Electroencephalography Responses in Autism Spectrum Disorder Participants Are Not Modulated by Social Versus Non-Social Stimulation
We observed robust frequency-tagged responses, in the three regions of interest (ROI) and for the two stimulus types (see Figure 2 for SNR spectrograms and Figure 3 for scalp distributions and averaged response amplitudes). Analyses at the individual level indicated that, despite the short recording time, all participants showed significant responses to houses and to faces in the pre-specified ROIs.
At the group level, statistical analyses showed a main effect of stimulus type [F(1,441) = 5.02; p = 0.026] [faces (1.20 µV) larger than houses (1.08 µV) and a main effect of ROI (F(2,441)= 58.10, p <0.0001] [larger responses in MO (1.51 µV) than in LOT (0.94 µV) and ROT (0.97 µV)]. These effects were qualified by a significant interaction effect between stimulus type and ROI [F(2,441) = 19.10, p < 0.0001] and, most importantly a significant three-way interaction between group, stimulus type, and ROI [F(2,441) = 3.40, p = 0.034)]. Post-hoc testing revealed that over the left occipito-temporal channels, the response for faces (1.32 µV) was larger than for houses (0.75 µV) in the TD group [T(441) = 4.73, p = 0.0002)]. While over the ROT channels the responses were also higher to faces (1.26 µV) than to houses (0.91 µV) in the TD group, this effect did not reach significance [T(441) = 2.75, p = 0.207]. Over medial occipital channels, responses to houses (1.82 µV) were significantly higher than to faces (1.44 µV) in the TD group [T(441) = −3.54, p = 0.0226]. In contrast, in the ASD group, the responses to faces were not significantly different from responses to houses, in none of the ROIs [LOT: T(441) = 1.6, p = 0.91, ROT: T(441) = 1.56, p = 0.92, MO: T(441) = −1.64, p = 0.89)]. Mean amplitude values for the ASD group in LOT were 0.95 µV (faces) and 0.76 µV (houses); in ROT 0.95 µV (faces) and 0.77 µV (houses); and in MO 1.30 µV (faces) and 1.49 µV (houses).
Taken together, the three-way interaction indicates that the neural organization of the TD participants is more differentiated and specialized in terms of anatomically localized stimulus-specific responses, whereas the response pattern of the ASD group is not modulated by the social versus non-social character of the stimulation.
In addition, we considered how the neural responses evolved over the course of a stimulation sequence, as this could also inform about the minimal sequence length needed to observe an interaction effect. To do so, we cut the original data in segments of increasing length (5 to 60 s in steps of 5 s: 5, 10, 15,…, 60 s). For all segments, we plotted the evolution of the signal relative to the sequence duration (Figure 4). Overall, after an initial buildup period, mean amplitudes remain stable over the trial duration and reflect the findings described above. More specifically, in left and right OT channels, the group x stimulus type interaction (indicative of a differential social bias in ASD vs. TD) is significant from 25 s onwards [F(1,285) = 4.61, p = 0.03)] and remains significant during the entire trial (p < .05).
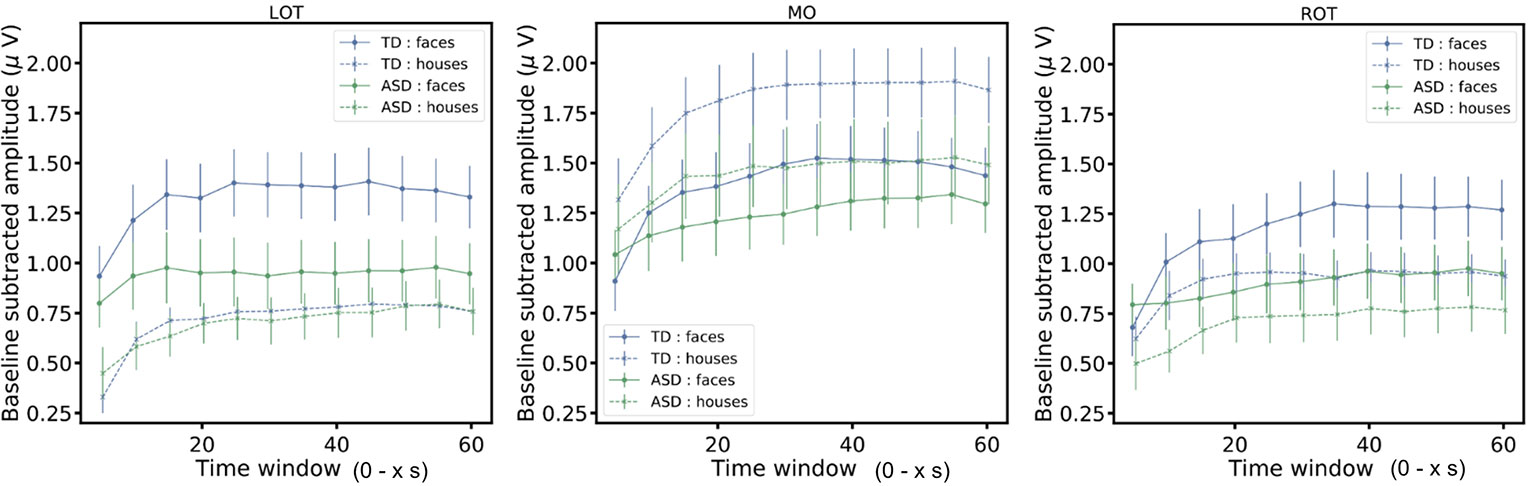
Figure 4 The figure shows the baseline subtracted amplitudes of the responses for segments of increasing length (5 to 60 s in steps of 5 s: 5, 10, 15,…, 60 s). The mean amplitudes (± SEM) are displayed.
No Associations Between Neural Responses and Social Responsivity
Spearman correlations showed that individual differences in the amplitude of the neural responses were not significantly related to individual differences in social responsivity as reported by the parents on the SRS questionnaire. Neither the difference between faces and houses, nor the amplitudes of faces and houses separately were correlated with the SRS. This was the case within the two groups and across the groups.
Discussion
Individuals with autism spectrum disorder (ASD) have difficulties with social communication and interaction. Here, we quantified the saliency of processing social versus non-social information by frequency-tagging superimposed streams of widely variable images of faces and houses while recording EEG. This approach allows monitoring brain responses to simultaneously presented stimuli, and, importantly, changes in response amplitude represent dynamic neural changes related to the intensity of processing the driving stimulus. Whereas a recent study showed reduced social bias in ASD using a frequency-tagging EEG approach with streams of social and non-social stimuli presented side-by-side (37), here we extend and specify these findings by presenting the stimulation streams superimposed. By doing so, we can specifically measure the neural processing and saliency of each stimulus category, while ruling out potential confounds related to looking patterns, spatial attention and attentional disengagement.
Within a short amount of time (i.e., four trials of 60 s), we observed significant responses for each participant and each stimulus type. These responses were implicit in the sense that they did not require any active behavior of the participant, apart from looking at the screen. Importantly, they were determined in an objective manner since they were locked to the stimulation frequencies (39, 67) and did not require any subjective interpretation on the part of the researcher. The stimulation-tagged brain responses were located over medial occipital and occipito-temporal regions. Results showed a significant interaction between stimulus type, group and regions of interest (ROI). In the TD group, faces elicited larger responses than houses over occipito-temporal channels, while houses evoked stronger responses than faces over medial occipital channels. Conversely, in the ASD group, the differences between faces and houses were not significant in any of the ROIs. In other words, TD participants showed a differentiated localization and tuning of the neural responses toward social versus non-social stimuli, whereas the response pattern of the ASD group was not modulated by the social versus non-social character of the stimulation.
Reduced interest in social stimuli in ASD might result in less frequent engagement with faces. Accordingly, developing neural systems devoted to face processing may lack experience-expectant visual input, which may be necessary for establishing the neural architecture for expert face processing competency (2). Here, we show that even when individuals with ASD show similar spatial attention to the stream of faces, EEG frequency-tagging still evokes lower face-selective neural activity in occipito-temporal areas as compared to TD individuals. We observed that in the TD group, faces elicited larger responses than houses over occipito-temporal channels, while houses evoked stronger responses than faces over medial occipital channels. This result is in line with previous observations, indicating that lateral ventral occipito-temporal brain regions (i.e., inferior occipital gyrus, lateral fusiform gyrus) respond preferentially to face stimuli while medial occipito-temporal structures (medial temporal gyrus, collateral sulcus, and parahypocampal gyrus) display a preference for house stimuli (51, 53, 54, 80). Likewise, previous research combining frequency-tagging MEG with functional ROIs defined from fMRI showed that attention allocation selectively modulated the amplitude of the frequency-tagged responses to superimposed stimuli: attention to faces resulted in selectively enhanced responses in the fusiform area, whereas attention to houses increased the neural responses in the parahippocampal place area (50). In addition, the medial occipital brain topography in response to the houses may be particularly driven by particular low-level characteristics of the houses, such as rectangular features (81) and cardinal orientation (82, 83). Indeed, in general, houses have more energy in higher spatial frequencies and cardinal orientation, as was also confirmed by the amplitude spectra of the face and house stimuli used in this study (Figure S1, Supplementary Material). Along these lines, previous ERP studies have shown larger amplitudes in early visual ERPs over medial occipital electrodes for images with more high spatial frequency content (84).
In the TD group, significantly increased responses to faces versus houses were found only in the left ROI. At first glance, this observation appears inconsistent with the typical right lateralization of the human cortical face network (57, 59, 85). Nevertheless, other studies in children within this age range have not found the right lateralization pattern for face preference that is typically observed in adults [e.g., (86)]. Moreover, studies using a frequency-tagging oddball EEG paradigm across different ages suggest a non-linear development of the right hemispheric specialization for human face perception (87). In 5 year old children (87) and 8–12 year old children (70), face-selective responses did not differ across hemispheres, while the same paradigm in adults [e.g., (76)] and in infants (88) elicits right lateralized electrophysiological occipito-temporal face-selective responses.
Strikingly, in the ASD group, the neural responses for faces and houses were not significantly different from each other in any of the ROIs. Previous observations already indicated altered sensitivity to face stimuli in the fusiform face area (FFA) of ASD (89–93), although this finding has not always been replicated (94–98). One possibility is that less frequent engagement with faces might have resulted in altered specialization of the FFA in ASD participants.
In a previous study (37), we presented streams of social and non-social stimuli side-by-side and we showed that frequency-tagging is a sensitive method allowing us to observe a reduced social bias in boys with ASD. Here, by superimposing both streams of stimuli, we showed that even in the absence of explicit looking behavior, frequency-tagging allows measuring the relative neural saliency of faces and houses. As a result, we quantified the implicit social bias in children with and without ASD, while controlling for potential influences of visuo-spatial attention and/or attentional disengagement. Against this background, our findings suggest that in children with ASD, as compared with TD children, the face-sensitive areas are less preferentially responsive for faces compared to houses and that the typical social bias in these areas is reduced. Our findings generally corroborate developmental accounts that relate social experiences to the specialized neural wiring of the face processing network.
Unexpectedly, however, children with ASD also show less differentiated responses to the house stimulation in the medial occipital region. Taken together, this suggests that, generally, the neural wiring in children with ASD is less differentiated and specialized, and less modulated by the social versus non-social character of the stimulation, which may possibly point toward a more general developmental delay in social and non-social visual sensory processing. This finding might echo broader predictive coding accounts of ASD, suggesting a generally atypical attentional information processing style that is manifested most clearly in the social domain—possibly to the high complexity inherent to social situations (13).
We did not observe significant correlations between the SRS and the face or house-related neural responses. The SRS measures the severity of ASD symptoms over a variety of domains, based on evaluations by the parents. Hence, while it gives a clear idea of the perceived symptoms in daily life, this measure does not purely reflect the actual behavior and performance, and is also determined by several other parent-related processes (e.g., whether there are other children in the family with an ASD diagnosis) (99). Second, the variation of amplitude of the EEG response across individuals also reflects general factors such as skull thickness and cortical folding (see the discussion in (100). While these factors should be neutralized when comparing relatively large groups of participants or when comparing different paradigms in the same participants, they add variance to amplitude differences within a group of individuals, reducing the significance of correlation measures [see (33, 101)]
Further studies are required to replicate this finding in a larger and more heterogeneous and representative sample. Given the short recording time of the frequency-tagging paradigm with multiple simultaneous inputs and the robustness of the individual responses, the method could be used as a fast marker of social preference in a wide range of populations, including low-functioning individuals with ASD, and young children and infants (87, 88). Therefore, the approach has potential to pinpoint developmental trajectories in longitudinal research, from infancy onwards. Moreover, implicit objective measures can help overcome the difficulty of interpreting behavioral findings (which may be influenced by many factors such as motivation, task understanding, etc.). Since in the current study no positional counterbalancing is needed, few trials are required in order to obtain robust data. This is especially an advantage when testing challenging populations, where testing time is limited.
Data Availability Statement
The anonymized datasets generated for this study are available on request to the corresponding author.
Ethics Statement
The studies involving human participants were reviewed and approved by Ethische commissie onderzoek UZ/KU Leuven. Written informed consent to participate in this study was provided by the participants’ legal guardian.
Author Contributions
SVe, MD, SVa, BR, and BB conceived and designed the study. SVa and JS contributed to participant recruitment. SVe and SVa collected the data. SVe, CJ, and MD statistically analyzed and interpreted the data, and all authors discussed the results. SVe and BB drafted the manuscript. All authors provided feedback and approved the final version.
Funding
This work was supported by grants of the Research Foundation Flanders (FWO; G0C7816N) and Excellence of Science (EOS) grant (G0E8718N; HUMVISCAT) and of the Marguerite-Marie Delacroix foundation.
Conflict of Interest
The authors declare that the research was conducted in the absence of any commercial or financial relationships that could be construed as a potential conflict of interest.
Acknowledgments
We want to thank the participants and their parents for participating in our study.
Supplementary Material
The Supplementary Material for this article can be found online at: https://www.frontiersin.org/articles/10.3389/fpsyt.2020.00332/full#supplementary-material
References
1. American Psychiatric Association. Diagnostic and statistical manual of mental disorders (DSM-5). (2013).
2. Chevallier C, Kohls G, Troiani V, Brodkin ES, Schultz RT. The social motivation theory of autism. Trends Cognit Sci (2012) 16(4):231–9. doi: 10.1016/j.tics.2012.02.007
3. Klin A, Jones W, Schultz R, Volkmar F. The enactive mind, or from actions to cognition: lessons from autism. Philos Trans R Soc Lond B Biol Sci (2003) 358(1430):345–60. doi: 10.1098/rstb.2002.1202
4. Klin A, Shultz S, Jones W. Social visual engagement in infants and toddlers with autism: early developmental transitions and a model of pathogenesis. Neurosci Biobehav Rev (2015) 50:189–203. doi: 10.1016/j.neubiorev.2014.10.006
5. Happé F, Cook JL, Bird G. The Structure of Social Cognition: In(ter)dependence of Sociocognitive Processes. Annu Rev Psychol (2017) 68(1):243–67. doi: 10.1146/annurev-psych-010416-044046
6. Crouzet SM, Kirchner H, Thorpe SJ. Fast saccades toward faces: face detection in just 100 ms. J Vis (2010) 10(4):16.1–17. doi: 10.1167/10.4.16
7. Goren CC, Sarty M, Wu PY. Visual following and pattern discrimination of face-like stimuli by newborn infants. Pediatrics. (1975) 56(4):544–9.
8. Johnson MH, Dziurawiec S, Ellis H, Morton J. Newborns’ preferential tracking of face-like stimuli and its subsequent decline. Cognition. (1991) 40(1–2):1–19. doi: 10.1016/0010-0277(91)90045-6
9. Purcell DG, Stewart AL. The face-detection effect: configuration enhances detection. Percept Psychophy (1988) 43(4):355–66. doi: 10.3758/BF03208806
10. Kohls G, Schulte-Rüther M, Nehrkorn B, Müller K, Fink GR, Kamp-Becker I, et al. Reward system dysfunction in autism spectrum disorders. Soc Cognit Affect Neurosci (2013) 8(5):565–72. doi: 10.1093/scan/nss033
11. Stavropoulos KKM, Carver LJ. Reward anticipation and processing of social versus nonsocial stimuli in children with and without autism spectrum disorders. J Child Psychol Psychiatry (2014) 55(12):1398–408. doi: 10.1111/jcpp.12270
12. Zeeland AAS-V, Dapretto M, Ghahremani DG, Poldrack RA, Bookheimer SY. Reward processing in autism. Autism Res (2010) 3(2):53–67. doi: 10.1002/aur.122
13. Van de Cruys S, Evers K, Van der Hallen R, Van Eylen L, Boets B, de-Wit L, et al. Precise minds in uncertain worlds: Predictive coding in autism. Psychol Rev (2014) 121(4):649–75. doi: 10.1037/a0037665
14. Gliga T, Jones EJH, Bedford R, Charman T, Johnson MH. From early markers to neuro-developmental mechanisms of autism. Dev Rev (2014) 34(3):189–207. doi: 10.1016/j.dr.2014.05.003
15. Jones EJH, Gliga T, Bedford R, Charman T, Johnson MH. Developmental pathways to autism: A review of prospective studies of infants at risk. Neurosci Biobehav Rev (2014) 39:1–33. doi: 10.1016/j.neubiorev.2013.12.001
16. Moore A, Wozniak M, Yousef A, Barnes CC, Cha D, Courchesne E, et al. The geometric preference subtype in ASD: identifying a consistent, early-emerging phenomenon through eye tracking. Mol Autism (2018) 9:19. doi: 10.1186/s13229-018-0202-z
17. Frazier TW, Strauss M, Klingemier EW, Zetzer EE, Hardan AY, Eng C, et al. A Meta-Analysis of Gaze Differences to Social and Nonsocial Information Between Individuals With and Without Autism. J Am Acad Child Adolesc Psychiatry (2017) 56(7):546–55. doi: 10.1016/j.jaac.2017.05.005
18. Chita-Tegmark M. Social attention in ASD: A review and meta-analysis of eye-tracking studies. Res Dev Disabil (2016) 48:79–93. doi: 10.1016/j.ridd.2015.10.011
19. Guillon Q, Hadjikhani N, Baduel S, Rogé B. Visual social attention in autism spectrum disorder: Insights from eye tracking studies. Neurosci Biobehav Rev (2014) 42:279–97. doi: 10.1016/j.neubiorev.2014.03.013
20. Benning SD, Kovac M, Campbell A, Miller S, Hanna EK, Damiano CR, et al. Late Positive Potential ERP Responses to Social and Nonsocial Stimuli in Youth with Autism Spectrum Disorder. J Autism Dev Disord (2016) 46(9):3068–77. doi: 10.1007/s10803-016-2845-y
21. Dawson G, Carver L, Meltzoff AN, Panagiotides H, McPartland J, Webb SJ. Neural correlates of face and object recognition in young children with autism spectrum disorder, developmental delay, and typical development. Child Dev (2002) 73(3):700–17. doi: 10.1111/1467-8624.00433
22. Gunji A, Goto T, Kita Y, Sakuma R, Kokubo N, Koike T, et al. Facial identity recognition in children with autism spectrum disorders revealed by P300 analysis: a preliminary study. Brain Dev (2013) 35(4):293–8. doi: 10.1016/j.braindev.2012.12.008
23. McCleery JP, Akshoomoff N, Dobkins KR, Carver LJ. Atypical Face Versus Object Processing and Hemispheric Asymmetries in 10-Month-Old Infants at Risk for Autism. Biol Psychiatry (2009) 66(10):950–7. doi: 10.1016/j.biopsych.2009.07.031
24. Monteiro R, Simões M, Andrade J, Castelo Branco M. Processing of Facial Expressions in Autism: a Systematic Review of EEG/ERP Evidence. Rev J Autism Dev Disord (2017) 4(4):255–76. doi: 10.1007/s40489-017-0112-6
25. O’Connor K, Hamm JP, Kirk IJ. Neurophysiological responses to face, facial regions and objects in adults with Asperger’s syndrome: an ERP investigation. Int J Psychophysiol Off J Int Organ Psychophysiol (2007) 63(3):283–93. doi: 10.1016/j.ijpsycho.2006.12.001
26. Webb SJ, Jones EJH, Merkle K, Murias M, Greenson J, Richards T, et al. Response to familiar faces, newly familiar faces, and novel faces as assessed by ERPs is intact in adults with autism spectrum disorders. Int J Psychophysiol Off J Int Organ Psychophysiol (2010) 77(2):106–17. doi: 10.1016/j.ijpsycho.2010.04.011
27. Bentin S, Allison T, Puce A, Perez E, McCarthy G. Electrophysiological Studies of Face Perception in Humans. J Cognit Neurosci (1996) Nov8(6):551–65. doi: 10.1162/jocn.1996.8.6.551
28. Rossion B, Jacques C. The N170: understanding the time-course of face perception in the human brain. The Oxford handbook of ERP components, (2011) 115–42.
29. Caharel S, Leleu A, Bernard C, Viggiano M-P, Lalonde R, Rebaï M. Early holistic face-like processing of Arcimboldo paintings in the right occipito-temporal cortex: evidence from the N170 ERP component. Int J Psychophysiol Off J Int Organ Psychophysiol (2013) 90(2):157–64. doi: 10.1016/j.ijpsycho.2013.06.024
30. Churches O, Nicholls M, Thiessen M, Kohler M, Keage H. Emoticons in mind: an event-related potential study. Soc Neurosci (2014) 9(2):196–202. doi: 10.1080/17470919.2013.873737
31. Rossion. Understanding face perception by means of human electrophysiology. Trends Cognit Sci (2014) 18(6):310–8. doi: 10.1016/j.tics.2014.02.013
32. Kang E, Keifer CM, Levy EJ, Foss-Feig JH, McPartland JC, Lerner MD. Atypicality of the N170 Event-Related Potential in Autism Spectrum Disorder: A Meta-analysis. Biol Psychiatry Cognit Neurosci Neuroimaging (2018) 3(8):657–66. doi: 10.1016/j.bpsc.2017.11.003
33. Key AP, Corbett BA. The Unfulfilled Promise of the N170 as a Social Biomarker. Biol Psychiatry Cognit Neurosci Neuroimaging (2020) Mar5(3):342–53. doi: 10.1016/j.bpsc.2019.08.011
34. Vettori S, Jacques C, Boets B, Rossion B. Can the N170 be used as an electrophysiological biomarker indexing face processing difficulties in autism spectrum disorder?. Biol. Psychiatry Cogn Neurosci Neuroimaging (2019) 4(3):321–3.
35. Lloyd-Fox S, Blasi A, Elwell CE, Charman T, Murphy D, Johnson MH. Reduced neural sensitivity to social stimuli in infants at risk for autism. Proc R Soc B Biol Sci (2013) 280(1758):20123026. doi: 10.1098/rspb.2012.3026
36. Braukmann R, Lloyd-Fox S, Blasi A, Johnson MH, Bekkering H, Buitelaar JK, et al. Diminished socially selective neural processing in 5-month-old infants at high familial risk of autism. Eur J Neurosci (2018) 47(6):720–8. doi: 10.1111/ejn.13751
37. Vettori S, Dzhelyova M, Van der Donck S, Jacques C, Van Wesemael T, Steyaert J, et al. Combined frequency-tagging EEG and eye tracking reveal reduced social bias in boys with autism spectrum disorder. Cortex. (2020) 125:135–48. doi: 10.1016/j.cortex.2019.12.013
38. Regan D, Heron JR. Clinical investigation of lesions of the visual pathway: a new objective technique. J Neurol Neurosurg Psychiatry (1969) 32(5):479–83. doi: 10.1136/jnnp.32.5.479
39. Norcia AM, Appelbaum LG, Ales JM, Cottereau BR, Rossion B. The steady-state visual evoked potential in vision research: A review. J Vis (2015) May 115(6):4–4. doi: 10.1167/15.6.4
40. Posner MI, Cohen. Components of visual orienting. In: . Attention and performance. Hillsdale, NJ: Erlbaum; (1984).
41. Sacrey L-AR, Armstrong VL, Bryson SE, Zwaigenbaum L. Impairments to visual disengagement in autism spectrum disorder: A review of experimental studies from infancy to adulthood. Neurosci Biobehav Rev (2014) 47:559–77. doi: 10.1016/j.neubiorev.2014.10.011
42. Robertson CE, Kravitz DJ, Freyberg J, Baron-Cohen S, Baker CI. Tunnel Vision: Sharper Gradient of Spatial Attention in Autism. J Neurosci (2013) 33(16):6776–81. doi: 10.1523/JNEUROSCI.5120-12.2013
43. Townsend J, Courchesne E, Covington J, Westerfield M, Harris NS, Lyden P, et al. Spatial Attention Deficits in Patients with Acquired or Developmental Cerebellar Abnormality. J Neurosci (1999) 19(13):5632–43. doi: 10.1523/JNEUROSCI.19-13-05632.1999
44. Mo S, Liang L, Bardikoff N, Sabbagh MA. Shifting visual attention to social and non-social stimuli in Autism Spectrum Disorders. Res Autism Spectr Disord (2019) 65:56–64. doi: 10.1016/j.rasd.2019.05.006
45. Pei F, Pettet MW, Norcia AM. Neural correlates of object-based attention. J Vis (2002) 2(9):1–1. doi: 10.1167/2.9.1
46. Chen Y, Seth AK, Gally JA, Edelman GM. The power of human brain magnetoencephalographic signals can be modulated up or down by changes in an attentive visual task. Proc Natl Acad Sci (2003) 100(6):3501–6. doi: 10.1073/pnas.0337630100
47. Müller MM, Andersen S, Trujillo NJ, Valdés-Sosa P, Malinowski P, Hillyard SA. Feature-selective attention enhances color signals in early visual areas of the human brain. Proc Natl Acad Sci U S A. (2006) 103(38):14250–4. doi: 10.1073/pnas.0606668103
48. Andersen SK, Fuchs S, Müller MM. Effects of feature-selective and spatial attention at different stages of visual processing. J Cognit Neurosci (2011) 23(1):238–46. doi: 10.1162/jocn.2009.21328
49. Störmer VS, Winther GN, Li S-C, Andersen SK. Sustained multifocal attentional enhancement of stimulus processing in early visual areas predicts tracking performance. J Neurosci Off J Soc Neurosci (2013) 33(12):5346–51. doi: 10.1523/JNEUROSCI.4015-12.2013
50. Baldauf D, Desimone R. Neural mechanisms of object-based attention. Science. (2014) 344(6182):424–7. doi: 10.1126/science.1247003
51. Epstein R, Kanwisher N. A cortical representation of the local visual environment. Nature. (1998) 392(6676):598–601. doi: 10.1038/33402
52. Jacques C, Witthoft N, Weiner KS, Foster BL, Rangarajan V, Hermes D, et al. Corresponding ECoG and fMRI category-selective signals in human ventral temporal cortex. Neuropsychologia. (2016) 83:14–28. doi: 10.1016/j.neuropsychologia.2015.07.024
53. Kadipasaoglu CM, Conner CR, Whaley ML, Baboyan VG, Tandon N. Category-selectivity in human visual cortex follows cortical topology: a grouped icEEG study. PloS one (2016) 11(6).
54. Weiner KS, Grill-Spector K. Sparsely-distributed organization of face and limb activations in human ventral temporal cortex. NeuroImage. (2010) Oct 152(4):1559–73. doi: 10.1016/j.neuroimage.2010.04.262
55. Grill-Spector K, Weiner KS, Kay K, Gomez J. The Functional Neuroanatomy of Human Face Perception. Annu Rev Vis Sci (2017) 153:167–96. doi: 10.1146/annurev-vision-102016-061214
56. Haxby null, Hoffman null, Gobbini null. The distributed human neural system for face perception. Trends Cognit Sci (2000) 4(6):223–33. doi: 10.1016/S1364-6613(00)01482-0
57. Kanwisher N, McDermott J, Chun MM. The fusiform face area: a module in human extrastriate cortex specialized for face perception. J Neurosci Off J Soc Neurosci (1997) 17(11):4302–11. doi: 10.1523/JNEUROSCI.17-11-04302.1997
58. Puce A, Allison T, Gore JC, McCarthy G. Face-sensitive regions in human extrastriate cortex studied by functional MRI. J Neurophysiol (1995) 74(3):1192–9. doi: 10.1152/jn.1995.74.3.1192
59. Hagen S, Jacques C, Maillard L, Colnat-Coulbois S, Rossion B, Jonas J. Spatially dissociated intracerebral maps for face- and house-selective activity in the human ventral occipito-temporal cortex. Cereb Cortex (in press).
60. Jacques C, Retter TL, Rossion B. A single glance at natural face images generate larger and qualitatively different category-selective spatio-temporal signatures than other ecologically-relevant categories in the human brain. NeuroImage. (2016) 137:21–33. doi: 10.1016/j.neuroimage.2016.04.045
61. Constantino JN, Gruber CP. Social responsiveness scale (SRS). CA;: Western Psychological Services Torrance (2012).
62. Kort W, Schittekatte M, Dekker PH, Verhaeghe P, Compaan EL, Bosmans M, et al. WISC-III NL wechsler intelligence scale for children. (2005).
63. Wechsler D. The Wechsler intelligence scale for children (3rd ed.). San Antonio, TX: The Psychological Corporation (1991).
65. Retter TL, Rossion B. Uncovering the neural magnitude and spatio-temporal dynamics of natural image categorization in a fast visual stream. Neuropsychologia. (2016) 91:9–28. doi: 10.1016/j.neuropsychologia.2016.07.028
66. Boremanse A, Norcia AM, Rossion B. Dissociation of part-based and integrated neural responses to faces by means of electroencephalographic frequency tagging. Eur J Neurosci (2014) 40(6):2987–97. doi: 10.1111/ejn.12663
67. Regan D. Human brain electrophysiology: Evoked potentials and evoked magnetic fields in science and medicine. Amsterdam, The Netherlands: Elsevier; (1989).
68. Dzhelyova M, Jacques C, Rossion B. At a Single Glance: Fast Periodic Visual Stimulation Uncovers the Spatio-Temporal Dynamics of Brief Facial Expression Changes in the Human Brain. Cereb Cortex. (2017) 27(8):4106–23. doi: 10.1093/cercor/bhw223
69. Van der Donck S, Dzhelyova M, Vettori S, Thielen H, Steyaert J, Rossion B, et al. Fast Periodic Visual Stimulation EEG Reveals Reduced Neural Sensitivity to Fearful Faces in Children with Autism. J Autism Dev Disord (2019) 49(11):4658–73. doi: 10.1007/s10803-019-04172-0
70. Vettori S, Dzhelyova M, Van der Donck S, Jacques C, Steyaert J, Rossion B, et al. Reduced neural sensitivity to rapid individual face discrimination in autism spectrum disorder. NeuroImage Clin (2019) 21:101613. doi: 10.1016/j.nicl.2018.101613
71. Hemptinne C, Liu-Shuang J, Yuksel D, Rossion B. Rapid Objective Assessment of Contrast Sensitivity and Visual Acuity With Sweep Visual Evoked Potentials and an Extended Electrode Array. Invest Ophthalmol Vis Sci (2018) 59(2):1144–57. doi: 10.1167/iovs.17-23248
72. Rossion BA. Robust sensitivity to facial identity in the right human occipito-temporal cortex as revealed by steady-state visual-evoked potentials. J Vis (2011) 11(2):16–6. doi: 10.1167/11.2.16
73. Zimmermann FGS, Yan X, Rossion B. An objective, sensitive and ecologically valid neural measure of rapid human individual face recognition. R Soc Open Sci (2019) 6(6):181904. doi: 10.1098/rsos.181904
74. Rossion, Torfs K, Jacques C, Liu-Shuang J. Fast periodic presentation of natural images reveals a robust face-selective electrophysiological response in the human brain. J Vis (2015) 15(1):18–8. doi: 10.1167/15.1.18
75. Liu-Shuang J, Norcia AM, Rossion B. An objective index of individual face discrimination in the right occipito-temporal cortex by means of fast periodic oddball stimulation. Neuropsychologia. (2014) 52:57–72. doi: 10.1016/j.neuropsychologia.2013.10.022
76. Singmann H, Bolker B, Westfall J, Aust F. (2018). afex: Analysis of Factorial Experiments [Internet]. Available from: https://CRAN.R-project.org/package=afex.
77. Lenth R, Singmann H, Love J, Buerkner P, Herve M. (2019). emmeans: Estimated Marginal Means, aka Least-Squares Means [Internet]. Available from: https://CRAN.R-project.org/package=emmeans.
78. Wei T, Simko V. (2017). R package “corrplot”: Visualization of a Correlation Matrix [Internet]. Available from: https://github.com/taiyun/corrplot.
79. Pek J, Flora DB. Reporting effect sizes in original psychological research: A discussion and tutorial. Psychol Methods (2018) 23(2):208–25. doi: 10.1037/met0000126
80. Epstein RA, Bar M, Kveraga K. Neural systems for visual scene recognition. Scene Vision (2014), 105–34. doi: 10.7551/mitpress/9780262027854.003.0006
81. Nasr S, Echavarria CE, Tootell RBH. Thinking outside the box: rectilinear shapes selectively activate scene-selective cortex. J Neurosci Off J Soc Neurosci (2014) 34(20):6721–35. doi: 10.1523/JNEUROSCI.4802-13.2014
82. Furmanski CS, Engel SA. An oblique effect in human primary visual cortex. Nat Neurosci (2000) 3(6):535–6. doi: 10.1038/75702
83. Nasr S, Tootell RBH. A cardinal orientation bias in scene-selective visual cortex. J Neurosci Off J Soc Neurosci (2012) 32(43):14921–6. doi: 10.1523/JNEUROSCI.2036-12.2012
84. Hansen BC, Johnson AP, Ellemberg D. Different spatial frequency bands selectively signal for natural image statistics in the early visual system. J Neurophysiol (2012) 108(8):2160–72. doi: 10.1152/jn.00288.2012
85. Sergent J, Signoret JL. Functional and anatomical decomposition of face processing: evidence from prosopagnosia and PET study of normal subjects. Philos Trans R Soc Lond B Biol Sci (1992) 335(1273):55–61; discussion 61-62. doi: 10.1098/rstb.1992.0007
86. Dundas EM, Plaut DC, Behrmann M. An ERP investigation of the co-development of hemispheric lateralization of face and word recognition. Neuropsychologia. (2014) 61:315–23. doi: 10.1016/j.neuropsychologia.2014.05.006
87. Lochy A, de Heering A, Rossion B. The non-linear development of the right hemispheric specialization for human face perception. Neuropsychologia. (2019) 18126:10–9. doi: 10.1016/j.neuropsychologia.2017.06.029
88. de Heering A, Rossion B. Rapid categorization of natural face images in the infant right hemisphere. eLife. (2015) 4:e06564. doi: 10.7554/eLife.06564
89. Dalton KM, Nacewicz BM, Johnstone T, Schaefer HS, Gernsbacher MA, Goldsmith HH, et al. Gaze fixation and the neural circuitry of face processing in autism. Nat Neurosci (2005) 8(4):519–26. doi: 10.1038/nn1421
90. Deeley Q, Daly EM, Surguladze S, Page L, Toal F, Robertson D, et al. An event related functional magnetic resonance imaging study of facial emotion processing in Asperger syndrome. Biol Psychiatry (2007) 62(3):207–17. doi: 10.1016/j.biopsych.2006.09.037
91. Hubl D, Bölte S, Feineis-Matthews S, Lanfermann H, Federspiel A, Strik W, et al. Functional imbalance of visual pathways indicates alternative face processing strategies in autism. Neurology. (2003) 61(9):1232–7. doi: 10.1212/01.WNL.0000091862.22033.1A
92. Pierce K, Müller RA, Ambrose J, Allen G, Courchesne E. Face processing occurs outside the fusiform “face area” in autism: evidence from functional MRI. Brain J Neurol (2001) 124(Pt 10):2059–73. doi: 10.1093/brain/124.10.2059
93. Schultz RT, Gauthier I, Klin A, Fulbright RK, Anderson AW, Volkmar F, et al. Abnormal ventral temporal cortical activity during face discrimination among individuals with autism and Asperger syndrome. Arch Gen Psychiatry (2000) 57(4):331–40. doi: 10.1001/archpsyc.57.4.331
94. Bird G, Catmur C, Silani G, Frith C, Frith U. Attention does not modulate neural responses to social stimuli in autism spectrum disorders. NeuroImage. (2006) 31(4):1614–24. doi: 10.1016/j.neuroimage.2006.02.037
95. Hadjikhani N, Joseph RM, Snyder J, Chabris CF, Clark J, Steele S, et al. Activation of the fusiform gyrus when individuals with autism spectrum disorder view faces. NeuroImage. (2004) 22(3):1141–50. doi: 10.1016/j.neuroimage.2004.03.025
96. Hadjikhani N, Joseph RM, Snyder J, Tager-Flusberg H. Abnormal activation of the social brain during face perception in autism. Hum Brain Mapp (2007) 28(5):441–9. doi: 10.1002/hbm.20283
97. Kleinhans NM, Richards T, Sterling L, Stegbauer KC, Mahurin R, Johnson LC, et al. Abnormal functional connectivity in autism spectrum disorders during face processing. Brain J Neurol (2008) 131(Pt 4):1000–12. doi: 10.1093/brain/awm334
98. Pierce K, Haist F, Sedaghat F, Courchesne E. The brain response to personally familiar faces in autism: findings of fusiform activity and beyond. Brain J Neurol (2004) 127(Pt 12):2703–16. doi: 10.1093/brain/awh289
99. De la Marche W, Noens I, Kuppens S, Spilt JL, Boets B, Steyaert J. Measuring quantitative autism traits in families: informant effect or intergenerational transmission? Eur Child Adolesc Psychiatry (2015) 24(4):385–95. doi: 10.1007/s00787-014-0586-z
100. Xu B, Liu-Shuang J, Rossion B, Tanaka J. Individual Differences in Face Identity Processing with Fast Periodic Visual Stimulation. J Cognit Neurosci (2017) Mar 3029(8):1368–77. doi: 10.1162/jocn_a_01126
Keywords: frequency tagging, autism spectrum disorder (ASD), EEG, social attention, faces
Citation: Vettori S, Dzhelyova M, Van der Donck S, Jacques C, Steyaert J, Rossion B and Boets B (2020) Frequency-Tagging Electroencephalography of Superimposed Social and Non-Social Visual Stimulation Streams Reveals Reduced Saliency of Faces in Autism Spectrum Disorder. Front. Psychiatry 11:332. doi: 10.3389/fpsyt.2020.00332
Received: 03 December 2019; Accepted: 02 April 2020;
Published: 28 April 2020.
Edited by:
Victoria Leong, University of Cambridge, United KingdomReviewed by:
Wanze Xie, Boston Children’s Hospital, United StatesMadeleine Groom, University of Nottingham, United Kingdom
Iti Arora Fedyushkin, University of Nottingham, United Kingdom, in collaboration with reviewer MG
Copyright © 2020 Vettori, Dzhelyova, Van der Donck, Jacques, Steyaert, Rossion and Boets. This is an open-access article distributed under the terms of the Creative Commons Attribution License (CC BY). The use, distribution or reproduction in other forums is permitted, provided the original author(s) and the copyright owner(s) are credited and that the original publication in this journal is cited, in accordance with accepted academic practice. No use, distribution or reproduction is permitted which does not comply with these terms.
*Correspondence: Sofie Vettori, c29maWUudmV0dG9yaUBrdWxldXZlbi5iZQ==