 Sungkean Kim1
 Miseon Shim
 Min Jin Jin
 Chang-Hwan Im
 Seung-Hwan Lee
- 1J. Crayton Pruitt Family Department of Biomedical Engineering, University of Florida, Gainesville, FL, United States
- 2Clinical Emotion and Cognition Research Laboratory, Inje University, Goyang, South Korea
- 3Department of Biomedical Engineering, Hanyang University, Seoul, South Korea
- 4Institute of Industrial Technology, Korea University, Sejong, South Korea
- 5Department of Psychiatry, Wonkwang University Hospital, Iksan, South Korea
- 6Department of Psychiatry, Inje University Ilsan Paik Hospital, Ilsan, South Korea
Background: Pathologies of schizophrenia and bipolar disorder have been poorly understood. Brain network analysis could help understand brain mechanisms of schizophrenia and bipolar disorder. This study investigates the source-level brain cortical networks using resting-state electroencephalography (EEG) in patients with schizophrenia and bipolar disorder.
Methods: Resting-state EEG was measured in 38 patients with schizophrenia, 34 patients with bipolar disorder type I, and 30 healthy controls. Graph theory based source-level weighted functional networks were evaluated: strength, clustering coefficient (CC), path length (PL), and efficiency in six frequency bands.
Results: At the global level, patients with schizophrenia or bipolar disorder showed higher strength, CC, and efficiency, and lower PL in the theta band, compared to healthy controls. At the nodal level, patients with schizophrenia or bipolar disorder showed higher CCs, mostly in the frontal lobe for the theta band. Particularly, patients with schizophrenia showed higher nodal CCs in the left inferior frontal cortex and the left ascending ramus of the lateral sulcus compared to patients with bipolar disorder. In addition, the nodal-level theta band CC of the superior frontal gyrus and sulcus (cognition-related region) correlated with positive symptoms and social and occupational functioning scale (SOFAS) scores in the schizophrenia group, while that of the middle frontal gyrus (emotion-related region) correlated with SOFAS scores in the bipolar disorder group.
Conclusions: Altered cortical networks were revealed and these alterations were significantly correlated with core pathological symptoms of schizophrenia and bipolar disorder. These source-level cortical network indices could be promising biomarkers to evaluate patients with schizophrenia and bipolar disorder.
Introduction
Schizophrenia and bipolar disorder are both major psychiatric disorders. Schizophrenia is frequently characterized by positive and negative symptoms, whereas bipolar disorder is generally characterized by mania and depression (1). Schizophrenia and bipolar disorder have both similarities and differences with respect to neuropsychological and neurophysiological levels. In addition, they have overlapping symptoms, such as psychotic symptoms, disorganized thinking, and depressive symptoms (2–4). However, the pathologies of these two diseases have not yet been revealed (2, 5). Therefore, studies that could help in understanding the pathologies of these two diseases are needed.
Electroencephalography (EEG) can detect the synchronous activity in neuronal populations. Because EEG is mainly produced by post-synaptic potentials, it is susceptible to alterations in neurotransmission secondary to pharmacological manipulations or brain dysfunction (6). Resting state brain activity reflects the baseline status of the brain and has been proposed as a means of exploring the underlying pathophysiological characteristics of psychiatric disorders (7). In addition, unique EEG patterns have been observed in mental disorders during resting state. These patterns were associated with the pathophysiological characteristics of the conditions (8, 9). The brain is active during the resting state and the additional consumption of glucose metabolism with task-related activity is often less than 5%, which is only a small portion of overall brain activity (10). Therefore, resting state analysis is necessary to understand the pathophysiology of mental disorders well.
Previous studies indicate abnormal EEG oscillatory activity during resting state in schizophrenia and bipolar disorder. Schizophrenia has shown increased low frequency power and coherence. Although findings for bipolar disorder have been less well characterized than schizophrenia, bipolar disorder has shown increased low frequency power and decreased alpha frequency power (11–14). In addition, Kam et al. (14) reported that bipolar disorder showed increased high frequency power and coherence while schizophrenia showed increased low frequency connectivity within and across hemispheres.
Recently, an increasing number of researchers have paid attention to changes in the cortical functional network to quantify global and local changes using graph theory (15–17). Graph theory has been introduced recently as a method to construct human brain networks. Brain networks based on graph theoretical approaches could help to understand brain mechanisms of psychiatric disorders including schizophrenia and bipolar disorder. Altered activation of resting-state functional connectivity or networks has been shown in schizophrenia (18–23) and bipolar disorder (24–26). For example, a resting-state fMRI study revealed reduced clustering coefficients (CCs) and reduced probability in high degree hubs for schizophrenia (19). For resting-state EEG studies, Rubinov et al. (18) showed lower CCs and shorter path length (PL) in whole frequency bands in schizophrenia. Furthermore, Kim et al. (26) showed decreased CC and efficiency and increased PL in the alpha band in bipolar disorder.
However, these previous EEG studies mainly conducted sensor-level (electrode-level) connectivity and network analyses. They could therefore not identify specific cortical regions contributing to the alteration of the cortical functional network in schizophrenia or bipolar disorder. In sensor-level analysis, EEG has some limitations such as low spatial resolution due to volume conduction (27), and poor signal-to-noise ratios due to diverse artifacts and noises (28); however, source-imaging can be a good alternative to circumvent these issues. The spatial resolution of EEG, in particular, can be considerably improved by mapping the scalp potential distribution onto the underlying cortical source space via source-imaging methods. To the best of our knowledge, no study so far has investigated and compared altered source-level cortical functional networks based on graph theory using resting-state EEG in patients with schizophrenia and bipolar disorder.
In this present study, we investigated cortical functional networks in patients with schizophrenia and bipolar disorder through a source-level weighted network analysis during resting-state EEG. Thus, we could observe the alteration of networks in both specific local cortical regions and the global network pattern. Furthermore, we examined the relationships between cortical network indices and psychiatric, clinical, or cognitive measures, which would help in comprehending the pathologies of schizophrenia and bipolar disorder. We hypothesized that patients with schizophrenia and bipolar disorder would exhibit an altered cortical functional network in both global and nodal levels during resting state, and that the altered cortical network indices such as strength, CC, PL, and efficiency would be significantly associated with psychiatric symptom scales.
Materials and Methods
Participants
In total, 102 participants with the ages ranging from 20 to 63 years participated in this study. The participants included patients with schizophrenia [n=38, age: 43.16 ± 11.16 (range: 21–60)] and bipolar disorder [n=34, age: 41.44 ± 12.57 (range: 20–63)] as well as healthy controls [n=30, age: 42.97 ± 12.40 (range: 23–63)]. All patients were evaluated for Axis I (29) and II (30) disorders based on the Structured Clinical Interview for the Diagnostic and Statistical Manual of Mental Disorders, 4th edition (SCID) by a board-certified psychiatrist. No patient had alcohol or drug abuse, mental retardation, a lifetime history of central nervous system, or head injury with loss of consciousness. All patients with bipolar disorder were diagnosed with type I. In addition, 10 patients with bipolar disorder had psychotic symptoms. Most of the patients with schizophrenia were being treated with atypical antipsychotics with or without mood-stabilizing agents (lithium, topiramate, lamotrigine, and sodium valproate) and most patients with bipolar disorder were being treated with atypical antipsychotics and mood-stabilizing agents. Thirty-three patients with schizophrenia were on antipsychotics and six patients with schizophrenia were on mood stabilizers. In terms of patients with bipolar disorder, 30 patients were on antipsychotics and 28 patients were on mood stabilizers. Thirty healthy controls were recruited through the local community via flyers and newspapers. An initial screening interview excluded participants with head injury or any personal or family history of psychiatric illness or any identifiable neurological disorder. Following the initial screening, potential healthy controls were interviewed through the SCID for Axis II Psychiatric Disorders (30) and were rejected if they had any psychiatric disorders. All participants signed a written informed consent form approved by the Institutional Review Board of Inje University Ilsan Paik Hospital (2015-07-23).
Psychiatric, Clinical, and Cognitive Measures
Psychiatric symptoms were evaluated using the Positive and Negative Syndrome Scale (PANSS) for schizophrenia (31) and the Young Mania Rating Scale (YMRS) for bipolar disorder (32). To evaluate neurocognition, the Korean Auditory Verbal Learning Test (K-AVLT) (33) was used. K-AVLT belonging to the Rey-Kim Memory Test (33) is a verbal memory test consisting of five immediate recall trials (trials 1–5), delayed recall trials, and delayed recognition trials. Immediate recall score is the sum of correctly recalled words (trials 1–5). The delayed recall score represents the number of correctly recalled words after a 20 min delay period. The delayed recognition score represents the correctly chosen words from the original list (15 words) which are spoken by the examiner among a list of 50 words after delayed recall. To evaluate functional outcomes, the Social and Occupational Functioning Assessment Scale (SOFAS) (34, 35) was used. The SOFAS was applied as a one-item rating scale from clinician’s judgment of overall level of functioning for Axis V in the Diagnostic and Statistical Manual for Mental Disorders 4th Edition. The SOFAS is a global rating scale, ranging from 0 to 100, for current functioning with lower scores indicating lower functioning (34, 35). In addition, the premorbid IQ was measured using the information test from the Korean Wechsler Adult Intelligence Scale (K-WAIS-IV), age, and education year (36).
Recording and Preprocessing of Electroencephalography (EEG)
Resting-state EEG data were recorded in a sound-attenuated room, while the participants closed their eyes for 5 min. EEG was recorded with a NeuroScan SynAmps2 amplifier (Compumedics USA, Charlotte, NC, USA) using an extended 10–20 placement scheme via 62 Ag-AgCl electrodes mounted on a Quik-Cap. The reference electrode was Cz and the ground electrode was on the forehead. Horizontal electrooculogram (EOG) electrodes were placed at the outer canthus of each eye. Vertical EOG electrodes were located above and below the left eye. The impedance was kept below 5 kΩ. EEG signals were bandpass-filtered from 0.1 to 100 Hz with a 1,000 Hz sampling rate.
Recorded EEG data were preprocessed via CURRY 7 (Compumedics USA, Charlotte, NC, USA). EEG data were re-referenced to an average reference. A high pass filter with a cutoff frequency of 1 Hz was applied to the EEG data to remove DC components from the data. Movement artifacts were removed via visual inspection of an experienced researcher without prior information regarding the data origin. Eye-movement related artifacts were corrected using a covariance and regression based mathematical procedure implemented in the preprocessing software (37) of CURRY 7. After dividing pre-processed EEG data into 2 s (2,048 points) epochs, all the epochs including significant physiological artifacts (amplitude exceeding ± 75 μV) at any of the 62 electrodes were rejected. In order to exclude any epochs with drowsiness, we calculated the relative power of theta (4–8 Hz) and alpha (8–12 Hz) bands. Then, we rejected any epochs with ratios of the theta band power to the alpha band power exceeding 1, since these epochs were regarded as drowsiness or sleep stage 1 (38–40). Finally, a total of 30 artifact-free epochs were prepared for each participant. The number of 30 epochs was decided by the different number of remaining epochs for each participant after rejecting artifacts and drowsiness, and also because of the previous study reporting acceptable reliability with resting-state EEG data longer than 40 s (41). In addition, basic power spectra were analyzed to compare relative global band powers among the three groups (supplementary materials).
Source Localization
The depth-weighted minimum L2 norm estimator from the Brainstorm toolbox (http://neuroimage.usc.edu/brainstorm) was used to approximate time series of source activities (42). A three-layer boundary element model from the MNI/Colin 27 anatomy template was used to compute the leadfield matrix. Cortical current density values at 15,002 cortical vertices were evaluated at every time point for each epoch. Noise covariance was calculated by each participant’s whole 30 epochs. Diagonal components in noise covariance were only used to estimate the weight of each individual sensor in the source reconstruction. Following approximating the cortical current density at every time point, 148 nodes were extracted from the Destrieux atlas containing 74 cortical regions in each hemisphere (43). The representative value in each region was assessed by the cortical source of the seed point located in each region based on the Destrieux atlas, which information was provided in the Brainstorm toolbox. The time series of the cortical sources at each of the 148 seed points were bandpass-filtered and divided into six frequency bands including delta (1–4 Hz), theta (4–8 Hz), alpha (8–12 Hz), low beta (12–18 Hz), high beta (18–30 Hz), and gamma (30–55 Hz). The band-pass filtering was applied to each epoch. We employed some techniques to reduce spectral edge artifacts. First, a high pass filter with a cutoff frequency of 1 Hz was applied to the raw EEG data before epoching. Since the filtering process removed DC components of the data, the spectral edge artifacts were mainly mitigated. Second, we used a 3rd-order Butterworth IIR band-pass filter with zero-phase filtering. Low order filter minimized the length where distortion existed and the zero-phase filtering removed half of the distorted signals.
Connectivity and Network Analysis
Functional connectivity between each pair of nodes was quantified via phase-locking values (PLVs) (44). PLVs result in normalized synchronization values ranging from 0 to 1, and thus no further modification is required before applying them to the weighted network analysis. PLV has been known for the fine performance with weighted minimum norm estimation (45) and has been widely used in the network analysis (46–48).
In this study, we performed a graph theory based weighted network analysis (16, 17). The weighted network preserves unique traits of the original network without distortion. A network is composed of several nodes connecting to each other at their edges. In the present study, we selected representative network measures. Four different global-level weighted network indices were assessed. First, “strength” refers to the degree of connection strength in the network. It is estimated by summing the weights of links connected to brain regions. A greater strength value suggests that the whole brain is strongly connected. Second, “CC” indicates the degree to which a node clusters with its neighboring nodes. An increased CC indicates that a network is well segregated between the relevant brain regions. The CC was calculated for the whole network. Third, “PL” indicates the sum of lengths between two nodes within the network, which is related to the speed of information processing. The shortened PL indicates a well-integrated network. Fourth, “efficiency” represents the effectiveness of information processing in the brain; high efficiency indicates rapid information propagation in the network. Weighted nodal CC was also evaluated for each node.
Statistical Analysis
Chi-squared tests and one-way analysis of variance (ANOVA) were used to investigate differences in demographic characteristics and psychiatric, clinical, and cognitive measures among the three groups. A multivariate ANOVA (MANOVA) was performed to compare the cortical network characteristics at the global level in each frequency band among the three groups, with premorbid IQ as a covariate. Bonferroni corrections with an adjusted p-value of 0.05/24 = 0.002083 (four global network measures with six frequency bands) were used to control for multiple comparisons. The same analysis was performed at the nodal level, followed by Bonferroni corrections with an adjusted p-value of 0.05/148 = 0.000338 (nodal CCs of 148 nodes). Furthermore, the variables presenting significant differences among the three groups were analyzed using post hoc pair-wise comparisons with Bonferroni corrections. Effect sizes were calculated using partial eta squared (η2).
A partial Pearson’s correlation was performed between network indices and psychiatric, clinical, or cognitive measures, with a 5,000-bootstrap resampling technique to correct for multiple correlations in each group. The bootstrap test estimated sampling distribution of an estimator by resampling with replacement from the original sample. For the bootstrap validation, the simple random sampling method which was provided in SPSS package was used. The number of the retest was set to 5,000 and the confidence interval was set to 95%. The bootstrap test is a weaker method than the Bonferroni test to solve the multiple-comparison issue. However, the stability and robustness of the bootstrap test have been established by diverse previous studies (49, 50). Further, the bootstrap test has been widely carried out in EEG analysis (51, 52). For the patient groups, the potential effects of medication (equivalent doses of chlorpromazine and sodium valproate) (53) and duration of illness were considered as covariates. The significance level was set at p < 0.05 (two-tailed). Statistical analyses were conducted using SPSS 21 (SPSS, Inc., Chicago, IL, USA).
Results
Demographic and Psychiatric, Clinical, and Cognitive Characteristics
Table 1 shows the comparison of demographic and psychiatric, clinical, and cognitive characteristics among the patients with schizophrenia or bipolar disorder and the healthy controls. There were significant differences in premorbid IQ, K-AVLT-trial 5, K-AVLT-delayed recall, and SOFAS. Premorbid IQ showed significant difference among the three groups; healthy controls presented a significantly higher premorbid IQ than patients with schizophrenia or bipolar disorder (100.60 ± 10.64 vs. 98.68 ± 8.15 vs. 108.23 ± 9.13, p < 0.001). The score of the K-AVLT-trial 5 was significantly lower in patients with schizophrenia than in those with bipolar disorder and healthy controls (K-AVLT-trial 5: 8.37 ± 2.79 vs. 10.61 ± 2.97 vs. 11.57 ± 1.75, p < 0.001). The score of the K-AVLT-delayed recall was significantly higher in healthy controls than in patients with schizophrenia or bipolar disorder (K-AVLT-delayed recall: 6.11 ± 3.29 vs. 7.97 ± 3.59 vs. 9.96 ± 2.01, p < 0.001). Furthermore, The SOFAS score was significantly lower in patients with schizophrenia than in those with bipolar disorder (64.54 ± 12.50 vs. 72.35 ± 11.76, p = 0.009). The order of all scores for group comparison is schizophrenia, bipolar disorder, and healthy controls.
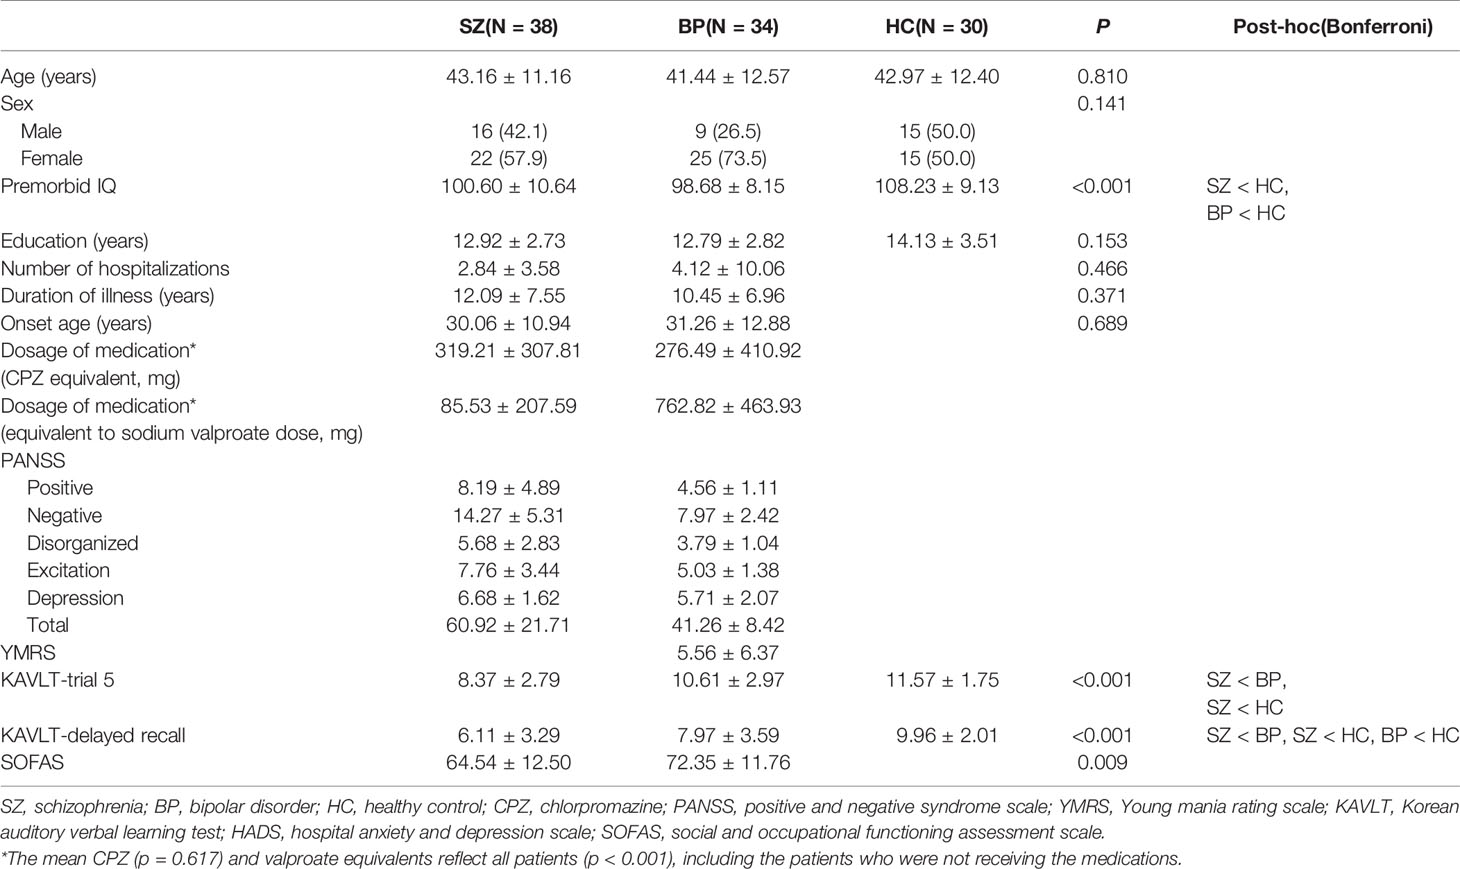
Table 1 Demographic characteristics of study participants.
Global-Level Differences in Cortical Functional Networks
Table 2 presents the comparison of global-level indices, including strength, CC, PL, and efficiency for each frequency band among the groups with schizophrenia and bipolar disorder and the healthy controls. There were significant differences in the four global-level indices of the theta band. The strength, CC, and efficiency of the theta band were significantly higher in the patients with schizophrenia or bipolar disorder compared to healthy controls (strength: 54.16 ± 2.73 vs. 53.31 ± 2.25 vs. 51.87 ± 2.07, p < 0.001; CC: 0.36 ± 0.02 vs. 0.35 ± 0.01 vs. 0.34 ± 0.01, p = 0.001; efficiency: 0.36 ± 0.02 vs. 0.36 ± 0.02 vs. 0.35 ± 0.01, p < 0.001). On the other hand, the PL of the theta band was significantly lower in patients with schizophrenia or bipolar disorder compared to healthy controls (3.00 ± 0.13 vs. 3.03 ± 0.11 vs. 3.10 ± 0.11, p = 0.001). There was no significant difference between the patient groups for the four network indices of the theta band. Furthermore, there was no significant difference among the three groups in other frequency bands. The order of all network values for group comparison is schizophrenia, bipolar disorder, and healthy controls. The violin plot figures were presented for the distribution of each network measure in the supplementary material (Supplementary Figure S1). In addition, the relative global band powers showed a significant difference among the three groups only in the theta band. The relative power of the theta band was significantly higher in the patients with schizophrenia compared to healthy controls (Supplementary Table S1).
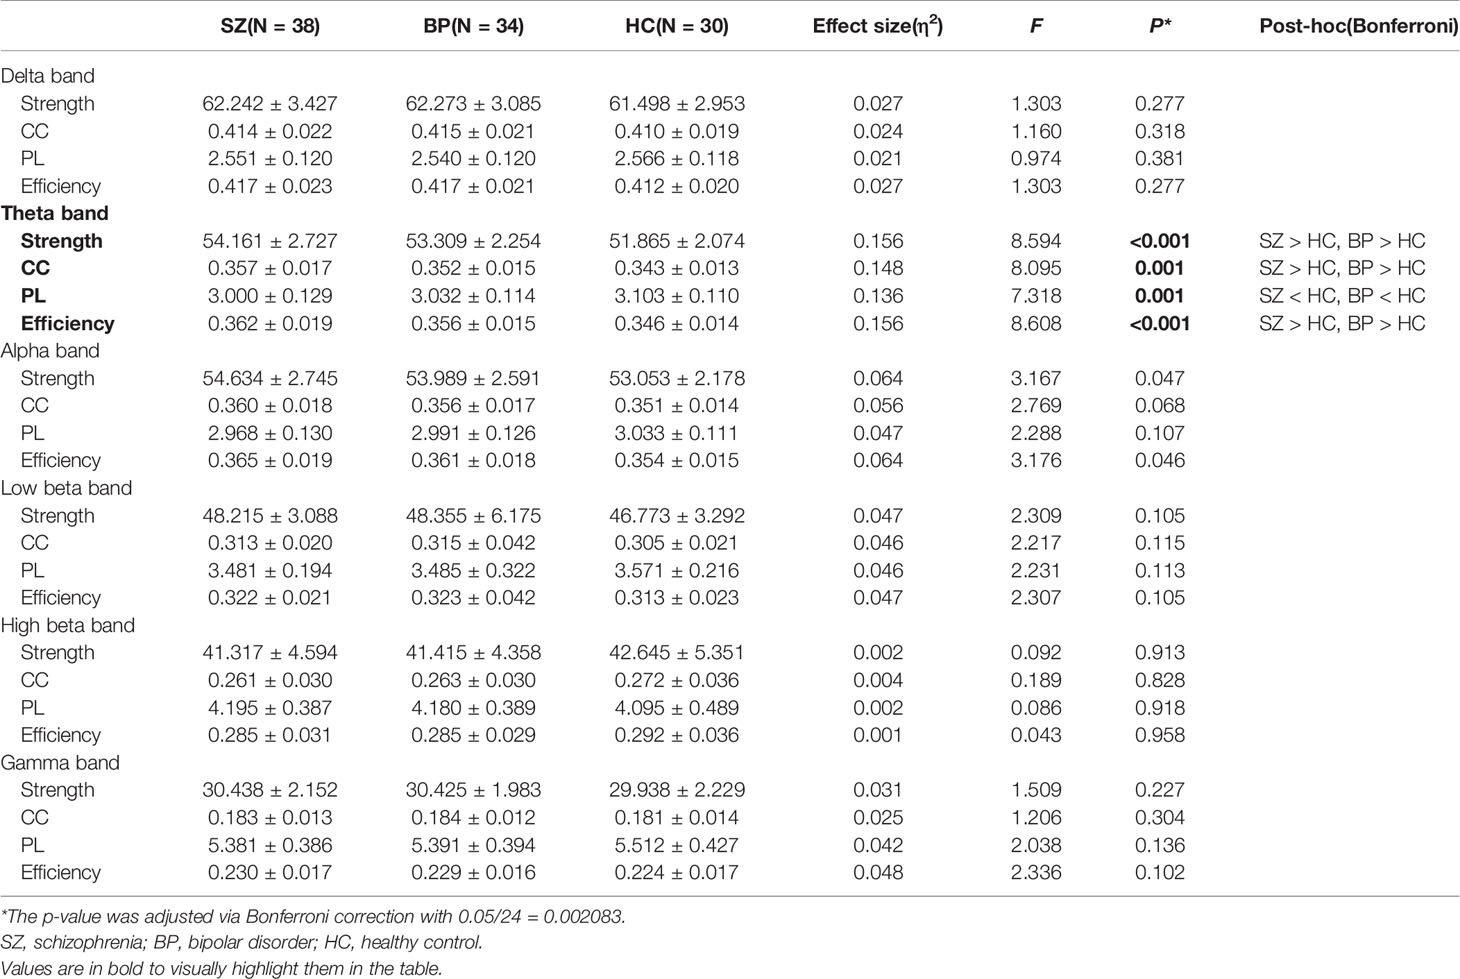
Table 2 Mean and standard deviation values of global network indices including strength, clustering coefficient (CC), path length (PL), and efficiency for each frequency band among the schizophrenia, bipolar disorder, and healthy control groups.
Nodal-Level Differences in Cortical Functional Networks
Based on the significant difference in the global theta-band CCs among the three groups, we determined to investigate possible differences at the local level in the theta band. The nodal CCs among the three groups were significantly different in 23 regions. Firstly, the nodal CCs of the schizophrenia and bipolar disorder groups were significantly higher compared to the healthy controls in eight regions (left anterior part of the cingulate gyrus and sulcus: 0.37 ± 0.02 vs. 0.36 ± 0.02 vs. 0.35 ± 0.02, p < 0.001; right anterior part of the cingulate gyrus and sulcus: 0.37 ± 0.02 vs. 0.36 ± 0.02 vs. 0.35 ± 0.02, p < 0.001; right frontomarginal gyrus and sulcus: 0.35 ± 0.02 vs. 0.34 ± 0.02 vs. 0.33 ± 0.01, p < 0.001; right middle frontal gyrus: 0.34 ± 0.02 vs. 0.33 ± 0.01 vs. 0.32 ± 0.01, p < 0.001; left superior frontal gyrus: 0.33 ± 0.02 vs. 0.33 ± 0.01 vs. 0.32 ± 0.01, p < 0.001; right superior frontal gyrus: 0.34 ± 0.02 vs. 0.34 ± 0.01 vs. 0.33 ± 0.01, p < 0.001; right middle occipital gyrus: 0.34 ± 0.01 vs. 0.34 ± 0.02 vs. 0.33 ± 0.01, p < 0.001; right superior frontal sulcus: 0.34 ± 0.02 vs. 0.33 ± 0.01 vs. 0.32 ± 0.01, p < 0.001).
Secondly, the nodal CCs of the schizophrenia group were significantly higher than those of the bipolar disorder group and the healthy controls in five regions (left opercular part of the inferior frontal gyrus: 0.35 ± 0.02 vs. 0.34 ± 0.01 vs. 0.33 ± 0.01, p < 0.001; left orbital part of the inferior frontal gyrus: 0.35 ± 0.02 vs. 0.34 ± 0.01 vs. 0.33 ± 0.01, p < 0.001; left triangular part of the inferior frontal gyrus: 0.35 ± 0.02 vs. 0.34 ± 0.01 vs. 0.33 ± 0.01, p < 0.001; left vertical ramus of the anterior segment of the lateral sulcus: 0.36 ± 0.02 vs. 0.34 ± 0.02 vs. 0.34 ± 0.01, p < 0.001; left inferior frontal sulcus: 0.35 ± 0.02 vs. 0.34 ± 0.02 vs. 0.33 ± 0.01, p < 0.001).
Thirdly, the nodal CCs of the schizophrenia group were significantly higher compared to the healthy controls in 10 regions (left short insular gyri: 0.37 ± 0.02 vs. 0.36 ± 0.02 vs. 0.35 ± 0.01, p < 0.001; left orbital gyri: 0.38 ± 0.02 vs. 0.37 ± 0.02 vs. 0.36 ± 0.02, p < 0.001; left polar plane of the superior temporal gyrus: 0.38 ± 0.02 vs. 0.36 ± 0.02 vs. 0.35 ± 0.02, p < 0.001; left horizontal ramus of the anterior segment of the lateral sulcus: 0.36 ± 0.02 vs. 0.35 ± 0.02 vs. 0.34 ± 0.01, p < 0.001; left temporal pole: 0.38 ± 0.02 vs. 0.37 ± 0.02 vs. 0.36 ± 0.02, p < 0.001; left anterior segment of the circular sulcus of the insula: 0.38 ± 0.02 vs. 0.37 ± 0.02 vs. 0.36 ± 0.02, p < 0.001; left superior segment of the circular sulcus of the insula: 0.38 ± 0.03 vs. 0.37 ± 0.02 vs. 0.36 ± 0.02, p < 0.001; left middle frontal sulcus: 0.35 ± 0.03 vs. 0.34 ± 0.02 vs. 0.33 ± 0.01, p < 0.001; left superior frontal sulcus: 0.35 ± 0.02 vs. 0.34 ± 0.01 vs. 0.33 ± 0.02, p < 0.001; left lateral orbital sulcus: 0.36 ± 0.02 vs. 0.35 ± 0.02 vs. 0.34 ± 0.01, p < 0.001) (Figure 1). The order of all nodal CC values for group comparison is schizophrenia, bipolar disorder, and healthy controls.
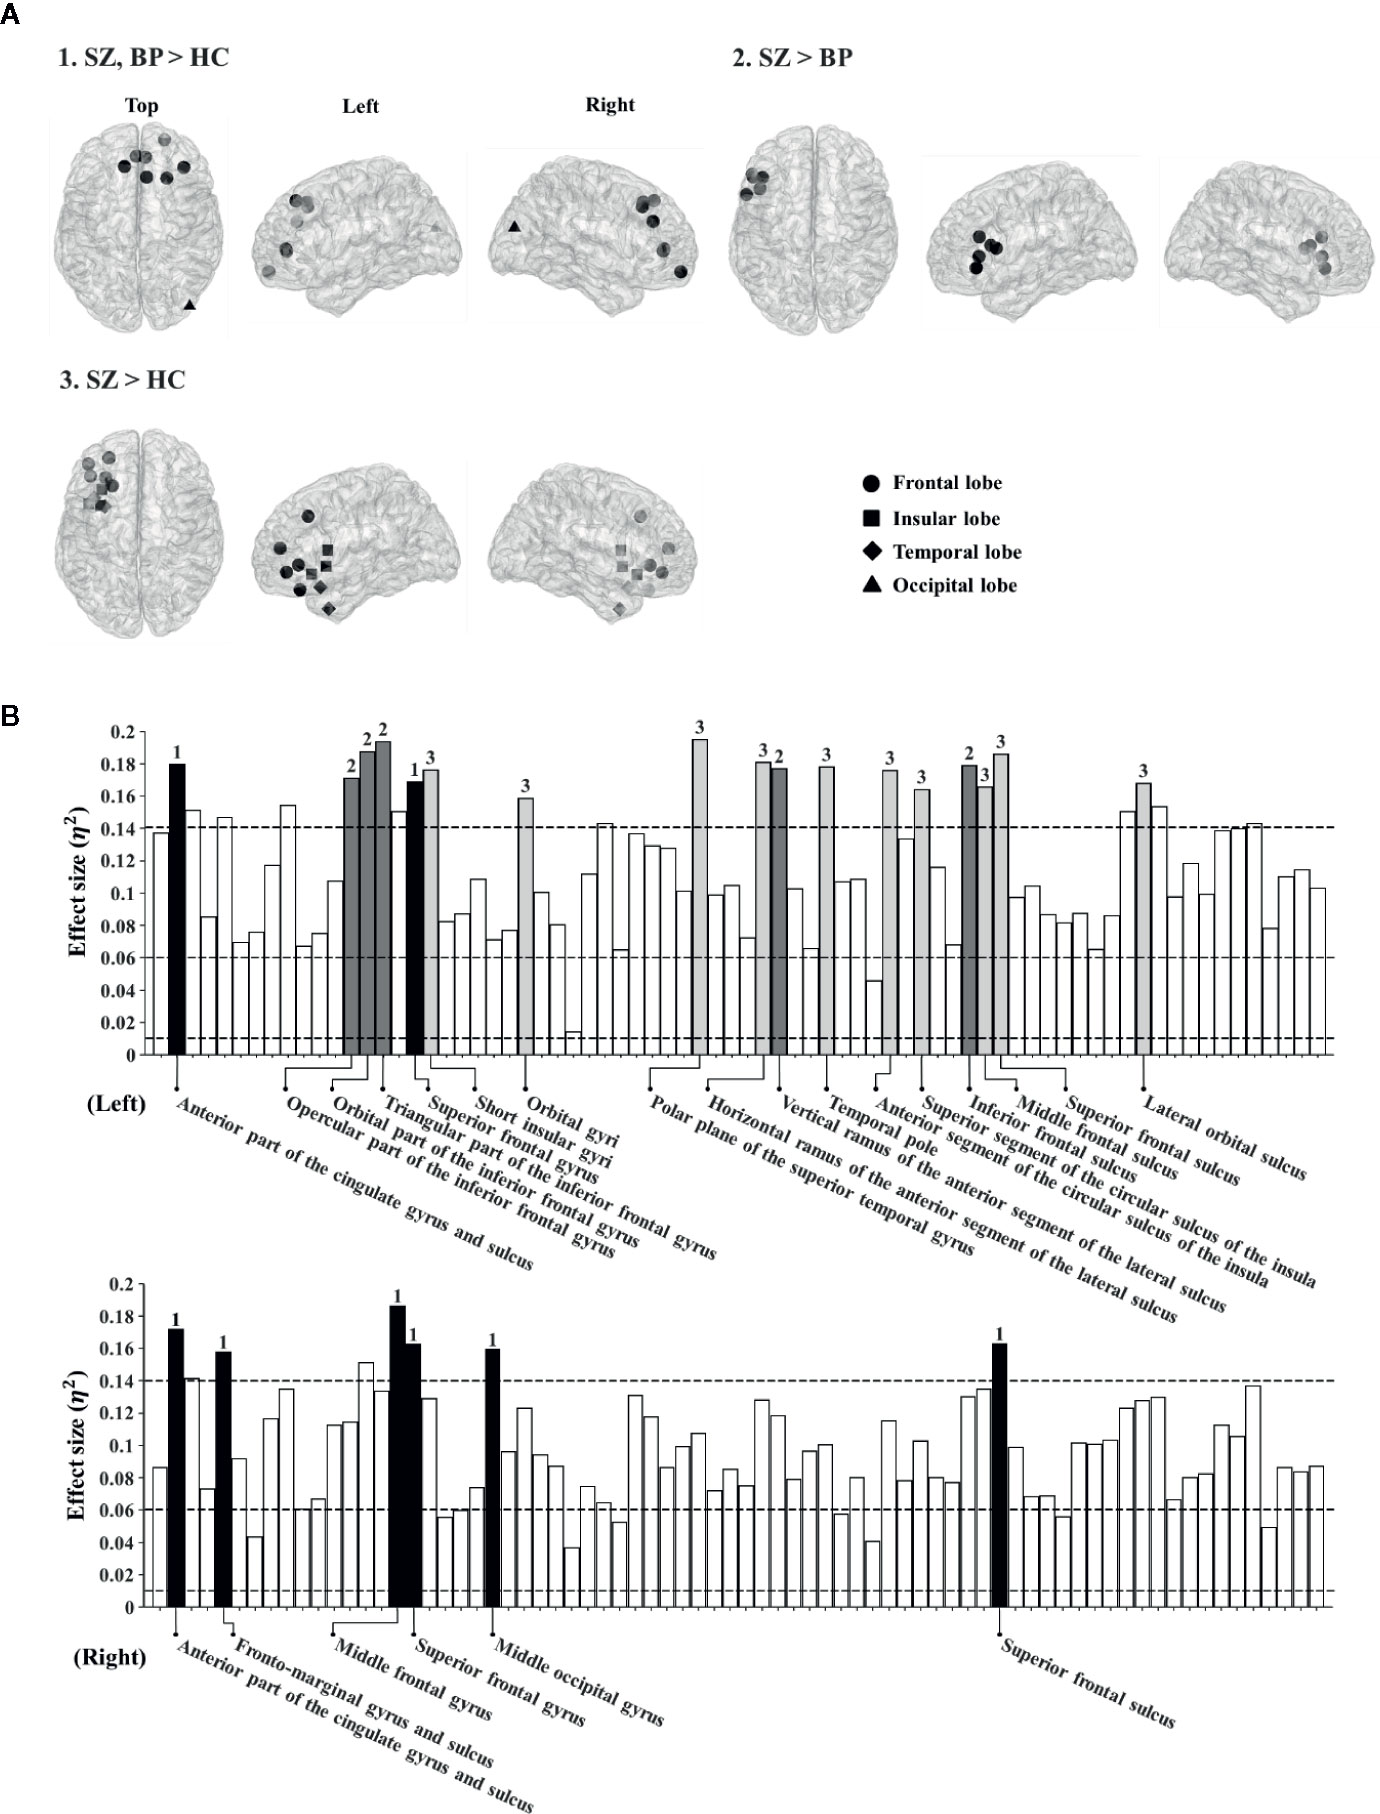
Figure 1 (A) Brain regions showing significantly different nodal clustering coefficients (CCs) of the theta frequency band among patient groups and healthy controls. (B) Effect sizes of differences in nodal CCs of the theta frequency band among patient groups and healthy controls. Each bar indicates the effect size at each node. The upper bars indicate 74 regions in the left hemisphere and the lower bars indicate 74 regions in the right hemisphere. For reference, three dotted lines are drawn for small (0.01), medium (0.06), and large (0.14) effect sizes. The bars with numbers reveal significant differences among patient groups and the healthy controls (The p-value was adjusted via Bonferroni correction with 0.05/148 = 0.000338). The number “1” denotes brain regions where patient groups show significant differences from healthy controls. The number “2” denotes brain regions where patients with schizophrenia show significant differences from those with bipolar disorder. The number “3” denotes brain regions where patients with schizophrenia show significant differences from healthy controls.
Correlation Between Network Indices and Psychiatric, Clinical, or Cognitive Characteristics
The correlations between the network indices of the global and nodal levels and psychiatric, clinical, or cognitive measures were investigated in the theta band. There were significant correlations between them in the three groups. In the schizophrenia group, the nodal CCs in the right superior frontal gyrus and sulcus significantly positively correlated with positive PANSS symptoms (r = 0.398, p = 0.033; r = 0.397, p = 0.033). In addition, there was a significant negative correlation between the nodal CC in the left superior frontal gyrus and SOFAS scores (r = -0.414, p = 0.026). The PL significantly positively correlated with the K-AVLT-delayed recall (r = 0.390, p = 0.033). Furthermore, the nodal CC in the right superior frontal sulcus significantly negatively correlated with the K-AVLT-delayed recall (r = -0.368, p = 0.045). In the bipolar disorder group, there was a significant negative correlation between the nodal CC in the right middle frontal gyrus and SOFAS scores (r = -0.505, p = 0.006). In the healthy controls, the nodal CCs in the left triangular part of the inferior frontal gyrus and the right middle occipital gyrus significantly positively correlated with the K-AVLT-trial 5 (r = 0.391, p = 0.040; r = 0.411, p = 0.030) (Figure 2).
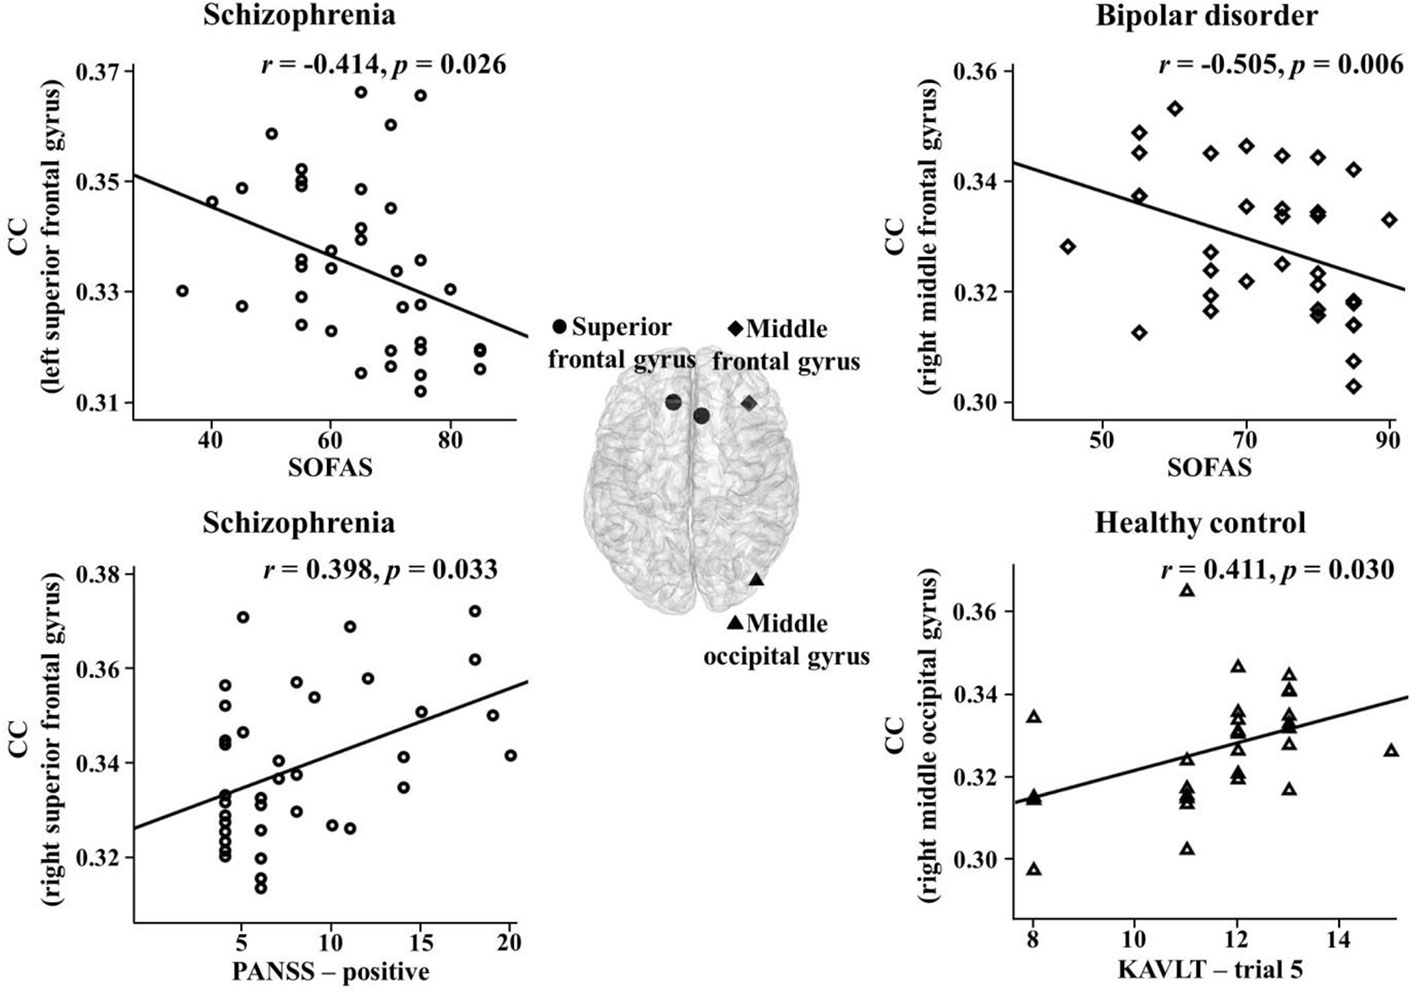
Figure 2 Correlations between nodal clustering coefficients (CCs) and psychiatric, clinical, or cognitive measures in the theta band for each group. SOFAS, social and occupational functioning assessment scale; PANSS, positive and negative syndrome scale; KAVLT, Korean auditory verbal learning test.
Furthermore, the relationships between the medication dosage of antipsychotics and mood stabilizers and EEG network indices or clinical-neurocognitive measures were investigated. In patients with schizophrenia, there were significant positive correlations between the dose of mood stabilizers and nodal CCs in left orbital gyri, left polar plane of the superior temporal gyrus, and left anterior segment of the circular sulcus of the insula (r = 0.327, p = 0.045; r = 0.328, p = 0.045; r = 0.321, p = 0.049). There were no significant correlations between the dose of antipsychotics and EEG parameters or symptoms. In patients with bipolar disorder, there were no significant correlations between medication doses and EEG parameters or symptoms.
Discussion
This study evaluated cortical functional networks during resting-state EEG in patients with schizophrenia or bipolar disorder compared to healthy controls. We only observed significant differences between these groups in the theta band. First, at the global level, strength, CC, and efficiency were significantly higher, while PL was lower, in both patient groups compared to healthy controls. Second, at the nodal level, the CCs, mostly in the frontal lobe, were significantly higher in both patient groups; in particular, patients with schizophrenia showed higher nodal CCs in the left inferior frontal cortex and the left ascending ramus of the lateral sulcus, compared to patients with bipolar disorder. Third, the nodal-level theta-band CC of the superior frontal gyrus and sulcus (cognition-related region) correlated with positive PANSS symptoms, SOFAS scores, and verbal memory in patients with schizophrenia, while that of the middle frontal gyrus (emotion-related region) correlated with SOFAS scores in patients with bipolar disorder.
Schizophrenia and bipolar disorder have been revealed to have abnormalities in the structural and functional connectivity at the network level. Previous EEG studies have reported altered resting-state networks in patients with schizophrenia and bipolar disorder. Rubinov et al. (18) showed lower CC and shorter PL in whole frequency bands in schizophrenia. Jalili and Knyazeva et al. (54) found broad decreased synchronizability in several frequency bands including theta, alpha, beta, and gamma bands. In addition, Kim et al. (26) showed decreased CC and efficiency whereas increased PL in the alpha band in bipolar disorder. Resting-state fMRI studies to examine brain network topology in schizophrenia showed global and nodal topological changes with decreased CC and increased efficiency (55) and reduced CC and reduced probability in high degree hubs (19). Furthermore, a resting-state fMRI study with bipolar disorder reported regional abnormalities in default mode and sensorimotor networks (56). In terms of structural networks, structural network studies using diffusion tensor imaging have reported increased PL or decreased efficiency in patients with schizophrenia (20, 57). In bipolar disorder, structural brain networks from diffusion tensor imaging exhibited lower CCs and efficiency and longer PL (58, 59). These previous findings support our results that the patients with schizophrenia and bipolar disorder showed abnormal topological organization of cortical functional networks.
Although previous EEG studies did not show a consensus of a specific frequency band abnormality, our study revealed the theta band abnormality in schizophrenia and bipolar disorder patients. Theta oscillations index learning, memory, and cognitive performance (60, 61). Altered theta-band activities have repeatedly been reported in patients with schizophrenia and bipolar disorder. Resting-state EEG studies consistently reported that patients with schizophrenia show augmented theta-band power (9, 11). A study investigating source functional connectivity during resting-state EEG reported that schizophrenia patients had greater functional connectivity than healthy controls in theta band. Particularly, the patients with longer duration of illness showed higher theta band connectivity in frontal regions compared to those with shorter duration (62). Also, according to the review of the bipolar disorder literature, increased theta power of resting-state EEG is one of the most robust findings in bipolar disorder (13). Thus, abnormal theta oscillation might have a key role in schizophrenia and bipolar disorder. Moreover, the higher strength, CC, and efficiency as well as lower PL of the theta band during resting state in this study seem to represent the poor functioning of the network, which might be associated with potentially excessive or inefficient neural processing in patients with schizophrenia and bipolar disorder (14, 63, 64).
The nodal CCs of the schizophrenia and bipolar disorder group were significantly higher in the anterior cingulate cortex, which connects limbic structures with the prefrontal cortex. The anterior cingulate cortex plays an important role in frontolimbic networks regulating cognitive and emotional functions (65) in patients with schizophrenia (66) and bipolar disorder (67). The volume reduction and cortical thinning of this region have been consistently discovered in schizophrenia (68, 69) and bipolar disorder (67, 70). Structural brain abnormalities in the frontal lobe appear commonly in schizophrenia and bipolar disorder, indicating a biological feature shared by both patient groups (69, 71).
Interestingly, the nodal CCs were significantly higher in left inferior frontal cortex and the left ascending ramus of the lateral sulcus in patients with schizophrenia compared to those with bipolar disorder and healthy controls. The left inferior frontal gyrus plays a significant role in executive functions, such as cognitive inhibition (72) and semantic and language function (73). Volumetric reduction and cortical thinning of this region have been reported in schizophrenia (73, 74). The lateral sulcus is involved in language function (75). Patients with schizophrenia showed reduced lateral sulcus length asymmetry, indicating that schizophrenia is a neurodevelopmental disorder causing impaired cerebral lateralization (76–78). According to the preexisting notion, our findings might imply that executive and language functions are vulnerable in patients with schizophrenia compared to those with bipolar disorder and healthy controls.
Additionally, the nodal CCs of the schizophrenia group were significantly higher in the left insular cortex and the left middle frontal sulcus, compared to healthy controls. The insular cortex belongs to the limbic region that plays an important role in integrating perceptual experiences and affect to generate balanced behavior (79). There is robust evidence of functional and structural abnormalities of this region in schizophrenia (80–83). In addition, abnormalities in cortical gyrification of the left middle frontal sulcus have been reported in chronic patients with schizophrenia with auditory hallucinations (84).
In the schizophrenia group, the nodal CCs of the right superior frontal gyrus and sulcus were positively correlated with positive PANSS symptoms. The nodal CC of the left superior frontal gyrus was negatively correlated with social and occupational functioning. The PL was positively correlated with delayed verbal memory. In addition, the nodal CC in the right superior frontal sulcus was negatively correlated with delayed verbal memory. The superior frontal gyrus has been known to be involved in various processes relying on cognitive control, such as set-switching (85), working memory (86), and complex problem solving (87). A greater deactivation in the bilateral superior frontal gyrus has been associated with positive symptom severity in patients with schizophrenia (88). In addition, other studies that investigated the correlation between the superior frontal region and PANSS score in patients with schizophrenia showed significant correlations between only the PANSS positive score and the superior frontal region of gray matter volume or fractional anisotropy (89–91). These findings support our results indicating that the right superior frontal region is more related with PANSS positive score in patients with schizophrenia. The cortical thickness of the superior frontal gyrus is significantly decreased in patients with schizophrenia compared to healthy controls (92, 93), and decreased cortical thickness in this region has been shown to be related to functioning impairments (93). Furthermore, it is well known that verbal memory is the most impaired field of cognitive function in schizophrenia (94, 95).
In patients with bipolar disorder, the nodal CC of the right middle frontal gyrus was negatively correlated with social and occupational functioning. The middle frontal cortex has been suggested to be particularly implicated in the down-regulation of the emotional response (96, 97). The dorsolateral prefrontal cortex, which lies in the middle frontal gyrus, has been shown to be associated with the motivation factor and interest in social functioning (98). Furthermore, this region is one component of the neural network playing a key role in psychosocial functioning in bipolar disorder (99). Although the correlation between nodal CC of the right middle frontal gyrus and social and occupational functioning was observed in patients with bipolar disorder, the correlation between network measures of the right middle frontal gyrus and YMRS was not shown. This could be explained by the following reasons. Social functioning including social cognition demands cognitive and emotional capacity (100). Previous studies have shown that activities involving the right middle frontal cortex were correlated with emotion (101, 102). In addition, the relationship between YMRS and emotion has been only observed in manic patients, but not in euthymic and depressed phase patients (101, 103, 104). Since the bipolar disorder patients which participated in this study were almost all in euthymic phase, it was possible that the YMRS score was not correlated with emotion. These issues could be the reasons why patients showed only correlations with social and occupational functioning.
In healthy controls, the nodal CCs in the left inferior frontal gyrus and right middle occipital gyrus were positively correlated with immediate verbal memory. Previous studies indicate that increased theta-band oscillations of healthy controls are a remarkable EEG indicator of good cognitive functions such as attention and memory (105). In addition, high theta power has been associated with better cognitive functioning, including immediate and delayed verbal recall in healthy adults (106). Notably, the inferior frontal gyrus is associated with speech production and verbal working memory (107). One study reported that the activation in the middle occipital gyrus was associated with auditory verbal memory (108).
Taken together, our study reveals that the nodal CCs of the superior frontal gyrus and sulcus (relatively cognition-related region) correlate with positive PANSS symptoms, SOFAS scores, and verbal memory in patients with schizophrenia, while those of the middle frontal gyrus (relatively emotion-related region) correlate with SOFAS scores in patients with bipolar disorder. The impairment of brain function in these regions would affect impaired cortical functional networks. In addition, brain dysfunction could lead to abnormal changes in clinical and cognitive measures. The nodal CCs might be predictable biomarkers of psychiatric symptoms.
This study has the following limitations. First, most of the patients were chronic and were taking atypical antipsychotics and mood-stabilizing agents. Second, we did not use individual head models for EEG source imaging and source analysis of scalp-derived EEG might be inherently limited in its precision of spatial localization. Third, the PLVs did not exclude zero-degree phase lags, which could be caused by volume conduction. Even though we estimated connectivity from source time series, volume conduction might still be present. Despite these limitations, this study was the first attempt to compare the source-level cortical functional networks in schizophrenia and bipolar disorder using resting-state EEG. Our results demonstrate altered cortical networks at both global and nodal levels of the theta band in patients with schizophrenia or bipolar disorder. In addition, we found significant correlations between cortical network states and symptom severity scores. These source-level cortical network indices could be promising biomarkers to evaluate patients with schizophrenia and bipolar disorder.
Data Availability Statement
The datasets generated for this study are available on request to the corresponding author.
Ethics Statement
The studies involving human participants were reviewed and approved by the Institutional Review Board of Inje University Ilsan Paik Hospital (2015-07-23). The patients/participants provided their written informed consent to participate in this study.
Author Contributions
SK analyzed the data and wrote the paper. Y-WK collected the data and wrote the paper. MS and MJJ collected and analyzed the data. S-HL designed the study and wrote the paper. S-HL and C-HI reviewed and revised the paper. All authors contributed to the article and approved the submitted version.
Funding
This work was supported by a grant from the Korea Science and Engineering Foundation (KOSEF), funded by the Korean government (NRF-2018R1A2A2A05018505).
Conflict of Interest
The authors declare that the research was conducted in the absence of any commercial or financial relationships that could be construed as a potential conflict of interest.
Supplementary Material
The Supplementary Material for this article can be found online at: https://www.frontiersin.org/articles/10.3389/fpsyt.2020.00661/full#supplementary-material
References
1. Goodwin FK, Jamison KR. Manic-depressive illness: bipolar disorders and recurrent depression. New York, USA: Oxford University Press (2007).
2. Calhoun VD, Sui J, Kiehl K, Turner JA, Allen EA, Pearlson G. Exploring the psychosis functional connectome: aberrant intrinsic networks in schizophrenia and bipolar disorder. Front Psychiatry (2012) 2:75. doi: 10.3389/fpsyt.2011.00075
3. Fulford KW, Davies M, Gipps R, Graham G, Sadler J, Stanghellini G, et al. The Oxford handbook of philosophy and psychiatry. Oxford, United Kingdom: OUP Oxford (2013).
4. Bora E, Pantelis C. Social cognition in schizophrenia in comparison to bipolar disorder: a meta-analysis. Schizophr Res (2016) 175(1-3):72–8. doi: 10.1016/j.schres.2016.04.018
5. Grande I, Berk M, Birmaher B, Vieta E. Bipolar disorder. Lancet (2016) 387(10027):1561–72. doi: 10.1016/S0140-6736(15)00241-X
6. Luck SJ, Mathalon DH, O’Donnell BF, Hämäläinen MS, Spencer KM, Javitt DC, et al. A roadmap for the development and validation of event-related potential biomarkers in schizophrenia research. Biol Psychiatry (2011) 70(1):28–34. doi: 10.1016/j.biopsych.2010.09.021
7. Liu C-H, Li F, Li S-F, Wang Y-J, Tie C-L, Wu H-Y, et al. Abnormal baseline brain activity in bipolar depression: a resting state functional magnetic resonance imaging study. Psychiatry Res: Neuroimaging (2012) 203(2-3):175–9. doi: 10.1016/j.pscychresns.2012.02.007
8. Hughes JR, John ER. Conventional and quantitative electroencephalography in psychiatry. J Neuropsychiatr Clin Neurosci (1999) 11(2):190–208. doi: 10.1176/jnp.11.2.190
9. Sponheim SR, Clementz BA, Iacono WG, Beiser M. Clinical and biological concomitants of resting state EEG power abnormalities in schizophrenia. Biol Psychiatry (2000) 48(11):1088–97. doi: 10.1016/S0006-3223(00)00907-0
10. Rosazza C, Minati L. Resting-state brain networks: literature review and clinical applications. Neurol Sci (2011) 32(5):773–85. doi: 10.1007/s10072-011-0636-y
11. Clementz BA, Sponheim SR, Iacono WG, Beiser M. Resting EEG in first-episode schizophrenia patients, bipolar psychosis patients, and their first-degree relatives. Psychophysiology (1994) 31(5):486–94. doi: 10.1111/j.1469-8986.1994.tb01052.x
12. Boutros NN, Arfken C, Galderisi S, Warrick J, Pratt G, Iacono W. The status of spectral EEG abnormality as a diagnostic test for schizophrenia. Schizophr Res (2008) 99(1-3):225–37. doi: 10.1016/j.schres.2007.11.020
13. Degabriele R, Lagopoulos J. A review of EEG and ERP studies in bipolar disorder. Acta Neuropsychiatr (2009) 21(2):58–66. doi: 10.1111/j.1601-5215.2009.00359.x
14. Kam JW, Bolbecker AR, O’Donnell BF, Hetrick WP, Brenner CA. Resting state EEG power and coherence abnormalities in bipolar disorder and schizophrenia. J Psychiatr Res (2013) 47(12):1893–901. doi: 10.1016/j.jpsychires.2013.09.009
15. Stam CJ, Reijneveld JC. Graph theoretical analysis of complex networks in the brain. Nonlinear Biomed Phys (2007) 1(1):3. doi: 10.1186/1753-4631-1-3
16. Bullmore E, Sporns O. Complex brain networks: graph theoretical analysis of structural and functional systems. Nat Rev Neurosci (2009) 10(3):186. doi: 10.1038/nrn2575
17. Rubinov M, Sporns O. Complex network measures of brain connectivity: uses and interpretations. Neuroimage (2010) 52(3):1059–69. doi: 10.1016/j.neuroimage.2009.10.003
18. Rubinov M, Knock SA, Stam CJ, Micheloyannis S, Harris AW, Williams LM, et al. Small-world properties of nonlinear brain activity in schizophrenia. Hum Brain Mapp (2009) 30(2):403–16. doi: 10.1002/hbm.20517
19. Lynall M-E, Bassett DS, Kerwin R, McKenna PJ, Kitzbichler M, Muller U, et al. Functional connectivity and brain networks in schizophrenia. J Neurosci (2010) 30(28):9477–87. doi: 10.1523/JNEUROSCI.0333-10.2010
20. van den Heuvel MP, Mandl RC, Stam CJ, Kahn RS, Pol HEH. Aberrant frontal and temporal complex network structure in schizophrenia: a graph theoretical analysis. J Neurosci (2010) 30(47):15915–26. doi: 10.1523/JNEUROSCI.2874-10.2010
21. Hinkley LB, Vinogradov S, Guggisberg AG, Fisher M, Findlay AM, Nagarajan SS. Clinical symptoms and alpha band resting-state functional connectivity imaging in patients with schizophrenia: implications for novel approaches to treatment. Biol Psychiatry (2011) 70(12):1134–42. doi: 10.1016/j.biopsych.2011.06.029
22. Alexander-Bloch A, Lambiotte R, Roberts B, Giedd J, Gogtay N, Bullmore E. The discovery of population differences in network community structure: new methods and applications to brain functional networks in schizophrenia. Neuroimage (2012) 59(4):3889–900. doi: 10.1016/j.neuroimage.2011.11.035
23. Ramyead A, Kometer M, Studerus E, Koranyi S, Ittig S, Gschwandtner U, et al. Aberrant current source-density and lagged phase synchronization of neural oscillations as markers for emerging psychosis. Schizophr Bull (2015) 41(4):919–29. doi: 10.1093/schbul/sbu134
24. Chepenik LG, Raffo M, Hampson M, Lacadie C, Wang F, Jones MM, et al. Functional connectivity between ventral prefrontal cortex and amygdala at low frequency in the resting state in bipolar disorder. Psychiatry Res: Neuroimaging (2010) 182(3):207–10. doi: 10.1016/j.pscychresns.2010.04.002
25. Dickstein DP, Gorrostieta C, Ombao H, Goldberg LD, Brazel AC, Gable CJ, et al. Fronto-temporal spontaneous resting state functional connectivity in pediatric bipolar disorder. Biol Psychiatry (2010) 68(9):839–46. doi: 10.1016/j.biopsych.2010.06.029
26. Kim D-J, Bolbecker AR, Howell J, Rass O, Sporns O, Hetrick WP, et al. Disturbed resting state EEG synchronization in bipolar disorder: a graph-theoretic analysis. NeuroImage: Clin (2013) 2:414–23. doi: 10.1016/j.nicl.2013.03.007
27. Nolte G, Bai O, Wheaton L, Mari Z, Vorbach S, Hallett M. Identifying true brain interaction from EEG data using the imaginary part of coherency. Clin Neurophysiol (2004) 115(10):2292–307. doi: 10.1016/j.clinph.2004.04.029
28. Lemm S, Curio G, Hlushchuk Y, Muller K-R. Enhancing the signal-to-noise ratio of ICA-based extracted ERPs. IEEE Trans Biomed Eng (2006) 53(4):601–7. doi: 10.1109/TBME.2006.870258
29. First MB, Gibbon M, Spitzer RL, Williams JB. User’s guide for the structured clinical interview for DSM-IV axis I Disorders—Research version. New York: Biometrics Research Department, New York State Psychiatric Institute (1996).
30. First MB, Gibbon M, Spitzer RL, Benjamin LS. User’s guide for the structured clinical interview for DSM-IV axis II personality disorders: SCID-II. Washington, DC, USA: American Psychiatric Pub (1997).
31. Kay SR, Fiszbein A, Opfer LA. The positive and negative syndrome scale (PANSS) for schizophrenia. Schizophr Bull (1987) 13(2):261. doi: 10.1093/schbul/13.2.261
32. Young R, Biggs J, Ziegler V, Meyer D. A rating scale for mania: reliability, validity and sensitivity. Br J Psychiatry (1978) 133(5):429–35. doi: 10.1192/bjp.133.5.429
34. Goldman HH, Skodol AE, Lave TR. Revising axis V for DSM-IV: a review of measures of social functioning. Am J Psychiatry (1992) 149(9):1148–56. doi: 10.1176/ajp.149.9.1148
35. Lee JY, Cho MJ, Kwon JS. Global assessment of functioning scale and social and occupational functioning scale. Kor J Psychopharmacol (2006) 17(2):122–7.
36. Kim S-G, Lee E-H, Hwang S-T, Park K, Chey J, Hong S-H, et al. Estimation of K-WAIS-IV Premorbid Intelligence in South Korea: development of the KPIE-IV. Clin Neuropsychol (2015) 29(sup1):19–29. doi: 10.1080/13854046.2015.1072248
37. Semlitsch HV, Anderer P, Schuster P, Presslich O. A solution for reliable and valid reduction of ocular artifacts, applied to the P300 ERP. Psychophysiology (1986) 23(6):695–703. doi: 10.1111/j.1469-8986.1986.tb00696.x
38. Strijkstra AM, Beersma DG, Drayer B, Halbesma N, Daan S. Subjective sleepiness correlates negatively with global alpha (8–12 Hz) and positively with central frontal theta (4–8 Hz) frequencies in the human resting awake electroencephalogram. Neurosci Lett (2003) 340(1):17–20. doi: 10.1016/S0304-3940(03)00033-8
39. Eoh HJ, Chung MK, Kim S-H. Electroencephalographic study of drowsiness in simulated driving with sleep deprivation. Int J Ind Ergonom (2005) 35(4):307–20. doi: 10.1016/j.ergon.2004.09.006
40. Jap BT, Lal S, Fischer P, Bekiaris E. Using EEG spectral components to assess algorithms for detecting fatigue. Expert Syst Appl (2009) 36(2):2352–9. doi: 10.1016/j.eswa.2007.12.043
41. Gudmundsson S, Runarsson TP, Sigurdsson S, Eiriksdottir G, Johnsen K. Reliability of quantitative EEG features. Clin Neurophysiol (2007) 118(10):2162–71. doi: 10.1016/j.clinph.2007.06.018
42. Tadel F, Baillet S, Mosher JC, Pantazis D, Leahy RM. Brainstorm: a user-friendly application for MEG/EEG analysis. Comput Intell Neurosci (2011) 2011:8. doi: 10.1155/2011/879716
43. Destrieux C, Fischl B, Dale A, Halgren E. Automatic parcellation of human cortical gyri and sulci using standard anatomical nomenclature. Neuroimage (2010) 53(1):1–15. doi: 10.1016/j.neuroimage.2010.06.010
44. Lachaux J-P, Rodriguez E, Martinerie J, Varela FJ. Measuring phase synchrony in brain signals. Hum Brain Mapp (1999) 8(4):194–208. doi: 10.1002/(SICI)1097-0193(1999)8:4<194::AID-HBM4>3.0.CO;2-C
45. Hassan M, Dufor O, Merlet I, Berrou C, Wendling F. EEG source connectivity analysis: from dense array recordings to brain networks. PloS One (2014) 9(8). doi: 10.1371/journal.pone.0105041
46. Shim M, Im C-H, Kim Y-W, Lee S-H. Altered cortical functional network in major depressive disorder: A resting-state electroencephalogram study. NeuroImage: Clin (2018) 19:1000–7. doi: 10.1016/j.nicl.2018.06.012
47. Gong A, Liu J, Lua L, Wu G, Jiang C, Fu Y. Characteristic differences between the brain networks of high-level shooting athletes and non-athletes calculated using the phase-locking value algorithm. Biomed Signal Process Control (2019) 51:128–37. doi: 10.1016/j.bspc.2019.02.009
48. Li P, Liu H, Si Y, Li C, Li F, Zhu X, et al. EEG based emotion recognition by combining functional connectivity network and local activations. IEEE Trans Biomed Eng (2019) 66(10):2869–81. doi: 10.1109/TBME.2019.2897651
49. Ruscio J. Constructing confidence intervals for Spearman’s rank correlation with ordinal data: a simulation study comparing analytic and bootstrap methods. J Mod Appl Stat Methods (2008) 7(2):7. doi: 10.22237/jmasm/1225512360
50. Pernet CR, Wilcox RR, Rousselet GA. Robust correlation analyses: false positive and power validation using a new open source Matlab toolbox. Front Psychol (2013) 3:606. doi: 10.3389/fpsyg.2012.00606
51. Pernet CR, Chauveau N, Gaspar C, Rousselet GA. LIMO EEG: a toolbox for hierarchical LInear MOdeling of ElectroEncephaloGraphic data. Comput Intell Neurosci (2011) 2011:3. doi: 10.1155/2011/831409
52. Kim JS, Kim S, Jung W, Im C-H, Lee S-H. Auditory evoked potential could reflect emotional sensitivity and impulsivity. Sci Rep (2016) 6:37683. doi: 10.1038/srep37683
53. Procyshyn RM, Bezchlibnyk-Butler KZ, Jeffries JJ. Clinical handbook of psychotropic drugs. Boston, MA, USA: Hogrefe Publishing (2017).
54. Jalili M, Knyazeva MG. EEG-based functional networks in schizophrenia. Comput Biol Med (2011) 41(12):1178–86. doi: 10.1016/j.compbiomed.2011.05.004
55. Lo C-YZ, Su T-W, Huang C-C, Hung C-C, Chen W-L, Lan T-H, et al. Randomization and resilience of brain functional networks as systems-level endophenotypes of schizophrenia. Proc Natl Acad Sci (2015) 112(29):9123–8. doi: 10.1073/pnas.1502052112
56. Doucet GE, Bassett DS, Yao N, Glahn DC, Frangou S. The role of intrinsic brain functional connectivity in vulnerability and resilience to bipolar disorder. Am J Psychiatry (2017) 174(12):1214–22. doi: 10.1176/appi.ajp.2017.17010095
57. Wang Q, Su T-P, Zhou Y, Chou K-H, Chen I-Y, Jiang T, et al. Anatomical insights into disrupted small-world networks in schizophrenia. Neuroimage (2012) 59(2):1085–93. doi: 10.1016/j.neuroimage.2011.09.035
58. Leow A, Ajilore O, Zhan L, Arienzo D, GadElkarim J, Zhang A, et al. Impaired inter-hemispheric integration in bipolar disorder revealed with brain network analyses. Biol Psychiatry (2013) 73(2):183–93. doi: 10.1016/j.biopsych.2012.09.014
59. Collin G, van den Heuvel MP, Abramovic L, Vreeker A, de Reus MA, van Haren NE, et al. Brain network analysis reveals affected connectome structure in bipolar I disorder. Hum Brain Mapp (2016) 37(1):122–34. doi: 10.1002/hbm.23017
60. Klimesch W. EEG alpha and theta oscillations reflect cognitive and memory performance: a review and analysis. Brain Res Rev (1999) 29(2-3):169–95. doi: 10.1016/S0165-0173(98)00056-3
61. Nokia MS, Sisti HM, Choksi MR, Shors TJ. Learning to learn: theta oscillations predict new learning, which enhances related learning and neurogenesis. PloS One (2012) 7(2):e31375. doi: 10.1371/journal.pone.0031375
62. Di Lorenzo G, Daverio A, Ferrentino F, Santarnecchi E, Ciabattini F, Monaco L, et al. Altered resting-state EEG source functional connectivity in schizophrenia: the effect of illness duration. Front Hum Neurosci (2015) 9:234. doi: 10.3389/fnhum.2015.00234
63. Karch S, Leicht G, Giegling I, Lutz J, Kunz J, Buselmeier M, et al. Inefficient neural activity in patients with schizophrenia and nonpsychotic relatives of schizophrenic patients: evidence from a working memory task. J Psychiatr Res (2009) 43(15):1185–94. doi: 10.1016/j.jpsychires.2009.04.004
64. Caseras X, Murphy K, Lawrence NS, Fuentes-Claramonte P, Watts J, Jones DK, et al. Emotion regulation deficits in euthymic bipolar I versus bipolar II disorder: a functional and diffusion-tensor imaging study. Bipolar Disord (2015) 17(5):461–70. doi: 10.1111/bdi.12292
65. Paus T. Primate anterior cingulate cortex: where motor control, drive and cognition interface. Nat Rev Neurosci (2001) 2(6):417. doi: 10.1038/35077500
66. Fornito A, Yücel M, Dean B, Wood SJ, Pantelis C. Anatomical abnormalities of the anterior cingulate cortex in schizophrenia: bridging the gap between neuroimaging and neuropathology. Schizophr Bull (2008) 35(5):973–93. doi: 10.1093/schbul/sbn025
67. Lyoo IK, Sung YH, Dager SR, Friedman SD, Lee JY, Kim SJ, et al. Regional cerebral cortical thinning in bipolar disorder. Bipolar Disord (2006) 8(1):65–74. doi: 10.1111/j.1399-5618.2006.00284.x
68. Ellison-Wright I, Glahn DC, Laird AR, Thelen SM, Bullmore E. The anatomy of first-episode and chronic schizophrenia: an anatomical likelihood estimation meta-analysis. Am J Psychiatry (2008) 165(8):1015–23. doi: 10.1176/appi.ajp.2008.07101562
69. Rimol LM, Hartberg CB, Nesvåg R, Fennema-Notestine C, Hagler DJ, Pung CJ, et al. Cortical thickness and subcortical volumes in schizophrenia and bipolar disorder. Biol Psychiatry (2010) 68(1):41–50. doi: 10.1016/j.biopsych.2010.03.036
70. Sassi RB, Nicoletti M, Brambilla P, Mallinger AG, Frank E, Kupfer DJ, et al. Increased gray matter volume in lithium-treated bipolar disorder patients. Neurosci Lett (2002) 329(2):243–5. doi: 10.1016/S0304-3940(02)00615-8
71. Knöchel C, Reuter J, Reinke B, Stäblein M, Marbach K, Feddern R, et al. Cortical thinning in bipolar disorder and schizophrenia. Schizophr Res (2016) 172(1):78–85. doi: 10.1016/j.schres.2016.02.007
72. Swick D, Ashley V, Turken U. Left inferior frontal gyrus is critical for response inhibition. BMC Neurosci (2008) 9(1):102. doi: 10.1186/1471-2202-9-102
73. Kuperberg GR, Broome MR, McGuire PK, David AS, Eddy M, Ozawa F, et al. Regionally localized thinning of the cerebral cortex in schizophrenia. Arch Gen Psychiatry (2003) 60(9):878–88. doi: 10.1001/archpsyc.60.9.878
74. Venkatasubramanian G, Jayakumar P, Gangadhar B, Keshavan M. Automated MRI parcellation study of regional volume and thickness of prefrontal cortex (PFC) in antipsychotic-naïve schizophrenia. Acta Psychiatr Scand (2008) 117(6):420–31. doi: 10.1111/j.1600-0447.2008.01198.x
75. Leonard CM, Eckert MA, Lombardino LJ, Oakland T, Kranzler J, Mohr CM, et al. Anatomical risk factors for phonological dyslexia. Cereb Cortex (2001) 11(2):148–57. doi: 10.1093/cercor/11.2.148
76. Crow T, Brown R, Burton C, Frith C, Gray V. Loss of Sylvian fissure asymmetry in schizophrenia: findings in the Runwell 2 series of brains. Schizophr Res (1992) 6(2):152–3. doi: 10.1016/0920-9964(92)90230-3
77. Falkai P, Bogerts B, Greve B, Pfeiffer U, Machus B, Fölsch-Reetz B, et al. Loss of sylvian fissure asymmetry in schizophrenia: a quantitative post mortem study. Schizophr Res (1992) 7(1):23–32. doi: 10.1016/0920-9964(92)90070-L
78. Hoff AL, Riordan H, O’donnell D, Stritzke P, Neale C, Boccio A, et al. Anomalous lateral sulcus asymmetry and cognitive function in first-episode schizophrenia. Schizophr Bull (1992) 18(2):257–72. doi: 10.1093/schbul/18.2.257
79. Augustine JR. Circuitry and functional aspects of the insular lobe in primates including humans. Brain Res Rev (1996) 22(3):229–44. doi: 10.1016/S0165-0173(96)00011-2
80. Kubicki M, Shenton ME, Salisbury D, Hirayasu Y, Kasai K, Kikinis R, et al. Voxel-based morphometric analysis of gray matter in first episode schizophrenia. Neuroimage (2002) 17(4):1711–9. doi: 10.1006/nimg.2002.1296
81. Desco M, Gispert JD, Reig S, Sanz J, Pascau J, Sarramea F, et al. Cerebral metabolic patterns in chronic and recent-onset schizophrenia. Psychiatry Res: Neuroimaging (2003) 122(2):125–35. doi: 10.1016/S0925-4927(02)00124-5
82. Duggal HS, Muddasani S, Keshavan MS. Insular volumes in first-episode schizophrenia: gender effect. Schizophr Res (2005) 73(1):113–20. doi: 10.1016/j.schres.2004.08.027
83. Okugawa G, Tamagaki C, Agartz I. Frontal and temporal volume size of grey and white matter in patients with schizophrenia. Eur Arch Psychiatry Clin Neurosci (2007) 257(5):304–7. doi: 10.1007/s00406-007-0721-7
84. Cachia A, Paillère-Martinot M-L, Galinowski A, Januel D, de Beaurepaire R, Bellivier F, et al. Cortical folding abnormalities in schizophrenia patients with resistant auditory hallucinations. Neuroimage (2008) 39(3):927–35. doi: 10.1016/j.neuroimage.2007.08.049
85. Koechlin E, Basso G, Pietrini P, Panzer S, Grafman J. The role of the anterior prefrontal cortex in human cognition. Nature (1999) 399(6732):148. doi: 10.1038/20178
86. Braver TS, Bongiolatti SR. The role of frontopolar cortex in subgoal processing during working memory. Neuroimage (2002) 15(3):523–36. doi: 10.1006/nimg.2001.1019
87. Burgess PW, Veitch E, de Lacy Costello A, Shallice T. The cognitive and neuroanatomical correlates of multitasking. Neuropsychologia (2000) 38(6):848–63. doi: 10.1016/S0028-3932(99)00134-7
88. Garrity AG, Pearlson GD, McKiernan K, Lloyd D, Kiehl KA, Calhoun VD. Aberrant “default mode” functional connectivity in schizophrenia. Am J Psychiatry (2007) 164(3):450–7. doi: 10.1176/ajp.2007.164.3.450
89. Rotarska-Jagiela A, Oertel-Knoechel V, DeMartino F, van de Ven V, Formisano E, Roebroeck A, et al. Anatomical brain connectivity and positive symptoms of schizophrenia: a diffusion tensor imaging study. Psychiatry Res: Neuroimaging (2009) 174(1):9–16. doi: 10.1016/j.pscychresns.2009.03.002
90. Antonius D, Prudent V, Rebani Y, D’Angelo D, Ardekani BA, Malaspina D, et al. White matter integrity and lack of insight in schizophrenia and schizoaffective disorder. Schizophr Res (2011) 128(1-3):76–82. doi: 10.1016/j.schres.2011.02.020
91. Padmanabhan JL, Tandon N, Haller CS, Mathew IT, Eack SM, Clementz BA, et al. Correlations between brain structure and symptom dimensions of psychosis in schizophrenia, schizoaffective, and psychotic bipolar I disorders. Schizophr Bull (2014) 41(1):154–62. doi: 10.1093/schbul/sbu075
92. Schultz CC, Koch K, Wagner G, Roebel M, Schachtzabel C, Gaser C, et al. Reduced cortical thickness in first episode schizophrenia. Schizophr Res (2010) 116(2-3):204–9. doi: 10.1016/j.schres.2009.11.001
93. Tully LM, Lincoln SH, Liyanage-Don N, Hooker CI. Impaired cognitive control mediates the relationship between cortical thickness of the superior frontal gyrus and role functioning in schizophrenia. Schizophr Res (2014) 152(2-3):358–64. doi: 10.1016/j.schres.2013.12.005
94. Aleman A, Hijman R, de Haan EH, Kahn RS. Memory impairment in schizophrenia: a meta-analysis. Am J Psychiatry (1999) 156(9):1358–66.
95. Cirillo MA, Seidman LJ. Verbal declarative memory dysfunction in schizophrenia: from clinical assessment to genetics and brain mechanisms. Neuropsychol Rev (2003) 13(2):43–77. doi: 10.1023/A:1023870821631
96. Vuilleumier P, Armony JL, Driver J, Dolan RJ. Effects of attention and emotion on face processing in the human brain: an event-related fMRI study. Neuron (2001) 30(3):829–41. doi: 10.1016/S0896-6273(01)00328-2
97. Bishop S, Duncan J, Brett M, Lawrence AD. Prefrontal cortical function and anxiety: controlling attention to threat-related stimuli. Nat Neurosci (2004) 7(2):184. doi: 10.1038/nn1173
98. Pu S, Nakagome K, Yamada T, Yokoyama K, Matsumura H, Terachi S, et al. Relationship between prefrontal function during a cognitive task and social functioning in male Japanese workers: a multi-channel near-infrared spectroscopy study. Psychiatry Res: Neuroimaging (2013) 214(1):73–9. doi: 10.1016/j.pscychresns.2013.05.011
99. Yoshimura Y, Okamoto Y, Onoda K, Okada G, Toki S, Yoshino A, et al. Psychosocial functioning is correlated with activation in the anterior cingulate cortex and left lateral prefrontal cortex during a verbal fluency task in euthymic bipolar disorder: a preliminary fMRI study. Psychiatry Clin Neurosci (2014) 68(3):188–96. doi: 10.1111/pcn.12115
100. Kim E, Jung Y-C, Ku J, Kim J-J, Lee H, Kim SY, et al. Reduced activation in the mirror neuron system during a virtual social cognition task in euthymic bipolar disorder. Prog Neuropsychopharmacol Biol Psychiatry (2009) 33(8):1409–16. doi: 10.1016/j.pnpbp.2009.07.019
101. Elliott R, Ogilvie A, Rubinsztein JS, Calderon G, Dolan RJ, Sahakian BJ. Abnormal ventral frontal response during performance of an affective go/no go task in patients with mania. Biol Psychiatry (2004) 55(12):1163–70. doi: 10.1016/j.biopsych.2004.03.007
102. Gao W, Jiao Q, Lu S, Zhong Y, Qi R, Lu D, et al. Alterations of regional homogeneity in pediatric bipolar depression: a resting-state fMRI study. BMC Psychiatry (2014) 14(1):222. doi: 10.1186/s12888-014-0222-y
103. Vaskinn A, Sundet K, Friis S, Simonsen C, Birkenaes A, Engh J, et al. The effect of gender on emotion perception in schizophrenia and bipolar disorder. Acta Psychiatr Scand (2007) 116(4):263–70. doi: 10.1111/j.1600-0447.2007.00991.x
104. Palagini L, Cipollone G, Masci I, Caruso D, Paolilli F, Perugi G, et al. Insomnia symptoms predict emotional dysregulation, impulsivity and suicidality in depressive bipolar II patients with mixed features. Compr Psychiatry (2019) 89:46–51. doi: 10.1016/j.comppsych.2018.12.009
105. Mitchell DJ, McNaughton N, Flanagan D, Kirk IJ. Frontal-midline theta from the perspective of hippocampal “theta”. Prog Neurobiol (2008) 86(3):156–85. doi: 10.1016/j.pneurobio.2008.09.005
106. Finnigan S, Robertson IH. Resting EEG theta power correlates with cognitive performance in healthy older adults. Psychophysiology (2011) 48(8):1083–7. doi: 10.1111/j.1469-8986.2010.01173.x
107. Paulesu E, Frith CD, Frackowiak RS. The neural correlates of the verbal component of working memory. Nature (1993) 362(6418):342. doi: 10.1038/362342a0
Keywords: ipolar disorder, cortical functional network, graph theory, resting-state EEG, schizophrenia
Citation: Kim S, Kim Y-W, Shim M, Jin MJ, Im C-H and Lee S-H (2020) Altered Cortical Functional Networks in Patients With Schizophrenia and Bipolar Disorder: A Resting-State Electroencephalographic Study. Front. Psychiatry 11:661. doi: 10.3389/fpsyt.2020.00661
Received: 19 February 2020; Accepted: 25 June 2020;
Published: 17 July 2020.
Edited by:
Gregory Light, University of California, San Diego, United StatesReviewed by:
Gaelle Eve Doucet, Boys Town National Research Hospital, United StatesKevin M. Spencer, Harvard Medical School, United States
Alexander Nakhnikian, Harvard Medical School, United States, in collaboration with reviewer KS
Copyright © 2020 Kim, Kim, Shim, Jin, Im and Lee. This is an open-access article distributed under the terms of the Creative Commons Attribution License (CC BY). The use, distribution or reproduction in other forums is permitted, provided the original author(s) and the copyright owner(s) are credited and that the original publication in this journal is cited, in accordance with accepted academic practice. No use, distribution or reproduction is permitted which does not comply with these terms.
*Correspondence: Seung-Hwan Lee, bHNocHNzQHBhaWsuYWMua3I=; bHNocHNzQGhhbm1haWwubmV0