 Marián Kolenič1,2
 Filip Španiel1
 Jaroslav Hlinka1,3Martin Matějka1,2
 Pavel Knytl1,2
 Antonín Šebela1
 Jiří Renka1,2
 Tomas Hajek1,4*
- 1Department of Applied Neuroscience and Neuroimaging, National Institute of Mental Health, Klecany, Czechia
- 23rd Faculty of Medicine, Charles University, Prague, Czechia
- 3Department of Complex Systems, Institute of Computer Science of the Czech Academy of Sciences, Prague, Czechia
- 4Department of Psychiatry, Dalhousie University, Halifax, NS, Canada
Background: Neurostructural alterations are often reported in first episode of psychosis (FEP), but there is heterogeneity in the direction and location of findings between individual studies. The reasons for this heterogeneity remain unknown. Obesity is disproportionately frequent already early in the course of psychosis and is associated with smaller brain volumes. Thus, we hypothesized that obesity may contribute to brain changes in FEP.
Method: We analyzed MRI scans from 120 participants with FEP and 114 healthy participants. In primary analyses, we performed voxel-based morphometry (VBM) with small volume corrections to regions associated with FEP or obesity in previous meta-analyses. In secondary analyses, we performed whole-brain VBM analyses.
Results: In primary analyses, we found that when controlling for BMI, FEP had lower GM volume than healthy participants in a) left fronto-temporal region (pTFCE = 0.008) and b) left postcentral gyrus (pTFCE = 0.043). When controlling for FEP, BMI was associated with lower GM volume in left cerebellum (pTFCE < 0.001). In secondary analyses, we found that when controlling for BMI, FEP had lower GM volume than healthy participants in the a) cerebellum (pTFCE = 0.004), b) left frontal (pTFCE = 0.024), and c) right temporal cortex (pTFCE = 0.031). When controlling for FEP, BMI was associated with lower GM volume in cerebellum (pTFCE = 0.004). Levels of C-reactive protein, HDL and LDL-cholesterol correlated with obesity related neurostructural alterations.
Conclusions: This study suggests that higher BMI, which is frequent in FEP, may contribute to cerebellar alterations in schizophrenia. As previous studies showed that obesity-related brain alterations may be reversible, our findings raise the possibility that improving the screening for and treatment of obesity and associated metabolic changes could preserve brain structure in FEP.
Introduction
Neurostructural alterations are frequently reported already early in the course of schizophrenia (SZ) and may contribute to worse psychiatric outcomes (1, 2). Participants in their first episode of psychosis (FEP) typically show smaller gray matter (GM) volumes in frontal, temporal, and insular lobes, although there is heterogeneity in the direction and location of findings between individual studies (3–5). The reasons for this heterogeneity and the origins of neurostructural alterations in FEP remain unknown. They may represent neurodevelopmental antecedents but may also reflect the presence or absence of certain clinical factors (6, 7). Better understanding of the clinical factors which contribute to brain alterations in FEP is important for interpretation of findings. It is also the first step toward prevention or treatment of neurobiological changes, which may contribute to functional impairment in FEP (1, 2). One potential source of neuroimaging abnormalities in FEP could be the comorbidity with medical conditions known to affect the brain. One such condition is obesity.
Almost 1 in 2 participants with SZ are obese or overweight (40%–60%), which is significantly more than in the general population (8, 9). Overweight or obesity are disproportionately frequent already in the earliest stages of illness (10–12) and affect about 20% of participants with FEP (13). There is a highly replicated evidence showing that obesity is negatively associated with brain structure in non-psychiatric, otherwise healthy participants and already in adolescence (14, 15). The most pronounced effects of obesity are observed in frontal, mesiotemporal/limbic regions and cerebellum, brain areas which are also implicated in SZ (5, 16–21). Yet, we know little about the effect of obesity on brain structure in SZ. There is a single previous study, which documented additive effects of psychosis and overweight/obesity on a composite index of brain structure (BrainAGE) in participants with FEP (22). However, no studies have investigated the localization of obesity related neurostructural alterations in SZ and whether these directly overlap with regions associated with psychosis.
To address this knowledge gap, we studied the effects of both, obesity and psychosis on regional brain volumes in a large sample of individuals with FEP and healthy subjects. Our a priori hypotheses were that BMI will be negatively associated with brain structure, when controlling for FEP and individuals with FEP will have lower regional brain volumes relative to controls, when controlling for BMI. We also hypothesized that both BMI and FEP will be additively associated with brain structure in some regions of interest. In exploratory analyses, we further explored the links between clinical or obesity related biochemical alterations and the brain changes associated with FEP or BMI.
Methods
Sample Description
We analyzed a sample of 120 participants with FEP and 114 healthy participants (see Table 1). These analyses are a part of the Early Stages of SZ study (22, 23). To ensure generalizability, we recruited participants during their first hospitalization in a large general psychiatry hospital (1,200 beds), which serves the Prague and part of Central Bohemia regions—catchment area of over 1.5 million subjects. We focused on individuals with FEP, who met the following inclusion criteria: 1) were undergoing their first psychiatric hospitalization, 2) had the ICD-10 diagnosis of SZ (F20), or acute and transient psychotic disorders (F23) made by psychiatrist according to Mini-International Neuropsychiatric Interview (24), 3) had <24 months of untreated psychosis, and 4) were 18–35 years old. Participants with psychotic mood disorders were excluded from the study. As the diagnosis of SZ requires a minimal duration of symptoms, the retrospective diagnostic stability of SZ is low (0.6) (25). A significant number of individuals who are later diagnosed with SZ receive a different initial diagnosis. We wanted to recruit participants at the early stages of illness, to minimize the effects of illness and medications on brain structure. Thus, participants who were hospitalized before meeting the duration criteria for SZ are a particularly interesting group. These participants were included in the study and received the working diagnosis of acute and transient psychotic disorders, which is congruent with DSMIV brief psychotic disorder. This approach is in keeping with other studies of FEP (13, 25). Healthy participants, 18–35 years old, were recruited via advertisement, using the following exclusion criteria: 1) lifetime history of any psychiatric disorders, and 2) psychotic disorders in first or second-degree relatives. Additional exclusion criteria for both groups included history of neurological or cerebrovascular disorders and any MRI contraindications.
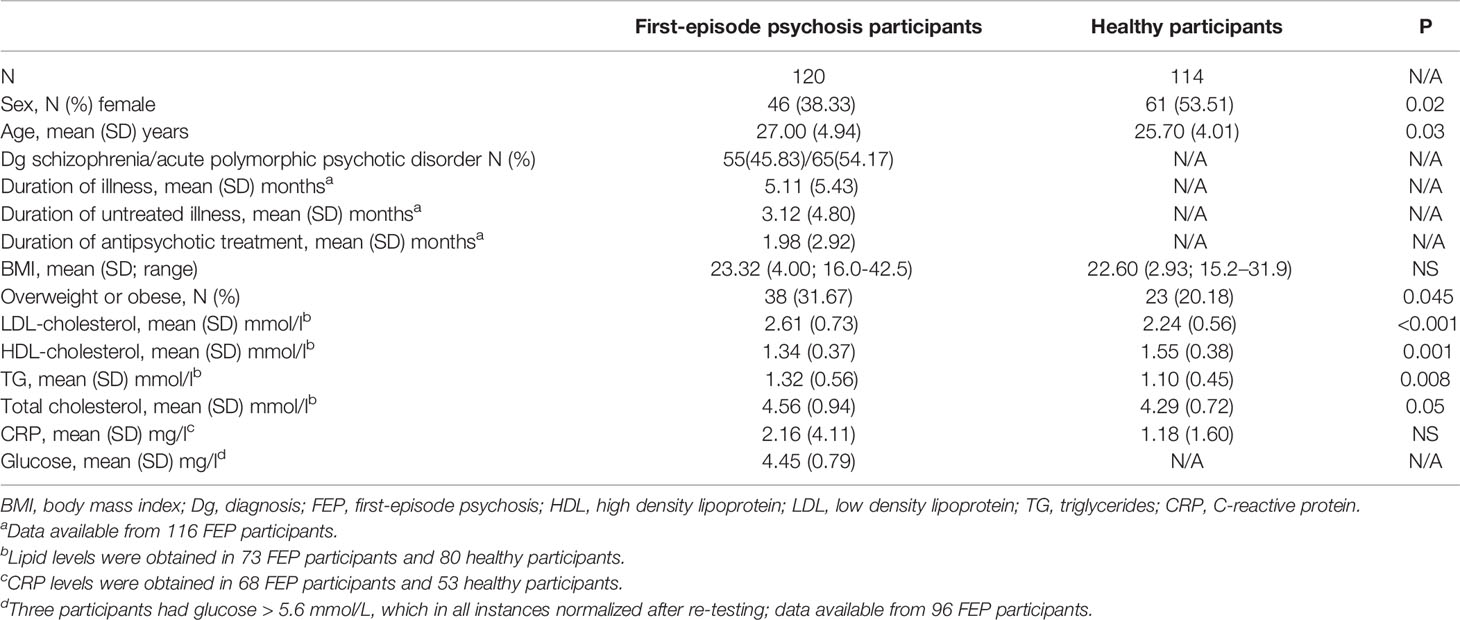
Table 1 Sample description.
Within 1 week from scanning, we collected information about, weight, height, blood pressure, duration of untreated/treated psychiatric illness, current medications, and personal history of hypertension by direct assessment verified by chart review. On the day of scanning, we obtained symptom ratings (The Positive and Negative Syndrome Scale—PANSS) and where available (in 73 FEP participants and 80 healthy participants), also fasting blood samples for biochemical analyses (total cholesterol, HDL-cholesterol, LDL-cholesterol and triglycerides). In participants who were medication naive prior to hospitalization (N = 40) we calculated cumulative medication exposure until MRI, based on their prospective inpatient charts. Additionally, for exploratory analyses, we were able to obtain blood levels of C-reactive protein in 68 FEP and 53 healthy participants. To exclude diabetes in FEP, we collected personal history verified by review of medical records (where available complemented by fasting glucose blood levels form the hospitalization records, 96 FEP participants). Biochemical analyses were performed in a single clinical laboratory using Siemens ADVIA 1800 Clinical Chemistry systems and standard clinical methods. We measured body mass index (BMI) using the formula: BMI = weight (kg)/height (meters)2. All diagnostic assessments and symptom ratings were performed by board certified psychiatrist using the Mini-International Neuropsychiatric Interview (24) and the PANSS (26).
The study was carried out in accordance with the latest version of the Declaration of Helsinki. The study design was reviewed and approved by the Research Ethics Board. Each participant received a complete description of the study and provided written informed consent.
MRI Methods
All data were acquired on the same scanner using the same imaging sequences.
Specifically, we acquired T1-weighted 3D MPRAGE scans (TR = 2,300 ms, TE = 4.63 ms, FOV = 256 × 256 mm, bandwidth 130 Hz/pixel, matrix 256 × 256, voxel size 1×1×1mm3) on 3T Siemens Trio MRI scanner equipped with standard head coil.
Voxel-Based Morphometry
We conducted FSL-VBM (27), http://fsl.fmrib.ox.ac.uk/fsl/fslwiki/FSLVBM), optimized VBM protocol (28) carried out with FSL tools (29). First, structural images were brain-extracted and gray matter-segmented before being registered to the MNI 152 standard space using non-linear registration (30). The resulting images (GM volume probability maps) were averaged and flipped along the x-axis to create a left-right symmetric, study-specific GM template. Second, all native GM images were non-linearly registered to this study-specific template and “modulated” to correct for local expansion (or contraction) due to the non-linear component of the spatial transformation. The modulated GM images were then smoothed with an isotropic Gaussian kernel with a sigma of 3 mm. Finally, voxel-wise general linear model (GLM) was used to compute associations between local GM volume as dependent variables, status - FEP versus healthy participants and BMI as predictors and age and sex as covariates of no interest; see Statistical Analyses for details). Permutation-based non-parametric testing, correcting for multiple comparisons across space, was applied. The threshold for primary analyses was set to p < 0.05 using threshold-free cluster enhancement (TFCE) and 5,000 permutations, as the cluster-based thresholding was developed to be more sensitive to finding true signal than voxelwise thresholding (31).
Statistical Analyses
We used two approaches (primary and secondary analyses) to 1) test a priori hypotheses using small volume correction, but also to 2) perform exploratory, whole brain analyses in order to investigate associations between FEP or BMI and brain regions not included in the primary analyses. We consider these approaches complementary. Using only the small volume correction, we could miss signal in additional regions. Using only the whole brain analyses would enforce a purely exploratory approach when in fact there is enough evidence formulate a priori hypotheses. Our analytical plan included the following steps.
Primary VBM Analyses
These analyses were carried out on a combined sample of FEP (N = 120) and healthy participants (N = 114). In order to maximize the sensitivity to our studied conditions, we performed VBM analysis with small volume corrections to regions which have been previously associated with FEP or obesity. To do this, we created a mask, which combined the results of a spatial meta-analysis of voxel based morphometry studies, which investigated: 1) association between FEP and GM volumes (5), and 2) association between BMI and GM volumes (18), see Figure 2S. Using GLM, we assessed the associations between diagnostic status (FEP versus healthy participants) and BMI as explanatory variables and regional GM volumes as the dependent variable, while controlling for age and sex as covariates of no interest. We also tested for status × BMI interaction and included it in the model only if significant. We used BMI as continuous variable, as this is preferable for statistical reasons and to increase sensitivity. In addition, this was the preferred approach in most previous studies (18). As BMI is also used clinically to define categories with increased risk of adverse outcomes, based on validated cut-offs (32) we also repeated the analyses with BMI as a categorical variable. In these analyses we compared normal weight (BMI < 25) against overweight or obese participants (BMI >= 25). As our sample of FEP participants differed in age and sex compared to healthy participants, we also selected a subset of participants forming an age/sex-balanced dataset of 106 FEP and 107 healthy participants. We then performed sensitivity VBM analyses using the same approach as described above in this subsample.
Secondary Whole Brain VBM Analyses
These analyses were also carried out on a combined sample of FEP (N = 120) and healthy participants (N = 114). We conducted secondary whole brain VBM analysis and investigated the association between diagnostic status (FEP/healthy participants), BMI as explanatory variables, and local GM volumes, with sex and age as covariates of no interest. We tested for status × BMI interaction and included it in the model only if significant.
Additional Analyses
We explored the effects of clinical, treatment-related or metabolic variables on our VBM results among the FEP participants. Specifically, we tested for associations between average GM values from the voxels within the regions associated with FEP or BMI from the primary analyses and a) Duration of untreated psychosis; b) Duration of illness; c) PANSS positive subscale score; d) PANSS negative subscale score; e) PANSS global subscale score; f) Medication naive status before admission; g) Duration of antipsychotic treatment; h) chlorpromazine equivalent antipsychotic dose at MRI; i) cumulative medication exposure until MRI; j) Alcohol abuse history; k) THC history; l) Drug abuse diagnosis; m) Smoking at the time of MRI; n) HDL; o) LDL; p) TG; r) CRP; s) Glucose; t) Systolic blood pressure; u) Diastolic blood pressure; v) Age; and w) Sex. We used individual GM modulated, smoothed images (GM probability maps), and calculated average GM values from the significant clusters. For simple, robust and conservative exploration, we subsequently used Spearman’s correlation coefficient and Mann-Whitney U test to explore the association between average GM values and continuous or categorical variables respectively. We reported nominal p-values for these hypotheses generating/exploratory analyses.
Results
We analyzed a sample of 120 participants with FEP and 114 healthy individuals (see Table 1 for description of the sample).
Primary VBM Analyses
When focusing on regions previously associated with FEP or obesity, we found lower GM volume in FEP versus healthy participants, while controlling for BMI, in a) cluster including left IFG-STG-temporal pole-insula-operculum (Cohen’s d = 0.55; tmax = 4.19; pTFCE = 0.008; 395 voxels), b) left postcentral gyrus (Cohen’s d = 0.43; tmax= 3.34; pTFCE = 0.043; 13 voxels). We also found a negative association between BMI and GM volume, when controlling for FEP, in the left cerebellum (Cohen’s d = 0.74; tmax = 5.30; pTFCE < 0.001, 144 voxels); see Figure 1. We did not find interaction between diagnostic status (FEP vs. healthy participants) and BMI. The results remained essentially unchanged, when using BMI as categorical predictor (normal weight vs. overweight/obese; see Supplementary Material). Sensitivity analyses on the age/sex-balanced dataset (N = 213) showed similar results as our primary analyses (see Supplementary Material and Figure 1S).
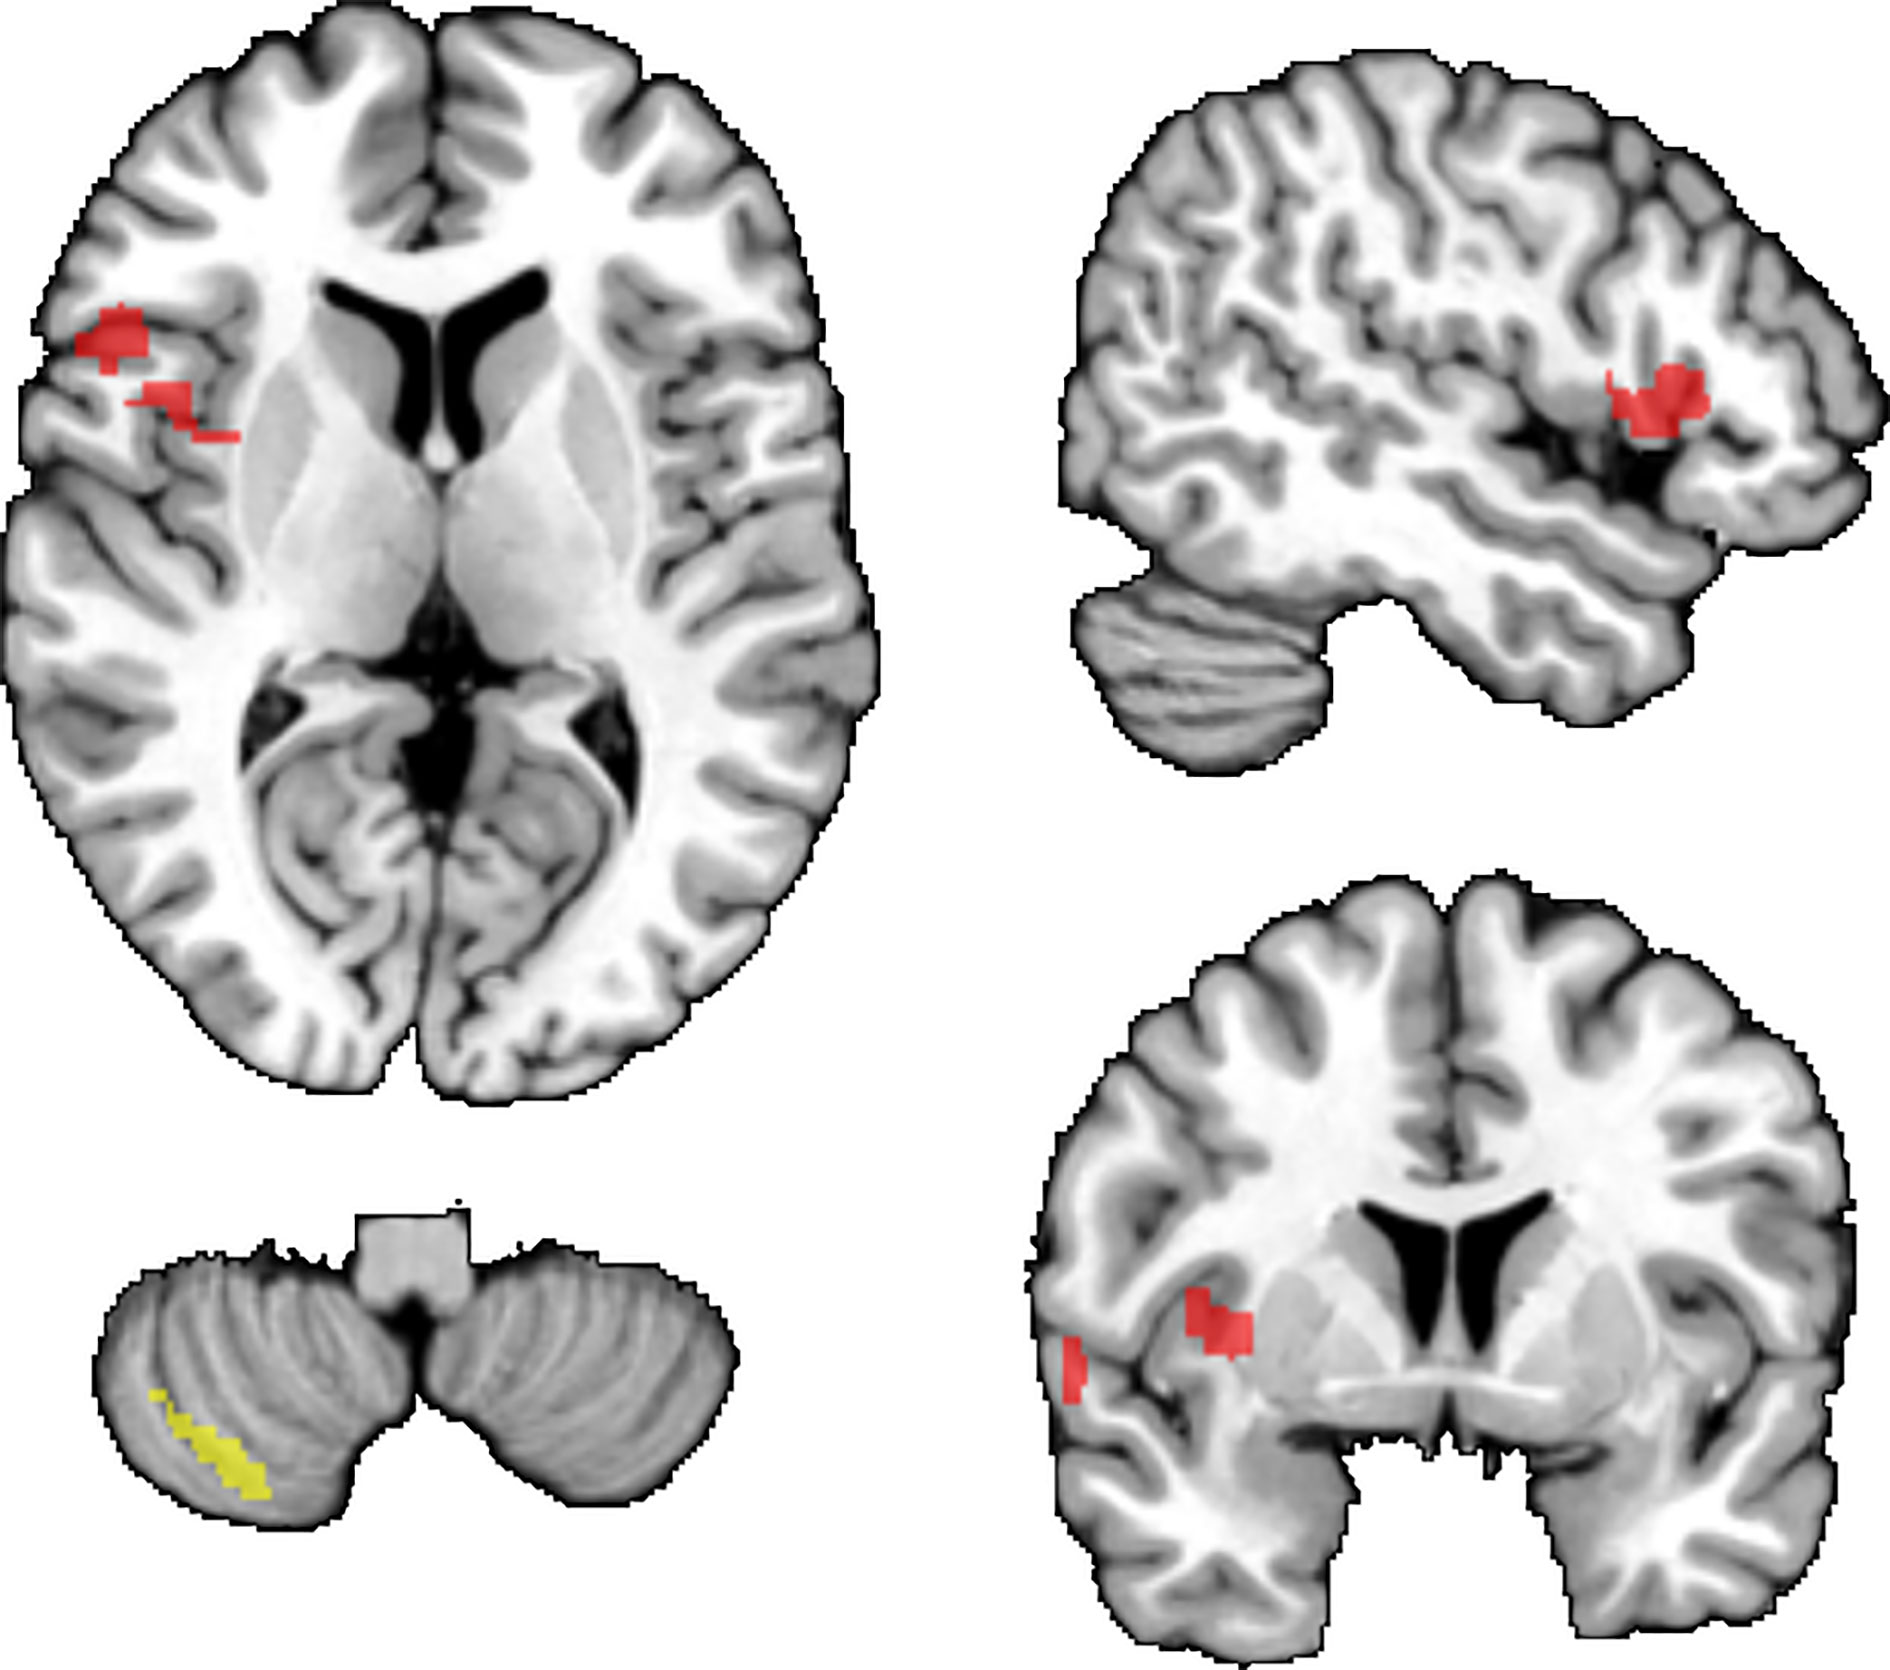
Figure 1 Results of primary VBM analyses (small volume correction). Brain regions where FEP had lower GM volumes than healthy participants (red). Negative associations between BMI and GM volumes (yellow). TFCE corr. p < 0.05. Results are displayed superimposed on the Colin 27 T1 template.
Secondary Whole Brain VBM Analyses
At the whole brain level and when controlling for BMI, we found that FEP had lower GM volume than healthy participants in the a) right cerebellum (Cohen’s d = 0.57; tmax = 4.39; pTFCE = 0.004; 1242 voxels), b) left cerebellum (Cohen’s d = 0.6, tmax = 4.59; pTFCE = 0.004, 1207 voxels), c) a cluster including left inferior frontal gyrus and superior temporal gyrus (Cohen’s d = 0.62; tmax = 4.7, pTFCE = 0.024, 151 voxels), d) right temporal cortex (Cohen’s d = 0.56; tmax= 4.25; pTFCE = 0.031, 110 voxels). When controlling for FEP, BMI was negatively associated with GM volume in the cerebellum (Cohen’s d = 0.71; tmax = 5.1; pTFCE = 0.004; 858 voxels); see Figure 2. We did not find interaction between diagnostic status (FEP vs. healthy participants) and BMI. Both FEP and BMI were negatively associated with GM in the left cerebellum, see Figure 2.
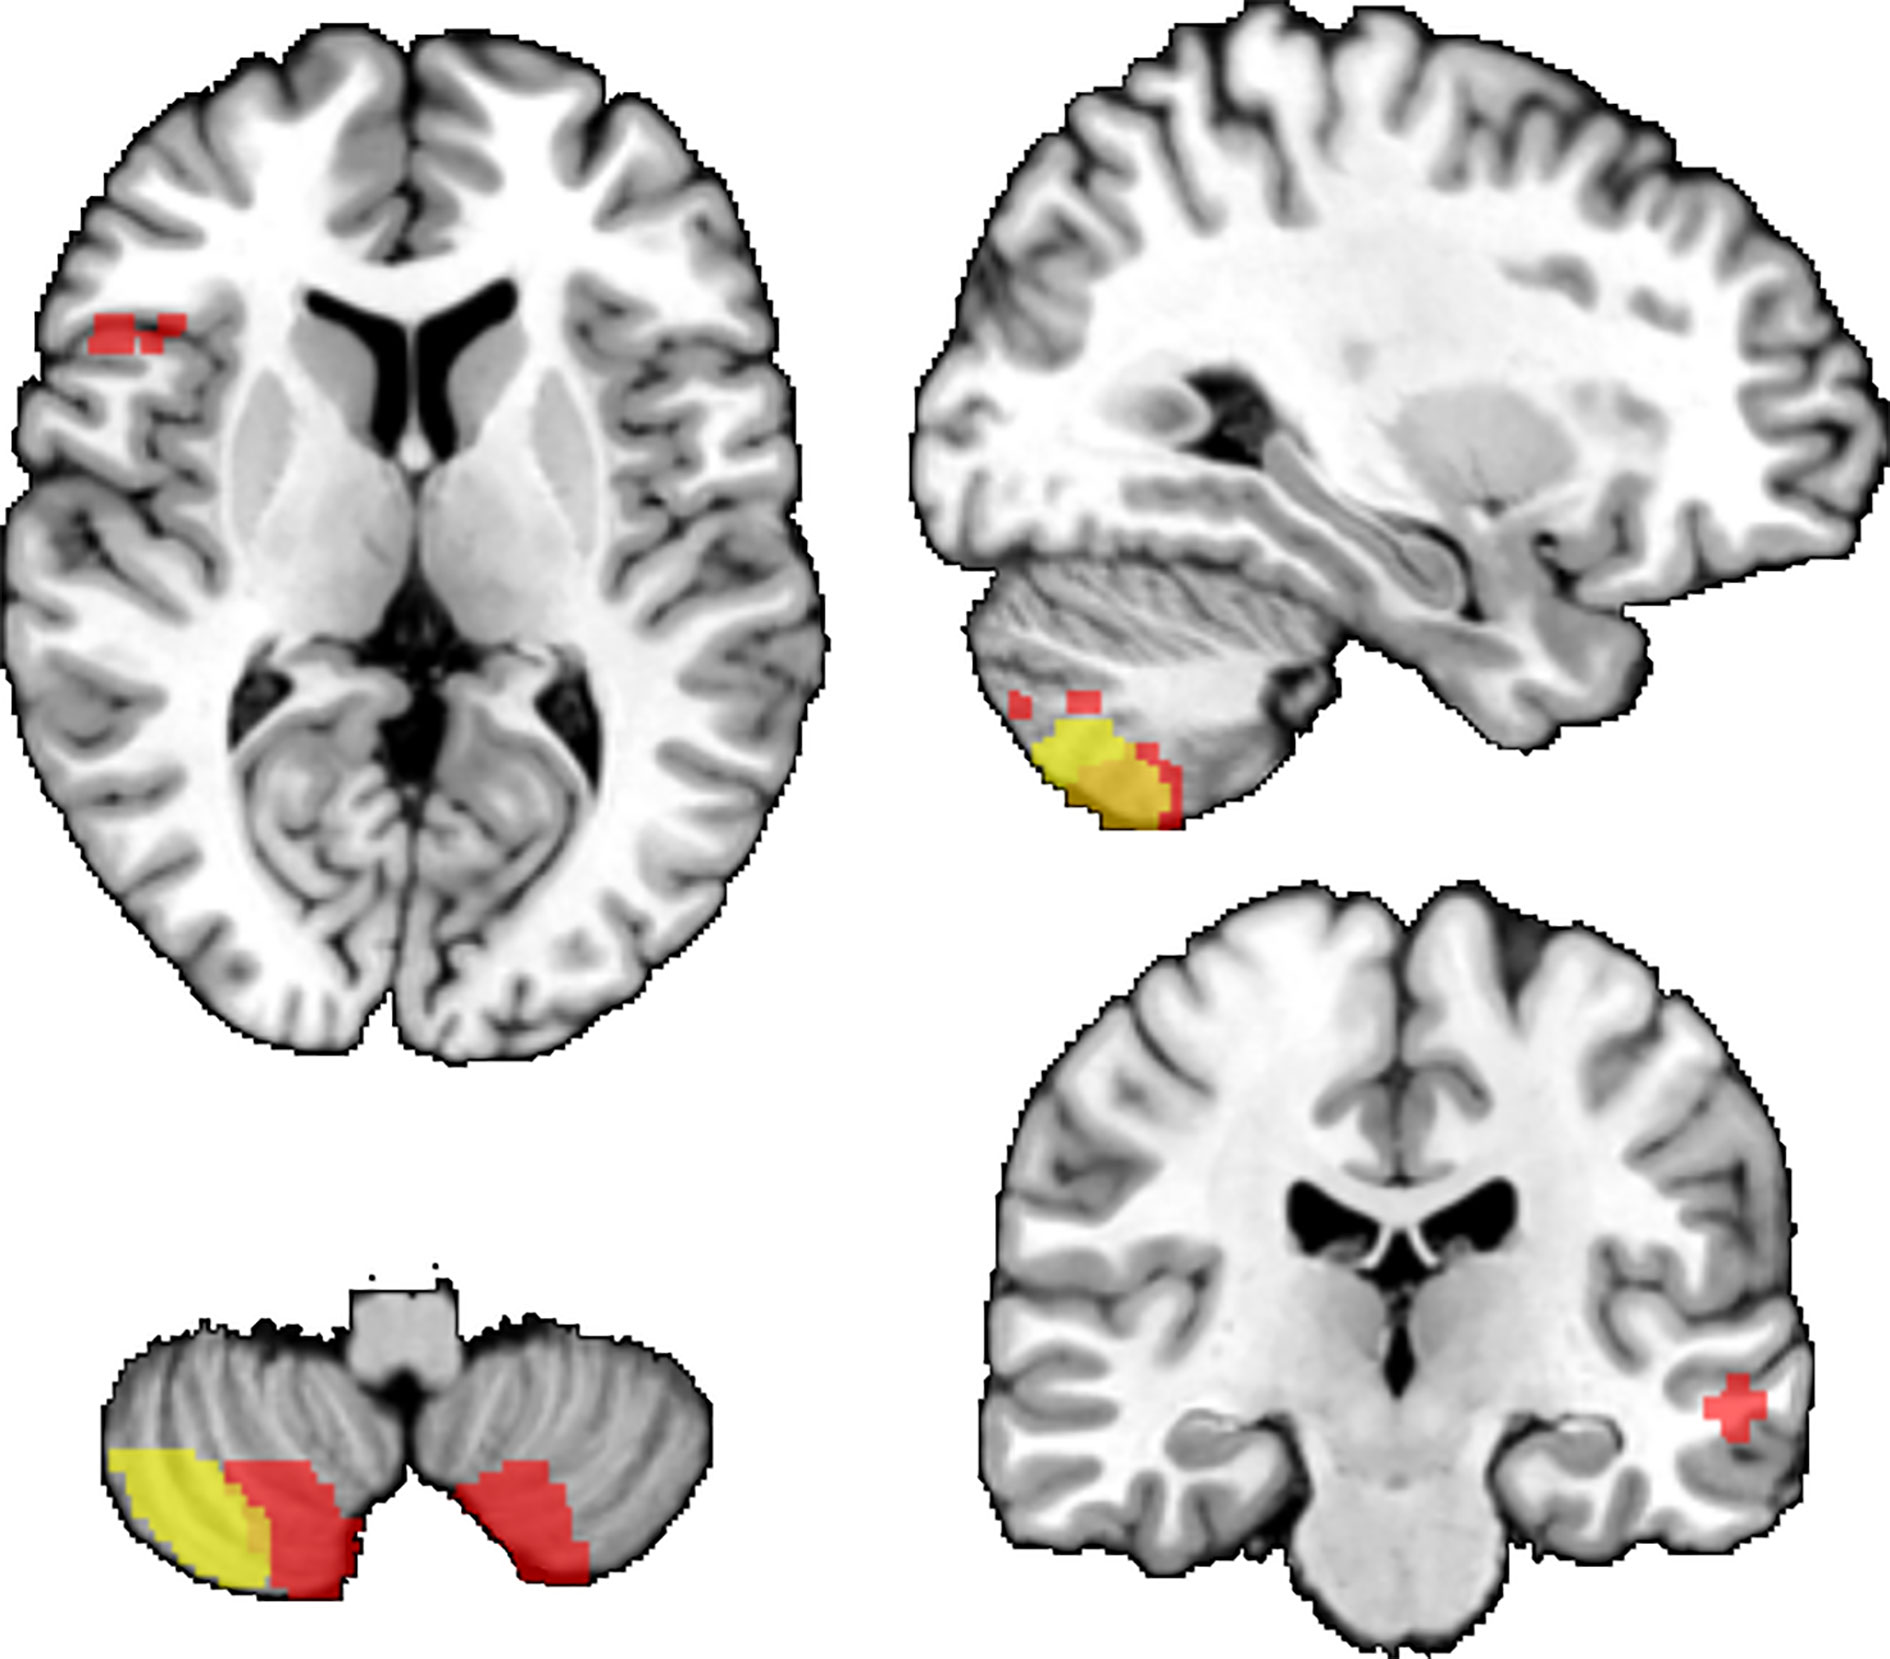
Figure 2 Results of secondary VBM analyses (whole-brain). Brain regions where FEP had lower GM volumes than healthy participants (red). Negative associations between BMI and GM volumes (yellow). Overlap between the associations with FEP and BMI (orange). TFCE corr. p < 0.05. Results are displayed superimposed on the Colin 27 T1 template.
Additional Analyses: GM and Clinical/Treatment-Related/Metabolic Variables in FEP Participants
Average GM values from voxels associated with BMI from primary analyses were negatively associated with low density lipoprotein cholesterol - LDL (rs = −0.255, p = 0.030), high sensitive C-reactive protein - CRP (rs = −0.327, p = 0.006), positively associated with high density lipoprotein cholesterol - HDL (rs = 0.269, p = 0.021). None of the other clinical/treatment-related/metabolic variables were associated with average GM values from the voxels within the regions associated with BMI or FEP, see supplementary material and Table 1S.
Discussion
In this study, we found that both FEP and BMI were negatively associated with local GM volumes. When controlling for BMI, individuals with FEP had lower GM volumes relative to controls in frontotemporal areas and right cerebellum. In addition, we found a partial effect of BMI when controlling for the diagnosis of FEP in the left cerebellum. There was also a cluster of lower GM volumes in the left cerebellum additively associated with both FEP and BMI. Our results are congruent with our a priori hypotheses and expand our previous study demonstrating effects of BMI on BrainAGE, a composite measure of brain structure (22).
Our findings are in keeping with previous studies in FEP or obesity. Lower GM volume in frontal and temporal brain regions are among the most replicated findings in VBM studies of FEP participants (3–5, 33). Recent meta-analysis using automated segmentation also confirmed the importance of these brain areas in FEP (34). The associations between BMI and cerebellar regions are also in line with previous studies and meta-analyses in general population (18). Interestingly, even our whole brain results fell into regions, which showed smaller volumes in obesity in previous meta-analyses (18), thus providing strong replication and increasing the chance of true positive findings.
Previous neurostructural findings regarding cerebellum in FEP are less consistent. In keeping with our results, a number of individual studies reported lower GM volumes of cerebellum in all stages of SZ (35–41), including those at ultra-high risk (UHR) for psychosis (39, 42), FEP (40), or in the largest such study, a multisite mega-analyses of 983 participants and 1,349 healthy controls (19). However, cerebellar findings from meta-analyses exploring GM volume abnormalities in FEP are inconsistent, with some reports finding cerebellar alterations only in certain subgroups or not at all (3–5). Previous studies did not control for BMI, which appears to be negatively associated with cerebellar volume independent of the effects of psychosis. Perhaps, the uncontrolled presence of overweight/obesity may contribute to heterogeneity in cerebellar volumetric findings between studies in FEP.
As obesity is a complex phenomenon, it is important to explore which obesity associated factors are particularly relevant to the brain alterations found in obese/overweight participants. These may include low-grade systemic inflammation (43–45), HPA dysfunctions (46, 47), leptin-resistance (48), insulin resistance (49–51), or ceramide-induced DNA methylation (52). Our findings provide the strongest support for the role of dyslipidemia and systemic inflammation in these brain alteration. Specifically, among FEP participants, LDL levels were negatively and HDL levels were positively associated with GM within the cluster showing association with BMI. This is the first report suggesting that lipid abnormalities could contribute to brain alterations in FEP. Additionally, CRP was negatively associated with average GM values from the cerebellar cluster associated with BMI (rs = −0.327, p = 0.006). These findings are in line with previous studies suggesting a role of low grade chronic inflammation in obesity related brain alterations, especially in cerebellum (53–55).
We did not find associations between clinical/treatment-related variables, including antipsychotic treatment and GM volumes. This is surprising, as previous studies described associations between cumulative exposure of antipsychotic medication and GM volumes (56) as well as pro-adipogenic effect of antipsychotics (57, 58). But, at the same time, participants in our study had on average only 1.99 month of antipsychotic treatment and BMI was not associated with cumulative antipsychotic exposure. We cannot rule out that following a longer antipsychotic treatment, their metabolic side effects would become more relevant for association between antipsychotics and GM volumes. The class of antipsychotic medication could also play a role. Almost all of the participants in our study received second generation antipsychotics. Previous meta-analysis of longitudinal studies found GM volume reduction mostly in participants treated with first generation antipsychotics (59). However, other studies and meta-analyses have found negative effects of antipsychotics on brain structure even in studies, which included participants treated with atypicals (33, 60, 61).
The results of negative associations between BMI and GM volume in FEP are clinically concerning, as overweight/obesity is disproportionately frequent in psychoses (8, 13), as also confirmed in this study. Identification of higher BMI or overweight/obesity as a potential risk factor for neurostructural alterations in FEP may be the first step toward their management. Lifestyle interventions focused on psychological well-being and weight management have proven to be effective in improving cognitive, clinical, and functional outcomes in many psychiatric syndromes (62–64). Obesity-related structural brain abnormalities might be reversible with dietary/lifestyle/surgical/medication interventions fostering weight loss and, especially in adolescents and young adults (65–69). Structural neuroimaging studies have reported increases in brain volumes following aerobic exercise in healthy subjects as well as in participants with SZ (70), which may be related to weight reduction (67, 71). Also medications targeting obesity may have neuroprotective effects. Promising results have been described using antidiabetic liraglutide (72), as also shown by our pilot trial in participants with bipolar disorder (73, 74). Other potential therapeutic options for future research include antiglucocorticoid mifepristone, which may improve cognitive dysfunction in participants with mood disorders (75) and showed also potential implications in reducing the risk of developing olanzapine/risperidone-induced weight gain (76, 77). Last but not least, protein deacetylase sirtuin1 (Sirt1) is protective against metabolic consequences of chronic exposure to a high-fat diet in animal models (78) and against signs of accelerated ageing in animal (79) as well as in human studies (80).
The results may have functional implications. Posterior cerebellar regions are connected to associative brain areas such as the prefrontal cortex and dysfunctions in the cortico-cerebellar-thalamo-cortical circuits could result in psychotic symptoms, as cerebellum acts as all-purpose modulator of movement as well as thought (81). Additionally, posterior cerebellum is involved in cognitive and mood regulation (82, 83). Therefore, cerebellar alterations could help explain the pathoplastic effects of obesity on psychiatric outcomes, as previously documented (84–87).
Besides the clinical/functional implications, our results are relevant for methodological reasons. BMI is not usually controlled for in VBM studies of FEP, although the negative effects of obesity on brain structure are robust and replicated in both psychiatric and non-psychiatric participants (17, 18, 88, 89). Identification of relevant contributors to GM abnormalities in FEP is an important step toward the better understanding and interpretation of neurostructural studies.
With regard to limitations, only a prospective study could establish the direction of the association between obesity and GM volumes. It is possible that obesity is not the cause, but rather the consequence of brain imaging changes, which may render participants more impulsive (90–92). We were unable to quantify the effects of chronic stressors, life events, diet, or exercise. Only our primary VBM analyses were testing a priori hypotheses using preselected variables and regions of interest. Additional analyses exploring associations between metabolic and inflammatory markers were exploratory/hypothesis generating and their results should be interpreted with caution. The fact that the healthy group did not match the patients is another limitation. At the same time, matching on unseen variables, which are only obtained as a part of the study is difficult and thus, similar previous studies also showed between group differences in metabolic markers (93). In addition, when we performed analyses on a subgroup of age and sex balanced participants (N = 213, 106 FEP, 107 healthy participants), the results remained essentially unchanged.
The study has several advantages, including the sample size (N = 234), focus on clinically interesting group of FEP participants and quantification of metabolic health using both, anthropometric as well as biochemical measurements. The results have good face validity, as they replicate some of the previous findings. The effects of metabolic alterations on brain health are of major interest in diabetology, yet remain markedly understudied in psychiatry, despite the high prevalence of metabolic alterations in this population.
To conclude, we demonstrated that higher BMI, overweight/obesity and diagnosis of FEP were significantly associated with lower regional GM volumes and that dyslipidemia and elevated CRP could contribute to obesity related neurostructural alterations. The effects of psychosis were most pronounced in frontotemporal regions, whereas both psychosis and BMI were additively associated with lower GM in the cerebellum. This is highly clinically relevant, as FEP participants have an increased risk of metabolic disorders and brain structural alterations. The additive effects of FEP and BMI also suggest that comorbidity with obesity could contribute to heterogeneity of neuroimaging findings in psychosis. It remains to be tested, whether treatment of overweight/obesity, dyslipidemia, and low grade systemic inflammation might improve or preserve brain structure in FEP and whether this would have positive impact on psychiatric prognosis.
Data Availability Statement
The raw data supporting the conclusions of this article will be made available by the authors upon reasonable request and in compliance with the REB requirements.
Ethics Statement
The studies involving human participants were reviewed and approved by Ethics committee of National Institute of Mental Health, Klecany, Czech Republic. The patients/participants provided their written informed consent to participate in this study.
Author Contributions
All authors met ICMJE criteria for authorship. Specifically, MK, TH, FŠ, and JH contributed to the conception and design of the study. MK, TH, FŠ, PK, AŠ, JR, and MM contributed to data collection and preprocessing. MK, TH, and JH contributed to the statistical analyses and checking the accuracy and integrity of the data. MK, TH, and JH contributed to interpretation of the results. All authors contributed to the article and approved the submitted version.
Funding
This study was supported by Ministry of Health of the Czech Republic (grant numbers 16–32791A and NU20-04-00393), by long-term strategic development financing of the Institute of Computer Science (RVO:67985807) of the Czech Academy of Sciences and by funding from the Canadian Institutes of Health Research (#142255). The sponsors of the study had no role in the design or conduct of this study; in the collection, management, analysis, and interpretation of the data; or in the preparation, review, or approval of the manuscript.
Conflict of Interest
The authors declare that the research was conducted in the absence of any commercial or financial relationships that could be construed as a potential conflict of interest.
Supplementary Material
The Supplementary Material for this article can be found online at: https://www.frontiersin.org/articles/10.3389/fpsyt.2020.556759/full#supplementary-material
References
1. Dazzan P, Arango C, Fleischacker W, Galderisi S, Glenthøj B, Leucht S, et al. Magnetic resonance imaging and the prediction of outcome in first-episode schizophrenia: a review of current evidence and directions for future research. Schizophr Bull (2015) 41:574–83. doi: 10.1093/schbul/sbv024
2. Lieberman J, Chakos M, Wu H, Alvir J, Hoffman E, Robinson D, et al. Longitudinal study of brain morphology in first episode schizophrenia. Biol Psychiatry (2001) 49:487–99. doi: 10.1016/S0006-3223(01)01067-8
3. Leung M, Cheung C, Yu K, Yip B, Sham P, Li Q, et al. Gray matter in first-episode schizophrenia before and after antipsychotic drug treatment. Anatomical likelihood estimation meta-analyses with sample size weighting. Schizophr Bull (2011) 37:199–211. doi: 10.1093/schbul/sbp099
4. Radua J, Borgwardt S, Crescini A, Mataix-Cols D, Meyer-Lindenberg A, McGuire PK, et al. Multimodal meta-analysis of structural and functional brain changes in first episode psychosis and the effects of antipsychotic medication. Neurosci Biobehav Rev (2012) 36:2325–33. doi: 10.1016/j.neubiorev.2012.07.012
5. Shah C, Zhang W, Xiao Y, Yao L, Zhao Y, Gao X, et al. Common pattern of gray-matter abnormalities in drug-naive and medicated first-episode schizophrenia: a multimodal meta-analysis. Psychol Med (2017) 47:401–13. doi: 10.1017/S0033291716002683
6. Fornito A, Yücel M, Pantelis C. Reconciling neuroimaging and neuropathological findings in schizophrenia and bipolar disorder. Curr Opin Psychiatry (2009) 22:312–9. doi: 10.1097/YCO.0b013e32832a1353
7. Vita A, De Peri L, Silenzi C, Dieci M. Brain morphology in first-episode schizophrenia: a meta-analysis of quantitative magnetic resonance imaging studies. Schizophr Res (2006) 82:75–88. doi: 10.1016/j.schres.2005.11.004
8. Mitchell AJ, Vancampfort D, De Herdt A, Yu W, De Hert M. Is the prevalence of metabolic syndrome and metabolic abnormalities increased in early schizophrenia? A comparative meta-analysis of first episode, untreated and treated patients. Schizophr Bull (2013) 39:295–305. doi: 10.1093/schbul/sbs082
9. Vancampfort D, Stubbs B, Mitchell AJ, De Hert M, Wampers M, Ward PB, et al. Risk of metabolic syndrome and its components in people with schizophrenia and related psychotic disorders, bipolar disorder and major depressive disorder: a systematic review and meta-analysis. World Psychiatry (2015) 14:339–47. doi: 10.1002/wps.20252
10. Correll CU, Robinson DG, Schooler NR, Brunette MF, Mueser KT, Rosenheck RA, et al. Cardiometabolic risk in patients with first-episode schizophrenia spectrum disorders: baseline results from the RAISE-ETP study. JAMA Psychiatry (2014) 71:1350–63. doi: 10.1001/jamapsychiatry.2014.1314
11. Foley DL, Morley KI. Systematic review of early cardiometabolic outcomes of the first treated episode of psychosis. Arch Gen Psychiatry (2011) 68:609–16. doi: 10.1001/archgenpsychiatry.2011.2
12. Galletly CA, Foley DL, Waterreus A, Watts GF, Castle DJ, McGrath JJ, et al. Cardiometabolic risk factors in people with psychotic disorders: the second Australian national survey of psychosis. Aust N Z J Psychiatry (2012) 46:753–61. doi: 10.1177/0004867412453089
13. Mitchell AJ, Vancampfort D, Sweers K, van Winkel R, Yu W, De Hert M. Prevalence of metabolic syndrome and metabolic abnormalities in schizophrenia and related disorders–a systematic review and meta-analysis. Schizophr Bull (2013) 39:306–18. doi: 10.1093/schbul/sbr148
14. Alosco ML, Stanek KM, Galioto R, Korgaonkar MS, Grieve SM, Brickman AM, et al. Body mass index and brain structure in healthy children and adolescents. Int J Neurosci (2014) 124:49–55. doi: 10.3109/00207454.2013.817408
15. Yau PL, Kang EH, Javier DC, Convit A. Preliminary evidence of cognitive and brain abnormalities in uncomplicated adolescent obesity. Obes (Silver Spring) (2014) 22:1865–71. doi: 10.1002/oby.20801
16. Caunca MR, Gardener H, Simonetto M, Cheung YK, Alperin N, Yoshita M, et al. Measures of obesity are associated with MRI markers of brain aging: The Northern Manhattan Study. Neurology (2019) 93:e791–803. doi: 10.1212/WNL.0000000000007966
17. Dekkers IA, Jansen PR, Lamb HJ. Obesity, brain volume, and white matter microstructure at MRI: A Cross-sectional UK Biobank Study. Radiology (2019) 291:763–71. doi: 10.1148/radiol.2019181012
18. García-García I, Michaud A, Dadar M, Zeighami Y, Neseliler S, Collins DL, et al. Neuroanatomical differences in obesity: meta-analytic findings and their validation in an independent dataset. Int J Obes 2005 (2019) 43:943–51. doi: 10.1038/s41366-018-0164-4
19. Moberget T, Doan NT, Alnæs D, Kaufmann T, Córdova-Palomera A, Lagerberg TV, et al. Cerebellar volume and cerebellocerebral structural covariance in schizophrenia: a multisite mega-analysis of 983 patients and 1349 healthy controls. Mol Psychiatry (2018) 23:1512–20. doi: 10.1038/mp.2017.106
20. Raschpichler M, Straatman K, Schroeter ML, Arelin K, Schlögl H, Fritzsch D, et al. Abdominal fat distribution and its relationship to brain changes: the differential effects of age on cerebellar structure and function: a cross-sectional, exploratory study. BMJ Open (2013) 3. doi: 10.1136/bmjopen-2012-001915
21. Willette AA, Kapogiannis D. Does the brain shrink as the waist expands? Ageing Res Rev (2015) 20:86–97. doi: 10.1016/j.arr.2014.03.007
22. Kolenic M, Franke K, Hlinka J, Matejka M, Capkova J, Pausova Z, et al. Obesity, dyslipidemia and brain age in first-episode psychosis. J Psychiatr Res (2018) 99:151–8. doi: 10.1016/j.jpsychires.2018.02.012
23. Spaniel F, Tintera J, Rydlo J, Ibrahim I, Kasparek T, Horacek J, et al. Altered neural correlate of the self-agency experience in first-episode Schizophrenia-spectrum patients: An fMRI Study. Schizophr Bull (2016) 42:916–25. doi: 10.1093/schbul/sbv188
24. Sheehan DV, Lecrubier Y, Sheehan KH, Amorim P, Janavs J, Weiller E, et al. The Mini-International Neuropsychiatric Interview (M.I.N.I.): the development and validation of a structured diagnostic psychiatric interview for DSM-IV and ICD-10. J Clin Psychiatry (1998) 59 Suppl 20:22–33;quiz 34-57.
25. Fusar-Poli P, Cappucciati M, Rutigliano G, Heslin M, Stahl D, Brittenden Z, et al. Diagnostic stability of ICD/DSM first episode psychosis diagnoses: meta-analysis. Schizophr Bull (2016) 42:1395–406. doi: 10.1093/schbul/sbw020
26. Kay SR, Fiszbein A, Opler LA. The Positive and Negative Syndrome Scale (PANSS) for Schizophrenia. Schizophr Bull (1987) 13:261–76. doi: 10.1093/schbul/13.2.261
27. Douaud G, Smith S, Jenkinson M, Behrens T, Johansen-Berg H, Vickers J, et al. Anatomically related grey and white matter abnormalities in adolescent-onset schizophrenia. Brain J Neurol (2007) 130:2375–86. doi: 10.1093/brain/awm184
28. Good CD, Johnsrude IS, Ashburner J, Henson RN, Friston KJ. Frackowiak RS. A voxel-based morphometric study of ageing in 465 normal adult human brains. NeuroImage (2001) 14:21–36. doi: 10.1006/nimg.2001.0786
29. Smith SM, Jenkinson M, Woolrich MW, Beckmann CF, Behrens TEJ, Johansen-Berg H, et al. Advances in functional and structural MR image analysis and implementation as FSL. NeuroImage (2004) 23 Suppl 1:S208–219. doi: 10.1016/j.neuroimage.2004.07.051
30. Andersson JLR, Jenkinson M, Smith S, Jenkinson M, Smith S, Andersson JLR, et al. Non-Linear Registration aka Spatial Normalisation FMRIB Technial Report TR07JA2 (2007). Available at: https://www.scienceopen.com/document?vid=13f3b9a9-6e99-4ae7-bea2-c1bf0af8ca6e (Accessed August 2, 2019).
31. Smith SM, Nichols TE. Threshold-free cluster enhancement: addressing problems of smoothing, threshold dependence and localisation in cluster inference. NeuroImage (2009) 44:83–98. doi: 10.1016/j.neuroimage.2008.03.061
32. De Backer G. European guidelines on cardiovascular disease prevention in clinical practice Third Joint Task Force of European and other Societies on Cardiovascular Disease Prevention in Clinical Practice (constituted by representatives of eight societies and by invited experts). Eur Heart J (2003) 24:1601–10. doi: 10.1016/S0195-668X(03)00347-6
33. Fusar-Poli P, Smieskova R, Kempton MJ, Ho BC, Andreasen NC, Borgwardt S. Progressive brain changes in schizophrenia related to antipsychotic treatment? A meta-analysis of longitudinal MRI studies. Neurosci Biobehav Rev (2013) 37:1680–91. doi: 10.1016/j.neubiorev.2013.06.001
34. van Erp TGM, Walton E, Hibar DP, Schmaal L, Jiang W, Glahn DC, et al. Cortical brain abnormalities in 4474 individuals with Schizophrenia and 5098 control subjects via the Enhancing Neuro Imaging Genetics Through Meta Analysis (ENIGMA) Consortium. Biol Psychiatry (2018) 84:644–54. doi: 10.1016/j.biopsych.2018.04.023
35. Dean DJ, Bernard JA, Orr JM, Pelletier-Baldelli A, Gupta T, Carol EE, et al. Cerebellar morphology and procedural learning impairment in neuroleptic-naive youth at ultrahigh risk of psychosis. Clin Psychol Sci J Assoc Psychol Sci (2014) 2:152–64. doi: 10.1177/2167702613500039
36. He H, Luo C, Luo Y, Duan M, Yi Q, Biswal BB, et al. Reduction in gray matter of cerebellum in schizophrenia and its influence on static and dynamic connectivity. Hum Brain Mapp (2019) 40:517–28. doi: 10.1002/hbm.24391
37. Laidi C, Hajek T, Spaniel F, Kolenic M, d’Albis M-A, Sarrazin S, et al. Cerebellar parcellation in schizophrenia and bipolar disorder. Acta Psychiatr Scand (2019) 140(5):468–76. doi: 10.1111/acps.13087
38. Laidi C, d’Albis M-A, Wessa M, Linke J, Phillips ML, Delavest M, et al. Cerebellar volume in schizophrenia and bipolar I disorder with and without psychotic features. Acta Psychiatr Scand (2015) 131:223–33. doi: 10.1111/acps.12363
39. Pantelis C, Velakoulis D, McGorry PD, Wood SJ, Suckling J, Phillips LJ, et al. Neuroanatomical abnormalities before and after onset of psychosis: a cross-sectional and longitudinal MRI comparison. Lancet (2003) 361:281–8. doi: 10.1016/S0140-6736(03)12323-9
40. Venkatasubramanian G. Neuroanatomical correlates of psychopathology in antipsychotic-naive schizophrenia. Indian J Psychiatry (2010) 52:28. doi: 10.4103/0019-5545.58892
41. Wang J, Zhou L, Cui C, Liu Z, Lu J. Gray matter morphological anomalies in the cerebellar vermis in first-episode schizophrenia patients with cognitive deficits. BMC Psychiatry (2017) 17:374. doi: 10.1186/s12888-017-1543-4
42. Job DE, Whalley HC, Johnstone EC, Lawrie SM. Grey matter changes over time in high risk subjects developing schizophrenia. NeuroImage (2005) 25:1023–30. doi: 10.1016/j.neuroimage.2005.01.006
43. Vachharajani V, Granger DN. Adipose tissue: a motor for the inflammation associated with obesity. IUBMB Life (2009) 61:424–30. doi: 10.1002/iub.169
44. Jefferson AL, Massaro JM, Wolf PA, Seshadri S, Au R, Vasan RS, et al. Inflammatory biomarkers are associated with total brain volume: The Framingham Heart Study. Neurology (2007) 68:1032–8. doi: 10.1212/01.wnl.0000257815.20548.df
45. Wisse BE. The Inflammatory Syndrome: the role of adipose tissue cytokines in metabolic disorders linked to obesity. J Am Soc Nephrol (2004) 15:2792–800. doi: 10.1097/01.ASN.0000141966.69934.21
46. Ursache A, Wedin W, Tirsi A, Convit A. Preliminary evidence for obesity and elevations in fasting insulin mediating associations between cortisol awakening response and hippocampal volumes and frontal atrophy. Psychoneuroendocrinology (2012) 37:1270–6. doi: 10.1016/j.psyneuen.2011.12.020
47. Smith SM, Vale WW. The role of the hypothalamic-pituitary-adrenal axis in neuroendocrine responses to stress. Dialogues Clin Neurosci (2006) 8:13.
48. Rajagopalan P, Toga AW, Jack CR, Weiner MW, Thompson PM. Fat-mass-related hormone, plasma leptin, predicts brain volumes in the elderly. NeuroReport (2013) 24:58–62. doi: 10.1097/WNR.0b013e32835c5254
49. Hajek T, Calkin C, Blagdon R, Slaney C, Uher R, Alda M. Insulin resistance, diabetes mellitus, and brain structure in bipolar disorders. Neuropsychopharmacology (2014) 39:2910–8. doi: 10.1038/npp.2014.148
50. Willette AA, Xu G, Johnson SC, Birdsill AC, Jonaitis EM, Sager MA, et al. Insulin resistance, brain atrophy, and cognitive performance in late middle-aged adults. Diabetes Care (2013) 36:443–9. doi: 10.2337/dc12-0922
51. Phillips OR, Onopa AK, Zaiko YV, Singh MK. Insulin resistance is associated with smaller brain volumes in a preliminary study of depressed and obese children. Pediatr Diabetes (2018) 19:892–7. doi: 10.1111/pedi.12672
52. Castro K, Ntranos A, Amatruda M, Petracca M, Kosa P, Chen EY, et al. Body Mass Index in Multiple Sclerosis modulates ceramide-induced DNA methylation and disease course. EBioMedicine (2019) 43:392–410. doi: 10.1016/j.ebiom.2019.03.087
53. Guillemot-Legris O, Masquelier J, Everard A, Cani PD, Alhouayek M, Muccioli GG. High-fat diet feeding differentially affects the development of inflammation in the central nervous system. J Neuroinflammation (2016) 13:206. doi: 10.1186/s12974-016-0666-8
54. Guillemot-Legris O, Muccioli GG. Obesity-induced neuroinflammation: beyond the hypothalamus. Trends Neurosci (2017) 40:237–53. doi: 10.1016/j.tins.2017.02.005
55. Tapia-González S, García-Segura LM, Tena-Sempere M, Frago LM, Castellano JM, Fuente-Martín E, et al. Activation of microglia in specific hypothalamic nuclei and the cerebellum of adult rats exposed to neonatal overnutrition. J Neuroendocrinol (2011) 23:365–70. doi: 10.1111/j.1365-2826.2011.02113.x
56. Vita A, De Peri L, Deste G, Sacchetti E. Progressive loss of cortical gray matter in schizophrenia: a meta-analysis and meta-regression of longitudinal MRI studies. Transl Psychiatry (2012) 2:e190. doi: 10.1038/tp.2012.116
57. Bak M, Fransen A, Janssen J, van Os J, Drukker M. Almost all antipsychotics result in weight gain: a meta- analysis. PloS One (2014) 9:19. doi: 10.1371/journal.pone.0094112
58. Spertus J, Horvitz-Lennon M, Abing H, Normand S-L. Risk of weight gain for specific antipsychotic drugs: a meta-analysis. NPJ Schizophr (2018) 4:12. doi: 10.1038/s41537-018-0053-9
59. Vita A, De Peri L, Deste G, Barlati S, Sacchetti E. The Effect of Antipsychotic Treatment on Cortical Gray Matter Changes in Schizophrenia: Does the Class Matter? A Meta-analysis and Meta-regression of Longitudinal Magnetic Resonance Imaging Studies. Biol Psychiatry (2015) 78:403–12. doi: 10.1016/j.biopsych.2015.02.008
60. Andreasen NC, Liu D, Ziebell S, Vora A, Ho B-C. Relapse duration, treatment intensity, and brain tissue loss in schizophrenia: a prospective longitudinal MRI study. Am J Psychiatry (2013) 170:609–15. doi: 10.1176/appi.ajp.2013.12050674
61. Van Gestel H, Franke K, Petite J, Slaney C, Garnham J, Helmick C, et al. Brain age in bipolar disorders: Effects of lithium treatment. Aust N Z J Psychiatry (2019) 53(12):1179–88. doi: 10.1177/0004867419857814
62. Minichino A, Ando’ A, Francesconi M, Salatino A, Delle Chiaie R, Cadenhead K. Investigating the link between drug-naive first episode psychoses (FEPs), weight gain abnormalities and brain structural damages: Relevance and implications for therapy. Prog Neuropsychopharmacol Biol Psychiatry (2017) 77:9–22. doi: 10.1016/j.pnpbp.2017.03.020
63. Fava GA. The clinical role of psychological well-being. World Psychiatry (2012) 11:102–3. doi: 10.1016/j.wpsyc.2012.05.018
64. Goracci A, Rucci P, Forgione RN, Campinoti G, Valdagno M, Casolaro I, et al. Development, acceptability and efficacy of a standardized healthy lifestyle intervention in recurrent depression. J Affect Disord (2016) 196:20–31. doi: 10.1016/j.jad.2016.02.034
65. Gomez-Pinilla F. The combined effects of exercise and foods in preventing neurological and cognitive disorders. Prev Med (2011) 52 Suppl 1:S75–80. doi: 10.1016/j.ypmed.2011.01.023
66. Haltia LT, Viljanen A, Parkkola R, Kemppainen N, Rinne JO, Nuutila P, et al. Brain white matter expansion in human obesity and the recovering effect of dieting. J Clin Endocrinol Metab (2007) 92:3278–84. doi: 10.1210/jc.2006-2495
67. Mueller K, Möller HE, Horstmann A, Busse F, Lepsien J, Blüher M, et al. Physical exercise in overweight to obese individuals induces metabolic- and neurotrophic-related structural brain plasticity. Front Hum Neurosci (2015) 9:372. doi: 10.3389/fnhum.2015.00372
68. Shan H, Li P, Liu H, Nie B, Yin X, Zhang T, et al. Gray matter reduction related to decreased serum creatinine and increased triglyceride, Hemoglobin A1C, and low-density lipoprotein in subjects with obesity. Neuroradiology (2019) 61:703–10. doi: 10.1007/s00234-019-02202-3
69. Tuulari JJ, Karlsson HK, Antikainen O, Hirvonen J, Pham T, Salminen P, et al. Bariatric surgery induces white and grey matter density recovery in the morbidly obese: A Voxel-Based Morphometric Study. Hum Brain Mapp (2016) 37:3745–56. doi: 10.1002/hbm.23272
70. Pajonk F-G, Wobrock T, Gruber O, Scherk H, Berner D, Kaizl I, et al. Hippocampal plasticity in response to exercise in schizophrenia. Arch Gen Psychiatry (2010) 67:133–43. doi: 10.1001/archgenpsychiatry.2009.193
71. Honea RA, Szabo-Reed AN, Lepping RJ, Perea R, Breslin F, Martin LE, et al. Voxel-based morphometry reveals brain gray matter volume changes in successful dieters. Obes Silver Spring Md (2016) 24:1842–8. doi: 10.1002/oby.21551
72. Gejl M, Gjedde A, Egefjord L, Møller A, Hansen SB, Vang K, et al. In Alzheimer’s disease, 6-month treatment with glp-1 analog prevents decline of brain glucose metabolism: randomized, placebo-controlled, double-blind clinical trial. Front Aging Neurosci (2016) 8:108. doi: 10.3389/fnagi.2016.00108
73. Mansur RB, Ahmed J, Cha DS, Woldeyohannes HO, Subramaniapillai M, Lovshin J, et al. Liraglutide promotes improvements in objective measures of cognitive dysfunction in individuals with mood disorders: A pilot, open-label study. J Affect Disord (2017) 207:114–20. doi: 10.1016/j.jad.2016.09.056
74. Mansur RB, Zugman A, Ahmed J, Cha DS, Subramaniapillai M, Lee Y, et al. Treatment with a GLP-1R agonist over four weeks promotes weight loss-moderated changes in frontal-striatal brain structures in individuals with mood disorders. Eur Neuropsychopharmacol J Eur Coll Neuropsychopharmacol (2017) 27:1153–62. doi: 10.1016/j.euroneuro.2017.08.433
75. Watson S, Gallagher P, Porter RJ, Smith MS, Herron LJ, Bulmer S, et al. A randomized trial to examine the effect of mifepristone on neuropsychological performance and mood in patients with bipolar depression. Biol Psychiatry (2012) 72:943–9. doi: 10.1016/j.biopsych.2012.05.029
76. Gross C, Blasey CM, Roe RL, Allen K, Block TS, Belanoff JK. Mifepristone treatment of olanzapine-induced weight gain in healthy men. Adv Ther (2009) 26:959–69. doi: 10.1007/s12325-009-0070-1
77. Gross C, Blasey CM, Roe RL, Belanoff JK. Mifepristone Reduces Weight Gain and Improves Metabolic Abnormalities Associated With Risperidone Treatment in Normal Men. Obesity (2010) 18:2295–300. doi: 10.1038/oby.2010.51
78. Pfluger PT, Herranz D, Velasco-Miguel S, Serrano M, Tschöp MH. Sirt1 protects against high-fat diet-induced metabolic damage. Proc Natl Acad Sci USA (2008) 105:9793–8. doi: 10.1073/pnas.0802917105
79. Alcendor RR, Gao S, Zhai P, Zablocki D, Holle E, Yu X, et al. Sirt1 regulates aging and resistance to oxidative stress in the heart. Circ Res (2007) 100:1512–21. doi: 10.1161/01.RES.0000267723.65696.4a
80. Wyman AE, Atamas SP. Sirtuins and accelerated aging in scleroderma. Curr Rheumatol Rep (2018) 20:16. doi: 10.1007/s11926-018-0724-6
81. Andreasen NC, Pierson R. The role of the cerebellum in schizophrenia. Biol Psychiatry (2008) 64:81–8. doi: 10.1016/j.biopsych.2008.01.003
82. Buckner RL. The cerebellum and cognitive function: 25 years of insight from anatomy and neuroimaging. Neuron (2013) 80:807–15. doi: 10.1016/j.neuron.2013.10.044
83. Stoodley CJ, Schmahmann JD. Functional topography in the human cerebellum: a meta-analysis of neuroimaging studies. NeuroImage (2009) 44:489–501. doi: 10.1016/j.neuroimage.2008.08.039
84. Calkin C, van de Velde C, Růžičková M, Slaney C, Garnham J, Hajek T, et al. Can body mass index help predict outcome in patients with bipolar disorder? Bipolar Disord (2009) 11:650–6. doi: 10.1111/j.1399-5618.2009.00730.x
85. Godin O, Leboyer M, Schürhoff F, Llorca P-M, Boyer L, Andre M, et al. Metabolic Syndrome and Illness Severity Predict Relapse at 1-Year Follow-Up in Schizophrenia: The FACE-SZ Cohort. J Clin Psychiatry (2018) 79. doi: 10.4088/JCP.17m12007
86. Manu P, Khan S, Radhakrishnan R, Russ MJ, Kane JM, Correll CU. Body mass index identified as an independent predictor of psychiatric readmission. J Clin Psychiatry (2014) 75:e573–577. doi: 10.4088/JCP.13m08795
87. Phillips JR, Hewedi DH, Eissa AM, Moustafa AA. The cerebellum and psychiatric disorders. Front Public Health (2015) 3:66. doi: 10.3389/fpubh.2015.00066
88. Cox SR, Lyall DM, Ritchie SJ, Bastin ME, Harris MA, Buchanan CR, et al. Associations between vascular risk factors and brain MRI indices in UK Biobank. Eur Heart J (2019) 40:2290–300. doi: 10.1093/eurheartj/ehz100
89. Hamer M, Batty GD. Association of body mass index and waist-to-hip ratio with brain structure: UK Biobank study. Neurology (2019) 92:e594–600. doi: 10.1212/WNL.0000000000006879
90. Miquel M, Vazquez-Sanroman D, Carbo-Gas M, Gil-Miravet I, Sanchis-Segura C, Carulli D, et al. Have we been ignoring the elephant in the room? Seven arguments for considering the cerebellum as part of addiction circuitry. Neurosci Biobehav Rev (2016) 60:1–11. doi: 10.1016/j.neubiorev.2015.11.005
91. Opel N, Redlich R, Grotegerd D, Dohm K, Heindel W, Kugel H, et al. Obesity and major depression: Body-mass index (BMI) is associated with a severe course of disease and specific neurostructural alterations. Psychoneuroendocrinology (2015) 51:219–26. doi: 10.1016/j.psyneuen.2014.10.001
92. Schilling C, Kühn S, Paus T, Romanowski A, Banaschewski T, Barbot A, et al. Cortical thickness of superior frontal cortex predicts impulsiveness and perceptual reasoning in adolescence. Mol Psychiatry (2013) 18:624–30. doi: 10.1038/mp.2012.56
Keywords: obesity, schizophrenia, dyslipidemia, first-episode psychosis, low-grade inflammation, voxel-based morphometry
Citation: Kolenič M, Španiel F, Hlinka J, Matějka M, Knytl P, Šebela A, Renka J and Hajek T (2020) Higher Body-Mass Index and Lower Gray Matter Volumes in First Episode of Psychosis. Front. Psychiatry 11:556759. doi: 10.3389/fpsyt.2020.556759
Received: 28 April 2020; Accepted: 02 September 2020;
Published: 23 September 2020.
Edited by:
Anthony Christopher Vernon, King’s College London, United KingdomReviewed by:
Gaelle Eve Doucet, Boys Town National Research Hospital, United StatesXiaochen Tang, Shanghai Mental Health Center, China
Copyright © 2020 Kolenič, Španiel, Hlinka, Matějka, Knytl, Šebela, Renka and Hajek. This is an open-access article distributed under the terms of the Creative Commons Attribution License (CC BY). The use, distribution or reproduction in other forums is permitted, provided the original author(s) and the copyright owner(s) are credited and that the original publication in this journal is cited, in accordance with accepted academic practice. No use, distribution or reproduction is permitted which does not comply with these terms.
*Correspondence: Tomas Hajek, dG9tYXMuaGFqZWtAZGFsLmNh