 Carl Delfin
 Emily Ruzich3
 Märta Wallinius
 Malin Björnsdotter
 Peter Andiné
- 1Centre for Ethics, Law and Mental Health, Department of Psychiatry and Neurochemistry, Institute of Neuroscience and Physiology, Sahlgrenska Academy, University of Gothenburg, Gothenburg, Sweden
- 2Research Department, Regional Forensic Psychiatric Clinic, Växjö, Sweden
- 3MedTech West, Sahlgrenska University Hospital, Gothenburg, Sweden
- 4Lund Clinical Research on Externalizing and Developmental Psychopathology, Child and Adolescent Psychiatry, Department of Clinical Sciences Lund, Lund University, Lund, Sweden
- 5Affective Psychiatry, Sahlgrenska University Hospital, Gothenburg, Sweden
- 6Forensic Psychiatric Clinic, Sahlgrenska University Hospital, Gothenburg, Sweden
- 7Department of Forensic Psychiatry, National Board of Forensic Medicine, Gothenburg, Sweden
Trait disinhibition may function as a dispositional liability toward maladaptive behaviors relevant in the treatment of mentally disordered offenders (MDOs). Reduced amplitude and prolonged latency of the NoGo N2 and P3 event-related potentials have emerged as promising candidates for transdiagnostic, biobehavioral markers of trait disinhibition, yet no study has specifically investigated these two components in violent, inpatient MDOs. Here, we examined self-reported trait disinhibition, experimentally assessed response inhibition, and NoGo N2 and P3 amplitude and latency in male, violent MDOs (N = 27) and healthy controls (N = 20). MDOs had a higher degree of trait disinhibition, reduced NoGo P3 amplitude, and delayed NoGo P3 latency compared to controls. The reduced NoGo P3 amplitude and delayed NoGo P3 latency in MDOs may stem from deficits during monitoring or evaluation of behavior. NoGo P3 latency was associated with increased trait disinhibition in the whole sample, suggesting that trait disinhibition may be associated with reduced neural efficiency during later stages of outcome monitoring or evaluation. Findings for NoGo N2 amplitude and latency were small and non-robust. With several limitations in mind, this is the first study to demonstrate attenuated NoGo P3 amplitude and delayed NoGo P3 latency in violent, inpatient MDOs compared to healthy controls.
Introduction
Mentally disordered offenders (MDOs) demonstrate a variety of mental disorders, including schizophrenia spectrum disorders, substance abuse, and personality disorders, and pose significant challenges to the criminal justice system, with complex treatment needs and security concerns (1, 2). It is currently believed, however, that MDOs are involved in crime not primarily due to their mental disorders, but due to the same, general risk factors that are present in offenders without mental disorders (3). Indeed, an antisocial personality pattern characterized by poor self-control, restlessness, and impulsivity appears to be the most relevant clinical risk factor for recidivism in MDOs (4), and addressing this pattern should be a primary focus in treatment. Unfortunately, actual evidence specifically addressing treatment of MDOs is lacking, and although guidelines exist (5), there is an urgent need for more research in all areas of intervention (6, 7).
The frequent co-occurrence of disorders on the so-called externalizing spectrum, including ADHD, conduct disorder, antisocial personality disorder, and substance use disorders, is thought to reflect a heritable dispositional liability toward deficient impulse control (8–10). This broad dispositional liability, termed externalizing proneness or trait disinhibition, manifests behaviorally as poor self-control, irresponsibility, impatience, recklessness, insistence on immediate gratification, aggression, and engagement in various antisocial activities (11). Since these behavioral manifestations of trait disinhibition are important risk factors for recidivism in MDOs, it may be more fruitful for treatment efforts to target the continuously distributed trait disinhibition construct—representing the shared variance between the aforementioned behaviors—rather than addressing specific externalizing disorders individually (8).
Trait disinhibition may be described as a biobehavioral liability toward maladaptive behaviors that can be assessed using different modalities, including self-report instruments, behavioral task performance, and neurophysiological measurements (12). One such self-report instrument, the Externalizing Spectrum Inventory-Brief Form (ESI-BF), was developed specifically to facilitate efficient assessment of trait disinhibition (13). Importantly, the ESI-BF contains a subscale termed General Disinhibition (henceforth ESI-BFDIS) which contains no alcohol or drug-related items and no aggression-related items, thus offering a precise self-report assessment of the trait disinhibition construct.
Behavioral tasks that assess response inhibition, a core executive function necessary to suppress impulsive, routine, and automatic behaviors (14), are often used to probe the trait disinhibition construct. A wealth of research has shown that deficient response inhibition—that is, a reduced ability to inhibit prepotent responses—is robustly associated with externalizing spectrum disorders (15–17). Moreover, the association appears strongly genetically mediated, suggesting that both impaired response inhibition and externalizing disorders stem from the same trait disinhibition construct (10).
In addition to self-report instruments and behavioral tasks, event-related potentials (ERPs), providing a direct measurement of the brain's post-synaptic neural activity, may be used to bridge the gap between brain and behavior. Reduced amplitude of the P3 ERP—a positive voltage deflection peaking around 300 ms after stimulus onset—has emerged as a particularly promising, heritable biobehavioral marker of behaviors characterized by trait disinhibition (18–20). However, although previous research has established P3 amplitude reduction as robustly associated with externalizing disorders and antisocial behavior, studies on MDO samples remain scarce (21).
Going beyond P3 amplitude reduction, research suggests that the amplitude and latency of the P3 ERP may represent distinct endophenotypes. Whereas amplitude is thought to reflect the amount of cognitive resources or “neural power” being used, latency, often defined as the time point where the waveform peaks, may serve as an index of neural processing speed or “neural efficiency” (22, 23). Studies investigating P3 latency are limited, especially in antisocial populations, and results have been mixed. For instance, studies comparing violent and non-violent offenders have found evidence of both delayed P3 latency (24) and no differences in P3 latency (25). Similarly, whereas one study found that reduced P3 amplitude was associated with externalizing in youths, with no effect of P3 latency (26), another study found delayed P3 latencies in young offenders with conduct disorder symptoms compared to healthy controls (27). Delayed P3 latencies have also been associated with higher levels of aggression and hostility (28), and recent meta-analytic research found evidence of prolonged NoGo P3 latencies in ADHD, although findings remain inconclusive, both in offender and in non-offender samples (19, 29).
Apart from the distinction between amplitude and latency, different subcomponents of the P3 ERP are observed depending on the type of behavioral task used. Most ERP research in antisocial populations has focused on the so-called P3a or P3b components. The frontally distributed P3a, or “novelty P3,” is elicited by task-irrelevant infrequent stimuli, whereas the more parietally distributed P3b is associated with the detection of task-relevant infrequent stimuli. In contrast, infrequent stimuli that require response withholding—as in response inhibition tasks—elicits the frontally distributed NoGo P3 component (30). Although still debated, the NoGo P3 is thought to reflect processes related to monitoring and outcome evaluation (31–33). Longitudinal studies in children (34, 35) and young adults (36) have demonstrated that both P3a and P3b amplitude reduction is predictive of a wide range of behaviors characterized by trait disinhibition, including aggression and criminality. These findings are corroborated by meta-analytic studies showing that reduced amplitude and, although less consistently, longer latency of the P3a (21) and P3b (37) is associated with antisocial behavior. However, the bulk of previous research has focused on the P3a and P3b components. While there is emerging evidence suggesting that reduced amplitude of the NoGo P3 component is also associated with externalizing behavior (18, 20, 38–41), so far, no study has been done on an inpatient MDO sample.
Another ERP worth exploring is the N2. The N2 is a negative voltage deflection peaking around 200 ms after stimulus onset. As with the P3, different subcomponents are elicited depending on task and stimuli (42). The NoGo N2 is thought to reflect either the inhibition of a premature response plan, or the detection or resolution of a response conflict between executing and withholding a response (32, 33). Reduced NoGo N2 amplitude has been associated with poor response inhibition (43), alcohol abuse (44), ADHD (45), and impulsive-violent offending (46), rendering it a promising biobehavioral marker of trait disinhibition. Indeed, a recent meta-analysis found that reduced amplitude of the N2 ERP is robustly associated with antisocial behavior (47), although with inconclusive findings regarding psychopathic and subclinical, impulsive samples. A potential explanation, the authors suggest, is that N2 amplitudes may be reduced only at the severe end of the externalizing spectrum (i.e., in violent and antisocial individuals), and thus not necessarily in impulsive, but subclinical, samples, who may be able to recruit compensatory mechanisms. With regards to N2 latency, results have been more inconsistent. For instance, some studies report delayed N2 latencies in individuals with poor response inhibition (43) and alcohol dependence (48), while other studies, although observing reduced amplitudes, saw no concurrent delays in latency in individuals with alcohol abuse (44) and ADHD (45). Thus, while the N2 component may be a relevant biobehavioral marker for trait disinhibition, the inconsistency of previous findings warrants further research.
In sum, trait disinhibition is thought to reflect a dispositional liability toward a broad range of maladaptive behaviors characterized by impulse control problems that are relevant in forensic mental health settings. Reduced amplitude and prolonged latency of the N2 and P3 ERPs have emerged as promising candidates for transdiagnostic, biobehavioral markers of trait disinhibition, yet some important issues remain unresolved. First and foremost, studies in MDO samples remain scarce. Since MDOs are characterized by heterogeneity in both demographics, mental disorders, clinical needs, pharmacological treatment, criminal behaviors, and risk factors for recidivism (49–51), the scarcity of research in MDO samples makes it difficult to evaluate whether the N2 and P3 ERPs are reliable and useful in forensic mental health settings. Furthermore, while P3 amplitude reductions in externalizing and antisocial individuals are well-documented, most P3 research has focused on the P3a or P3b components. As emphasized in recent research (21), the NoGo P3 may be used to further test the “frontal dysfunction hypothesis” of antisocial behavior, which posits the existence of both structural and functional impairments in the prefrontal brain regions of impulsive antisocial individuals (52, 53).
The current study aimed to address these unresolved issues by investigating trait disinhibition using three different modalities, utilizing both between-group comparisons and a whole-sample correlation approach, in a sample of male, violent, inpatient MDOs and healthy controls. Specifically, we used the ESI-BFDIS as a self-report measure of trait disinhibition, and a Go/NoGo task combined with electroencephalography (EEG) to elicit NoGo N2 and P3 ERPs. We hypothesized that MDOs would present with increased levels of self-reported trait disinhibition, reduced response inhibition accuracy, reduced NoGo N2 and P3 amplitudes, as well as prolonged NoGo N2 and P3 latencies, compared to healthy controls. Further, we hypothesized that NoGo N2 and P3 amplitudes would be negatively correlated with self-reported trait disinhibition and positively correlated with response inhibition accuracy, and that NoGo N2 and P3 latencies would be positively correlated with self-reported trait disinhibition and negatively correlated with response inhibition accuracy.
Methods
All computational materials used in this study are described and publicly available at https://osf.io/yscdh/ (doi: 10.17605/OSF.IO/YSCDH).
Participants
Inpatient MDOs were recruited following completion of a parallel, ongoing study at a maximum security forensic psychiatric hospital in Sweden. All MDOs, following completion of the parallel study, were asked to participate in the current study if they were male and had, at any point, been sentenced for a violent crime, regardless of their psychiatric diagnosis. Exclusion criteria were a history of brain damage with lasting effects and if the treating psychiatrist deemed participation unsuitable due to current psychiatric status or safety concerns. A total of 29 MDOs agreed to participate. One MDO was removed from data analysis due to having less than four correct NoGo trials left after EEG preprocessing, and one MDO was excluded due to missing all self-report data. One MDO lost approximately one third of the EEG data due to technical issues during recording, although remaining data was retained for analysis. Thus, data from a total of 27 MDOs were available for analysis in the current study. All MDOs participated while on their usual medication (Table 1) and treatment plan, and had been sentenced to forensic psychiatric care with a so-called “special court supervision,” a form of supervision used in cases where there is a substantial risk of relapse into serious criminality due to severe mental disorder (54). All MDO participants received a voucher (~$10) for use either in the hospital's kiosk or at a local mall as reimbursement directly after completed participation.
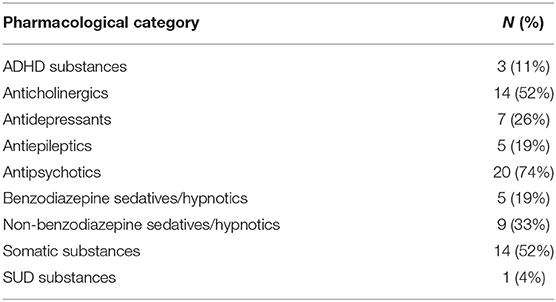
Table 1. Overview of pharmacological treatment in the MDO group (N = 27).
The control group consisted of healthy male volunteers recruited, using posters, e-mail, and verbal information, from staff at two hospitals as well as from students at a university. Exclusion criteria were having completed higher education (i.e., having received a degree after 3 years of higher education or more), having a history of brain damage with lasting effects, having a current major mental disorder, and drug use within the last 6 months. A total of 25 control group participants were recruited. Five control group participants had to be excluded after participation but prior to data analysis due to reporting drug use within the last 6 months prior to participation and/or having a history of brain damage with lasting effects in the self-report questionnaires. As such, data from 20 healthy controls was available for analysis. Control group participants received either a voucher (~$10) for use at a local mall or a movie ticket as compensation for the time spent in the study.
All participation was voluntary and based on informed, written consent. Data collection took place between May, 2017 and March, 2019.
Measures
The MDO group completed a large battery of questionnaires during participation in the parallel study, and completed one additional questionnaire prior to EEG acquisition. The control group answered a battery of questionnaires consisting of demographic questions (e.g., age, educational level), questions related to exclusion criteria, and several self-report instruments. The current study analyses data from the trait disinhibition questionnaire only.
Trait Disinhibition
Trait disinhibition was quantified using the ESI-BFDIS. The ESI-BF (13) is a shorter version of the Externalizing Spectrum Inventory (ESI) (9), developed to provide a self-report measure of a wide range of disinhibitory behaviors. The ESI-BF was co-translated into Swedish by two of the authors of the current study (CD and MW) and consists of 160 items rated from 0 (Not true at all) to 3 (Completely true). Scores on the items may be summed to three subscales: General Disinhibition, Callous-Aggression, and Substance Abuse. In the current study, only the 20 item ESI-BFDIS subscale was used, with possible scores ranging from 0 to 60. The ESI-BFDIS subscale includes items related to irresponsibility, impulsiveness, recklessness, as well as robbery, theft, and exploiting others for their own gain. Following recent recommendations (55), internal reliability was assessed using both Cronbach's alpha and McDonald's Omega. The ESI-BFDIS showed high internal reliability in the current study, with Cronbach's alpha = 0.91 and McDonald's Omega total = 0.93, similar to or above what has been reported in previous community (56–58), prison (58), and MDO samples (57).
Response Inhibition Task
A Go/NoGo task based on previous work (59, 60) and implemented using Presentation (Neurobehavioral Systems Inc.) was used to assess response inhibition and elicit ERPs. Participants were seated comfortably ~60 cm from the monitor (a 22 inch widescreen LCD TFT monitor, with a 1680 × 1050 pixel resolution running at 60 Hz) used to display task stimuli. They were instructed to respond as quickly and accurately as possible by pressing the left mouse button every time a Go stimulus (a white “X”) appeared, and to withhold a response whenever a NoGo stimulus (a white “K”) appeared. The Go and NoGo stimuli (“X” and “K”) were presented for 250 ms in white text against a black background, with a fixation point (+) shown between trials, located at the center of the screen (Figure 1A). The Helvetica font (size 14) was used for all stimuli. The inter-stimulus interval was pseudorandomly distributed between 1,000 and 3,000 ms at 500 ms increments. Prior to beginning the task, participants were given oral and written instructions, and then completed 10 practice trials requiring at least 50% correct responses. If <50% were correct, 10 new trials began, and so on, until the threshold for correct response was met. The task consisted of 326 trials, of which 274 (84%) were Go trials and 52 (16%) were NoGo trials, divided into two blocks of 162 trials each, with rest in between. Participants could rest however long they wanted. Go trials appeared with higher frequency than NoGo trials to establish a prepotency to respond, thus making it more difficult to inhibit responses. Two participants in the MDO group completed a longer version of the Go/NoGo task, which was since revised due to time constraints. Participants also completed a resting-state task following the Go/NoGo task, the results of which are not reported in the current study.
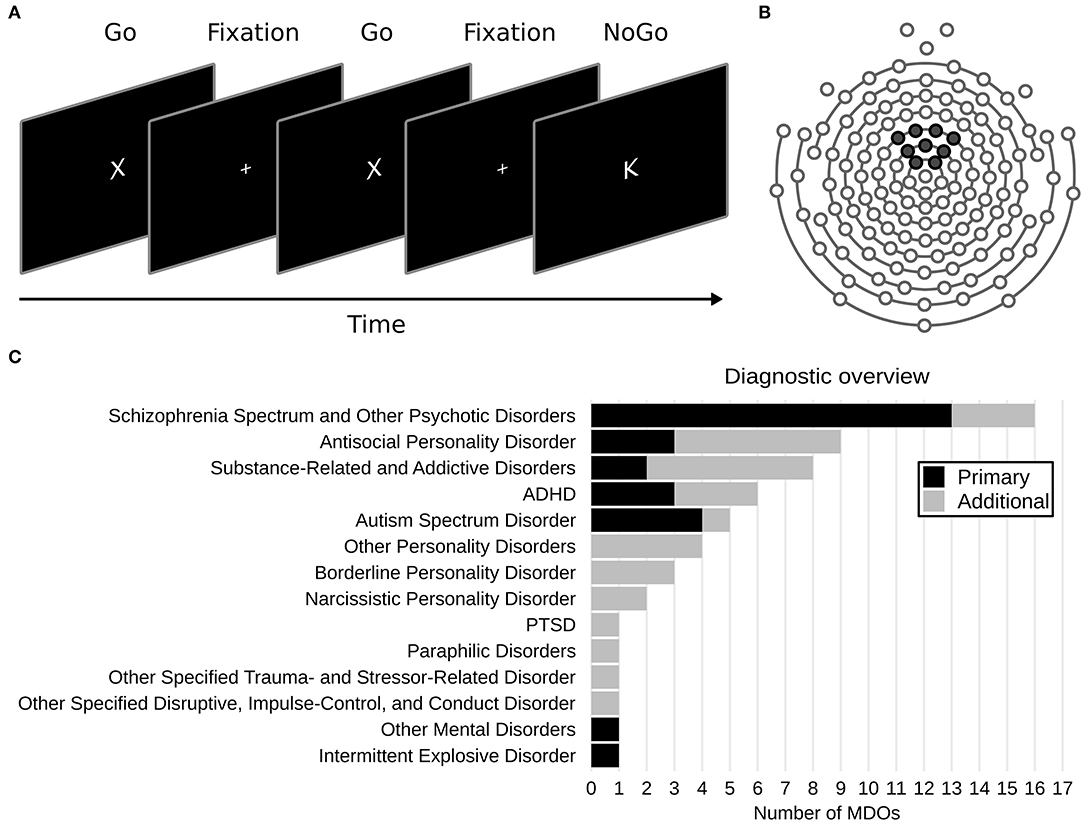
Figure 1. (A) Overview of the Go/NoGo task. (B) Layout of the 128 channel sensor net used. Black markers show the location of the nine electrodes used to create a frontocentral region of interest. (C) Overview of DSM-5 diagnoses in the mentally disordered offenders (MDOs) group.
Clinical Characteristics
MDOs' psychiatric diagnoses, criminal history, and pharmacological treatment at the time of the EEG recording were retrieved from medical records at the treatment facility. Diagnoses are presented according to the Diagnostic and Statistical Manual of Mental Disorders, Fifth Edition (DSM-5) (61). Pharmacological treatment was defined as all medication received in the 24 h preceding EEG recording, as well as any acting depot injections, and was coded as either “yes” or “no” for nine major pharmacological categories: antipsychotics, antidepressants, benzodiazepine sedatives/hypnotics, non-benzodiazepine sedatives/hypnotics, anticholinergics, antiepileptics, ADHD substances, SUD substances, and somatic substances.
Procedure
Ethics
This study was approved by the regional ethics review board in Linköping, Sweden (2017/56-31, 2018/7-32, 2018/321-32), and was conducted in accordance with the Declaration of Helsinki, including all participants providing voluntary, informed consent prior to participation.
EEG Data Acquisition
EEG was recorded using two computers and a high-impedance NetStation NA400 amplifier (Electrical Geodesics Inc.). One computer was used to deliver stimuli, record responses, and send digital triggers to the acquisition computer. The acquisition computer was connected to the amplifier and received digital triggers and EEG signals. EEG signals were recorded using 128 Ag/AgCl electrodes positioned in a Hydrocel Geodesic sensor net, using Net Station software (Electrical Geodesics Inc.), sampled at 1,000 Hz and referenced to the midline vertex electrode (Cz) during recording. Impedances for each electrode were kept below 100 KΩ when possible, although this was not achieved for all participants due to, e.g., time constraints. Since all recordings took place in cool and dry recording environments along with state-of-the-art filtering, artifact detection, and artifact rejection methods, high impedances should not have had a considerable impact on our results (62). The EEG acquisition procedure, including preparation, the Go/NoGo task, and an additional resting-state task, took ~45 min for each participant.
EEG Data Preprocessing
The EEG preprocessing pipeline was carried out using version 0.20.4 of the MNE-Python module (63, 64) running on Python 3.8.2, and largely adhered to current recommended procedures to ensure quality and reproducibility (65, 66). Apart from the removal and interpolation of bad channels, independent component analysis (ICA) components, and artifacts following visual inspection, the entire EEG data preprocessing pipeline was automated in order to maintain consistency and remove bias (all code is available online at the Open Science Framework; https://osf.io/yscdh/). Briefly, the raw EEG data was first visually inspected and bad channels marked. Data were then bandpass filtered from 0.1 to 30 Hz using current MNE recommendations (finite impulse response filter with zero phase and a Hamming windowed design) and bad channels were interpolated. Following interpolation, ICA was used to identify and remove artifacts. Since ICA can be sensitive to low frequency drifts, a copy of the raw data was bandpass filtered at 1 to 30 Hz and used to find ICA components. All ICA components were visually assessed and components representing eye blinks, saccades, heartbeats, and other non-brain related signals were marked and zeroed out from the raw data that was filtered using a 0.1 to 30 Hz bandpass. The data was then epoched around a stimulus-locked window of 1,000 ms (−200 to 800 ms after stimulus presentation) and baseline corrected (-200 to 0 ms). Finally, automated artifact rejection using Autoreject version 0.2.1 (67), with default values for peak-to-peak thresholding, was used to interpolate artifactual channels and remove contaminated epochs. There were no robust differences between MDOs and controls in the number of bad channels removed and interpolated, number of ICAs zeroed out, and number of correct NoGo trials left after artifact rejection (Supplementary Table 1). Preprocessed data was saved as comma separated values and imported into R for statistical analysis.
Statistical Analysis
Only non-subtracted, correct NoGo trials were analyzed in the current study (32). Since ERP measurements are more reliable when data is averaged across multiple electrodes (20, 68), all ERPs were based on a frontocentral region of interest (ROI) created by averaging data from nine electrodes (E20, E12, E5, E118, E13, E6, E112, E7, E106; Figure 1B). NoGo N2 amplitude was defined as the mean amplitude in the 225 to 325 ms window post-stimuli (NoGo N2WIN) and NoGo P3 amplitude was defined as the mean amplitude in the 325 to 625 ms window post-stimuli (NoGo P3WIN). The windows were chosen to avoid overlap between components, and are comparable to windows used in previous studies on forensic and antisocial participants (18, 38, 40, 69). Latency was defined as the 50% fractional area latency for each ERP, which is the time point before which 50% of the negative (for N2) or positive (for P3) area of the waveform is observed (70). Furthermore, in order to account for potential latency effects, we also calculated moving window amplitudes, defined as the mean amplitude 50 ms before and 50 ms after the 50% positive fractional area latency was observed (NoGo N2MOV and NoGo P3MOV).
All statistical analysis was carried out using the R statistical language, version 4.0.0 (71). Several packages from the Tidyverse (72) were used for intermediate data processing and plotting. We employed a fully Bayesian approach, and all statistical models were specified using the R package brms (73), which provides an interface to the Stan probabilistic programming language (74). All Bayesian priors were chosen to be robust and weakly informative, thus having negligible impact on obtained estimates while providing moderate regularization of potential outliers (75). Group differences were modeled using a robust linear regression approach using a Student's T distribution (76) while allowing unequal variances between groups, and correlations were modeled using a multivariate Student's T distribution with the correlation matrix drawn from an LKJ (2) prior (77). Model sampling was carried out using 8 chains with 4,000 iterations each, after 1,000 warmup iterations were discarded. All models were diagnosed using the R package ShinyStan by screening traceplots for convergence, ensuring that Gelman-Rubin diagnostics (R-hat) were <1.1, that the number of effective samples were > 10% of the total sample size, and that there were no issues with autocorrelation.
From group comparisons we report the estimated posterior medians of group differences and bias-corrected standardized group differences (MDOs relative to controls). Note that there are several standardized difference statistics (i.e., effect size statistics), and unfortunately, different authors use different notations and symbols. In light of this discrepancy, we follow recommendations (78) and use to denote what is often referred to as Cohen's d with Hedges's g correction (see Supplementary Materials for the exact equations used). Median values are presented along with 90% highest density intervals (HDIs; presented within square brackets). The 90% HDI may be interpreted such that there is a 90% probability—or, in non-mathematical terms, very likely (79)—that the estimate falls within its range. From correlation analyses, we report the median estimated correlation coefficient (ρ) along with 90% HDIs. For figures, we also plot the 66% HDI, which may be interpreted as a “likely region” (79). Finally, for readers unfamiliar with the Bayesian framework, we also report the probability of direction (PD), which is defined as the probability that an effect is of the same sign as the median's (80, 81). The PD ranges from 50 to 100% and may be interpreted as the probability that an effect exists (i.e., that the estimate is different from zero). It has a 1:1 correspondence to the frequentist p-value, such that .
Reliability Analysis
To ensure that Go/NoGo task performance and ERP measurements were reliable, we calculated the split-half reliability by estimating correlations between the averages of odd and even trials (12, 20), corrected using the Spearman-Brown formula (82) and denoted ρSB. The reliability of the Go/NoGo paradigm was high, with ρSB = 0.79 [0.65, 0.89] for median NoGo response time and ρSB = 0.89 [0.84, 0.94] for NoGo accuracy. With the exception of NoGo N2 latency, which showed only moderate reliability (ρSB = 0.62 [0.39, 0.78]), the reliability of all ERP measurements was high, with ρSB = 0.78 [0.62, 0.89] for NoGo N2WIN, ρSB = 0.77 [0.60, 0.88] for NoGo N2MOV, ρSB = 0.82 [0.71, 0.91] for NoGo P3WIN, ρSB = 0.91 [0.85, 0.95] for NoGo P3MOV, and ρSB = 0.81 [0.68, 0.90] for NoGo P3 latency.
Results
Demographics and Clinical Characteristics
Participants (N = 47) were on average 35.13 years old (SD = 10.76, range = 20–58). MDOs (N = 27) were ~ 4 years older than controls (N = 20), with an average of 36.63 years (SD = 9.85, range = 20–57) for MDOs and 33.10 years (SD = 11.82, range = 20–58) for controls. The estimated difference was 3.96 [−1.64, 9.6], with a small to moderate effect size ( = 0.37 [−0.14, 0.90]) and PD = 88%. The most frequent level of education in both groups was having finished high school (60% in the control group and 44% in the MDO group), although four participants in the MDO group (15%) had not finished primary school.
Overall, MDOs presented with a wide range of mental disorders. The most common primary diagnosis was schizophrenia spectrum and other psychotic disorders (N = 13, 48%), while the most common additional diagnoses were antisocial personality disorder (N = 6, 22%) and substance-related and addictive disorders (N = 6, 22%). Most MDOs had one additional diagnosis (i.e., median N = 1), ranging from 0 to 4 (see Figure 1C for an overview), and most MDOs also received three different pharmacological substances (range = 0–6), although four MDOs did not receive any pharmacological treatment at all (see Table 1 for an overview).
The criminal history of the MDOs was heterogeneous, with a mean total number of 7.30 sentences (SD = 7.10), ranging from 1 to 31. The mean age at first sentencing was 21.48 years (SD = 7.30, range = 15–39; note that 15 is the minimum age for criminal sentencing in Sweden), while the mean age at first reported crime was 13.33 years (SD = 4.40, range = 6–26). As per inclusion criteria, all MDOs had at some point been sentenced for a violent crime. Eight MDOs (30%) had committed acts of deadly violence, of which two (7%) repeatedly (i.e., on two or more occasions). A total of 23 MDOs (85%) had committed assault, including aggravated, of which 18 (67%) had done so repeatedly. Finally, six MDOs (22%) had committed sexual crimes, of which five (19%) repeatedly.
Self-Reported Trait Disinhibition and Go/NoGo Task Performance
MDOs presented with a higher degree of self-reported trait disinhibition than controls. The estimated median difference was over 19 points, with posterior estimates showing that, with 90% probability, MDOs scored between 14 and 24 points higher on the ESI-BFDIS than controls, indicating a large and robust difference in self-reported trait disinhibition between the two groups. Contrary to our hypotheses, MDOs were also able to inhibit responses during NoGo trials at a slightly higher rate than controls. With 90% probability, MDOs' NoGo accuracy rate was between 7% lower and 15% higher than controls, indicating a small and non-robust group difference. For details, see Table 2 and Figure 4A. Boxplots are presented in Figure 2.
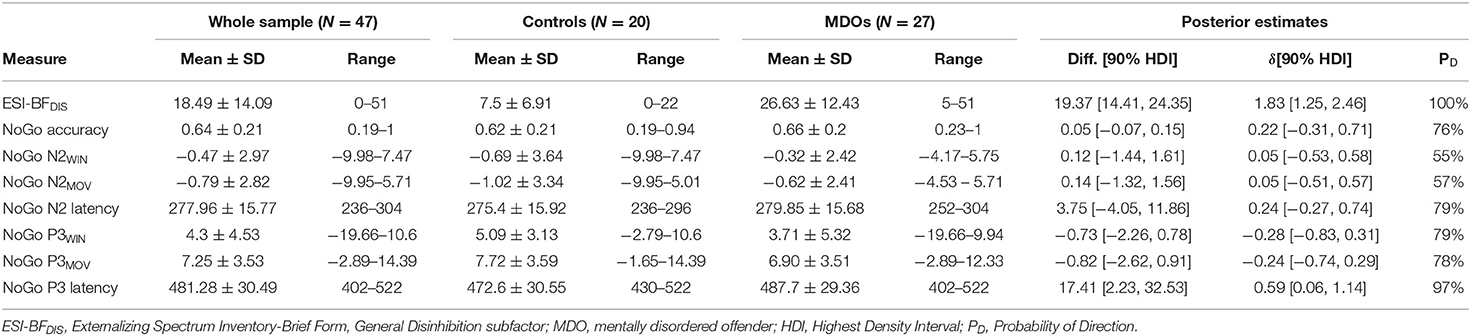
Table 2. Descriptive overview and posterior estimates of group differences.
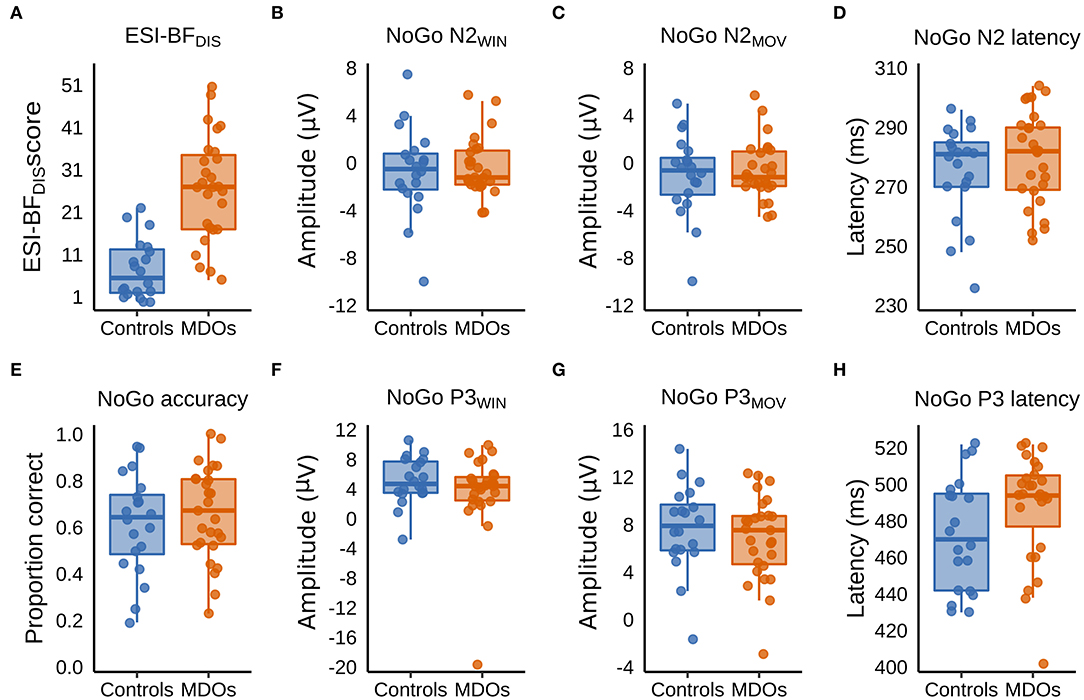
Figure 2. (A–H) Boxplots showing group differences in trait disinhibition, experimentally assessed response inhibition, and event-related potentials. ESI-BFDIS, Externalizing Spectrum Inventory-Brief Form, General Disinhibition subfactor; MDO, mentally disordered offender.
NoGo N2
Controls had larger (i.e., more negative) NoGo N2 amplitudes than MDOs, although the differences were both small and non-robust, as indicated by negligible effect sizes for both NoGo N2WIN and NoGo N2MOV (both median = 0.05) along with wide HDIs. Likewise, NoGo N2 latency was delayed in MDOs, with a median group difference of 3.75 ms, corresponding to a small effect size (median = 0.24), but the HDI remained relatively wide. The grand average waveform and associated topographic plots is shown in Figure 3, with full details presented in Table 2 and Figure 4A. Boxplots are presented in Figure 2.
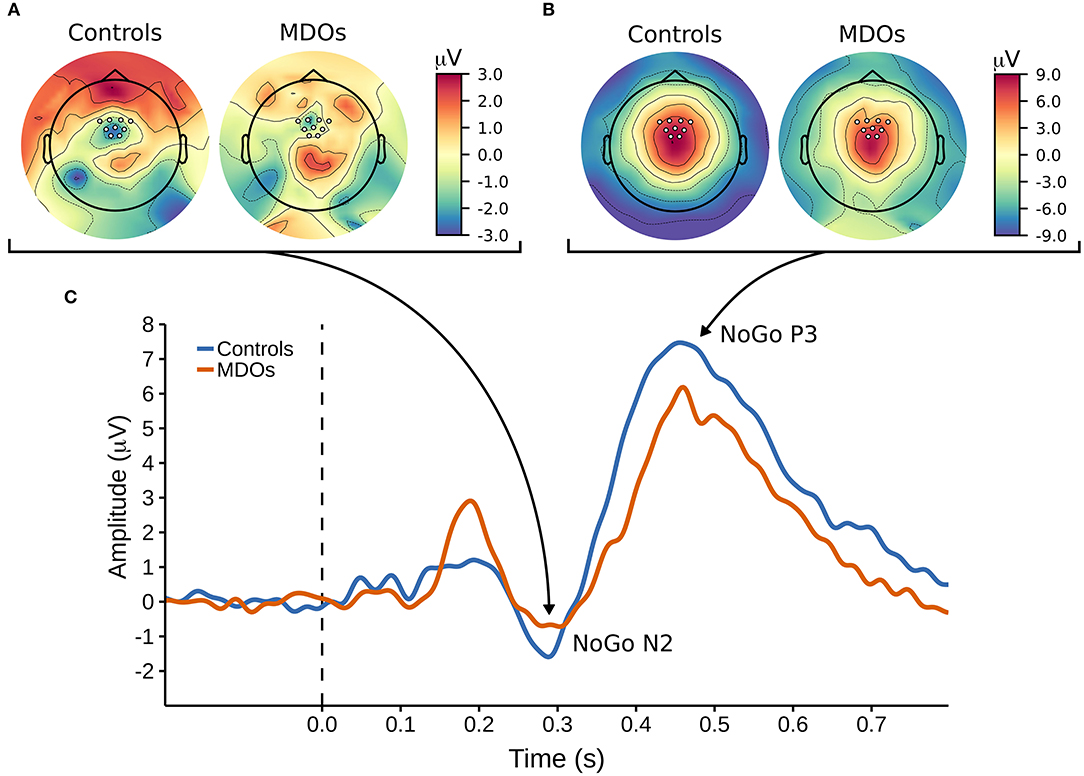
Figure 3. (A,B) Topographic plots showing the cortical distribution of amplitude at (A) 290 ms post-stimuli and (B) 450 ms post-stimulim, with white markers indicating the locations of the nine electrodes used to create a frontocentral region of interest. (C) The NoGo ERP waveform, with arrows pointing at corresponding topographic timepoints for the NoGo N2 and NoGo P3 components. MDOs, mentally disordered offenders.
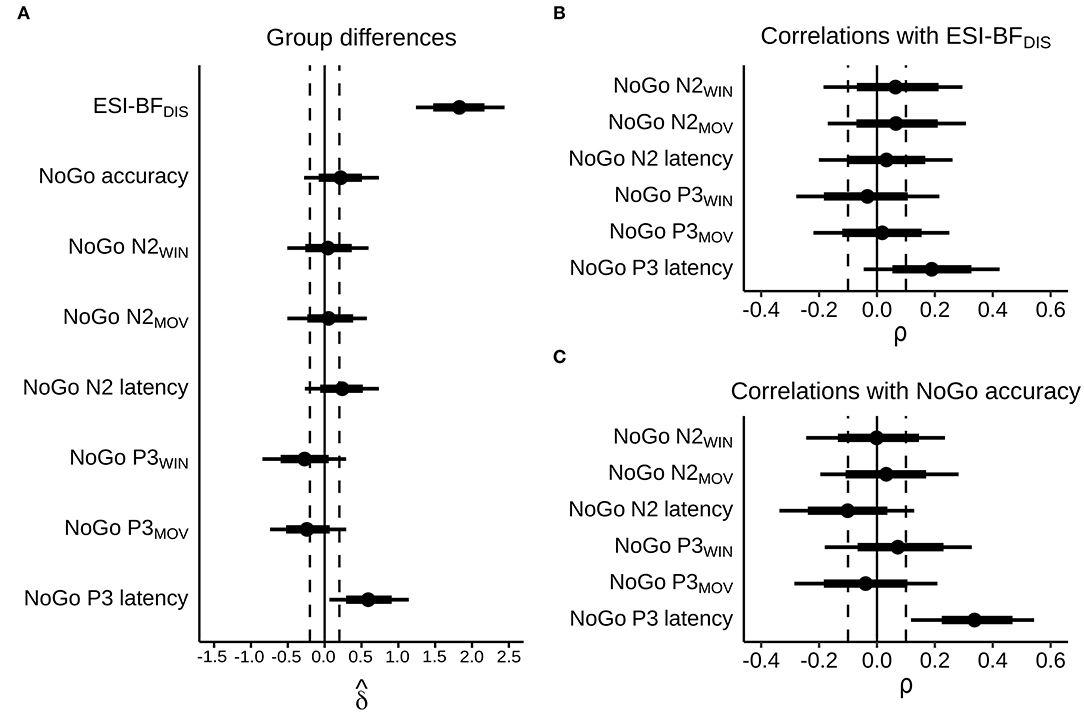
Figure 4. Posterior estimates, with dots representing posterior medians, thick bars representing 66% highest density intervals, and narrow bars representing 90% highest density intervals. Dashed lines indicate cutoffs for “small” effect sizes, corresponding to absolute values of = 0.2 and ρ = 0.1. (A) Estimated bias-corrected standardized group differences, MDOs relative to controls. (B) Estimated correlations with self-reported trait disinhibition in the whole sample. (C) Estimated correlations with NoGo accuracy in the whole sample.
NoGo P3
MDOs showed both reduced NoGo P3 amplitude and delayed latency compared to controls. MDOs estimated median NoGo P3WIN amplitude was 0.73 μV lower than controls, whereas MDOs estimated median NoGo P3MOV amplitude was 0.82 μV lower than controls, corresponding to small to moderate effect sizes (median = −0.28 and −0.24, respectively). MDOs estimated median NoGo P3 latency was 17.41 ms longer than controls, corresponding to a moderate effect size (median = 0.59). The grand average waveform and associated topographic plots is shown in Figure 3. Full details are presented in Table 2 and Figure 4A. Boxplots are presented in Figure 2.
Correlations
We observed a positive, small to moderate, robust correlation between NoGo P3 latency and NoGo accuracy, with ρ = 0.34 [0.12, 0.54], as well as a positive, small albeit relatively less robust correlation between NoGo P3 latency and ESI-BFDIS score, with ρ = 0.19 [−0.05, 0.42]. Thus, longer NoGo P3 latency was associated with better inhibitory control and, although less robustly, with a higher degree of trait disinhibition. Remaining correlations were either negligible (absolute ρ <0.1) or with wide HDIs, indicating high degrees of uncertainty. Details are presented in Table 3 and Figures 4B,C. Scatterplots are presented in Supplementary Figure 1.
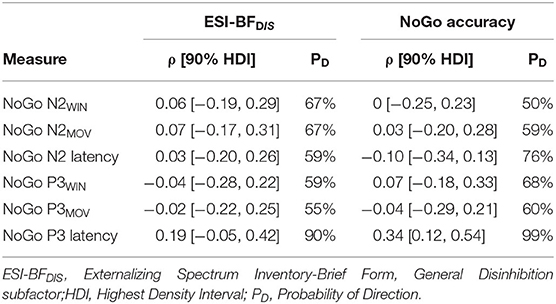
Table 3. Posterior estimates of correlations.
Exploratory Analyses
Since MDOs had delayed NoGo P3 latencies and, unexpectedly, also responded slightly more accurately on NoGo trials than controls, we explored whether MDOs also had longer median NoGo response times (RTs) than controls, and whether these measures were correlated with median NoGo RT. Note that these analyses were based on data from 20 controls and 26 MDOs, since one participant in the MDO group did not have any failed NoGo trials and thus no data on NoGo RT. MDOs had longer median NoGo RTs than controls, with a median group difference of 9.15 ms [−11.04, 28.53], corresponding to a small to moderate effect size ( = 0.29 [−0.33, 0.96]). Furthermore, median NoGo RT showed positive, moderate, and robust correlations with both NoGo accuracy (ρ = 0.32 [0.10, 0.55], PD = 98%) and NoGo P3 latency (ρ = 0.38 [0.15, 0.59], PD = 99%).
Discussion
The current study examined differences in self-reported trait disinhibition, response inhibition, and NoGo N2 and P3 ERPs in male, violent MDOs and healthy controls. In addition, we examined how these different measures were correlated with each other in the whole sample. In line with our hypotheses, we found evidence of higher levels of self-reported trait disinhibition, delayed NoGo P3 latencies, and reduced NoGo P3 amplitudes in MDOs compared to healthy controls. Furthermore, a positive correlation between NoGo P3 latency and self-reported trait disinhibition was observed. These findings suggest that the NoGo P3 ERP—especially NoGo P3 latency—may be feasible as a transdiagnostic, biobehavioral marker of trait disinhibition in MDOs, despite the considerable heterogeneity that characterizes this group, although several caveats are discussed below. In particular, the lack of a non-violent, psychiatric-only comparison group limits the interpretation of our findings. Only small and non-robust differences in NoGo N2 measures were observed, however, and all correlations with NoGo N2 measures were, again, small and non-robust.
As expected, and in line with previous research, MDOs were characterized by trait disinhibition both in a diagnostic sense, with a high prevalence of personality disorders, substance-related and addictive disorders, and ADHD, and in a transdiagnostic, dimensional sense, with substantially higher ESI-BFDIS scores than the control group. A majority of male MDOs in Sweden are diagnosed within the schizophrenia spectrum (54), and this was the case also in the current study. However, the total number (i.e., including additional diagnoses; Figure 1C) of personality disorders, substance-related and addictive disorders, and ADHD diagnoses was twice as high as the total number of schizophrenia spectrum or other psychotic disorders (32 vs. 16 diagnoses in total, respectively). The high prevalence of personality disorders, substance-related and addictive disorders, and ADHD aligns well with the substantially higher scores on the ESI-BFDIS in MDOs compared to controls, offering preliminary support for the use of the ESI-BFDIS as a reliable measure of trait disinhibition in Swedish forensic mental health settings, although proper validation studies are still required. Notably, MDOs scored ~19 points higher than controls on the ESI-BFDIS in the current study, which is higher than the 15 point difference between Dutch MDOs and community volunteers recently reported previously (57). Our findings in conjunction with prior research further highlight the importance of addressing behaviors characterized by trait disinhibition in MDOs, both in research and in treatment, and perhaps especially in recidivism prevention (3, 4).
Surprisingly, MDOs had an estimated accuracy rate of ~5% higher than controls. While this finding must be cautiously interpreted due to the relatively wide HDI and the small effect size, some discussion is warranted, since the effect was opposite to what was expected. The finding that MDOs' had a slightly better accuracy rate than controls, along with the finding of a robust, positive correlation between NoGo P3 latency and NoGo accuracy, prompted us to perform additional exploratory analyses. These analyses showed that MDOs had longer median NoGo RTs (i.e., median response time on failed NoGo trials) than controls, and revealed positive correlations between median NoGo RT and both NoGo P3 latency and NoGo accuracy (which are measured on successful NoGo trials). Since research suggests that the amplitude and latency of the P3 ERP may represent distinct endophenotypes (22), the positive correlation between NoGo P3 latency and median NoGo RT implies that less efficient neural information processing may attenuate the prepotency to quickly respond on NoGo trials. This attenuated prepotency to quickly respond could, in theory, result in higher NoGo accuracy, which was confirmed by the positive correlation between NoGo accuracy and median NoGo RT found in our exploratory analyses. Taken together, these findings indicate that the slightly higher accuracy rate and longer median NoGo RTs observed in the MDO group may in fact be related to less efficient neural information processing. That is, slower neural information processing—as evidenced by MDOs' longer NoGo P3 latency—may attenuate the prepotency to quickly respond on NoGo trials, which inadvertently leads to better NoGo accuracy. While interesting, this theory remains speculative and based on exploratory analyses, and should be further investigated in larger samples, preferably also comparing MDOs with a non-violent, psychiatric-only sample. For future research, it would be interesting to examine the effects of shorter inter-stimulus intervals. It is also possible that the observed difference was due to chance alone, and that we did not observe more robust group differences in NoGo accuracy because the Go/NoGo paradigm was too easy. A more demanding task, or a task with non-neutral stimuli, might have rendered different results, and should be further explored in future studies. Another critique against the Go/NoGo task is that performance on the task is substantially different from performance in real-world situations where response inhibition is required (14). Still, the use of a more complex task introduces additional confounding variables, takes more time to prepare, and is more difficult to perform, and thus might not be feasible in an MDO population.
Both the observed group differences in NoGo N2WIN and NoGo N2MOV, as well as the correlations between these measures and ESI-BFDIS scores and NoGo accuracy, were non-robust with negligible to small effect sizes. A more robust group difference in NoGo N2 latency—but with practically non-existent correlations—was observed, with MDOs demonstrating delayed NoGo N2 latency compared to controls. While this finding is in agreement with previous studies suggesting that delayed NoGo N2 latency may serve as a marker of impulsivity (83) and self-reported psychopathic traits (41), we did not observe any robust correlations between NoGo N2 latency and self-reported trait disinhibition, nor between NoGo N2 latency and response inhibition accuracy. Combined with the relatively low reliability of this ERP component, our findings remain difficult to evaluate. The use of a Go/NoGo task may offer some clues, however. Recent meta-analyses suggest that N2 amplitude reductions are systematically observed primarily in studies using the Stop-Signal Task (47, 84). The Stop-Signal Task is a measure of response cancellation, whereas the Go/NoGo is a measure of response inhibition, and while the two measures are similar they are not identical (85). Future studies should bear this in mind, and preferably compare results from both tasks. Another possibility is that if the NoGo N2 reflects conflict monitoring, these processes may remain intact in MDOs, while later, evaluative processes reflected in the NoGo P3 are diminished.
To the best of our knowledge, this is the first study to demonstrate reduced NoGo P3 amplitudes and delayed NoGo P3 latencies in violent, inpatient MDOs compared to healthy controls. Although our findings do exhibit uncertainty in the form of relatively wide HDIs—likely due to the small sample size—the Bayesian analyses demonstrated with relatively high probability (79% and 78%) that MDOs' NoGo P3 amplitude was lower than controls, and with high probability (97%) that MDOs' NoGo P3 latency was longer than controls. As a safeguard against potential latency differences between the two groups, we quantified amplitude using both a standard fixed window approach as well as a moving window approach. Since the group difference in NoGo P3 amplitude was similar for both NoGo P3MOV and NoGo P3WIN, the later peaking of the NoGo P3 latency in MDOs should not have artifactually driven the lower amplitudes among MDOs. Taken together, these findings align with previous research showing reduced NoGo P3 amplitude in antisocial samples (38–41) and, to some extent, individuals with schizophrenia (86). In addition, the estimated median effect sizes in the current study were larger than previous meta-analytic research showing reduced P3 amplitudes (d = 0.25) and delayed P3 latencies (d = 0.13) in antisocial samples (37) (note that the authors use positive effect sizes to indicate both reduced amplitude and delayed latencies in antisocial individuals compared to controls), as well as comparable to more recent work showing reduced NoGo P3 amplitudes (d = −0.57) and delayed NoGo P3 latencies (d = 0.35) in individuals with ADHD (87).
Since the NoGo P3 component is thought to reflect outcome monitoring or outcome evaluation after successful inhibitions (31–33), with amplitude reflecting the amount of cognitive resources used and latency serving as an index of neural efficiency (22, 23), it is possible that MDOs have deficits both in the allocation of cognitive resources during monitoring or evaluation of their behavior, as well as in the efficiency of such allocation (88). If monitoring and evaluation capabilities are reduced, it may be difficult to correctly interpret the environment and evaluate possible consequences of one's behavior. Supporting this view, previous research has demonstrated that increased NoGo P3 amplitude predicts more self-control in a social decision-making task, suggesting that deficits in the neural correlates of outcome monitoring/evaluation may lead to adverse outcomes in social contexts (89).
Substantial efforts have been made to pinpoint the neural generators of the NoGo N2 and NoGo P3 ERPs, although findings remain inconclusive. Since successful inhibition during the Go/NoGo task results in increased hemodynamic blood flow across several regions, including the superior, middle, and inferior frontal gyri, the cingulate and insular cortices, as well as temporal, parietal, and occipital areas (90), it seems unlikely that NoGo ERPs are generated by a single source. Indeed, converging evidence suggests that the NoGo N2 and P3 components reflect the sum of several, concurrently activated neural networks (91). Interestingly, however, both components can be traced to the midcingulate cortex (MCC), with contributions from the precentral, middle frontal, inferior frontal, and insular cortices (91–95). It was recently suggested that these contributing regions reflect top-down selective attention rather than response inhibition, positioning the MCC as the primary source of inhibitory processing (96). Corroborating these findings are studies placing the neural generator of the NoGo P3 in the dorsal anterior cingulate cortex [dACC; (97–99)], a region which largely corresponds to the MCC [and, to add further confusion, which is sometimes also referred to as the caudal ACC; for thorough reviews, see (100, 101)]. The exact functions of the MCC/dACC region are not known, although it contributes to both cognitive control and decision making (102), including conflict monitoring and outcome evaluation (103, 104). Interestingly, the gyral regions of the MCC are thought to play an important role in social cognition and social behavior, especially in predicting and monitoring the outcomes of decisions in social situations (105), which is in line with previous findings of NoGo P3 amplitude predicting more self-control during social decision-making (89). It is possible, therefore, that the reduced NoGo P3 amplitude and delayed NoGo P3 latency in the MDO group stem from a dysfunctional dorsal anterior or midcingulate cortex, which would be at least partly in line with the “frontal dysfunction hypothesis” of antisocial behavior (52, 53), depending on how “frontal” is defined. It must be mentioned, however, that research has also localized the source of the NoGo P3 to the left orbitofrontal cortex, which is inconsistent with a primary neural generator for the NoGo P3 in the MCC/dACC (106). There are also indications of a regional dissociation between the N2 and P3 components, with the former associated with anterior MCC activity and the latter with posterior MCC activity (33). Thus, the lack of NoGo N2 effects in the current study may reflect a more posterior MCC dysfunction in MDOs in the current study, although this remains speculative until further examined.
As expected, the MDOs were heterogeneous both in terms of mental disorders, criminal history, and pharmacological treatment (Figure 1C, Table 1). Like the majority of male MDOs in Sweden (54), most MDOs in the current study were diagnosed within the schizophrenia spectrum. Notwithstanding the wealth of research demonstrating P3 amplitude reductions in individuals characterized by trait disinhibition, reduced P3 amplitudes and prolonged P3 latencies have also been reported and replicated in individuals with schizophrenia [for reviews, see (107, 108)]. Again, research investigating the NoGo P3 component specifically is less common, but a recent study comparing NoGo P3 amplitude and latency in patients with schizophrenia and healthy controls found evidence of reduced NoGo P3 amplitude, but not delayed NoGo P3 latency, in patients compared to controls (86). Thus, it is difficult to disentangle whether the observed differences in NoGo P3 amplitude and latency in the current study were related to trait disinhibition, schizophrenia spectrum disorders, or other mental disorders. For instance, previous research (109), using a visual oddball task and a 30-item Trait Disinhibition scale from the full ESI (ESIDIS), found a negative correlation between ESIDIS and P3b amplitude (r ~ −0.18) in a large (N = 419) sample of adult twins. Similarly, recent research found that higher ESI-BFDIS scores predicted lower NoGo P3 amplitude (β = −0.16), after controlling for gender effects, in a sample (N = 142) of undergraduate students (20). In contrast, the correlations between ESI-BFDIS score and NoGo P3 amplitude measures in the current study were practically zero. Our results may differ from previous findings due to several reasons, although perhaps most notably due differences in sample size and characteristics (MDOs plus healthy controls vs. only healthy participants). Still, recent research suggests that NoGo P3 latency may in fact be unrelated to schizophrenia (86). In the current study, we observed a positive and robust correlation between ESI-BFDIS score and NoGo P3 latency (ρ = 0.19), suggesting that trait disinhibition may be associated with less efficient neural processing during outcome evaluation. This finding aligns well with the observed group differences in ESI-BFDIS score and NoGo P3 latency, and warrants further research into the role of the NoGo P3 component as a transdiagnostic marker of trait disinhibition in MDOs.
Taken together, thus, it is possible that a dysfunctional MCC/dACC leads to inefficient neural processing during outcome evaluation, subsequently increasing the risk of behaviors characterized by trait disinhibition. However, several caveats, in addition to those already mentioned, must be taken into consideration. For instance, physically active, fit individuals demonstrate increased P3 amplitudes and reduced P3 latencies compared to sedentary individuals (110, 111), and previous studies have highlighted the poor physical state of Swedish inpatient MDOs (112). Furthermore, we did not assess any potential effects of mental fatigue, which has been shown to lead to lower NoGo P3 amplitudes (113, 114). Finally, MDOs' pharmacological treatment may also have affected our results. Most MDOs (74%) received some form of antipsychotic medication. Studies have shown that NoGo N2 amplitude is modulated by dopamine D1 receptors in the nigrostriatal system, while NoGo P3 amplitude is modulated by dopamine D2 receptors in the mesocorticolimbic dopamine system, such that higher receptor efficiency is associated with larger amplitudes and better response inhibition performance (31, 115). Typical antipsychotics act as dopamine D2 antagonists, while atypical antipsychotics are weaker dopamine D2 receptor antagonists, but also target other receptors, including dopamine D1 (116–118). In addition, 26% of MDOs in the current study received some form of antidepressant. Treatment using citalopram, a selective serotonin reuptake inhibitor commonly used as an antidepressant, has been demonstrated to result in NoGo P3 amplitude increases relative to placebo treatment (119). Any potential variability introduced by pharmacological treatment may, to some extent, be ameliorated using larger sample sizes in future studies.
Clinical Implications
The results of this study may have several clinical implications. We found a high degree of both diagnostic and transdiagnostic trait disinhibition in the study's sample of male, violent, inpatient MDOs. Since the relationship between mental disorder and recidivism seems largely indirect, efforts aimed at reducing recidivism rates in MDOs should explicitly target behaviors characterized by trait disinhibition (3, 4). From a biobehavioral point of view, our findings could also be of importance for future studies on recidivism in MDOs. The long-term stability of the NoGo P3 makes it particularly suitable for use in clinical settings (120), and recent studies show that neurobiological data can be used to enhance the prediction of recidivism (121–123). In clinical practice, such models may be used to, for instance, direct treatment efforts to where they are most needed. Relatedly, we suggested that MDOs may have deficits in efficiently allocating enough cognitive resources during monitoring or evaluation of their behavior, which possibly can lead to impaired self-control in social decision-making (89). Thus, treatment aimed at improving MDOs' self-control in social contexts may be important. Other promising developments along these lines include the Reasoning and Rehabilitation for Mentally Disordered Offenders Programme (R&R2MP), which has been successful in decreasing disruptive behavior and improving rational problem-solving and attitudes toward violence in MDOs (124, 125), and recent work suggesting that Cognitive Remediation Training (CRT) may improve cognitive function in MDOs with schizophrenia or schizoaffective disorder (126). Finally, pharmacological treatment may also be an avenue worth exploring in more detail. Some encouraging progress has been made in individuals with ADHD, particularly on the effects of methylphenidate, a stimulant often used in ADHD treatment. Methylphenidate is thought to enhance the mechanisms involved in inhibiting automated response tendencies, particularly in the MCC/dACC (127). This effect might be related to modulation of the mesocorticolimbic dopamine system, since methylphenidate acts by prolonging dopamine availability in the synaptic cleft, leading to stronger dopamine D2 receptor activation (128). Studies in children with ADHD have found improved response inhibition and increased NoGo P3 amplitudes following methylphenidate treatment (129–131), and a study on adults with ADHD found that 6 weeks of methylphenidate treatment led to robust increases in inhibitory-related activation in the frontal cortex and the ACC (132). In contrast, another study found that symptomatic improvements following 6–8 weeks of methylphenidate treatment in a sample of adolescents with ADHD were related to reduced activity in, among others, the ACC (133). The authors speculate that methylphenidate treatment may have reduced the need for prefrontal inhibitory efforts, thereby leading to reduced prefrontal activation. Still, although the effects on NoGo P3 seem promising, methylphenidate has yet to be tested in MDO samples, possibly due to the fact that methylphenidate may induce psychotic symptoms.
Strengths and Limitations
Some notable strengths of this study include the well-characterized sample of violent, inpatient MDOs, the robust, Bayesian statistical approach, and the open practices used. Studies on inpatient, violent MDOs are rare, in particular due to security concerns and difficulties in recruiting. Thus, while the limited and heterogeneous sample hinders the robustness and generalizability of our results, the current study takes an important step toward evaluating results of previous research in the domain of forensic mental health. Besides facilitating robustness by allowing the use of non-Gaussian likelihood functions, Bayesian statistics makes it possible to report genuine probability statements about the parameters of interest that, importantly, remain equally valid regardless of sample size (134), which is important in studies with smaller sample sizes. Finally, all computational resources used in the current study are publicly available at the Open Science Framework (https://osf.io/yscdh/) for anyone to review and reuse, and we urge other researchers to do the same.
One limitation, apart from the several caveats mentioned previously, was that the current study was not pre-registered, and all results should therefore be cautiously interpreted until replicated in independent samples. Furthermore, the inclusion of male, violent MDOs limits generalizability to non-violent and female MDOs. The bivariate mapping approach used in the current study is not optimal, since individual variation due to anxiousness, distractibility, or mental fatigue can affect task performance and lead to variance that is not specific to what the task is designed to measure (135). Unfortunately, no data on previous violent behavior (e.g., criminal records) or symptoms of mental disorder was available for control group participants. Future studies should consider incorporating such measures in order to increase the robustness of findings. Finally, a methodological limitation is the moderate reliability of the NoGo N2 latency observed in the current study. Previous research has found that the N2 ERP requires more trials than does the P3 in order to achieve similar levels of internal consistency (136). Although the average number of trials in the current study (mean N = 28) should be more than adequate, the number of trials ranged between 6 and 47 in the whole sample. Thus, it is possible that the number of trials were not sufficient for some participants, rendering NoGo N2 latency less reliable than the other measures. This could be ameliorated in future work by using a higher number of Go/NoGo trials.
Summary and Directions for Future Research
To the best of our knowledge, this is the first study to demonstrate delayed NoGo P3 latency and attenuated NoGo P3 amplitude in inpatient, violent MDOs compared to healthy controls. With the above-mentioned limitations in mind, our findings are indicative of aberrant post-synaptic neurotransmission related to outcome monitoring or outcome evaluation in MDOs, possibly as a result of MCC/dACC dysfunction. Although in line with the “frontal dysfunction hypothesis” of antisocial behavior, further research using a larger MDO sample, preferably with EEG in conjunction with other neuroimaging techniques, is necessary to further elucidate potential MCC/dACC dysfunction in MDOs. Future research may also want to consider using other response inhibition tasks, such as the Stop-Signal Task, or social decision-making tasks, which might better reflect real-life scenarios of response inhibition. Composite measures and a structural modeling approach, more in line with the biobehavioral framework suggested by Venables et al. (12) and Patrick et al. (135), should also be considered. Such an approach requires larger sample sizes, which may be difficult to obtain in MDO populations, and multicenter studies are therefore recommended. Finally, although legislation concerning MDOs differs between countries, the current study represents an important step toward addressing the scarcity of neuroscientific research in inpatient MDOs, and sets the stage for future research that may want to investigate differences in NoGo P3 ERP between violent MDOs and non-violent psychiatric patients.
Data Availability Statement
The raw data supporting the conclusions of this article will be made available by the authors, without undue reservation.
Ethics Statement
The studies involving human participants were reviewed and approved by the regional ethics review board in Linköping, Sweden (2017/56-31, 239 2018/7-32, and 2018/321-32). The patients/participants provided their written informed consent to participate in this study.
Author Contributions
CD, MW, and PA developed the study concept. ER contributed to the study design. Data collection and data analysis was performed by CD. CD performed EEG data preprocessing under supervision from ER. CD drafted the paper. MW, PA, ER, and MB provided critical revisions. All authors approved the final version of the paper for submission.
Funding
This study was supported by grants from Region Kronoberg, Södra Sjukvårdsregionen, the Swedish state under the agreement between the Swedish government and the county councils, the ALF-agreement (432551 and 819681), and from the Swedish Research Council for Health, Working Life and Welfare (2018-01409).
Conflict of Interest
The authors declare that the research was conducted in the absence of any commercial or financial relationships that could be construed as a potential conflict of interest.
Acknowledgments
Special thanks to Natalie Laporte and Johan Berlin for their work with data collection. The authors are grateful to the Regional Forensic Psychiatric Clinic in Växjö, Sweden, the Rågården Forensic Psychiatric Hospital in Gothenburg, Sweden, and Marie Torstensson Levander and her colleagues at the Department of Criminology, Malmö University, Sweden, for help and support during data collection.
Supplementary Material
The Supplementary Material for this article can be found online at: https://www.frontiersin.org/articles/10.3389/fpsyt.2020.577491/full#supplementary-material
References
1. Fazel S, Fimińska Z, Cocks C, Coid J. Patient outcomes following discharge from secure psychiatric hospitals: systematic review and meta-analysis. Br J Psychiatry. (2016) 208:17–25. doi: 10.1192/bjp.bp.114.149997
2. Soderstrom IR. Mental illness in offender populations. J Offender Rehabil. (2007) 45:1–17. doi: 10.1300/J076v45n01_01
3. Skeem JL, Winter E, Kennealy PJ, Louden JE, Tatar JR II. Offenders with mental illness have criminogenic needs, too: toward recidivism reduction. Law Hum Behav. (2014) 38:212–24. doi: 10.1037/lhb0000054
4. Bonta J, Blais J, Wilson HA. A theoretically informed meta-analysis of the risk for general and violent recidivism for mentally disordered offenders. Aggress Violent Behav. (2014) 19:278–87. doi: 10.1016/j.avb.2014.04.014
5. Völlm BA, Clarke M, Herrando VT, Seppänen AO, Gosek P, Heitzman J, et al. European Psychiatric Association (EPA) guidance on forensic psychiatry: Evidence based assessment and treatment of mentally disordered offenders. Eur Psychiatry. (2018) 51:58–73. doi: 10.1016/j.eurpsy.2017.12.007
6. Barnao M, Ward T. Sailing uncharted seas without a compass: a review of interventions in forensic mental health. Aggr Violent Behav. (2015) 22:77–86. doi: 10.1016/j.avb.2015.04.009
7. Howner K, Andiné P, Bertilsson G, Hultcrantz M, Lindström E, Mowafi F, et al. Mapping systematic reviews on forensic psychiatric care: a systematic review identifying knowledge gaps. Front Psychiatry. (2018) 9:452. doi: 10.3389/fpsyt.2018.00452
8. Krueger RF, Hicks BM, Patrick CJ, Carlson SR, Iacono WG, McGue M. Etiologic connections among substance dependence, antisocial behavior, and personality: modeling the externalizing spectrum. J Abnorm Psychol. (2002) 111:411–24. doi: 10.1037/0021-843X.111.3.411
9. Krueger RF, Markon KE, Patrick CJ, Benning SD, Kramer MD. Linking antisocial behavior, substance use, and personality: an integrative quantitative model of the adult externalizing spectrum. J Abnorm Psychol. (2007) 116:645–66. doi: 10.1037/0021-843X.116.4.645
10. Young SE, Friedman NP, Miyake A, Willcutt EG, Corley RP, Haberstick BC, et al. Behavioral disinhibition: liability for externalizing spectrum disorders and its genetic and environmental relation to response inhibition across adolescence. J Abnorm Psychol. (2009) 118:117–30. doi: 10.1037/a0014657
11. Patrick CJ, Fowles DC, Krueger RF. Triarchic conceptualization of psychopathy: developmental origins of disinhibition, boldness, and meanness. Dev Psychopathol. (2009) 21:913–38. doi: 10.1017/S0954579409000492
12. Venables NC, Foell J, Yancey JR, Kane MJ, Engle RW, Patrick CJ. Quantifying inhibitory control as externalizing proneness: a cross-domain model. Clin Psychol Sci. (2018) 6:561–80. doi: 10.1177/2167702618757690
13. Patrick CJ, Kramer MD, Krueger RF, Markon KE. Optimizing efficiency of psychopathology assessment through quantitative modeling: development of a brief form of the externalizing spectrum inventory. Psychol Assess. (2013) 25:1332–48. doi: 10.1037/a0034864
14. Diamond A. Executive functions. Annu Rev Psychol. (2013) 64:135–68. doi: 10.1146/annurev-psych-113011-143750
15. Castellanos-Ryan N, Rubia K, Conrod PJ. Response inhibition and reward response bias mediate the predictive relationships between impulsivity and sensation seeking and common and unique variance in conduct disorder and substance misuse. Alcohol Clin Exp Res. (2011) 35:140–55. doi: 10.1111/j.1530-0277.2010.01331.x
16. Nigg JT, Wong MM, Martel MM, Jester JM, Puttler LI, Glass JM, et al. Poor response inhibition as a predictor of problem drinking and illicit drug use in adolescents at risk for alcoholism and other substance use disorders. J Am Acad Child Adolesc Psychiatry. (2006) 45:468–75. doi: 10.1097/01.chi.0000199028.76452.a9
17. Wang FL, Chassin L, Lee M, Haller M, King K. Roles of response inhibition and gene-environment interplay in pathways to adolescents' externalizing problems. J Res Adolesc. (2017) 27:258–77. doi: 10.1111/jora.12270
18. Brennan GM, Baskin-Sommers AR. Brain-behavior relationships in externalizing: P3 amplitude reduction reflects deficient inhibitory control. Behav Brain Res. (2018) 337:70–9. doi: 10.1016/j.bbr.2017.09.045
19. Yoon HH, Malone SM, Burwell SJ, Bernat EM, Iacono WG. Association between P3 event-related potential amplitude and externalizing disorders: a time-domain and time-frequency investigation of 29-year-old adults. Psychophysiology. (2013) 50:595–609. doi: 10.1111/psyp.12045
20. Ribes-Guardiola P, Poy R, Patrick CJ, Moltó J. Electrocortical measures of performance monitoring from go/no-go and flanker tasks: differential relations with trait dimensions of the triarchic model of psychopathy. Psychophysiology. (2020) 57:e13573. doi: 10.1111/psyp.13573
21. Pasion R, Fernandes C, Pereira MR, Barbosa F. Antisocial behaviour and psychopathy: uncovering the externalizing link in the P3 modulation. Neurosci Biobehav Rev. (2018) 91:170–86. doi: 10.1016/j.neubiorev.2017.03.012
22. van Dinteren R, Arns M, Jongsma MLA, Kessels RPC. P300 development across the lifespan: a systematic review and meta-analysis. PLoS ONE. (2014) 9:e87347. doi: 10.1371/journal.pone.0087347
23. Blakey R, Ranlund S, Zartaloudi E, Cahn W, Calafato S, Colizzi M, et al. Associations between psychosis endophenotypes across brain functional, structural, and cognitive domains. Psychol Med. (2018) 48:1325–40. doi: 10.1017/S0033291717002860
24. Drake ME, Pakalnis A, Brown ME, Hietter SA. Auditory event related potentials in violent and nonviolent prisoners. Eur Arch Psychiatry Neurol Sci. (1988) 238:7–10. doi: 10.1007/BF00381072
25. Bernat EM, Hall JR, Steffen BV, Patrick CJ. Violent offending predicts P300 amplitude. Int J Psychophysiol. (2007) 66:161–7. doi: 10.1016/j.ijpsycho.2007.03.021
26. Gilmore CS, Malone SM, Iacono WG. Is the P3 amplitude reduction seen in externalizing psychopathology attributable to stimulus sequence effects? Psychophysiology. (2012) 49:248–51. doi: 10.1111/j.1469-8986.2011.01299.x
27. Hung AY, Ahveninen J, Cheng Y. Atypical mismatch negativity to distressful voices associated with conduct disorder symptoms. J Child Psychol Psychiatry. (2013) 54:1016–27. doi: 10.1111/jcpp.12076
28. Bond AJ, Surguy SM. Relationship between attitudinal hostility and P300 latencies. Prog Neuropsychopharmacol Biol Psychiatry. (2000) 24:1277–88. doi: 10.1016/S0278-5846(00)00143-3
29. Helfritz-Sinville LE, Stanford MS. Looking for trouble? Processing of physical and social threat words in impulsive and premeditated aggression. Psychol Rec. (2015) 65:301–14. doi: 10.1007/s40732-014-0106-z
30. Polich J. Updating P300: an integrative theory of P3a and P3b. Clin Neurophysiol. (2007) 118:2128–48. doi: 10.1016/j.clinph.2007.04.019
31. Beste C, Willemssen R, Saft C, Falkenstein M. Response inhibition subprocesses and dopaminergic pathways: basal ganglia disease effects. Neuropsychologia. (2010) 48:366–73. doi: 10.1016/j.neuropsychologia.2009.09.023
32. Gajewski PD, Falkenstein M. Effects of task complexity on ERP components in Go/Nogo tasks. Int J Psychophysiol. (2013) 87:273–8. doi: 10.1016/j.ijpsycho.2012.08.007
33. Huster RJ, Enriquez-Geppert S, Lavallee CF, Falkenstein M, Herrmann CS. Electroencephalography of response inhibition tasks: functional networks and cognitive contributions. Int J Psychophysiol. (2013) 87:217–33. doi: 10.1016/j.ijpsycho.2012.08.001
34. Gao Y, Raine A, Venables PH, Mednick SA. The association between p3 amplitude at age 11 and criminal offending at age 23. J Clin Child Adolesc Psychol. (2013) 42:120–30. doi: 10.1080/15374416.2012.719458
35. Petersen IT Hoyniak CP Bates JE Staples AD Molfese DL. A longitudinal, within-person investigation of the association between the P3 ERP component and externalizing behavior problems in young children. J Child Psychol Psychiatry. (2018) 59:1044–51. doi: 10.1111/jcpp.12975
36. Yoon HH, Malone SM, Iacono WG. Longitudinal stability and predictive utility of the visual P3 response in adults with externalizing psychopathology. Psychophysiology. (2015) 52:1632–45. doi: 10.1111/psyp.12548
37. Gao Y, Raine A. P3 event-related potential impairments in antisocial and psychopathic individuals: a meta-analysis. Biol Psychol. (2009) 82:199–210. doi: 10.1016/j.biopsycho.2009.06.006
38. Verona E, Bresin K. Aggression proneness: transdiagnostic processes involving negative valence and cognitive systems. Int J Psychophysiol. (2015) 98:321–9. doi: 10.1016/j.ijpsycho.2015.03.008
39. Verona E, Sprague J, Sadeh N. Inhibitory control and negative emotional processing in psychopathy and antisocial personality disorder. J Abnorm Psychol. (2012) 121:498–510. doi: 10.1037/a0025308
40. Guan M, Liao Y, Ren H, Wang X, Yang Q, Liu X, et al. Impaired response inhibition in juvenile delinquents with antisocial personality characteristics: a preliminary ERP study in a Go/Nogo task. Neurosci Lett. (2015) 603:1–5. doi: 10.1016/j.neulet.2015.06.062
41. Kim YY, Jung YS. Reduced frontal activity during response inhibition in individuals with psychopathic traits: an sLORETA study. Biol Psychol. (2014) 97:49–59. doi: 10.1016/j.biopsycho.2014.02.004
42. Folstein b. JR, Van Petten C. Influence of cognitive control and mismatch on the N2 component of the ERP: a review. Psychophysiology. (2008) 45:152–70. doi: 10.1111/j.1469-8986.2007.00602.x
43. Falkenstein M, Hoormann J, Hohnsbein J. ERP components in Go/Nogo tasks and their relation to inhibition. Acta Psychol. (1999) 101:267–91. doi: 10.1016/S0001-6918(99)00008-6
44. Pandey AK, Kamarajan C, Tang Y, Chorlian DB, Roopesh BN, Manz N, et al. Neurocognitive deficits in male alcoholics: an ERP/sLORETA analysis of the N2 component in an equal probability Go/NoGo task. Biol Psychol. (2012) 89:170–82. doi: 10.1016/j.biopsycho.2011.10.009
45. Woltering S, Liu Z, Rokeach A, Tannock R. Neurophysiological differences in inhibitory control between adults with ADHD and their peers. Neuropsychologia. (2013) 51:1888–95. doi: 10.1016/j.neuropsychologia.2013.06.023
46. Chen CY, Tien YM, Juan CH, Tzeng OJL, Hung DL. Neural correlates of impulsive-violent behavior: an event-related potential study. Neuroreport. (2005) 16:1213–6. doi: 10.1097/00001756-200508010-00016
47. Pasion R, Prata C, Fernandes M, Almeida R, Garcez H, Araújo C, et al. N2 amplitude modulation across the antisocial spectrum: a meta-analysis. Rev Neurosci. (2019) 30:781–94. doi: 10.1515/revneuro-2018-0116
48. Porjesz B, Begleiter H, Bihari B, Kissin B. The N2 component of the event-related brain potential in abstinent alcoholics. Electroencephalogr Clin. (1987) 66:121–31. doi: 10.1016/0013-4694(87)90181-7
49. Blackburn R. “What works” with mentally disordered offenders. Psychol Crime Law. (2004) 10:297–308. doi: 10.1080/10683160410001662780
50. Knabb JJ, Welsh RK, Graham-Howard ML. Treatment alternatives for mentally disordered offenders:a literature review. PSYCH. (2011) 02:122–31. doi: 10.4236/psych.2011.22020
51. Rice ME, Harris GT. The treatment of mentally disordered offenders. Psychol Public Policy Law. (1997) 3:126–83. doi: 10.1037/1076-8971.3.1.126
52. Glenn AL, Raine A. Neurocriminology: implications for the punishment, prediction and prevention of criminal behaviour. Nat Rev Neurosci. (2014) 15:54–63. doi: 10.1038/nrn3640
53. Rodman AM, Kastman E, Dorfman HM, Baskin-Sommers A, Kiehl KA, Newman JP, et al. Selective mapping of psychopathy and externalizing to dissociable circuits for inhibitory self-control. Clin Psychol Sci. (2016) 4:559–71. doi: 10.1177/2167702616631495
54. Degl' Innocenti A, Hassing LB, Lindqvist AS, Andersson H, Eriksson L, Hanson FH, et al. First report from the Swedish National Forensic Psychiatric Register (SNFPR). Int J Law Psychiatry. (2014) 37:231–7. doi: 10.1016/j.ijlp.2013.11.013
55. McNeish D. Thanks coefficient alpha, we'll take it from here. Psychol Methods. (2018) 23:412–33. doi: 10.1037/met0000144
56. Pasion R, Cruz AR, Barbosa F. Dissociation of boldness and disinhibition psychopathic traits in ERN modulation. Pers Individ Dif. (2016) 95:6–10. doi: 10.1016/j.paid.2016.02.017
57. van Dongen JDM, Drislane LE, Nijman H, Soe-Agnie SE, van Marle HJC. Further evidence for reliability and validity of the triarchic psychopathy measure in a forensic sample and a community sample. J Psychopathol Behav Assess. (2017) 39:58–66. doi: 10.1007/s10862-016-9567-5
58. Weidacker K, O'Farrell KR, Gray NS, Johnston SJ, Snowden RJ. Psychopathy and impulsivity: the relationship of the triarchic model of psychopathy to different forms of impulsivity in offenders and community participants. Pers Individ Dif. (2017) 114:134–9. doi: 10.1016/j.paid.2017.03.069
59. Kiehl KA, Smith AM, Hare RD, Liddle PF. An event-related potential investigation of response inhibition in schizophrenia and psychopathy. Biol Psychiatry. (2000) 48:210–21. doi: 10.1016/S0006-3223(00)00834-9
60. Steele VR, Maurer JM, Bernat EM, Calhoun VD, Kiehl KA. Error-related processing in adult males with elevated psychopathic traits. Personal Disord. (2016) 7:80–90. doi: 10.1037/per0000143
61. American Psychiatric Association. Diagnostic and Statistical Manual of Mental Disorders (DSM-5®). Arlington, VA: American Psychiatric Pub (2013). doi: 10.1176/appi.books.9780890425596
62. Kappenman ES, Luck SJ. The effects of electrode impedance on data quality and statistical significance in ERP recordings. Psychophysiology. (2010) 47:888–904. doi: 10.1111/j.1469-8986.2010.01009.x
63. Gramfort A, Luessi M, Larson E, Engemann DA, Strohmeier D, Brodbeck C, et al. MEG and EEG data analysis with MNEPython. Front Neurosci. (2013) 7:267. doi: 10.3389/fnins.2013.00267
64. Gramfort A, Luessi M, Larson E, Engemann DA, Strohmeier D, Brodbeck C, et al. MNE software for processing MEG and EEG data. Neuroimage. (2014) 86:446–60. doi: 10.1016/j.neuroimage.2013.10.027
65. Andersen LM. Group analysis in MNE-python of evoked responses from a tactile stimulation paradigm: a pipeline for reproducibility at every step of processing, going from individual sensor space representations to an across-group source space representation. Front Neurosci. (2018) 12:6. doi: 10.3389/fnins.2018.00006
66. Jas M, Larson E, Engemann DA, Leppäkangas J, Taulu S, Hämäläinen M, et al. A reproducible MEG/EEG group study with the mne software: recommendations, quality assessments, and good practices. Front Neurosci. (2018) 12:530. doi: 10.3389/fnins.2018.00530
67. Jas M, Engemann DA, Bekhti Y, Raimondo F, Gramfort A. Autoreject: automated artifact rejection for MEG and EEG data. Neuroimage. (2017) 159:417–29. doi: 10.1016/j.neuroimage.2017.06.030
68. Baldwin SA, Larson MJ, Clayson PE. The dependability of electrophysiological measurements of performance monitoring in a clinical sample: a generalizability and decision analysis of the ERN and Pe. Psychophysiology. (2015) 52:790–800. doi: 10.1111/psyp.12401
69. Lievaart M, van der Veen FM, Huijding J, Hovens JE, Franken IHA. The relation between trait anger and impulse control in forensic psychiatric patients: an EEG study. Appl Psychophysiol Biofeedback. (2018) 43:131–42. doi: 10.1007/s10484-018-9393-5
70. Luck SJ. An Introduction to the Event-Related Potential Technique. Cambridge, MA: MIT Press (2014).
71. R Core Team. R: A Language and Environment for Statistical Computing. R Core Team (2020) Available online at: https://www.R-project.org/ (accessed April 24, 2020).
72. Wickham H, Averick M, Bryan J, Chang W, McGowan L, François R, et al. Welcome to the Tidyverse. JOSS. (2019) 4:1686. doi: 10.21105/joss.01686
73. Bürkner PC. brms: an r package for bayesian multilevel models using stan. J Stat Softw. (2017) 80:1–28. doi: 10.18637/jss.v080.i01
74. Carpenter B, Gelman A, Hoffman M, Lee D, Goodrich B, Betancourt M, et al. Stan: a probabilistic programming language. J Stat Softw. (2017) 76:1–32. doi: 10.18637/jss.v076.i01
75. Gelman A, Simpson D, Betancourt M. The prior can often only be understood in the context of the likelihood. Entropy. (2017) 19:555. doi: 10.3390/e19100555
76. Lange K, Little RJA, Taylor J. Robust statistical modeling using the t distribution. J Am Stat Assoc. (1989) 84:881–96. doi: 10.1080/01621459.1989.10478852
77. Lewandowski D, Kurowicka D, Joe H. Generating random correlation matrices based on vines and extended onion method. J Multivar Anal. (2009) 100:1989–2001. doi: 10.1016/j.jmva.2009.04.008
78. McGrath RE, Meyer GJ. When effect sizes disagree: the case of r and d. Psychol Methods. (2006) 11:386–401. doi: 10.1037/1082-989X.11.4.386
79. Mastrandrea MD, Mach KJ, Plattner GK, Edenhofer O, Stocker TF, Field CB, et al. The IPCC AR5 guidance note on consistent treatment of uncertainties: a common approach across the working groups. Clim Change. (2011) 108:675. doi: 10.1007/s10584-011-0178-6
80. Makowski D, Ben-Shachar MS, Chen SHA, Lüdecke D. Indices of effect existence and significance in the bayesian framework. Front Psychol. (2019) 10:2767. doi: 10.3389/fpsyg.2019.02767
81. Makowski D, Ben-Shachar M, Lüdecke D. bayestestR: describing effects and their uncertainty, existence and significance within the bayesian framework. JOSS. (2019) 4:1541. doi: 10.21105/joss.01541
82. de Vet HCW, Mokkink LB, Mosmuller DG, Terwee CB. Spearman-Brown prophecy formula and Cronbach's alpha: different faces of reliability and opportunities for new applications. J Clin Epidemiol. (2017) 85:45–49. doi: 10.1016/j.jclinepi.2017.01.013
83. Kim M, Lee TH, Choi JS, Kwak YB, Hwang WJ, Kim T, et al. Neurophysiological correlates of altered response inhibition in internet gaming disorder and obsessive-compulsive disorder: perspectives from impulsivity and compulsivity. Sci Rep. (2017) 7:41742. doi: 10.1038/srep41742
84. Hoyniak CP Petersen IT. A meta-analytic evaluation of the N2 component as an endophenotype of response inhibition and externalizing psychopathology in childhood. Neurosci Biobehav Rev. (2019) 103:200–15. doi: 10.1016/j.neubiorev.2019.06.011
85. Littman R, Takács Á. Do all inhibitions act alike? A study of go/no-go and stop-signal paradigms. PLoS ONE. (2017) 12:e0186774. doi: 10.1371/journal.pone.0186774
86. Ertekin E, Üçok A, Keskin-Ergen Y, Devrim-Üçok M. Deficits in Go and NoGo P3 potentials in patients with schizophrenia. Psychiatry Res. (2017) 254:126–32. doi: 10.1016/j.psychres.2017.04.052
87. Kaiser A, Aggensteiner PM, Baumeister S, Holz NE, Banaschewski T, Brandeis D. Earlier versus later cognitive event-related potentials (ERPs) in attention-deficit/hyperactivity disorder (ADHD): a meta-analysis. Neurosci Biobehav Rev. (2020) 112:117–34. doi: 10.1016/j.neubiorev.2020.01.019
88. Liotti M, Pliszka SR, Perez R, Kothmann D, Woldorff MG. Abnormal brain activity related to performance monitoring and error detection in children with ADHD. Cortex. (2005) 41:377–88. doi: 10.1016/S0010-9452(08)70274-0
89. Nash K, Schiller B, Gianotti LRR, Baumgartner T, Knoch D. Electrophysiological indices of response inhibition in a Go/NoGo task predict self-control in a social context. PLoS ONE. (2013) 8:e79462. doi: 10.1371/journal.pone.0079462
90. Steele VR, Aharoni E, Munro GE, Calhoun VD, Nyalakanti P, Stevens MC, et al. A large scale (N=102) functional neuroimaging study of response inhibition in a Go/NoGo task. Behav Brain Res. (2013) 256:529–36. doi: 10.1016/j.bbr.2013.06.001
91. Huster RJ, Westerhausen R, Pantev C, Konrad C. The role of the cingulate cortex as neural generator of the N200 and P300 in a tactile response inhibition task. Hum Brain Mapp. (2010) 31:1260–71. doi: 10.1002/hbm.20933
92. Baumeister S, Hohmann S, Wolf I, Plichta MM, Rechtsteiner S, Zangl M, et al. Sequential inhibitory control processes assessed through simultaneous EEG-fMRI. Neuroimage. (2014) 94:349–59. doi: 10.1016/j.neuroimage.2014.01.023
93. Enriquez-Geppert S, Konrad C, Pantev C, Huster RJ. Conflict and inhibition differentially affect the N200/P300 complex in a combined go/nogo and stop-signal task. Neuroimage. (2010) 51:877–87. doi: 10.1016/j.neuroimage.2010.02.043
94. Huster RJ, Eichele T, Enriquez-Geppert S, Wollbrink A, Kugel H, Konrad C, et al. Multimodal imaging of functional networks and event-related potentials in performance monitoring. Neuroimage. (2011) 56:1588–97. doi: 10.1016/j.neuroimage.2011.03.039
95. Parvaz MA, Maloney T, Moeller SJ, Malaker P, Konova AB, Alia-Klein N, et al. Multimodal evidence of regional midcingulate gray matter volume underlying conflict monitoring. Neuroimage Clin. (2014) 5:10–8. doi: 10.1016/j.nicl.2014.05.011
96. Hong X, Wang Y, Sun J, Li C, Tong S. Segregating top-down selective attention from response inhibition in a spatial cueing Go/NoGo Task: an erp and source localization study. Sci Rep. (2017) 7:9662. doi: 10.1038/s41598-017-08807-z
97. Beste C, Saft C, Andrich J, Gold R, Falkenstein M. Response inhibition in Huntington's disease-a study using ERPs and sLORETA. Neuropsychologia. (2008) 46:1290–7. doi: 10.1016/j.neuropsychologia.2007.12.008
98. Fallgatter AJ, Ehlis AC, Seifert J, Strik WK, Scheuerpflug P, Zillessen KE, et al. Altered response control and anterior cingulate function in attention-deficit/hyperactivity disorder boys. Clin Neurophysiol. (2004) 115:973–81. doi: 10.1016/j.clinph.2003.11.036
99. Schmajuk M, Liotti M, Busse L, Woldorff MG. Electrophysiological activity underlying inhibitory control processes in normal adults. Neuropsychologia. (2006) 44:384–95. doi: 10.1016/j.neuropsychologia.2005.06.005
100. Stevens FL, Hurley RA, Taber KH. Anterior cingulate cortex: unique role in cognition and emotion. J Neuropsychiatry Clin Neurosci. (2011) 23:121–5. doi: 10.1176/jnp.23.2.jnp121
101. Vogt BA, Palomero-Gallagher N. Cingulate cortex. In: Mai J, Paxinos G, editors. The Human Nervous System. Cambridge, MA: Academic Press (2012). p. 943–87.
102. Holroyd CB, Ribas-Fernandes JJF, Shahnazian D, Silvetti M, Verguts T. Human midcingulate cortex encodes distributed representations of task progress. Proc Natl Acad Sci USA. (2018) 115:6398–403. doi: 10.1073/pnas.1803650115
103. Botvinick MM, Cohen JD, Carter CS. Conflict monitoring and anterior cingulate cortex: an update. Trends Cogn Sci. (2004) 8:539–46. doi: 10.1016/j.tics.2004.10.003
104. Jahn A, Nee DE, Alexander WH, Brown JW. Distinct regions of anterior cingulate cortex signal prediction and outcome evaluation. Neuroimage. (2014) 95:80–9. doi: 10.1016/j.neuroimage.2014.03.050
105. Apps MAJ, Lockwood PL, Balsters JH. The role of the midcingulate cortex in monitoring others' decisions. Front Neurosci. (2013) 7:251. doi: 10.3389/fnins.2013.00251
106. Bokura H, Yamaguchi S, Kobayashi S. Electrophysiological correlates for response inhibition in a Go/NoGo task. Clin Neurophysiol. (2001) 112:2224–32. doi: 10.1016/S1388-2457(01)00691-5
107. Bramon E, McDonald C, Croft RJ, Landau S, Filbey F, Gruzelier JH, et al. Is the P300 wave an endophenotype for schizophrenia? A meta-analysis and a family study. Neuroimage. (2005) 27:960–8. doi: 10.1016/j.neuroimage.2005.05.022
108. Jeon YW, Polich J. Meta-analysis of P300 and schizophrenia: patients, paradigms, and practical implications. Psychophysiology. (2003) 40:684–701. doi: 10.1111/1469-8986.00070
109. Yancey JR, Venables NC, Hicks BM, Patrick CJ. Evidence for a heritable brain basis to deviance-promoting deficits in self-control. J Crim Justice. (2013) 41:309–17. doi: 10.1016/j.jcrimjus.2013.06.002
110. Hillman CH, Weiss EP, Hagberg JM, Hatfield BD. The relationship of age and cardiovascular fitness to cognitive and motor processes. Psychophysiology. (2002) 39:303–12. doi: 10.1017/S0048577201393058
111. Hillman CH, Belopolsky AV, Snook EM, Kramer AF, McAuley E. Physical activity and executive control: implications for increased cognitive health during older adulthood. Res Q Exerc Sport. (2004) 75:176–85. doi: 10.1080/02701367.2004.10609149
112. Bergman H, Nilsson T, Andiné P, Degl'Innocenti A, Thomeé R, Gutke A. Physical performance and physical activity of patients under compulsory forensic psychiatric inpatient care. Physiother Theory Pract. (2020) 36:507–15. doi: 10.1080/09593985.2018.1488320
113. Fan X, Zhao C, Luo H, Zhang W. The effect of mental fatigue on response processes: an ERP study in Go/NoGo task. In: Advances in Neuroergonomics and Cognitive Engineering. Springer International Publishing (2018). p. 49–60. doi: 10.1007/978-3-319-94866-9_5
114. Guo Z, Chen R, Liu X, Zhao G, Zheng Y, Gong M, et al. The impairing effects of mental fatigue on response inhibition: An ERP study. PLoS ONE. (2018) 13:e0198206. doi: 10.1371/journal.pone.0198206
115. Beste C, Stock AK, Epplen JT, Arning L. Dissociable electrophysiological subprocesses during response inhibition are differentially modulated by dopamine D1 and D2 receptors. Eur Neuropsychopharmacol. (2016) 26:1029–36. doi: 10.1016/j.euroneuro.2016.03.002
116. Aringhieri S, Carli M, Kolachalam S, Verdesca V, Cini E, Rossi M, et al. Molecular targets of atypical antipsychotics: from mechanism of action to clinical differences. Pharmacol Ther. (2018) 192:20–41. doi: 10.1016/j.pharmthera.2018.06.012
117. Kapur S, Mamo D. Half a century of antipsychotics and still a central role for dopamine D2 receptors. Prog Neuropsychopharmacol Biol Psychiatry. (2003) 27:1081–90. doi: 10.1016/j.pnpbp.2003.09.004
118. Rampino A, Marakhovskaia A, Soares-Silva T, Torretta S, Veneziani F, Beaulieu JM. Antipsychotic drug responsiveness and dopamine receptor signaling; old players and new prospects. Front Psychiatry. (2019) 9:702. doi: 10.3389/fpsyt.2018.00702
119. Hughes LE, Rittman T, Regenthal R, Robbins TW, Rowe JB. Improving response inhibition systems in frontotemporal dementia with citalopram. Brain. (2015) 138:1961–75. doi: 10.1093/brain/awv133
120. Brunner JF, Hansen TI, Olsen A, Skandsen T, Håberg A, Kropotov J. Long-term test-retest reliability of the P3 NoGo wave and two independent components decomposed from the P3 NoGo wave in a visual Go/NoGo task. Int J Psychophysiol. (2013) 89:106–14. doi: 10.1016/j.ijpsycho.2013.06.005
121. Aharoni E, Vincent GM, Harenski CL, Calhoun VD, Sinnott-Armstrong W, Gazzaniga MS, et al. Neuroprediction of future rearrest. Proc Natl Acad Sci USA. (2013) 110:6223–8. doi: 10.1073/pnas.1219302110
122. Delfin C, Krona H, Andiné P, Ryding E, Wallinius M, Hofvander B. Prediction of recidivism in a long-term follow-up of forensic psychiatric patients: incremental effects of neuroimaging data. PLoS ONE. (2019) 14:e0217127. doi: 10.1371/journal.pone.0217127
123. Steele VR, Claus ED, Aharoni E, Vincent GM, Calhoun VD, Kiehl KA. Multimodal imaging measures predict rearrest. Front Hum Neurosci. (2015) 9:425. doi: 10.3389/fnhum.2015.00425
124. Rees-Jones A, Gudjonsson G, Young S. A multi-site controlled trial of a cognitive skills program for mentally disordered offenders. BMC Psychiatry. (2012) 12:44. doi: 10.1186/1471-244X-12-44
125. Young S, Chick K, Gudjonsson G. A preliminary evaluation of reasoning and rehabilitation 2 in mentally disordered offenders (R&R2M) across two secure forensic settings in the United Kingdom. J Forens Psychiatry Psychol. (2010) 21:336–49. doi: 10.1080/14789940903513203
126. O'Reilly K, Donohoe G, O'Sullivan D, Coyle C, Corvin A, O'Flynn P, et al. A randomized controlled trial of cognitive remediation for a national cohort of forensic patients with schizophrenia or schizoaffective disorder. BMC Psychiatry. (2019) 19:27. doi: 10.1186/s12888-019-2018-6
127. Bluschke A, Friedrich J, Schreiter ML, Roessner V, Beste C. A comparative study on the neurophysiological mechanisms underlying effects of methylphenidate and neurofeedback on inhibitory control in attention deficit hyperactivity disorder. Neuroimage Clin. (2018) 20:1191–203. doi: 10.1016/j.nicl.2018.10.027
128. Volkow ND, Wang GJ, Fowler JS, Ding YS. Imaging the effects of methylphenidate on brain dopamine: new model on its therapeutic actions for attention-deficit/hyperactivity disorder. Biol Psychiatry. (2005) 57:1410–5. doi: 10.1016/j.biopsych.2004.11.006
129. Paul-Jordanov I, Bechtold M, Gawrilow C. Methylphenidate and if-then plans are comparable in modulating the P300 and increasing response inhibition in children with ADHD. Atten Defic Hyperact Disord. (2010) 2:115–26. doi: 10.1007/s12402-010-0028-9
130. Pliszka SR, Liotti M, Bailey BY, Perez R 3rd, Glahn D, Semrud-Clikeman M. Electrophysiological effects of stimulant treatment on inhibitory control in children with attention-deficit/hyperactivity disorder. J Child Adolesc Psychopharmacol. (2007) 17:356–66. doi: 10.1089/cap.2006.0081
131. Seifert J, Scheuerpflug P, Zillessen KE, Fallgatter A, Warnke A. Electrophysiological investigation of the effectiveness of methylphenidate in children with and without ADHD. J Neural Transm. (2003) 110:821–9. doi: 10.1007/s00702-003-0818-8
132. Bush G, Spencer TJ, Holmes J, Shin LM, Valera EM, Seidman LJ, et al. Functional magnetic resonance imaging of methylphenidate and placebo in attention-deficit/hyperactivity disorder during the multi-source interference task. Arch Gen Psychiatry. (2008) 65:102–14. doi: 10.1001/archgenpsychiatry.2007.16
133. Schulz KP, Fan J, Bédard ACV, Clerkin SM, Ivanov I, Tang CY, et al. Common and unique therapeutic mechanisms of stimulant and nonstimulant treatments for attention-deficit/hyperactivity disorder. Arch Gen Psychiatry. (2012) 69:952–61. doi: 10.1001/archgenpsychiatry.2011.2053
134. Wagenmakers EJ, Marsman M, Jamil T, Ly A, Verhagen J, Love J, et al. Bayesian inference for psychology. Part I: theoretical advantages and practical ramifications. Psychon Bull Rev. (2018) 25:35–57. doi: 10.3758/s13423-017-1343-3
135. Patrick CJ, Iacono WG, Venables NC. Incorporating neurophysiological measures into clinical assessments: fundamental challenges and a strategy for addressing them. Psychol Assess. (2019) 31:1512–29. doi: 10.1037/pas0000713
Keywords: trait disinhibition, event-related potential, ERP, N2, P3, mentally disordered offenders, forensic psychiatry
Citation: Delfin C, Ruzich E, Wallinius M, Björnsdotter M and Andiné P (2020) Trait Disinhibition and NoGo Event-Related Potentials in Violent Mentally Disordered Offenders and Healthy Controls. Front. Psychiatry 11:577491. doi: 10.3389/fpsyt.2020.577491
Received: 29 June 2020; Accepted: 17 November 2020;
Published: 11 December 2020.
Edited by:
Cristina Scarpazza, University of Padua, ItalyReviewed by:
Lilybeth Fontanesi, G. d'Annunzio University of Chieti and Pescara, ItalyUmberto Battaglia, University of Padua, Italy
Copyright © 2020 Delfin, Ruzich, Wallinius, Björnsdotter and Andiné. This is an open-access article distributed under the terms of the Creative Commons Attribution License (CC BY). The use, distribution or reproduction in other forums is permitted, provided the original author(s) and the copyright owner(s) are credited and that the original publication in this journal is cited, in accordance with accepted academic practice. No use, distribution or reproduction is permitted which does not comply with these terms.
*Correspondence: Carl Delfin, Y2FybC5kZWxmaW5AZ3Uuc2U=