 Zhen-Qing Zhang1,2†
 Wei-Wei Wu1†Jin-Dong Chen1
 Guang-Yin Zhang3Jing-Yu Lin2Yan-Kun Wu2Yu Zhang4
 Yun-Ai Su2
 Ji-Tao Li2*
 Tian-Mei Si2*
- 1Xiamen Xianyue Hospital, Xiamen, China
- 2Peking University Sixth Hospital, Peking University Institute of Mental Health, Peking University, Beijing, China
- 3Department of Psychosomatic Medicine, First Teaching Hospital of Tianjin University of Traditional Chinese Medicine, Tianjin, China
- 4Institute of Mental Health, Hebei North University, Hebei, China
Bipolar disorder (BD) is a major and highly heritable mental illness with severe psychosocial impairment, but its etiology and pathogenesis remains unclear. This study aimed to identify the essential pathways and genes involved in BD using weighted gene coexpression network analysis (WGCNA), a bioinformatic method studying the relationships between genes and phenotypes. Using two available BD gene expression datasets (GSE5388, GSE5389), we constructed a gene coexpression network and identified modules related to BD. The analyses of Gene Ontology and Kyoto Encyclopedia of Genes and Genomes pathways were performed to explore functional enrichment of the candidate modules. A protein-protein interaction (PPI) network was further constructed to identify the potential hub genes. Ten coexpression modules were identified from the top 5,000 genes in 77 samples and three modules were significantly associated with BD, which were involved in several biological processes (e.g., the actin filament-based process) and pathways (e.g., MAPK signaling). Four genes (NOTCH1, POMC, NGF, and DRD2) were identified as candidate hub genes by PPI analysis and CytoHubba. Finally, we carried out validation analyses in a separate dataset, GSE12649, and verified NOTCH1 as a hub gene and the involvement of several biological processes such as actin filament-based process and axon development. Taken together, our findings revealed several candidate pathways and genes (NOTCH1) in the pathogenesis of BD and call for further investigation for their potential research values in BD diagnosis and treatment.
Introduction
Bipolar disorder (BD) is a chronic and recurrent severe mental disorder that affect about 1% global population (1). The disease is associated with high heritability, ranging from 70 to 90% (2), but its key genetic and neurobiological mechanisms are still not recognized. With the development of high-throughput sequencing technology, significant progress has been made in the genomics of BD. Recently, some systematic reviews and genome-wide association study (GWAS) findings have revealed more than 40 genes, including ANK3, ERBB2, ODZ4, CACNA1C, and FADS (3, 4). Pathway analyses of these genes showed that they were involved the regulation of insulin secretion, apoptosis, immunological response, neuroplasticity, HPA axis dysregulation, and the signal of endocannabinoid, etc., (5, 6). Recent RNA-sequencing studies also highlight dysregulation of neuroplasticity, circadian rhythms, as well as GTPase binding in BD (7). These findings provide clear evidence that BD is associated with an extensive polygenic genetic architecture (5), which calls for the network-level investigation to reveal the correspondence between risk genes and phenotypes. By combining public microarray data with bioinformatic analysis, we can gain an in-depth understanding of the molecular processes and pathogenesis of BD.
Weighted gene coexpression network analysis (WGCNA) is a bioinformatic method to study the relationships between genes and phenotypes. Recently, this technique has been widely applied to neurological and psychiatric disorders, including posttraumatic stress disorder, depression, schizophrenia, Alzheimer's disease, and Huntington's disease (8–13). Different from previous research methods focusing on individual genes, WGCNA transforms gene expression profiles into coexpression networks (modules). By examining modules of highly correlated genes, this method provides insights into the signaling networks that may be responsible for phenotypic traits of interest and the results may help identify the candidate biomarkers or therapeutic targets of many biological processes (14, 15).
The aim of this study is to reveal gene modules related to BD and to identify their functional pathways and potential hub genes. Using two available BD gene expression datasets (GSE5388, GSE5389), we constructed a gene coexpression network using WGCNA. For the modules related to BD, we then performed the Gene Ontology (GO) and Kyoto Encyclopedia of Genes and Genomes (KEGG) analyses to reveal the pathways enriched in these modules. In addition, a protein-protein interaction (PPI) network was constructed for the module of interest to identify candidate hub genes. Finally, we carried out validation analyses in a separate dataset GSE12649. These analyses based on gene coexpression profiles would shed light on the polygenic genetic architecture of BD and help to reveal the potential gene markers for BD diagnosis and treatment.
Materials and Methods
Microarray Data
Two gene expression datasets of BD patients, GSE5388, and GSE5389, were downloaded from the GEO database in May 2019 (https://www.ncbi.nlm.nih.gov/geo/). The GSE5388 dataset contained 61 samples (30 bipolar and 31 control subjects) from the dorsolateral prefrontal cortex (DLPFC). The GSE5389 dataset contained 21 samples (10 bipolar and 11 control subjects) from the orbitofrontal cortex (OFC). Both datasets were from the study of Ryan et al. (16) and based on the GPL96 platform ([HG-U133A] Affymetrix Human Genome U133A Array). The clinical data of these datasets, such as diagnosis, demographics (e.g., age, sex), and technical information (e.g., post-mortem interval, pH, RNA degradation, Batch), were also obtained. These two datasets were chosen based on prior evidence of involvement of DLPFC and OFC in BD (17). Ryan and colleagues found that gene expression changes in two regions were comparable (16), which suggests that the two datasets could be merged. Below we performed quality control analysis to further make sure that there are no batch effects between the two datasets.
Data Preprocessing and Quality Control
The preprocessing was carried out separately for each dataset, including quality control and normalization, using the affy package in R (version 3.6.0; https://www.r-project.org/) (18). Demographic and technical variables were treated as covariates to control for their potential influence on the differences between bipolar and control subjects. The samples with standardized sample network connection Z-scores <-2 were excluded from further analysis. Five samples (GSM123204, GSM123205, GSM123206, GSM123214, and GSM123243) were defined as outliers and removed, resulting in 77 samples for final analysis. The chip scan date extracted from the metadata was used as an experimental batch for each dataset. The ComBat function of sva package in R was used to correct for batch effects (19). Annotations to the probes were performed using Ensembl gene IDs (v75; Feb 2014 data freeze) by the biomaRt package in R (20). A larger dataset was built by merging the two datasets following previous practics (12). The ComBat function was used to eliminate study batch effects if present (19).
Weighted Gene Coexpression Network Analysis (WGCNA)
The WGCNA was performed on the average expression levels of the top 5,000 genes in 77 samples using the WGCNA package in R (14). The sample network connectivity was standardized by function scale according to the distance before WGCNA, which excluded the outlier samples connectivity <-5. The hierarchical clustering of samples was analyzed using the default method (hclust function), and no sample outliers were found. The soft thresholding power was then screened by the pickSoftThreshold function. Candidate powers from 1 to 20 were applied to test the mean connectivity degrees and the independence of modules. The soft thresholding power was selected if the R2 ≧ 0.8. To construct the WGCNA, the blockwiseModules function in R was used, and multiple parameters were defined. Here, the following parameters were used: power = 8, minModuleSize = 50, deepSplit = 1, networkType = “unsigned.” The module detection process was performed automatically by BlockwiseModules. Specifically, it can build a correlation network, create a cluster tree, and then merge nearby branches to form modules. A hierarchical clustering tree (dendrogram) was plotted to display hierarchical clustering. DissTOM (1-Topological Overlap Matrix) was calculated, and the relationships among all genes were visualized in R. Finally, the heatmap function in R was used to analyze the correlations between the modules.
Relationship Analysis Between Coexpression Modules and BD
The module eigengene (ME) represents the first principal component in each module and therefore reflects the level of gene expression in the module (14). Pearson's correlation test was applied to assess the correlation between ME and BD and the heatmap package in R was used to visualize the correlations between modules and BD. Modules with significantly negative or positive correlations between ME and clinical traits were considered as candidate modules.
GO and KEGG Analyses of Coexpression Modules for Bipolar Disorder
The Gene Ontology (GO) analysis, which includes the biological process (BP), cellular component (CC), and molecular function (MF) ontologies, is a standard method for gene functional annotation (21, 22). The Kyoto Encyclopedia of Genes and Genomes (KEGG) database, which stores gene metabolic pathways, is widely used to determine functional enrichment (23). Here, GO and KEGG analyses were performed for the genes in candidate modules in Metascape (http://metascape.org/gp/index.html#/main/step1), which is a reliable and widely used online software for omics-based research (24). The candidate modules were calculated with a P-value cutoff of 0.01, a min overlap of 3, and a min enrichment of 1.5.
Protein-Protein Interaction Network Analysis for Selected Modules of Bipolar Disorder
The genes in candidate modules were mapped into the STRING database (Version 11.0, https://string-db.org/) for PPI network analysis. The Cytoscape software (v3.7.1) (25) was used for visualization, and the CytoHubba plug-in (http://hub.iis.sinica.edu.tw/cytohubba/) was applied to find hub genes in each module. To reduce potential errors caused by a complex biological network, it is necessary to use multiple methods to identify essential proteins (26). Hub genes were analyzed by CytoHubba using the following five methods: maximum neighborhood component, node connect degree, closeness, edge percolated component, and radiality (27–29).
Validation Using Another Gene Expression Dataset of BD
The microarray dataset GSE12649, which was deposited by Iwamoto et al. (30), was used to validate our findings. This dataset contained 102 subjects from the prefrontal cortex (BA46), including 33 BD, 35 schizophrenia, and 34 control subjects. The BD and control samples were used for validation analysis. We carried out the same analyses as our main study, including data preprocessing, WGCNA, GO and KEGG analyses, PPI visualization, and hub genes screening. We validated our previous GO enrichment and KEGG pathway results in this dataset, focusing on top five GO enrichment results in each module and the important KEGG pathways. Finally, the hub genes of main and validation analyses were compared with each other to identify shared hub genes across datasets.
Results
Data Preprocessing and Quality Control
As shown in the boxplots and histograms, each microarray dataset indicated valid normalization and quality control for further analyses (Supplementary Figure 1). Bipolar and control status were not significantly associated with sex, age, pH, post-mortem interval (PMI), RNA degradation (RNAdeg), and Batch (P > 0.05). Five samples (GSM123204, GSM123205, GSM123206, GSM123214, and GSM123243) were defined as outliers and removed, resulting in 77 samples for final analysis. There were a total of 12,300 genes shared between the two datasets and no batch effects were observed (P > 0.05; see Supplementary Figure 2). The gene coexpression network was constructed by 5,000 genes with the highest average expression values (31).
WGCNA to Identify Modules Critical to BD
The clustering results in Supplementary Figure 3 showed that all 77 samples were clustered well. With a soft-threshold power of 8 (Figure 1A), nine coexpression modules were identified, ranging in size from 192 to 1,419 genes (Figures 1B,C). Specifically, there were 1,419 genes in module 1 (MEturquoise), 944 genes in module 2 (MEblue), 749 genes in module 3 (MEbrown), 352 genes in module 4 (MEyellow), 318 genes in module 5 (MEgreen), 272 genes in module 6 (MEred), 211 genes in module 7 (MEblack), 196 genes in module 8 (MEpink), and 192 genes in module 9 (MEmagenta). In addition, 374 genes not assigned to any of the above modules were classified as a gene set Module 0 (MEgrey). The interactions among the ten modules are shown in Figure 2 and suggest that the modules were relatively independent.
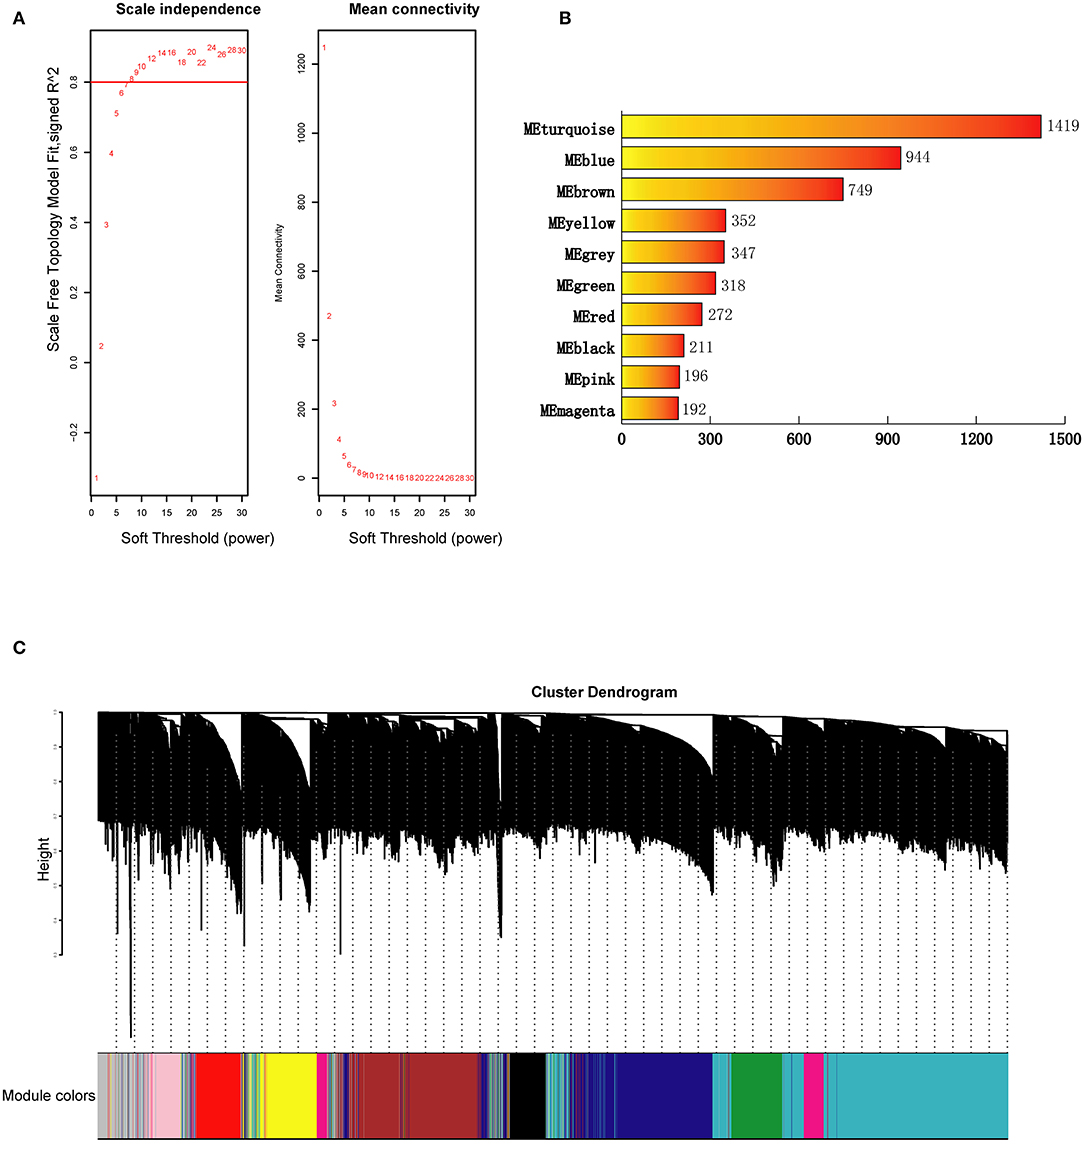
Figure 1. Construction of genes coexpression modules for BD. (A) Analysis of network topology for a set of soft-thresholding powers. (B) Number of genes in each coexpression module. (C) Construction of genes coexpression modules. Each color represents a module and each branch represents a gene. ME, module.
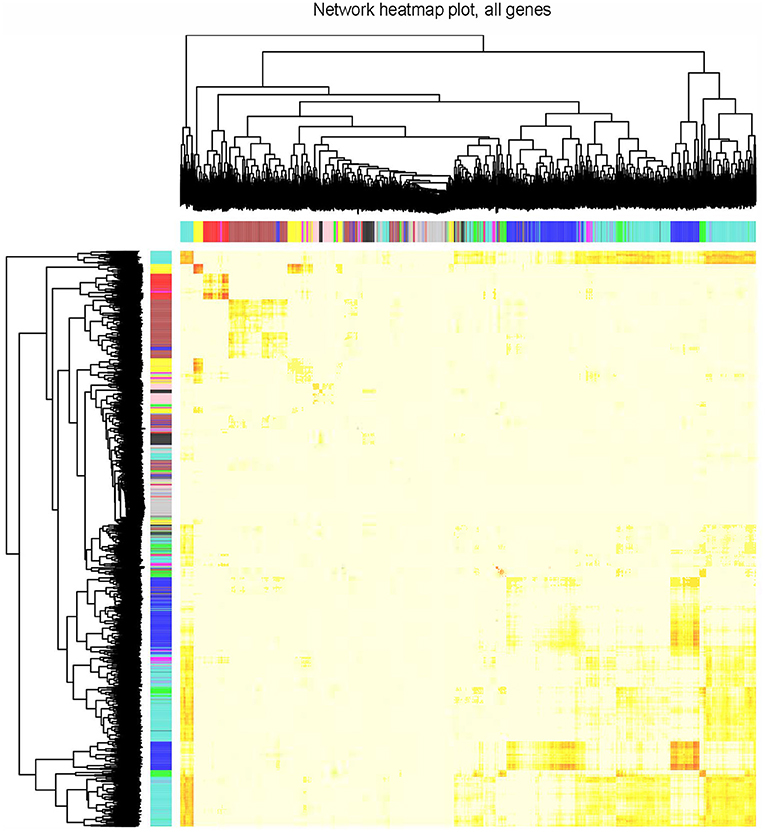
Figure 2. Visualization of TOM of co-expressed genes in different modules by a heat map. Light colors indicate low overlap and dark red indicates high overlap. The darker color blocks along the diagonal are coexpression modules.
The correlations between the coexpression modules and clinical traits are shown in Figure 3. Three modules were significantly associated with BD status (Bonferroni-corrected P < 0.05). The MEblue module (r = 0.39, P = 4e-04, corrected P = 4e-03) showed a positive correlation, whereas the MEgreen (r = −0.39, P = 5e-04, corrected P = 5e-03), and MEturquoise (r = −0.38, P = 6e-04, corrected P = 6e-03) modules showed negative correlations. None of the 10 modules was significantly associated with sex or age (Ps > 0.05).
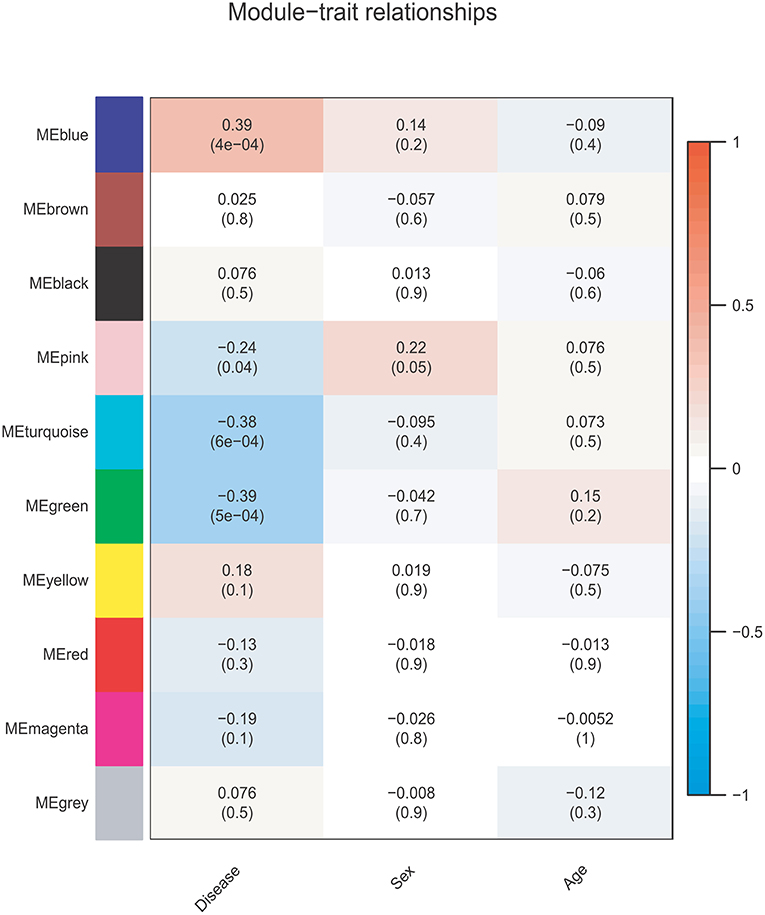
Figure 3. Module-trait relationship. Each row corresponds to a module eigengene, and each column corresponds to one feature. Each cell contains the corresponding correlation and p-value.
Gene Function and Annotation Enrichment (Functional Enrichment) Analysis of Key Modules
As shown in Figure 4, the GO and KEGG pathway analyses were performed for the three key modules. The top five GO enrichment results showed that genes in MEblue were mainly enriched in GO:0003012 (muscle system process), GO:1901137 (carbohydrate derivative biosynthetic process), GO:0030029 (actin filament-based process), GO:0061564 (axon development), and GO:0010817 (regulation of hormone levels). Genes in MEgreen were enriched in GO:0071417 (cellular response to organonitrogen compound), GO:0017038 (protein import), GO:0042391 (regulation of membrane potential), GO:0005773 (vacuole), GO:0018105 (peptidyl-serine phosphorylation). Genes in MEturquoise were mainly enriched in GO:0016604 (nuclear body), GO:0006397 (mRNA processing), GO:0006403 (RNA localization), GO:0006753 (nucleoside phosphate metabolic process), and GO:0005635 (nuclear envelope). For the top 20 clusters enriched in each module, please refer to Supplementary Table 1.
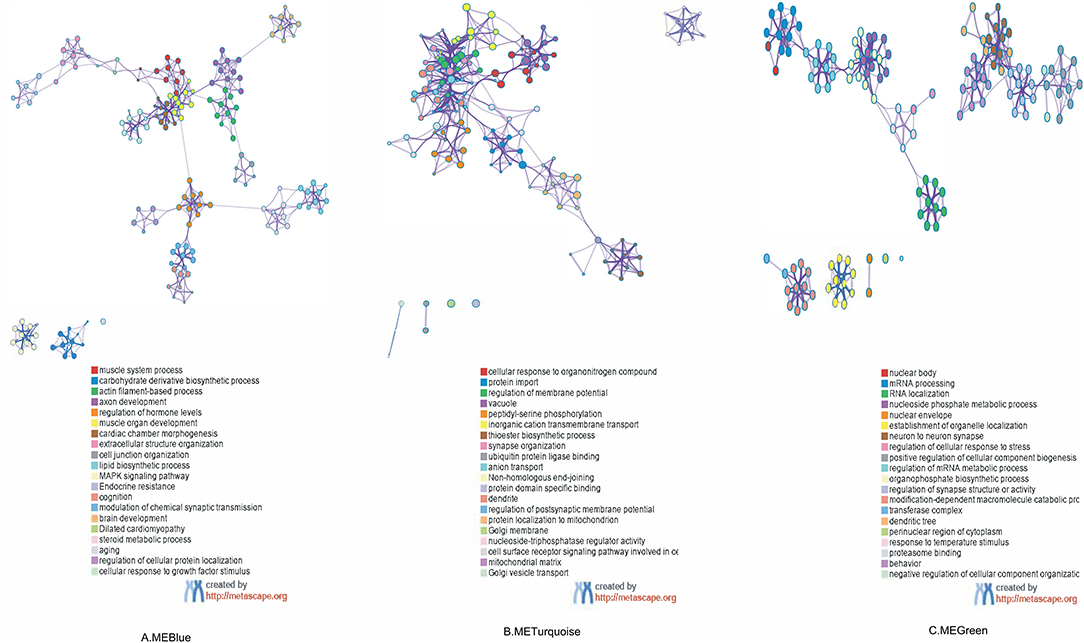
Figure 4. Functional enrichment analysis of three co-expressing network modules: enriched terms are represented by circle nodes, and nodes of the same color belong to the same cluster. (A) Colored by cluster ID in MEBlue, where nodes that share the same cluster ID are typically close to each other. (B) Colored by cluster ID in METurquoise. (C) Colored by cluster ID in MEGreen. ME, module.
The KEGG pathway analysis showed that genes in MEblue were mainly enriched in hsa04010 (MAPK signaling pathway), hsa01522 (Endocrine resistance), and hsa05414 (Dilated cardiomyopathy), and genes in MEgreen were mainly enriched in hsa03450 (Non-homologous end-joining). No significantly enriched pathways were found for MEturquoise.
Visualization of the PPI Network and Hub Genes
Among the 3 modules, MEblue (r = 0.39, P = 4e-04) and MEgreen (r = −0.39, P = 5e-04) had the strongest correlations with BD, and the number of genes in MEblue was greater than that in MEgreen. Therefore, we selected the MEblue module for the subsequent analysis (32). The PPI network analysis was performed on the MEblue module using the STRING database. As a result, 853 nodes and 2,687 edges were established in the module and the PPI enrichment P-value was 1.0e-12. The interactions of proteins in MEblue were selected and converted into a network, which was visualized with Cytoscape, as shown in Figure 5. Each term is represented by a circular node, and its cluster identity is represented by its color. The top 10 hub genes in the PPI network were calculated by CytoHubba (28). As a result, four genes (NOTCH1, POMC, NGF, and DRD2), which overlapped among the five methods, were deemed hub genes. Then we analyzed the gene expression levels of these hub genes, and found that, compared with controls, the expression level of NOTCH1 (t75 = 2.159, P = 0.034), NGF (t75 = 3.183, P = 0.002), and POMC (t75 = 3.791, P = 3e-04) presented significant up-regulation in BD (Supplementary Figure 4).
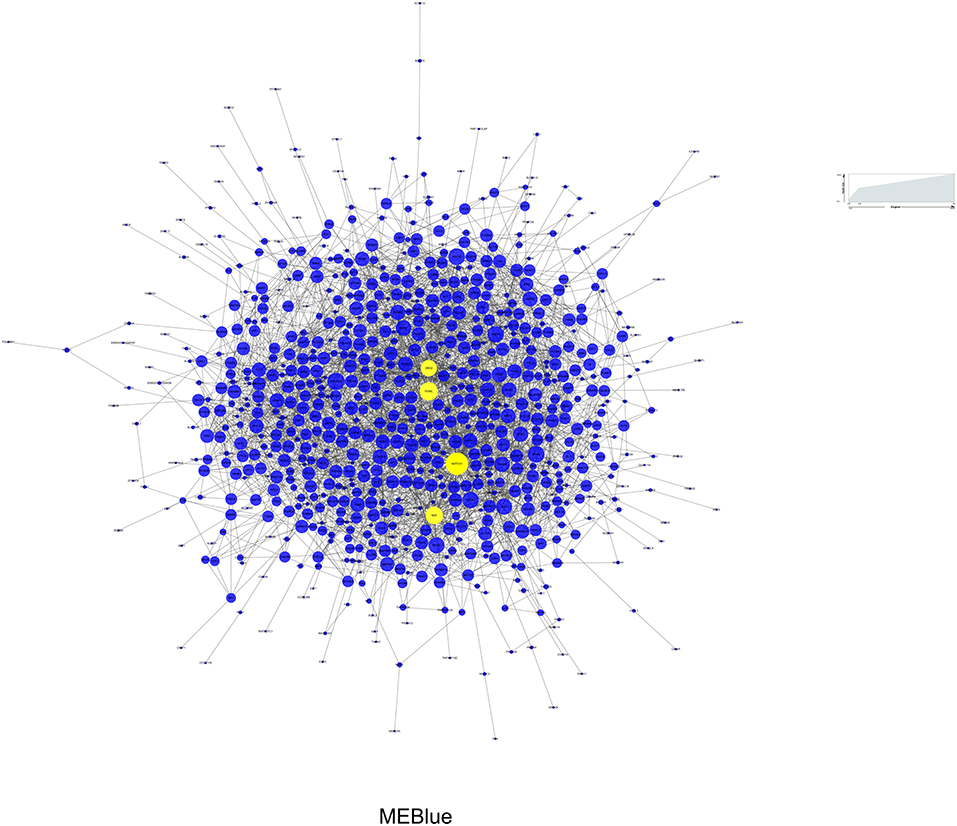
Figure 5. Protein-protein interaction network of MEBlue for BD. Yellow node represents the most important protein of the network and the related gene is defined as hub gene. Node size represents the degree of connectivity.
Validation of Gene Function, Annotation Enrichment, and Hub Genes
In an independent dataset, GSE12649, we carried out the same analyses as above to validate our results. WGCNA revealed seven coexpression modules in this dataset. Among these modules, MEbrown (including 460 genes) showed a significant positive correlation (r = 0.27, P = 0.04) with BD (Supplementary Table 2). In this module, we then validated the top five GO functional enrichment results of each module and four KEGG pathways we observed previously (Supplementary Table 3). The following GO enrichment results appeared in the clusters of MEbrown: GO:0071417 (cellular response to organonitrogen compound), GO:0030029 (actin filament-based process), GO:0003012 (muscle system process), GO:0061564 (axon development), GO:0010817 (regulation of hormone levels), Go:0042391 (regulation of membrane potential). Among the four important KEGG pathways, only the hsa05414 (Dilated cardiomyopathy) was verified in the MEbrown. Finally, among the four hub genes of the main results, NOTCH1 was verified as a hub gene in this validation dataset (Supplementary Table 4).
Discussion
In this study, we applied WGCNA to the BD gene expression profiles GSE5388 and GSE538 and identified 10 modules on the top 5,000 genes from 77 samples. Three out of 10 modules were significantly associated with BD. Functional enrichment and the PPI network of these BD-related modules were explored with Metascape and the STRING database. We then identified four genes, NOTCH1, POMC, NGF, and DRD2, as hub genes underlying BD. In a further validation analysis using a separate dataset (GSE12649), we validated several biological processes and pathways (such as actin filament-based process, axon development, hormone level regulation) and NOTCH1 as a hub gene of BD.
To understand the genetic mechanisms of BD, various studies have been carried out, adopting various genetic techniques such as microarray, single-cell sequencing, RNA-sequencing, and GWAS. The microarray datasets we analyzed were contributed by Ryan and colleagues; their results suggest that BD is associated with the dysregulation of the ubiquitin pathway and synaptic genes in orbitofrontal cortex (16). As we mentioned in the Introduction, given the complex and multifactorial nature of BD genetic mechanisms, here we investigated the potential alterations of the interconnection between genes in BD using WGCNA (33). We identified three critical modules in the main analyses, which are associated with various biological processes and pathways, such as muscle system processes, biosynthesis of carbohydrate derivatives, actin filament formation, axon development, hormone level regulation, MAPK signaling pathway, and endocrine resistance. Some of these findings were confirmed in the validation analysis in a separate dataset, such as actin filament-based process, axon development, hormone level regulation. Previous studies have revealed alterations of gene sets mediating synaptic transmission and nervous system development in BD based on microarray technology (16), pathway-based analyses (34) or prioritized gene framework (35) of the genome-wide association datasets. Other studies have highlighted many other pathways, showing convergence on neuroplasticity (5–7). Our findings of actin filament-based process and axon development are in line with consistent observations of neuroplasticity alterations in BD and provide evidence for potential frontal structural plasticity abnormalities in BD.
The most significant KEGG pathways associated with BD were the MAPK signaling pathway and endocrine resistance. A GWAS study has shown that one of the KEGG pathways involved in BD was the MAPK signaling pathway (36), which is involved in mediating entrainment of the circadian system (37). Many circadian genes have been associated with BD (38). The MAPK change in the intracellular signal cascade may be caused by the immune imbalance in BD (39). Endocrine resistance refers to resistance to endocrine therapy agents, such as selective estrogen receptor modulators (e.g., tamoxifen). Some studies have found that tamoxifen was effective against manic episodes (40) and our study lends further support to the potential role of endocrine resistance in BD pathogenesis. Nevertheless, these two pathways were not confirmed in the validation dataset. Instead, both primary and validation datasets revealed that BD-related modules are mainly enriched in has05414 (Dilated cardiomyopathy). Future studies are warranted to examine whether this pathway is involved in the pathophysiology of BD or a by-product of long-term mood stabilizer treatment.
The Notch signaling pathway plays critical roles in neural development and brain homeostasis and is involved in neuronal migration, early differentiation, memory formation, and synaptic plasticity (41). The Notch receptor contains four members (Notch1, Notch2, Notch3, and Notch4), and their expression patterns in the forebrain are as follows: NOTCH1 in neurons, astrocytes, precursors, ependymal cells, and endothelium; NOTCH2 in neurons and precursors; NOTCH3 in precursors; NOTCH4 in the endothelium (42). The Notch pathway is closely associated with the pathological mechanism of BD (43, 44). For example, the NOTCH4 gene expression in peripheral blood cells has been found to be upregulated in BD (45). The NOTCH3 mutation has also been reported in BD, which however was not consistent across studies (46, 47). A recent WGCNA study with relatively small samples (17 BD vs. 19 controls) from the prefrontal cortex reported NOTCH2 as one of the 30 hub genes in BD (48). Our results highlight NOTCH1 as a hub gene for BD in both primary and validation datasets. While these results together suggest the involvement of Notch pathway in BD, the inconsistent findings across studies may arise from differences in tissue types, analysis methods, and sample sizes. Intriguingly, the NOTCH1 signaling could be activated by valproic acid (49), a commonly used mood stabilizer, which suggests that NOTCH1 may serve as a potential treatment target for BD.
Our main results also revealed POMC, NGF, and DRD2 as hub genes for BD. Proopiomelanocortin (POMC)-derived peptides are involved in the regulation of energy homeostasis, learning, memory, inflammation, and immune modulation (50, 51). The significantly increased levels of the critical pituitary hormones POMC indicated dysfunction of the HPA axis of BD (52, 53). POMC is also one of the shared genes between mood disorder and cardiometabolic diseases (54). In the central nervous system, nerve growth factor (NGF) play key roles in neuroprotection and neural repair (55). Based on published GWASs and candidate gene studies, the NGF gene might be a useful biological marker for the manic state and early detection of conversion from significant depression to BD (56–58). Finally, the DRD2 gene encodes the D2 subtype of the dopamine receptor. Several studies have shown that the DRD2 gene is associated with BD and that polymorphism in DRD2 may play a role in BD development (59–61). However, these candidate genes were not observed in the validation dataset and their involvement in BD warrants further scrutiny.
Limitations
Our study has some limitations. First, the small sample size for WGCNA may affect the robustness of the observed results. Sample sizes in our main and validation datasets met the minimum requirements for WGCNA (i.e., larger than 15 samples per group) (62), but may be not large enough to detect modules with smaller effect sizes. Future studies with larger sample sizes are needed to validate our findings. Second, compared to RNA-sequencing, the microarray data is limited by the probes pre-defined by the manufacturer and is not sensitive to low-abundance genes. As the RNA-sequencing data storage and analysis become increasingly available to researchers, future studies have the opportunities to reveal other potential BD-related genetic alterations. Third, the brain tissue we analyzed contained multiple cell types, which may have different gene expression profiles. For instance, the NOTCH1 seems to have higher expression levels in glia cells than in neurons [Supplementary Figure 5, based on the single-cell RNA sequence of 466 cells in the healthy human brain in a public scRNA-seq database scRNASeqDB (63, 64)]. Our study may fail to detect BD-related changes in specific cell types; it is also unclear whether our results were driven by one or some cell types. Future investigation is warranted to reveal the cell-type-specific alterations associated with BD. Finally, this was a preliminary study by using public data, and the results need to be further validated with molecular biology experiments. Although some essential genes and pathways were verified in another dataset (GSE12649), the reliability of our study was still insufficient and the findings should be interpreted with caution.
Conclusions
In summary, we performed WGCNA in independent gene expression datasets and highlighted NOTCH1 as one candidate gene of BD and the involvement of several biological processes such as actin filament-based process and axon development, which might be targets for BD diagnosis and treatment. These results provide new perspectives for understanding BD pathogenesis and invite further investigations and validations on the candidate genes and biological processes/pathways we observed.
Data Availability Statement
Publicly available datasets were analyzed in this study. This data can be found here: https://www.ncbi.nlm.nih.gov/geo/.
Author Contributions
Z-QZ, W-WW, J-TL, and T-MS designed the study and wrote the manuscript. Z-QZ, J-DC, G-YZ, and J-YL prepared and analyzed the data. Y-KW, YZ, and Y-AS prepared and reviewed the study. All authors contributed to the article and approved the submitted version.
Funding
This work was supported by the Capital Medical Development Research Fund (2020-2-4113), the National Natural Science Foundation of China (Grant Nos. 81630031, 81771468, 82071528, and 81601184), and the Beijing Brain Project (grant No. Z171100000117016).
Conflict of Interest
The authors declare that the research was conducted in the absence of any commercial or financial relationships that could be construed as a potential conflict of interest.
Supplementary Material
The Supplementary Material for this article can be found online at: https://www.frontiersin.org/articles/10.3389/fpsyt.2021.553305/full#supplementary-material
References
1. Ferrari AJ, Stockings E, Khoo JP, Erskine HE, Degenhardt L, Vos T, et al. The prevalence and burden of bipolar disorder: findings from the Global Burden of Disease Study 2013. Bipolar Disord. (2016) 18:440–50. doi: 10.1111/bdi.12423
2. Gordovez FJA, McMahon FJ. The genetics of bipolar disorder. Mol Psychiatry. (2020) 25:544–59. doi: 10.1038/s41380-019-0634-7
3. Ikeda M, Saito T, Kondo K, Iwata N. Genome-wide association studies of bipolar disorder: a systematic review of recent findings and their clinical implications. Psychiatry Clin Neurosci. (2018) 72:52–63. doi: 10.1111/pcn.12611
4. Hou L, Bergen SE, Akula N, Song J, Hultman CM, Landen M, et al. Genome-wide association study of 40,000 individuals identifies two novel loci associated with bipolar disorder. Hum Mol Genet. (2016) 25:3383–94. doi: 10.1093/hmg/ddw181
5. Stahl EA, Breen G, Forstner AJ, McQuillin A, Ripke S, Trubetskoy V, et al. Genome-wide association study identifies 30 loci associated with bipolar disorder. Nat Genet. (2019) 51:793–803. doi: 10.1038/s41588-019-0397-8
6. Sigitova E, Fisar Z, Hroudova J, Cikankova T, Raboch J. Biological hypotheses and biomarkers of bipolar disorder. Psychiatry Clin Neurosci. (2017) 71:77–103. doi: 10.1111/pcn.12476
7. Akula N, Barb J, Jiang X, Wendland JR, Choi KH, Sen SK, et al. RNA-sequencing of the brain transcriptome implicates dysregulation of neuroplasticity, circadian rhythms and GTPase binding in bipolar disorder. Mol Psychiatry. (2014) 19:1179–85. doi: 10.1038/mp.2013.170
8. Katrinli S, Lori A, Kilaru V, Carter S, Powers A, Gillespie CF, et al. Association of HLA locus alleles with posttraumatic stress disorder. Brain Behav Immun. (2019) 81:655–8. doi: 10.1016/j.bbi.2019.07.016
9. Geng R, Li Z, Yu S, Yuan C, Hong W, Wang Z, et al. Weighted gene co-expression network analysis identifies specific modules and hub genes related to subsyndromal symptomatic depression. World J Biol Psychiatry. (2018) 21:102–10. doi: 10.1080/15622975.2018.1548782
10. Rangaraju S, Dammer EB, Raza SA, Rathakrishnan P, Xiao H, Gao T, et al. Identification and therapeutic modulation of a pro-inflammatory subset of disease-associated-microglia in Alzheimer's disease. Mol Neurodegener. (2018) 13:24. doi: 10.1186/s13024-018-0254-8
11. Mina E, van Roon-Mom W, Hettne K, van Zwet E, Goeman J, Neri C, et al. Common disease signatures from gene expression analysis in Huntington's disease human blood and brain. Orphanet J Rare Dis. (2016) 11:97. doi: 10.1186/s13023-016-0475-2
12. Gandal MJ, Haney JR, Parikshak NN, Leppa V, Ramaswami G, Hartl C, et al. Shared molecular neuropathology across major psychiatric disorders parallels polygenic overlap. Science. (2018) 359:693–7. doi: 10.1126/science.aad6469
13. de Jong S, Boks MP, Fuller TF, Strengman E, Janson E, de Kovel CG, et al. A gene co-expression network in whole blood of schizophrenia patients is independent of antipsychotic-use and enriched for brain-expressed genes. PLoS ONE. (2012) 7:e39498. doi: 10.1371/journal.pone.0039498
14. Langfelder P, Horvath S. WGCNA: an R package for weighted correlation network analysis. BMC Bioinformatics. (2008) 9:559. doi: 10.1186/1471-2105-9-559
15. Wan Q, Tang J, Han Y, Wang D. Co-expression modules construction by WGCNA and identify potential prognostic markers of uveal melanoma. Exp Eye Res. (2018) 166:13–20. doi: 10.1016/j.exer.2017.10.007
16. Ryan MM, Lockstone HE, Huffaker SJ, Wayland MT, Webster MJ, Bahn S. Gene expression analysis of bipolar disorder reveals downregulation of the ubiquitin cycle and alterations in synaptic genes. Mol Psychiatry. (2006) 11:965–78. doi: 10.1038/sj.mp.4001875
17. Price JL, Drevets WC. Neurocircuitry of mood disorders. Neuropsychopharmacology. (2010) 35:192–216. doi: 10.1038/npp.2009.104
18. Gautier L, Cope L, Bolstad BM, Irizarry RA. Affy–analysis of affymetrix genechip data at the probe level. Bioinformatics. (2004) 20:307–15. doi: 10.1093/bioinformatics/btg405
19. Leek JT, Johnson WE, Parker HS, Jaffe AE, Storey JD. The sva package for removing batch effects and other unwanted variation in high-throughput experiments. Bioinformatics. (2012) 28:882–3. doi: 10.1093/bioinformatics/bts034
20. Durinck S, Spellman PT, Birney E, Huber W. Mapping identifiers for the integration of genomic datasets with the R/Bioconductor package biomaRt. Nat Protoc. (2009) 4:1184–91. doi: 10.1038/nprot.2009.97
21. The Gene Ontology C. Expansion of the gene ontology knowledgebase and resources. Nucleic Acids Res. (2017) 45:D331–8. doi: 10.1093/nar/gkw1108
22. Ashburner M, Ball CA, Blake JA, Botstein D, Butler H, Cherry JM, et al. Gene ontology: tool for the unification of biology. The Gene Ontology Consortium. Nat Genet. (2000) 25:25–9. doi: 10.1038/75556
23. Kanehisa M, Sato Y, Kawashima M, Furumichi M, Tanabe M. KEGG as a reference resource for gene and protein annotation. Nucleic Acids Res. (2016) 44:D457–62. doi: 10.1093/nar/gkv1070
24. Zhou Y, Zhou B, Pache L, Chang M, Khodabakhshi AH, Tanaseichuk O, et al. Metascape provides a biologist-oriented resource for the analysis of systems-level datasets. Nat Commun. (2019) 10:1523. doi: 10.1038/s41467-019-09234-6
25. Shannon P, Markiel A, Ozier O, Baliga NS, Wang JT, Ramage D, et al. Cytoscape: a software environment for integrated models of biomolecular interaction networks. Genome Res. (2003) 13:2498–504. doi: 10.1101/gr.1239303
26. Chin CH, Chen SH, Wu HH, Ho CW, Ko MT, Lin CY. cytoHubba: identifying hub objects and sub-networks from complex interactome. BMC Syst Biol. (2014) 8(Suppl. 4):S11. doi: 10.1186/1752-0509-8-S4-S11
27. Sang L, Wang XM, Xu DY, Zhao WJ. Bioinformatics analysis of aberrantly methylated-differentially expressed genes and pathways in hepatocellular carcinoma. World J Gastroenterol. (2018) 24:2605–16. doi: 10.3748/wjg.v24.i24.2605
28. Li BQ, Zhang J, Huang T, Zhang L, Cai YD. Identification of retinoblastoma related genes with shortest path in a protein-protein interaction network. Biochimie. (2012) 94:1910–7. doi: 10.1016/j.biochi.2012.05.005
29. Zamani-Ahmadmahmudi M, Najafi A, Nassiri SM. Reconstruction of canine diffuse large B-cell lymphoma gene regulatory network: detection of functional modules and hub genes. J Comp Pathol. (2015) 152:119–30. doi: 10.1016/j.jcpa.2014.11.008
30. Iwamoto K, Bundo M, Kato T. Altered expression of mitochondria-related genes in postmortem brains of patients with bipolar disorder or schizophrenia, as revealed by large-scale DNA microarray analysis. Hum Mol Genet. (2005) 14:241–53. doi: 10.1093/hmg/ddi022
31. Liu FF, Wang J, Hu F, Wei Q, Li K. Gene coexpression networks analysis of sickle stroke risk. J Cell Biochem. (2019) 120:15182–9. doi: 10.1002/jcb.28780
32. Li K, Hu F, Xiong W, Wei Q, Liu FF. Network-based transcriptomic analysis reveals novel melatonin-sensitive genes in cardiovascular system. Endocrine. (2019) 64:414–9. doi: 10.1007/s12020-019-01925-w
33. Zhao W, Langfelder P, Fuller T, Dong J, Li A, Hovarth S. Weighted gene coexpression network analysis: state of the art. J Biopharm Stat. (2010) 20:281–300. doi: 10.1080/10543400903572753
34. Askland K, Read C, Moore J. Pathways-based analyses of whole-genome association study data in bipolar disorder reveal genes mediating ion channel activity and synaptic neurotransmission. Hum Genet. (2009) 125:63–79. doi: 10.1007/s00439-008-0600-y
35. Kao C-F, Chuang L-C, Kuo P-H. Risk and information evaluation of prioritized genes for complex traits: application to bipolar disorder. Am J Med Genet B Neuropsychiatr Genet. (2014) 165B:596–606. doi: 10.1002/ajmg.b.32263
36. Zhao Y, Liang X, Zhu F, Wen Y, Xu J, Yang J, et al. A large-scale integrative analysis of GWAS and common meQTLs across whole life course identifies genes, pathways and tissue/cell types for three major psychiatric disorders. Neurosci Biobehav Rev. (2018) 95:347–52. doi: 10.1016/j.neubiorev.2018.10.005
37. Wang XL, Yuan K, Zhang W, Li SX, Gao GF, Lu L. Regulation of circadian genes by the MAPK pathway: implications for rapid antidepressant action. Neurosci Bull. (2019) 36:66–76. doi: 10.1007/s12264-019-00358-9
38. Melo MCA, Abreu RLC, Linhares Neto VB, de Bruin PFC, de Bruin VMS. Chronotype and circadian rhythm in bipolar disorder: a systematic review. Sleep Med Rev. (2017) 34:46–58. doi: 10.1016/j.smrv.2016.06.007
39. Wieck A, Grassi-Oliveira R, do Prado CH, Rizzo LB, de Oliveira AS, Kommers-Molina J, et al. Differential neuroendocrine and immune responses to acute psychosocial stress in women with type 1 bipolar disorder. Brain Behav Immun. (2013) 34:47–55. doi: 10.1016/j.bbi.2013.07.005
40. Meinhard N, Kessing LV, Vinberg M. The role of estrogen in bipolar disorder, a review. Nord J Psychiatry. (2014) 68:81–7. doi: 10.3109/08039488.2013.775341
41. Ho DM, Artavanis-Tsakonas S, Louvi A. The Notch pathway in CNS homeostasis and neurodegeneration. Wiley Interdiscip Rev Dev Biol. (2020) 9:e358. doi: 10.1002/wdev.358
42. Ables JL, Breunig JJ, Eisch AJ, Rakic P. Not(ch) just development: Notch signalling in the adult brain. Nat Rev Neurosci. (2011) 12:269–83. doi: 10.1038/nrn3024
43. Hoseth EZ, Krull F, Dieset I, Morch RH, Hope S, Gardsjord ES, et al. Attenuated notch signaling in schizophrenia and bipolar disorder. Sci Rep. (2018) 8:5349. doi: 10.1038/s41598-018-23703-w
44. Pedroso I, Lourdusamy A, Rietschel M, Nothen MM, Cichon S, McGuffin P, et al. Common genetic variants and gene-expression changes associated with bipolar disorder are over-represented in brain signaling pathway genes. Biol Psychiatry. (2012) 72:311–7. doi: 10.1016/j.biopsych.2011.12.031
45. Dieset I, Djurovic S, Tesli M, Hope S, Mattingsdal M, Michelsen A, et al. Up-regulation of NOTCH4 gene expression in bipolar disorder. Am J Psychiatry. (2012) 169:1292–300. doi: 10.1176/appi.ajp.2012.11091431
46. Ahearn EP, Speer MC, Chen YT, Steffens DC, Cassidy F, Van Meter S, et al. Investigation of Notch3 as a candidate gene for bipolar disorder using brain hyperintensities as an endophenotype. Am J Med Genet Suppl. (2002) 114:652–8. doi: 10.1002/ajmg.10512
47. Wang J, Li J, Kong F, Lv H, Guo Z. Bipolar II disorder as the initial presentation of CADASIL: an underdiagnosed manifestation. Neuropsychiatr Dis Treat. (2017) 13:2175–9. doi: 10.2147/NDT.S142321
48. Liu Y, Gu HY, Zhu J, Niu YM, Zhang C, Guo GL. Identification of hub genes and key pathways associated with bipolar disorder based on weighted gene co-expression network analysis. Front Physiol. (2019) 10:1081. doi: 10.3389/fphys.2019.01081
49. Greenblatt DY, Cayo MA, Adler JT, Ning L, Haymart MR, Kunnimalaiyaan M, et al. Valproic acid activates Notch1 signaling and induces apoptosis in medullary thyroid cancer cells. Ann Surg. (2008) 247:1036–40. doi: 10.1097/SLA.0b013e3181758d0e
50. Carniglia L, Ramirez D, Durand D, Saba J, Turati J, Caruso C, et al. Neuropeptides and microglial activation in inflammation, pain, and neurodegenerative diseases. Mediators Inflamm. (2017) 2017:5048616. doi: 10.1155/2017/5048616
51. Segura AG, Mitjans M, Jimenez E, Fatjo-Vilas M, Ruiz V, Saiz PA, et al. Association of childhood trauma and genetic variability of CRH-BP and FKBP5 genes with suicidal behavior in bipolar patients. J Affect Disord. (2019) 255:15–22. doi: 10.1016/j.jad.2019.05.014
52. Stelzhammer V, Alsaif M, Chan MK, Rahmoune H, Steeb H, Guest PC, et al. Distinct proteomic profiles in post-mortem pituitary glands from bipolar disorder and major depressive disorder patients. J Psychiatr Res. (2015) 60:40–8. doi: 10.1016/j.jpsychires.2014.09.022
53. Belvederi Murri M, Prestia D, Mondelli V, Pariante C, Patti S, Olivieri B, et al. The HPA axis in bipolar disorder: systematic review and meta-analysis. Psychoneuroendocrinology. (2016) 63:327–42. doi: 10.1016/j.psyneuen.2015.10.014
54. Amare AT, Schubert KO, Klingler-Hoffmann M, Cohen-Woods S, Baune BT. The genetic overlap between mood disorders and cardiometabolic diseases: a systematic review of genome wide and candidate gene studies. Transl Psychiatry. (2017) 7:e1007. doi: 10.1038/tp.2016.261
55. Sofroniew MV, Howe CL, Mobley WC. Nerve growth factor signaling, neuroprotection, and neural repair. Annu Rev Neurosci. (2001) 24:1217–81. doi: 10.1146/annurev.neuro.24.1.1217
56. Liu X, Zhang T, He S, Hong B, Chen Z, Peng D, et al. Elevated serum levels of FGF-2, NGF, and IGF-1 in patients with manic episode of bipolar disorder. Psychiatry Res. (2014) 218:54–60. doi: 10.1016/j.psychres.2014.03.042
57. Ament SA, Szelinger S, Glusman G, Ashworth J, Hou L, Akula N, et al. Rare variants in neuronal excitability genes influence risk for bipolar disorder. Proc Natl Acad Sci U S A. (2015) 112:3576–81. doi: 10.1073/pnas.1424958112
58. Pedrotti Moreira F, Cardoso TC, Mondin TC, Wiener CD, de Mattos Souza LD, Oses JP, et al. Serum level of nerve growth factor is a potential biomarker of conversion to bipolar disorder in women with major depressive disorder. Psychiatry Clin Neurosci. (2019) 73:590–3. doi: 10.1111/pcn.12896
59. Zhang L, Hu L, Li X, Zhang J, Chen B. The DRD2 rs1800497 polymorphism increase the risk of mood disorder: evidence from an update meta-analysis. J Affect Disord. (2014) 158:71–7. doi: 10.1016/j.jad.2014.01.015
60. Wang Z, Jun C, Gao K, Yang H, Fang Y. Perspective on etiology and treatment of bipolar disorders in china: clinical implications and future directions. Neurosci Bull. (2019) 35:608–12. doi: 10.1007/s12264-019-00389-2
61. Xu Y, Wang J, Rao S, Ritter M, Manor LC, Backer R, et al. An integrative computational approach to evaluate genetic markers for bipolar disorder. Sci Rep. (2017) 7:6745. doi: 10.1038/s41598-017-05846-4
62. Langfelder P, Horvath S. WGCNA package FAQ. (2017). Available online at: https://horvath.genetics.ucla.edu/html/CoexpressionNetwork/Rpackages/WGCNA/faq.html (accessed September 4, 2020).
63. Cao Y, Zhu J, Jia P, Zhao Z. scRNASeqDB: a database for RNA-seq based gene expression profiles in human single cells. Genes. (2017) 8:368. doi: 10.3390/genes8120368
Keywords: bipolar disorders, coexpression modules, hub genes, WGCNA, pathway analysis
Citation: Zhang Z-Q, Wu W-W, Chen J-D, Zhang G-Y, Lin J-Y, Wu Y-K, Zhang Y, Su Y-A, Li J-T and Si T-M (2021) Weighted Gene Coexpression Network Analysis Reveals Essential Genes and Pathways in Bipolar Disorder. Front. Psychiatry 12:553305. doi: 10.3389/fpsyt.2021.553305
Received: 20 April 2020; Accepted: 24 February 2021;
Published: 17 March 2021.
Edited by:
Elena Martín-García, Pompeu Fabra University, SpainReviewed by:
Gabriel R. Fries, University of Texas Health Science Center at Houston, United StatesLiang Chen, Chinese Academy of Medical Sciences and Peking Union Medical College, China
Copyright © 2021 Zhang, Wu, Chen, Zhang, Lin, Wu, Zhang, Su, Li and Si. This is an open-access article distributed under the terms of the Creative Commons Attribution License (CC BY). The use, distribution or reproduction in other forums is permitted, provided the original author(s) and the copyright owner(s) are credited and that the original publication in this journal is cited, in accordance with accepted academic practice. No use, distribution or reproduction is permitted which does not comply with these terms.
*Correspondence: Tian-Mei Si, c2kudGlhbi1tZWlAMTYzLmNvbQ==; Ji-Tao Li, bGp0XzEwMjEyNEAxNjMuY29t
†These authors have contributed equally to this work