 S. Andrea Wijtenburg*
 Jeffrey West
 Stephanie A. Korenic
 Franchesca KuhneyFrank E. GastonHongji Chen
 Laura M. Rowland
- Maryland Psychiatric Research Center, Department of Psychiatry, University of Maryland School of Medicine, Baltimore, MD, United States
Schizophrenia is a severe mental illness with visual learning and memory deficits, and reduced long term potentiation (LTP) may underlie these impairments. Recent human fMRI and EEG studies have assessed visual plasticity that was induced with high frequency visual stimulation, which is thought to mimic an LTP-like phenomenon. This study investigated the differences in visual plasticity in participants with schizophrenia and healthy controls. An fMRI visual plasticity paradigm was implemented, and proton magnetic resonance spectroscopy data were acquired to determine whether baseline resting levels of glutamatergic and GABA metabolites were related to visual plasticity response. Adults with schizophrenia did not demonstrate visual plasticity after family-wise error correction; whereas, the healthy control group did. There was a significant regional difference in visual plasticity in the left visual cortical area V2 when assessing group differences, and baseline GABA levels were associated with this specific ROI in the SZ group only. Overall, this study suggests that visual plasticity is altered in schizophrenia and related to basal GABA levels.
Introduction
Schizophrenia (SZ) is a severe psychiatric illness with well-documented visual learning and processing deficits (1–3), which may be due to alterations in long-term potentiation (LTP). LTP is a basic cellular plasticity mechanism underlying learning and memory, and it has been previously studied in a variety of regions including the hippocampus and visual cortex using high frequency electrical or visual stimulation, respectively (4–7). Clapp et al. adapted a visual plasticity paradigm that employed low and high frequency stimulation known to induce LTP-like changes in rodents and successfully tested the paradigm in healthy adults using EEG and fMRI. In these studies, increased visual evoked potentials (8) or increased fMRI BOLD activation (9) were observed following high frequency stimulation, which was similar to previous animal studies. A similar visual plasticity paradigm has been used in several other studies in healthy adults and shown elevations in visual evoked potentials or fMRI BOLD activation post-high frequency stimulation (10, 11) as well as a variable response in fMRI BOLD activation post-high frequency stimulation (12).
Several studies have utilized visual paradigms to assess visual plasticity in adults with SZ vs. healthy controls using EEG. Cavus et al. demonstrated impaired visual cortical plasticity in adults with SZ compared to healthy controls as evidenced by a lack of persistent visual evoked potentials in the visual cortex post-high frequency stimulation (13). In a study where participants were given D-cycloserine or placebo, exploratory analyses by Forsyth et al. (14) showed impaired visual evoked potentials post-high frequency stimulation in adults with SZ who received placebo compared to healthy controls who received placebo. The visual plasticity response in the SZ group did not change with administration of 100 mg of D-cycloserine. D'Souza et al. reported an LTP-like enhancement with a dose of a glycine transporter-1 (~75% occupancy) in adults with SZ (15). Another study by Wynn et al. demonstrated a plasticity effect (visual evoked potential post-high frequency stimulation) in both healthy controls and adults with SZ; however, the groups were not significantly different (16). In other visual paradigms that employed monocular deprivation or sensory adaption, adults with SZ have significantly reduced visual evoked potential amplitudes compared to controls (17, 18). Thus, in the literature to date, there appears to be mixed results regarding whether visual plasticity is impaired in SZ.
Glutamate, the primary excitatory neurotransmitter in the human brain, is significantly involved in LTP such that it modulates NMDA receptors, which triggers a cascade of events leading to a long-lasting increase in signal transmission between neurons (4, 19). Currently, in humans, the only non-invasive methodology to quantify glutamatergic metabolites in vivo is proton magnetic resonance spectroscopy. This technique has been used to show altered levels of glutamatergic metabolites in several different brain regions in adults with SZ (20). In addition to glutamate, magnetic resonance spectroscopy can be used to measure glutamine, of which 80% is derived from glutamate involved in neurotransmission, and GABA, the primary inhibitory transmitter in the human brain and modulator of LTP in vivo (21). Gaining a better understanding of basal glutamate, glutamine, and GABA levels and the relationship to visual plasticity may provide insight into the mixed visual plasticity results in SZ and in the future, serve as a potential pharmacological treatment target.
The first aim of this study was to test the hypothesis that visual plasticity is reduced in SZ using fMRI. A second aim was to use a multimodal approach to determine whether baseline resting levels of occipital cortex glutamatergic metabolites and GABA as measured using magnetic resonance spectroscopy were related to visual plasticity response as assessed using fMRI. Given that glutamatergic function is altered in SZ and a previous study by our group in healthy controls showed that glutamine was related to visual plasticity (11), we hypothesized that the relationship between glutamine to visual plasticity would be weaker in adults with SZ compared to healthy controls. We expected the magnitude of the relationship between glutamate and visual plasticity as well as GABA and visual plasticity to be smaller in adults with SZ compared to healthy controls.
Materials and Methods
All research was conducted at the University of Maryland Center for Brain Imaging Research (CBIR) at the Maryland Psychiatric Research Center. This study was approved by the University of Maryland Baltimore Institutional Review Board, and all participants (both SZ and healthy controls) provided written, informed consent prior to study initiation. Adults with SZ were evaluated for capacity to consent to ensure that each participant fully understood the study procedures. The healthy control data was previously reported in (11).
Participant Characteristics
Seventeen adults with SZ and 18 healthy controls participated in the study. Participant demographics are described in Table 1. Adults with SZ were characterized and evaluated with the Structured Clinical Interview for DSM-IV (SCID), the Brief Psychiatric Rating Scale (BPRS) (22), and the Brief Negative Symptom Scale (BNSS) (23). For both groups, inclusion criteria for the study were: (1) no contraindication for magnetic resonance imaging scanning, (2) no current or past neurological condition, head trauma, or focal findings on an magnetic resonance imaging, or (3) no substance abuse in the past 6 months or lifetime dependence excluding nicotine. The healthy control group had no current or past psychiatric, neurological, or major medical disorders or substance abuse/dependence. Functional capacity was assessed using the UCSD Performance Based Skills Assessment (UPSA-2) (24). From the MATRICS Consensus Cognitive Battery (MCCB), verbal and visuo-spatial learning were assessed using the Hopkins Verbal Learning Task—Revised (HVLT) and the Brief Visuospatial Memory Task—Revised (BVMT) (25, 26).
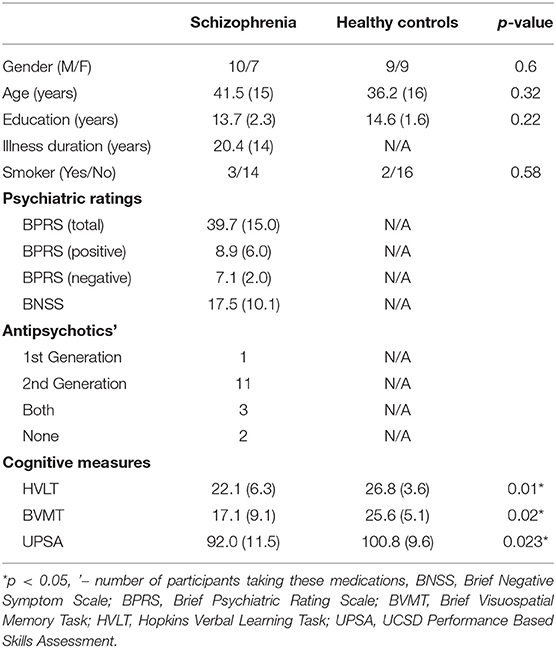
Table 1. Participant characteristics, mean (standard deviation).
Neuroimaging
A Siemens TIM Trio 3T MR system with a 32-channel phased array head coil was utilized for this study. The imaging protocol consisted of axial T1-weighted MP-RAGE images used for both magnetic resonance spectroscopy voxel and echo planar imaging placement, spectroscopy data acquisition, and finally fMRI.
MRS methods were previously described (11). Briefly, the magnetic resonance spectroscopy voxel was placed along the midline in the occipital cortex (Figure 1) in both groups. Participants were asked to rest but remain awake. To detect glutamate and glutamine, spectra were acquired with phase rotation STEAM (PR-STEAM) (27–30): TR/TM/TE = 2,000/10/6.5-ms, VOI ~ 3.0 × 4.0 × 2.0-cm3, NEX = 128, and water reference NEX = 16. Data were post-processed offline using in-house MATLAB code and then quantified in LCModel (6.3-0I). For GABA detection, a macromolecule–suppressed MEGA-PRESS sequence was utilized (31): TR/TE = 2,000/68 ms, VOI ~ 3.0 × 4.0 × 2.0-cm3, NEX = 256 (128 ON and 128 OFF), and water reference NEX = 16, and data were quantified in Gannet 2.0. In-house MATLAB code based on Gasparovic et al. (32) was used to calculate metabolite levels using water as a reference as well as correct for the proportion of the gray matter (GM), white matter (WM), and cerebrospinal fluid (CSF) within each spectroscopic voxel and relaxation effects. More details regarding quantification are outlined here (33). All metabolite levels are reported in institutional units. See Figure 1 for representative voxel placement and spectra.
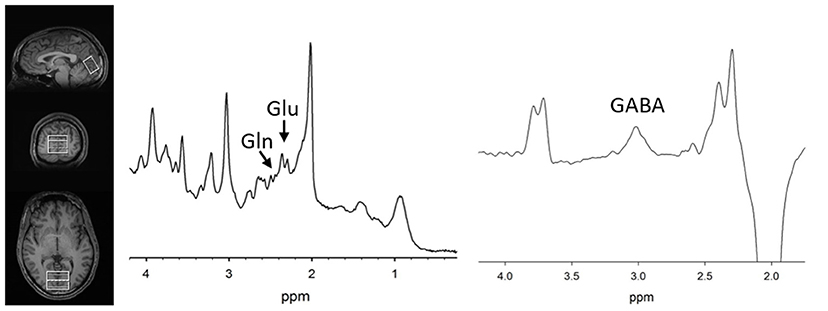
Figure 1. (Left) T1-weighted images showing voxel placement along the midline in the occipital cortex. Representative PR-STEAM spectrum (center) and MEGA-PRESS spectrum (right) from the same participant showing excellent quality data. tCr, total creatine; Glu, glutamate; Gln, glutamine; GABA, γ-aminobutyric acid.
fMRI methods were previously described (11). In brief, E-Prime 2.0 (Psychology Software Tools, Inc., Sharpsburg, PA, USA) was used to display the visual stimulus: a centrally located flashing checkerboard, based on based on previous studies (5, 8, 10, 12, 13) and similar to Cavus et al. (13) and Lahr et al. (12). The task involved two low frequency (0.9 Hz) stimulation runs, one high frequency (9 Hz) stimulation to induce visual plasticity, 2 min of rest, and two runs of low frequency stimulation. During the low frequency stimulation and high frequency stimulation, participants were asked to fixate on a centrally located crosshair except during the 2-min rest period where eyes were closed. During the low frequency stimulation blocks, echo-planar imaging data were acquired TR = 2,100 ms, TE = 27 ms, FOV = 220 × 220 mm, matrix size = 128 × 128, Number of slices = 39,143 measurements, voxel size = 1.7 × 1.7 × 4.0 mm). Echo planar imaging data were analyzed using MATLAB (R2013a) (The Mathworks Inc., Natick, Massachusetts) and Statistical Parametric Mapping (SPM) 8.0 (Wellcome Trust Center for Neuroimaging, Department of Cognitive Neurology, Institute of Neurology, London: http://www.fil.ion.ucl.ac.uk/spm).
First and second level models were previously described (11). Briefly, first level models were performed for each group, and second level modeling involved the following contrasts: (post-high frequency stimulation “on”—“off”) minus (pre-high frequency stimulation “on”—“off”). Second level analysis for both healthy controls and adults with SZ tested for visual plasticity via a one sample t-test, appropriate for within subject designs. A mask of the spectroscopic voxel was applied to restrict the analyses to only the magnetic resonance spectroscopy region.
Statistical Analyses
Using SPSS 23.0 (IBM SPSS Statistics, Armonk, NY, USA), group differences were assessed among the demographic variables via chi-square or t-test as appropriate with significance set to p < 0.05. Normality assessments conducted via the Shapiro-Wilk-test revealed that the data were normally distributed. For the three metabolites of interest, t-tests with significance set at p < 0.05 were performed to examine differences between the two groups. Similarly, t-tests with significance set at p < 0.05 were also computed for magnetic resonance spectroscopy quality factors such as linewidth (LW), signal-to-noise ratio (SNR), and metabolite Cramer Rao Lower Bounds (CRLBs) or GABA fit errors to examine whether data were of similar quality between groups.
Visual plasticity within group differences were considered significant with a threshold set to p < 0.05 FWE-corrected. For between group visual plasticity differences, small volume correction with a region of interest diameter of 4 mm was applied to examine differences in visual plasticity between adults with SZ and healthy controls with significance threshold set to p < 0.05, Family Wise Error (FWE)-corrected.
To examine the relationship between visual plasticity and metabolites, correlations were computed using SPSS 27.0 (IBM SPSS Statistics, Armonk, NY, USA) between region of interest values extracted from significant activations using MarsBar (5) with 4 mm radius and the three metabolite levels (p = 0.05/3). In the SZ group, exploratory analyses were conducted to determine whether cognition function or symptom ratings related to visual plasticity.
Results
Demographics
The two groups were well-matched in terms of gender, age, education, and smoking (p's > 0.05, Table 1). There were significant differences in terms of Hopkins Verbal Learning Test (p = 0.01), Brief Visuospatial Memory Test (p = 0.02), and UPSA-2 (p = 0.023) such that the SZ group performed worse on measures of memory and functional capacity compared to the healthy control group.
MRS
Table 2 summarizes mean metabolite levels and quality factors. One PR-STEAM dataset was not acquired, and three GABA datasets were excluded due to fit error > 15%. All glutamate and glutamine CRLBs from both healthy controls and SZ were <20 or 30%, respectively. Overall, data were of excellent quality in both groups, and there were no significant differences between groups for linewidth, signal-to-noise ratio, glutamate CRLB, glutamine CRLB, or GABA fit error (p's > 0.05). There were significant differences between healthy controls and SZ for glutamate (p = 0.021) and glutamine levels (p = 0.016) such that glutamate and glutamine levels were higher in SZ compared to healthy controls as shown in Figure 2. There were no differences in GABA levels between groups (p = 0.22).
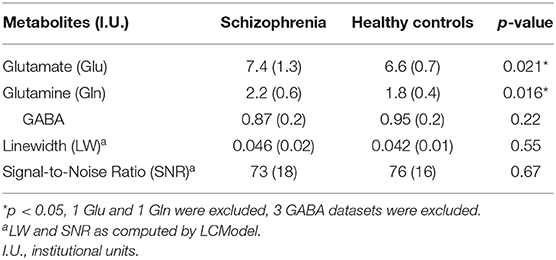
Table 2. Magnetic resonance spectroscopy metabolite means (standard deviation).
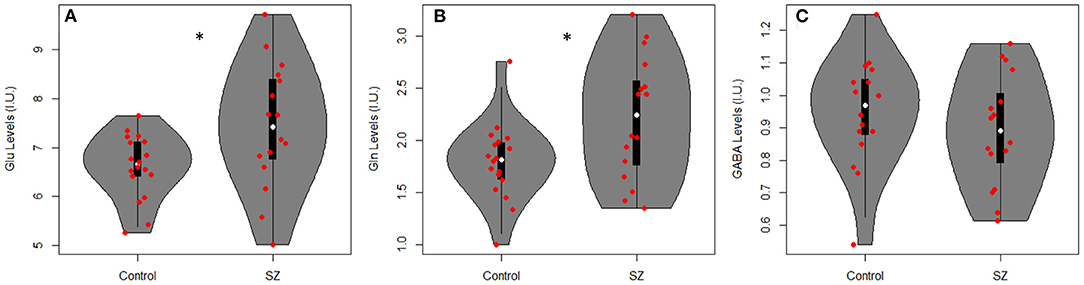
Figure 2. Violin plots with individual data points overlayed in red showing metabolite levels in institutional units (I.U.) for (A) glutamate (Glu), (B) glutamine (Gln), and (C) GABA in adults with SZ and healthy controls (Controls). There were significant differences between groups for Glu (p = 0.021) and Gln levels (p = 0.016) such that Glu and Gln were higher in SZ vs. healthy controls. *p < 0.05.
fMRI
For the healthy control group, visual plasticity was observed in dorsal V2 and V3 and positively related to glutamine with details reported elsewhere (11). There were no significant regions of interest showing visual plasticity in the SZ group that survived FWE-correction. The opposite contrast of pre-high frequency stimulation vs. post-high frequency stimulation yielded no significant regions in both healthy controls and SZ.
Between group differences in visual plasticity were observed in left V2 with region of interest at −12, −82, 26 (p = 0.003 FWE-corrected, T = 3.72) such that healthy controls had greater visual plasticity compared to SZ (Figure 3).
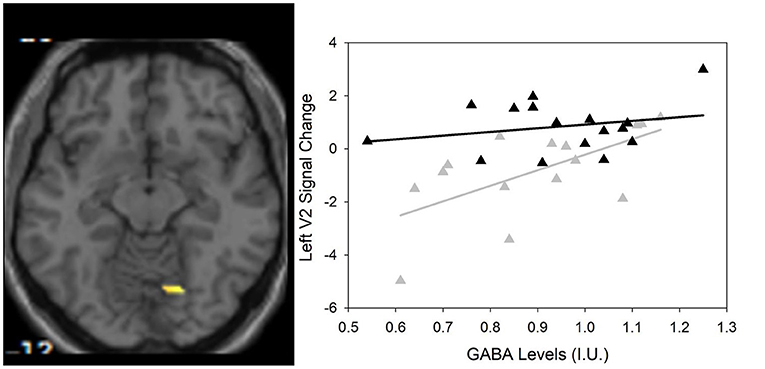
Figure 3. (Left) Group differences in visual activation within the magnetic resonance spectroscopy voxel between healthy controls and SZ using small volume correction that survived Family Wise Error (FWE)-correction (p < 0.05). One region of interest emerges at −12, −82, 26 (scale is from 1.5 to 4) in the left V2 visual cortical area. (Right) Scatter plot showing the significant relationship between GABA and visual plasticity response (r = 0.622, p = 0.013) in the left V2 region of interest in SZ only () compared to HC (▲).
Regression Analyses
As previously described by Wijtenburg et al. (11), higher glutamine was related to greater visual plasticity in healthy controls. In SZ, there were no significant regions of interest that demonstrated visual plasticity therefore the relationships between glutamine, glutamate, or GABA with visual plasticity were not assessed. However, the left V2 region of interest from the group difference analysis was significantly correlated with GABA in the SZ group (r = 0.622, p = 0.013) with significance set to p = 0.05/3 for the 3 metabolites of interest (Table 3). Higher levels of GABA were associated with greater visual plasticity response in the left V2 region of interest in SZ.
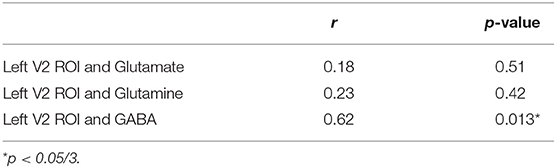
Table 3. Correlations between left V2 region of interest (ROI) and metabolites in SZ.
Correlations With Cognitive Function and Symptom Ratings
Since visual plasticity was not observed in any regions of interest in adults with SZ, there were no relationships to be explored between cognitive function and symptom ratings. Using the left V2 region of interest from the group difference analysis, there were no significant relationships between the left V2 region of interest and cognitive function with p = 0.05/3 (for three cognitive function variables). Further, there was a relationship between visual plasticity in the left V2 region of interest and Brief Negative Symptom Scale score (r = −0.510, p = 0.044) that did not survive correction for multiple comparisons.
Discussion
This study reports for the first time impaired visual plasticity, assessed with fMRI, in adults with SZ compared to healthy controls. While no significant visual plasticity regions of interest survived FWE correction in SZ, group difference analyses revealed a significant visual plasticity region of interest in the left V2. This visual plasticity response region of interest was positively related to GABA levels in SZ. As a whole, these add to the body of evidence implicating altered LTP-like phenomena in SZ.
The study results add to the growing body of literature surrounding impaired visual plasticity in SZ. The majority of EEG studies examining visual plasticity in SZ and healthy controls utilized a flashing checkerboard during the high frequency stimulation component of the protocol (8, 13, 14). Similarly, the two studies that showed visual plasticity in healthy controls also used the same paradigm as part of a fMRI task (9, 11). In contrast, a recent paper by Wynn et al. reported comparable visual plasticity in both healthy control and SZ groups using EEG (16). There were two major differences between the Wynn et al. study and this study that may account for the different study findings: the high frequency stimulus and the time when low frequency stimulation was sampled post-high frequency stimulation. Wynn et al. used a set of vertical or horizontal gratings and recorded post-high frequency stimulation visual evoked potentials 30 min after the high frequency stimulation. Thus, the differences in high frequency stimulus and sampling intervals could account for the differing results.
One question is whether there was a blunted or complete lack of visual plasticity in the SZ group compared to healthy controls. From the double subtraction analysis, examination of the subject level data in the SZ group revealed that 12 of the 17 subjects did show visual plasticity in visual cortical area V3; however, the finding was significant at p < 0.01 uncorrected. Upon further inspection, there was a difference between participants that had a visual plasticity response and participants that did not have a visual plasticity response on the negative symptom subscale of the Brief Psychiatric Rating Scale (p = 0.042) such that participants with a visual plasticity response had greater negative symptom severity than those that did not have a plasticity response. There were no other differences between participants that had a visual plasticity response and participants that did not have a visual plasticity on measures of cognitive function, symptom ratings, or chlorpromazine equivalents (all p's > 0.05). The varied amount of visual plasticity in the patient group reflects the heterogeneity of the illness.
While there were no relationships between the glutamatergic metabolites with visual plasticity in SZ, there were significantly higher levels of glutamate and glutamine in SZ compared to healthy controls in the occipital cortex. Three previous studies in the occipital cortex region over a range of illness durations have not found any glutamate to creatine ratio or glutamate+glutamine to creatine ratio differences (34–36). Our data are the first to show an elevation in these metabolites in the SZ group compared to the healthy control group. This may be due to the fact that our sequence is specifically optimized for glutamatergic metabolite detection; whereas the three previous studies used a spectral editing technique that cannot separate glutamate from glutamine. In terms of GABA in the occipital cortex region, previous study findings are mixed when comparing healthy controls and SZ in that lower GABA to creatine ratio in a SZ group was found in mixed illness duration SZ group (34) to no differences in first episode SZ (35) or chronic group when removing those on anticonvulsants (36). This study also found no significant GABA differences between healthy controls and SZ. Our previous work in healthy controls suggested that optimal basal levels of Glu and Gln are necessary for plasticity and in particular, higher Gln was related to greater visual plasticity response (11). Despite higher levels of glutamate and glutamine, there was no significant visual plasticity in SZ that survived FWE-correction. However, there was one region of interest that was significant at p < 0.01 uncorrected, but there were no significant correlations between the visual plasticity region of interest in SZ and any of the three metabolites (p's > 0.5). Further, there were no significant differences in glutamate, glutamine, or GABA levels between adults with SZ that had visual plasticity and those that did not.
The mechanism underlying the relationship between higher levels of GABA associated with higher visual plasticity in the left V2 in SZ implies that inhibition plays a role in plasticity mechanisms consistent with non-human animal work (37–39). In a previous study using less stringent multiple correction criteria for the region of interest analyses, a similar positive relationship between visual plasticity and GABA levels was observed in healthy controls (11). Here, a similar relationship observed in SZ suggests GABAergic inhibition may influence excitation necessary for visual plasticity and lower GABA levels consistent with alterations in the GABAergic system are documented in the SZ literature (40–42). Examining a rough estimate of excitation/inhibition balance in the occipital cortex (GABA/Glu and GABA/Gln) revealed a trend level difference in GABA/Gln such that GABA/Gln was lower in SZ compared to healthy controls (see Supplementary Material). Further, both ratios were related at trend level (see Supplementary Material) to higher visual plasticity response in SZ only and not in healthy controls. Given the highly complex nature of excitation/inhibition balance (43, 44), these exploratory findings plus the main findings of the manuscript must be interpreted with caution given the small sample size. More studies are needed to thoroughly investigate the inhibition/excitation as it relates to visual plasticity in SZ.
There are several limitations to this study. Glutamate and GABA levels measured via magnetic resonance spectroscopy are a reflection of multiple pools involved in neurotransmission and other mechanisms (e.g., protein synthesis, glutathione formation, etc.). All but one of our SZ participants were taking antipsychotic medications at the time of the study, and the exact effects of these medications on visual plasticity remains unknown. A limitation of the study was that visual attention was not assessed during the fMRI portion of scan. While participants were reminded before each run to stare at the crosshair in the middle of the screen, future studies may benefit from incorporating a means of ensuring attention such as a button to a specific stimulus similar to (13, 16). Another limitation of the study was that post-hoc power calculations revealed that the significant findings were underpowered (61–75%) compared to the standard of 80%. Significant results in this study should be interpreted with caution as further studies are needed with a larger sample size to definitively answer whether visual plasticity is different in SZ and whether baseline metabolite levels in the occipital cortex are related to visual plasticity in SZ. A final limitation is that the adults with SZ are in the chronic phase of the illness, and these study findings may not translate to first episode SZ or those at clinical high risk for psychosis. Future studies are needed to assess visual plasticity response across the illness course.
Thus, this fMRI study tested a visual stimulation paradigm in SZ, and the results further supports several previous EEG studies that show adults with SZ have reduced response to high frequency visual stimulation. The results also show that unlike in healthy controls, glutamatergic levels did not predict plasticity activations in SZ. Future studies may utilize pharmacological or brain stimulation (e.g., TMS) interventions that modulate the glutamatergic or GABAergic systems and potentially improve visual plasticity response.
Data Availability Statement
The datasets generated in this article are not readily available because anonymized data sharing was not included in the consent form for the study. Requests to access the datasets should be directed to S. Andrea Wijtenburg, YXdpanRlbmJ1cmdAc29tLnVtYXJ5bGFuZC5lZHU=.
Ethics Statement
The studies involving human participants were reviewed and approved by University of Maryland Institutional Review Board. The patients/participants provided their written informed consent to participate in this study.
Author Contributions
LR designed the study. SK collected the data. FK, JW, FG, and HC analyzed the data. LR and SW interpreted the results. SW wrote the manuscript. All authors contributed to the article and approved the submitted version.
Funding
This work was supported by the National Institutes of Health: R01MH094520 and P50MH103222.
Conflict of Interest
The authors declare that the research was conducted in the absence of any commercial or financial relationships that could be construed as a potential conflict of interest.
Supplementary Material
The Supplementary Material for this article can be found online at: https://www.frontiersin.org/articles/10.3389/fpsyt.2021.644271/full#supplementary-material
References
1. Butler PD, Javitt DC. Early-stage visual processing deficits in schizophrenia. Curr Opin Psychiatry. (2005) 18:151–7. doi: 10.1097/00001504-200503000-00008
2. Grimes KM, Zanjani A, Zakzanis KK. Memory impairment and the mediating role of task difficulty in patients with schizophrenia. Psychiatry Clin Neurosci. (2017) 71:600–11. doi: 10.1111/pcn.12520
3. Green MF. Cognitive impairment and functional outcome in schizophrenia and bipolar disorder. J Clin Psychiatry. (2006) 67(Suppl. 9):3–8; discussion 36–42. doi: 10.4088/JCP.1006e12
4. Malenka RC, Bear MF. LTP and LTD: an embarrassment of riches. Neuron. (2004) 44:5–21. doi: 10.1016/j.neuron.2004.09.012
5. Teyler TJ, Hamm JP, Clapp WC, Johnson BW, Corballis MC, Kirk IJ. Long-term potentiation of human visual evoked responses. Eur J Neurosci. (2005) 21:2045–50. doi: 10.1111/j.1460-9568.2005.04007.x
6. Bliss TV, Lomo T. Long-lasting potentiation of synaptic transmission in the dentate area of the anaesthetized rabbit following stimulation of the perforant path. J Physiol. (1973) 232:331–56. doi: 10.1113/jphysiol.1973.sp010273
7. Meunier CN, Chameau P, Fossier PM. Modulation of synaptic plasticity in the cortex needs to understand all the players. Front Synaptic Neurosci. (2017) 9:2. doi: 10.3389/fnsyn.2017.00002
8. Clapp WC, Kirk IJ, Hamm JP, Shepherd D, Teyler TJ. Induction of LTP in the human auditory cortex by sensory stimulation. Eur J Neurosci. (2005) 22:1135–40. doi: 10.1111/j.1460-9568.2005.04293.x
9. Clapp WC, Zaehle T, Lutz K, Marcar VL, Kirk IJ, Hamm JP, et al. Effects of long-term potentiation in the human visual cortex: a functional magnetic resonance imaging study. Neuroreport. (2005) 16:1977–80. doi: 10.1097/00001756-200512190-00001
10. Porto FH, Fox AM, Tusch ES, Sorond F, Mohammed AH, Daffner KR. In vivo evidence for neuroplasticity in older adults. Brain Res Bull. (2015) 114:56–61. doi: 10.1016/j.brainresbull.2015.03.004
11. Wijtenburg SA, West J, Korenic SA, Kuhney F, Gaston FE, Chen H, et al. Glutamatergic metabolites are associated with visual plasticity in humans. Neurosci Lett. (2017) 644:30–6. doi: 10.1016/j.neulet.2017.02.020
12. Lahr J, Peter J, Bach M, Mader I, Nissen C, Normann C, et al. Heterogeneity of stimulus-specific response modification-an fMRI study on neuroplasticity. Front Hum Neurosci. (2014) 8:695. doi: 10.3389/fnhum.2014.00695
13. Cavus I, Reinhart RM, Roach BJ, Gueorguieva R, Teyler TJ, Clapp WC, et al. Impaired visual cortical plasticity in schizophrenia. Biol Psychiatry. (2012) 71:512–20. doi: 10.1016/j.biopsych.2012.01.013
14. Forsyth JK, Bachman P, Mathalon DH, Roach BJ, Ye E, Asarnow RF. Effects of augmenting N-methyl-D-aspartate receptor signaling on working memory and experience-dependent plasticity in schizophrenia: an exploratory study using acute d-cycloserine. Schizophr Bull. (2017) 43:1123–33. doi: 10.1093/schbul/sbw193
15. D'Souza DC, Carson RE, Driesen N, Johannesen J, Ranganathan M, Krystal JH, et al. Dose-related target occupancy and effects on circuitry, behavior, and neuroplasticity of the glycine transporter-1 inhibitor PF-03463275 in healthy and schizophrenia subjects. Biol Psychiatry. (2018) 84:413–21. doi: 10.1016/j.biopsych.2017.12.019
16. Wynn JK, Roach BJ, McCleery A, Marder SR, Mathalon DH, Green MF. Evaluating visual neuroplasticity with EEG in schizophrenia outpatients. Schizophr Res. (2019) 212:40–6. doi: 10.1016/j.schres.2019.08.015
17. Foxe JJ, Yeap S, Leavitt VM. Brief monocular deprivation as an assay of short-term visual sensory plasticity in schizophrenia—“the binocular effect”. Front Psychiatry. (2013) 4:164. doi: 10.3389/fpsyt.2013.00164
18. Andrade GN, Butler JS, Peters GA, Molholm S, Foxe JJ. Atypical visual and somatosensory adaptation in schizophrenia-spectrum disorders. Transl Psychiatry. (2016) 6:e804. doi: 10.1038/tp.2016.63
19. Goncalves-Ribeiro J, Pina CC, Sebastiao AM, Vaz SH. Glutamate transporters in hippocampal LTD/LTP: not just prevention of excitotoxicity. Front Cell Neurosci. (2019) 13:357. doi: 10.3389/fncel.2019.00357
20. Wijtenburg SA, Yang S, Fischer BA, Rowland LM. In vivo assessment of neurotransmitters and modulators with magnetic resonance spectroscopy: application to schizophrenia. Neurosci Biobehav Rev. (2015) 51:276–95. doi: 10.1016/j.neubiorev.2015.01.007
21. Arima-Yoshida F, Watabe AM, Manabe T. The mechanisms of the strong inhibitory modulation of long-term potentiation in the rat dentate gyrus. Eur J Neurosci. (2011) 33:1637–46. doi: 10.1111/j.1460-9568.2011.07657.x
22. Overall JE, Gorham DR. The brief psychiatric rating scale. Psychol Rep. (1962) 10:799–812. doi: 10.2466/pr0.1962.10.3.799
23. Kirkpatrick B, Strauss GP, Nguyen L, Fischer BA, Daniel DG, Cienfuegos A, et al. The brief negative symptom scale: psychometric properties. Schizophr Bull. (2011) 37:300–5. doi: 10.1093/schbul/sbq059
24. Patterson TL, Goldman S, McKibbin CL, Hughs T, Jeste DV. UCSD performance-based skills assessment: development of a new measure of everyday functioning for severely mentally ill adults. Schizophr Bull. (2001) 27:235–45. doi: 10.1093/oxfordjournals.schbul.a006870
25. Nuechterlein KH, Green MF, Kern RS, Baade LE, Barch DM, Cohen JD, et al. The MATRICS consensus cognitive battery, part 1: test selection, reliability, and validity. Am J Psychiatry. (2008) 165:203–13. doi: 10.1176/appi.ajp.2007.07010042
26. Kern RS, Nuechterlein KH, Green MF, Baade LE, Fenton WS, Gold JM, et al. The MATRICS consensus cognitive battery, part 2: co-norming and standardization. Am J Psychiatry. (2008) 165:214–20. doi: 10.1176/appi.ajp.2007.07010043
27. Wijtenburg SA, Knight-Scott J. Very short echo time improves the precision of glutamate detection at 3T in 1H magnetic resonance spectroscopy. J Magn Reson Imaging. (2011) 34:645–52. doi: 10.1002/jmri.22638
28. Wijtenburg SA, Gaston FE, Spieker EA, Korenic SA, Kochunov P, Hong LE, et al. Reproducibility of phase rotation STEAM at 3T: Focus on glutathione. Magn Reson Med. (2014) 72:603–9. doi: 10.1002/mrm.24959
29. Bustillo JR, Rediske N, Jones T, Rowland LM, Abbott C, Wijtenburg SA. Reproducibility of phase rotation stimulated echo acquisition mode at 3T in schizophrenia: emphasis on glutamine. Magn Reson Med. (2016) 75:498–502. doi: 10.1002/mrm.25638
30. Wijtenburg SA, Near J, Korenic SA, Gaston FE, Chen H, Mikkelsen M, et al. Comparing the reproducibility of commonly used magnetic resonance spectroscopy techniques to quantify cerebral glutathione. J Magn Reson Imaging. (2019) 49:176–83. doi: 10.1002/jmri.26046
31. Rowland LM, Krause BW, Wijtenburg SA, McMahon RP, Chiappelli J, Nugent KL, et al. Medial frontal GABA is lower in older schizophrenia: a MEGA-PRESS with macromolecule suppression study. Mol Psychiatry. (2016) 21:198–204. doi: 10.1038/mp.2015.34
32. Gasparovic C, Song T, Devier D, Bockholt HJ, Caprihan A, Mullins PG, et al. Use of tissue water as a concentration reference for proton spectroscopic imaging. Magn Reson Med. (2006) 55:1219–26. doi: 10.1002/mrm.20901
33. Wijtenburg SA, Wright SN, Korenic SA, Gaston FE, Ndubuizu N, Chiappelli J, et al. Altered glutamate and regional cerebral blood flow levels in schizophrenia: a (1)H-MRS and pCASL study. Neuropsychopharmacology. (2017) 42:562–71. doi: 10.1038/npp.2016.172
34. Yoon JH, Maddock RJ, Rokem A, Silver MA, Minzenberg MJ, Ragland JD, et al. GABA concentration is reduced in visual cortex in schizophrenia and correlates with orientation-specific surround suppression. J Neurosci. (2010) 30:3777–81. doi: 10.1523/JNEUROSCI.6158-09.2010
35. Goto N, Yoshimura R, Kakeda S, Nishimura J, Moriya J, Hayashi K, et al. Six-month treatment with atypical antipsychotic drugs decreased frontal-lobe levels of glutamate plus glutamine in early-stage first-episode schizophrenia. Neuropsychiatr Dis Treat. (2012) 8:119–22. doi: 10.2147/NDT.S25582
36. Ongur D, Prescot AP, McCarthy J, Cohen BM, Renshaw PF. Elevated gamma-aminobutyric acid levels in chronic schizophrenia. Biol Psychiatry. (2010) 68:667–70. doi: 10.1016/j.biopsych.2010.05.016
37. Staff NP, Spruston N. Intracellular correlate of EPSP-spike potentiation in CA1 pyramidal neurons is controlled by GABAergic modulation. Hippocampus. (2003) 13:801–5. doi: 10.1002/hipo.10129
38. Grover LM, Yan C. Blockade of GABAA receptors facilitates induction of NMDA receptor-independent long-term potentiation. J Neurophysiol. (1999) 81:2814–22. doi: 10.1152/jn.1999.81.6.2814
39. Wigstrom H, Gustafsson B. Facilitated induction of hippocampal long-lasting potentiation during blockade of inhibition. Nature. (1983) 301:603–4. doi: 10.1038/301603a0
40. Taylor SF, Tso IF. GABA abnormalities in schizophrenia: a methodological review of in vivo studies. Schizophr Res. (2015) 167:84–90. doi: 10.1016/j.schres.2014.10.011
41. Gonzalez-Burgos G, Fish KN, Lewis DA. GABA neuron alterations, cortical circuit dysfunction and cognitive deficits in schizophrenia. Neural Plast. (2011) 2011:723184. doi: 10.1155/2011/723184
42. de Jonge JC, Vinkers CH, Hulshoff Pol HE, Marsman A. GABAergic mechanisms in schizophrenia: linking postmortem and in vivo studies. Front Psychiatry. (2017) 8:118. doi: 10.3389/fpsyt.2017.00118
43. Kehrer C, Maziashvili N, Dugladze T, Gloveli T. Altered excitatory-inhibitory balance in the NMDA-hypofunction model of schizophrenia. Front Mol Neurosci. (2008) 1:6. doi: 10.3389/neuro.02.006.2008
44. Foss-Feig JH, Adkinson BD, Ji JL, Yang G, Srihari VH, McPartland JC, et al. Searching for cross-diagnostic convergence: neural mechanisms governing excitation and inhibition balance in schizophrenia and autism spectrum disorders. Biol Psychiatry. (2017) 81:848–61. doi: 10.1016/j.biopsych.2017.03.005
Keywords: visual plasticity, schizophrenia, fMRI, GABA, glutamate, healthy adults, magnetic resonance spectroscopy
Citation: Wijtenburg SA, West J, Korenic SA, Kuhney F, Gaston FE, Chen H and Rowland LM (2021) Multimodal Neuroimaging Study of Visual Plasticity in Schizophrenia. Front. Psychiatry 12:644271. doi: 10.3389/fpsyt.2021.644271
Received: 20 December 2020; Accepted: 08 March 2021;
Published: 01 April 2021.
Edited by:
Maria Concepcion Garcia Otaduy, University of São Paulo, BrazilReviewed by:
Carol A. Tamminga, University of Texas Southwestern Medical Center, United StatesChao Xu, University of Oklahoma Health Sciences Center, United States
Copyright © 2021 Wijtenburg, West, Korenic, Kuhney, Gaston, Chen and Rowland. This is an open-access article distributed under the terms of the Creative Commons Attribution License (CC BY). The use, distribution or reproduction in other forums is permitted, provided the original author(s) and the copyright owner(s) are credited and that the original publication in this journal is cited, in accordance with accepted academic practice. No use, distribution or reproduction is permitted which does not comply with these terms.
*Correspondence: S. Andrea Wijtenburg, YXdpanRlbmJ1cmdAc29tLnVtYXJ5bGFuZC5lZHU=