 Lara Wieland
 Sophie Fromm
 Stefan Hetzer
 Florian Schlagenhauf1
 Jakob Kaminski
- 1Department of Psychiatry and Psychotherapy Charité Campus Mitte, Charité-Universitätsmedizin Berlin, Berlin, Germany
- 2Department of Psychiatry and Psychotherapy Charité Campus Mitte, Charité-Universitätsmedizin Berlin, Einstein Center for Neurosciences Berlin, Berlin, Germany
- 3Berlin Center for Advanced Neuroimaging, Charité-Universitätsmedizin Berlin, Berlin, Germany
Background: Psychiatry is in urgent need of reliable biomarkers. Novel neuromelanin-sensitive magnetic resonance imaging (NM-MRI) sequences provide a time-efficient and non-invasive way to investigate the human brain in-vivo. This gives insight into the metabolites of dopaminergic signaling and may provide further evidence for potential dopaminergic alterations in patients with schizophrenia (SCZ). The present systematic review provides a meta-analysis of case-control studies using neuromelanin-sensitive sequences in SCZ vs. healthy controls (HC).
Methods: According to predefined search terms and inclusion criteria studies were extracted on PubMed. Meta-analyses with a fixed and random-effects model with inverse variance method, DerSimonian-Laird estimator for τ2, and Cohen's d were calculated. Bias was assessed using funnel plots. The primary study outcome was contrast-to-noise ratio (CNR) in the substantia nigra compared between HC and SCZ.
Results: The total sample of k = 6 studies included n = 183 cases and n = 162 controls. Across all studies we found a significant elevation of CNR in the substantia nigra (d = 0.42 [0.187; 0.655], z = 3.521, p < 0.001) in cases compared to controls. We found no significant difference in the control region of locus coeruleus (d = −0.07 [−0.446; 0.302], z = −0.192, p = 0.847), with CNR for the latter only reported in k = 3 studies.
Conclusion: CNR in the substantia nigra were significantly elevated in cases compared to controls. Our results support neuromelanin as a candidate biomarker for dopaminergic dysfunction in schizophrenia. Further studies need to assess this candidate marker in large, longitudinal cohorts and address potential effects of disease state, medication and correlations with symptoms.
Introduction
For decades the search for novel biomarkers has driven neurobiological research on schizophrenia. Although there is no comprehensive mechanistic pathophysiological model to date, excessive dopaminergic signaling in the midbrain has been hypothesized to be central in the etiology of psychotic symptoms (1–3). The primarily used methods in molecular imaging, such as positron emission tomography (PET) or single photon emission computed tomography (SPECT) reliably found dopaminergic aberrations in patients with schizophrenia (4). Similarly, dopaminergic aberrations in patients with a diagnosis of bipolar disorder and psychotic symptoms were found (5). Therefore, dopaminergic signaling might function as a transdiagnostic marker for the symptomatically uniform category of psychosis instead of being limited to the diagnostic group of schizophrenia. However, obtaining these in vivo proxies of dopamine function is challenging in patient populations, since the needed radiopharmaceuticals render these measures highly expensive, invasive and time-consuming. Technological advances, such as improved signal intensity and increased signal-to-noise ratio recently enabled neuromelanin-sensitive magnetic resonance imaging (NM-MRI) as a possible readily available window into molecular alterations in psychiatric disorders in vivo (6, 7).
Neuromelanin (NM) is a byproduct of dopamine and catecholamine synthesis, primarily found in the dopaminergic neurons of the substantia nigra (SN) and the noradrenergic neurons of the locus ceruleus (LC) (8). It appears following several reactions, which begin with the oxidation of cytosolic dopamine, advanced by ferric iron (Fe+3). These oxidized dopamine-quinones react with cytosolic proteins and are polymerized, which results in an undegradable iron-melanin-protein complex. Possibly, because they are too large for proteasome degradation, macroautophagy is initiated and the complex is taken up into an autophagic vacuole. Fusion with lysosomes enables this vacuole to merge with other vacuoles, containing lipids and proteins and eventually result in neuromelanin organelles, that accumulate with increasing age of the organism (9, 10) (see Figure 1).

Figure 1. (A) Hypothesized mechanisms of NM biosynthesis adapted from Sulzer et al. (11): Dopamine (DA) oxidates, advanced by ferric iron (Fe+3). Oxidized DA-quinones react with cytosolic proteins and are polymerized, thereby initiating formation of a melanin-protein component with eumelanin and pheomelanin and resulting in an undegradable iron-melanin-protein complex. Macroautophagy is initiated and the complex is taken up into an autophagic vacuole. Fusion with lysosomes enables this vacuole to merge with other vacuoles, containing lipids and proteins and eventually result in neuromelanin organelles, that accumulate with increasing age of the organism. (B) NM-MRI of an exemplary slice lay-out (yellow) of the substantia nigra (SN) (red arrow) and its position within the brainstem on the left hand side localizer images. (C) Schematic scatter plot depicting contrast-to-noise ratio on the ordinate in controls (blue) and cases (red) with a dimensional biomarker approach (violet).
The specific features from the interaction between neuromelanin and iron in the iron-neuromelanin complexes make them highly paramagnetic and give them their unique signature in magnetic resonance imaging. A combination of reduced magnetization transfer and shortened T1 relaxation times results in high signal intensities for NM-containing brain regions (11). Although too small for conventional MRI techniques, novel NM-MR sequences acquired at a higher field-strength are sensitive enough to detect and quantify tissue containing neuromelanin. Initially, NM-MRI was developed as a candidate biomarker for Parkinson's disease, which is marked by the depletion of dopaminergic neurons in the SN and noradrenergic neurons in the LC (12). Typically, anatomical reference regions, which do not contain neuromelanin (such as crus cerebri) are used to calculate so-called contrast-to-noise ratios (CNR). In order to obtain these CNR, the signal intensity in the SN is set in ratio to the added signal intensities of the SN and a region without neuromelanin [see e.g., (12–15)], as the following exemplary formula shows:
After this initial breakthrough as a biomarker for neurodegenerative illness, a multitude of studies employed NM-MRI in patients with Parkinson's disease. Integrating these results in a recent meta-analysis, NM-MRI shows a pooled sensitivity of 89% and a pooled specificity of 83% in differentiating healthy individuals from those with Parkinson's disease (16). However, its usefulness as a biomarker beyond Parkinson's disease has been unclear thus far. As described above, dopaminergic alterations in the nigrostriatal and mesolimbic pathway have been hypothesized as a potential cause for psychosis (17), making the SN and ventral tegmental area (VTA) ideal candidate targets for NM-MRI. Due to the technical difficulties in detecting VTA with early NM-MRI sequences [e.g., (15)] the focus of the present review will be the SN.
In an extensive validation study, by Cassidy et al. (9), NM-MRI signal intensity was associated with regional NM concentration in post-mortem human brain tissue of the SN. In contrast to previous studies, a semiautomated voxelwise approach to identify SN and reference regions was used to avoid high inter-rater variability, present in manual tracing approaches. When investigating the relation to dopaminergic alterations, NM-MRI CNR were positively related to dopamine release in the dorsal striatum and resting blood flow in the SN in patients with schizophrenia. According to these results, NM-MRI in the SN could serve as a proxy of individual differences in presynaptic dopaminergic function.
Several studies have established excellent test-retest reliability with voxelwise intraclass coefficients (ICC) above 0.9 and test-retest intervals of several weeks in healthy individuals (18–20) and a few hours in a small sample of schizophrenic patients (9). This provides further evidence that NM-MRI might be a suitable marker with clinical value.
In order to elucidate the use of NM-MRI as a biomarker for schizophrenia, a quantitative synthesis of studies investigating NM-MR in case-control design is needed. To this end, all available case-control studies using NM-MRI in schizophrenia spectrum disorders are reviewed. We hypothesize that CNR of the NM-MRI signal in the SN will be significantly elevated in patients compared to controls, whereas CNR in the LC will not be significantly different between patients and controls. Furthermore, a meta-regression with year of publication and age as predictors will be calculated to control for further sources of variance.
Methods
Study Selection
This review was completed according to PRISMA (Preferred Reporting Items for Systematic Reviews and Meta-Analyses) guidelines (21). Inclusion criteria and methods for analyses were pre-specified and documented in a preregistered protocol {r} [https://osf.io/fykum] on January 6, 2021, publicly available on the OSF (Open Science Framework). PubMed was searched from inception to January 6, 2021, according to the following search algorithm: (“neuromelanin” OR “qMRI” OR “hMRI”) AND (MRI) AND (“schizophrenia” OR “schizophrenic” OR “psychosis”). A total of nine entries on PubMed and two additional studies, found via citation search, were screened. Studies were included according to the following predefined criteria: (1) case-control studies including patients with a diagnosis from the schizophrenia spectrum, (2) NM-MRI sequences were used and (3) they contained sufficient information on the outcome CNR. Studies or subsets of studies were excluded in the following case: (1) exclusively investigating other populations than patients with schizophrenia, (2) study designs only including patients without comparison to healthy controls (3) article using different outcome variables than CNR (22). Five studies with one study including two separate samples were found to be eligible (9, 13–15, 23) (see Table 1). Age and sex distribution were extracted for those studies. CNR values were obtained by the study authors in two cases (9, 13).
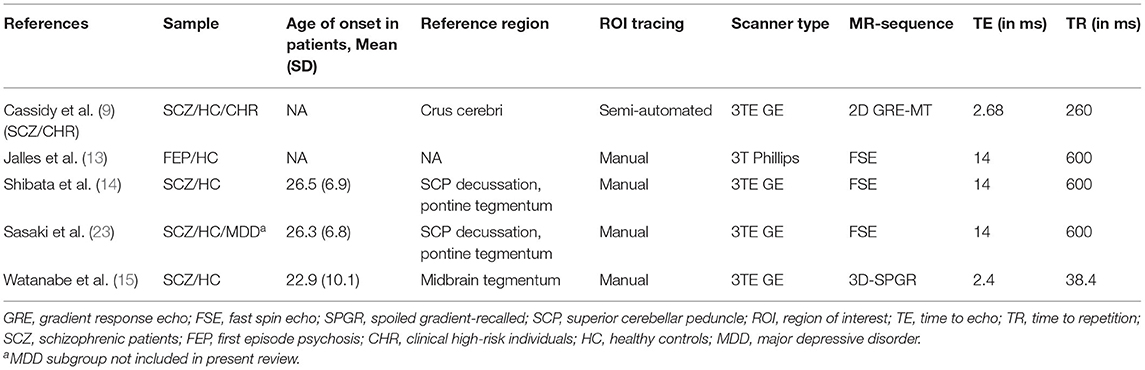
Table 1. Details of MR sequences and patient characteristics.
Quality Assessment
The methodological quality of all eligible studies was evaluated by two authors independently, using the Newcastle– Ottawa Scale (NOS) for assessing the quality of non-randomized studies in meta-analysis (24).
The statistical software R (version 3.6.3; R Foundation for Statistical Computing, Vienna, Austria) with the meta package (25) for meta-analysis of effect size and with the meta for package (26) for meta-analysis of variance was used to analyze all data. The standard p < 0.05 criterion was applied to evaluate statistical significance from meta-analytical results. Outlier detection was applied as described in the supplement.
Meta-Analysis
Novelty of the method and scarcity of eligible studies prevented an a priori estimate of heterogeneity. Therefore, a random-effects, as well as a fixed-effects model were calculated and compared. Hedge's g and DerSimonian-Laird estimator for τ were used for calculating pooled effect sizes while taking variance into account. Since there were only six studies available in total, no subgroup analyses were conducted, according to the standard minimum criterion of k = 10 studies (27). However, to account for potential differences between clinical high-risk (CHR) and SCZ groups we ran the meta-analysis both with and without the CHR sample in one of the studies (see Results section Meta-Analysis and supplement respectively).
Meta-Regression
Meta-regression analyses for publication year and mean age across both groups were calculated to estimate the effect of moderating variables on effect sizes between studies. Hedge's g and DerSimonian-Laird estimator for τ were used for calculating pooled effect sizes while taking between-study variance into account.
Meta-Analysis of Variance
In order to account for possibly increased variability in patient group and discover potential subgroups the variance ratios were calculated. The so-called variability ratio (VR) is the natural logarithm of the ratio of the two standard deviations of both groups. The coefficient of variation ratio (CVR) is the natural logarithm of the ratio between the coefficients of variation from two groups. It takes the interdependence of group mean and standard deviation into account (28). For more details on how to compute VR and CVR refer to the supplement.
Results
Study Selection
Nine studies were initially screened (as in PRISMA flow chart for study selection, see Supplementary Figure 1) by two of the authors independently. Authors of original studies were successfully contacted in two cases and contributed further data. Five studies were included, including 183 patients from the schizophrenia spectrum and 162 controls with patient sample sizes reaching from 20 to 52. Out of the included studies, one study (9) included two patient samples with respective matched control samples. Only the SCZ sample and not the CHR was included in the main text but for supplementary results treated as two separate studies, resulting in a total of six samples. Four studies reported data from medicated patients with schizophrenia (14, 15, 23) or a mix of medicated and unmedicated patients (9). One study reported data from medicated patients with first-episode psychosis (13) with substance abuse. One study reported data from clinical high-risk individuals (9). In all studies patients and controls were matched according to age and in five out of six studies patients and controls were matched according to sex (9, 14, 15, 23).
Meta-Analysis
When excluding the CHR sample (9), the random effects model revealed a significant increase in patients compared to controls in mean estimates for SN (d = 0.42 [0.187; 0.655], z = 3.521, p < 0.001, see Figure 2) and showed no significant difference for neuromelanin in the LC (d = −0.07 [−0.446; 0.302], z = −0.376, p = 0.706, see Figure 3). Including the CHR sample did lead to a slight decrease from d = 0.42 to d = 0.37 but did not change results fundamentally (see Supplementary Figure 9). Fixed effects modeling did also not change the results and are found in the supplement (see Supplementary Figures 7, 8 for forest plots and statistics).
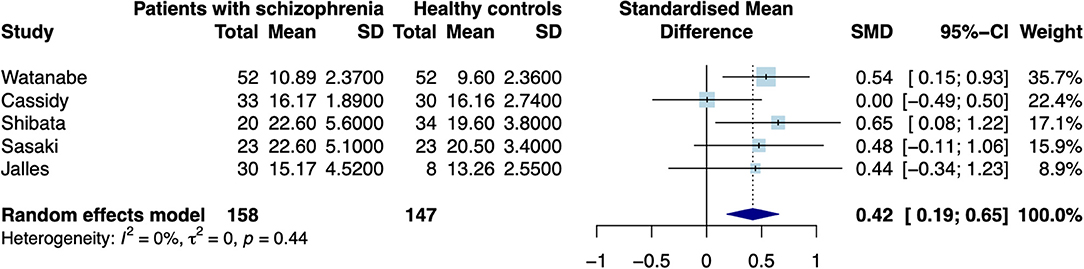
Figure 2. Forest plot of random effects analysis of mean group differences. Filled squares represent estimates per study and whiskers represent confidence intervals. Diamonds represent the point estimates with confidence intervals for an overall estimate in subgroups and the overall pooled effect across all studies.
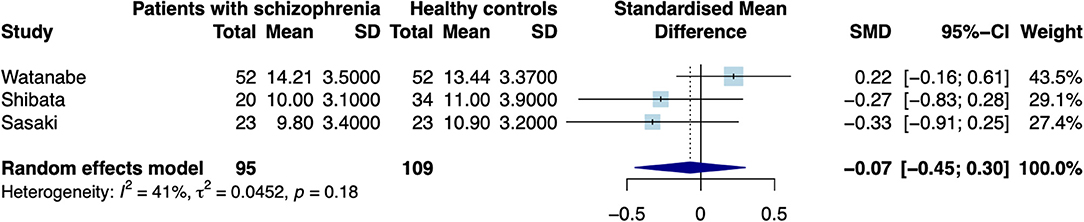
Figure 3. Forest plot of random effects analysis of mean group differences. Filled squares represent estimates per study and whiskers represent confidence intervals. Diamonds represent the point estimates with confidence intervals for an overall estimate in subgroups and the overall pooled effect across all studies.
The test for heterogeneity between studies showed a low amount of heterogeneity for CNR in the SN (τ2 = 0.00, I2= 4.28%), and a medium amount of heterogeneity in the LC (τ2 = 0.04, I2 = 40.78%) according to conventional standards (29). Formal testing for bias using funnel plot asymmetry (30) revealed no significant source of bias [see Supplementary Figure 2, t(4) = −0.40, p = 0.708]. Using trim-and-fill adjustment for bias no missing studies were added. Post-hoc power analyses revealed a power of 74.74%.
Meta-Regression
A random-effects meta-regression was conducted to control for further sources of variance. Publication year showed a trendwise, albeit not significant moderating effect (QM = 3.26, p = 0.071, see Supplementary Figure 3). There was no significant moderating effect for age of the investigated subjects (QM = 1.60, p = 0.205, see Supplementary Figure 4).
Meta-Analysis of Variance Ratio
The calculation of a random-effects model for differences in variability ratio revealed no significant effect in patients as compared to controls (logVR = 0.08 [−0.231; 0.388]; z=0.497; p = 0.619, see Supplementary Figure 5). Taking possible effects of mean differences into account, we calculated coefficient of variation ratio. The adjusted measure also shows no significant difference (logCVR = −0.01 [−0.276; 0.249]; z = −0.103; p = 0.918, see Supplementary Figure 6) across all studies.
Discussion
We could show that neuromelanin-sensitive CNR in the SN were significantly higher in patients from the schizophrenia spectrum disorder, compared to healthy controls. Potential effects of age were not detectable in this meta-analysis. These results contribute to the development of NM-MR imaging of the SN as a promising biomarker for patients with schizophrenia.
However, some open questions remain regarding the relation to transdiagnostic features of the biomarker. The specificity of the signal, and the potential impact of confounds such as medication and age need to be addressed in future studies. To begin with, NM-MRI CNR were only related to positive symptom severity in clinical-high risk individuals as well as clinically manifest patient(s) with schizophrenia in one study (9). The absence of this association in previous studies (22, 23) might be explained by differential effects of antipsychotic medications. As suggested with regard to pharmacological imaging (5), a transdiagnostic perspective on biomarkers of psychosis is more useful than strict adherence to diagnostic categories. This assumption aligns with the positive association between symptom scores and NM-MRI signal intensity, reported in one study on a syndromal and prodromal sample (9). It also demonstrates the importance of assessing subjects, regarding a transdiagnostic psychotic phenotype in future studies.
Results regarding the anatomical specificity of this biomarker must be interpreted with caution, considering that CNR values for the LC were only available in three studies. Due to poor detection of VTA signals, findings are limited to the SN. However, given the more prominent findings concerning hyperdopaminergic alterations in associative regions (i.e., associative and sensorimotor striatum) (17), that mainly receive input from SN (31), this does not limit our findings. In a further study (22), which could not be included in the present meta-analysis due to different reporting of group differences as absolute instead of relative values, VTA values were significantly decreased in patients with schizophrenia. This supports the recently posed hypothesis of mesocortical deficits and nigrostriatal excess in the dopaminergic aberrations observed in schizophrenia (17). With regard to SN, one study used a different approach than the others and used a smaller subset of so-called psychosis overlap voxels instead of the whole SN (9). Furthermore, most studies included employed a manual tracing approach to determine regions of interest (ROI), which is less reliable compared to semiautomated thresholding techniques according to a recent systematic evaluation (19). Manual tracing is not only prone to human bias but also to circularity, when high-signal regions in the SN are determined to be ROI and subsequently used to calculate CNR (20). The voxelwise approach provides another clear advantage, in that it allows to investigate anatomical subregions of the midbrain and striatum, which are hypothesized to correspond to symptom groups of schizophrenia (32). Recently improved 3-D NM-MRI sequences also allow investigation of the VTA but were only investigated in patients with schizophrenia in a single study (22). The use of absolute values instead of CNR to determine signal intensity excluded the study from the present synthesis.
The present meta-analysis is limited by the following factors: The number of studies included is relatively low. However, NM-MR sequences have emerged within the last decades and were only recently suggested as a specific biomarker for schizophrenia (9). This is reflected in the relatively low number of studies in the field. Due to the low number of studies extracted, power was not sufficient for subgroup analyses, for example by clinical status. Another important possible confound is a potential effect of antipsychotic medication. Since there was only data on medication available in three out of six studies, there was too little data to provide a reliable statement. If the moderate effect sizes found in our meta-analysis are confirmed in further studies, usefulness of NM-MR sequences as a biomarker will have to be examined critically. One sample only includes patients with a comorbid substance use disorder (13), which has been shown to impact the dopaminergic system (33, 34) but also reflects clinical reality with a twofold increased use of substances in patients with first-episode psychosis (35) and therefore increases ecological validity of our meta-analysis.
Although test-retest reliability has been shown in 16 participants (9), larger samples investigating test-retest reliability and inter-site reliability of NM-MRI, particularly in psychotic samples, are warranted. Furthermore, as age effects are well-established in NM-MRI (11), potential interaction between diagnosis and age have to be addressed in future studies. Crucially, the translational application requires optimization of neuromelanin-sensitive sequences with short acquisition times (36, 37) and harmonization across sites.
Data Availability Statement
Publicly available datasets were analyzed in this study. This data can be found at: https://github.com/agschlagenhauf/qMRI.
Author Contributions
LW, SF, SH, FS, and JK: conceptualization, writing—review, and editing. LW and SF: data curation. LW, SF, and JK: formal analysis. LW: writing—original draft. All authors contributed to the article and approved the submitted version.
Funding
This work was supported by the Einstein Center for Neurosciences (LW and SF), the German Research Foundation (Grant No. SCHL 1969/1-2/3-1/5-1) (FS) and the BIH-Charité Clinician Scientist Program funded by the Charité–Universitätsmedizin Berlin and the Berlin Institute of Health (JK).
Conflict of Interest
The authors declare that the research was conducted in the absence of any commercial or financial relationships that could be construed as a potential conflict of interest.
Publisher's Note
All claims expressed in this article are solely those of the authors and do not necessarily represent those of their affiliated organizations, or those of the publisher, the editors and the reviewers. Any product that may be evaluated in this article, or claim that may be made by its manufacturer, is not guaranteed or endorsed by the publisher.
Acknowledgments
We thank all the authors contacted who provided additional information. We acknowledge support from the German Research Foundation (DFG) and the Open Access Publication Fund of Charité—Universitätsmedizin Berlin.
Supplementary Material
The Supplementary Material for this article can be found online at: https://www.frontiersin.org/articles/10.3389/fpsyt.2021.770282/full#supplementary-material
References
1. Heinz A, Schlagenhauf F. Dopaminergic dysfunction in schizophrenia : salience attribution revisited. Schizophr Bull. (2010) 36:472–85. doi: 10.1093/schbul/sbq031
2. Howes OD, Kapur S. The dopamine hypothesis of schizophrenia: Version III - The final common pathway. Schizophr Bull. (2009) 35:549–62. doi: 10.1093/schbul/sbp006
3. Maia TV, Frank MJ. An integrative perspective on the role of dopamine in schizophrenia. Biol Psychiatry. (2017) 81:52–66. doi: 10.1016/j.biopsych.2016.05.021
4. Brugger SP, Angelescu I, Abi-Dargham A, Mizrahi R, Shahrezaei V, Howes OD. Heterogeneity of striatal dopamine function in schizophrenia: meta-analysis of variance. Biol Psychiatry. (2020) 87:215–24. doi: 10.1016/j.biopsych.2019.07.008
5. Jauhar S, Nour MM, Veronese M, Rogdaki M, Bonoldi I, Azis M, et al. A test of the transdiagnostic dopamine hypothesis of psychosis using positron emission tomographic imaging in bipolar affective disorder and schizophrenia. JAMA Psychiatry. (2017) 74:1206–13. doi: 10.1001/jamapsychiatry.2017.2943
6. Bradberry CW. Neuromelanin MRI: dark substance shines a light on dopamine dysfunction and cocaine use. Am J Psychiatry. (2020) 77:1019–21. doi: 10.1176/appi.ajp.2020.20091305
7. Cassidy CM, Carpenter KM, Konova AB, Cheung V, Grassetti A, Zecca L, et al. Evidence for dopamine abnormalities in the substantia nigra in cocaine addiction revealed by neuromelanin-sensitive MRI. Am J Psychiatry. (2020) 177:1038–47. doi: 10.1176/appi.ajp.2020.20010090
8. Graham DG. On the origin and significance of neuromelanin. Arch Pathol Lab Med. (1979) 103:359–62.
9. Cassidy CM, Zucca FA, Girgis RR, Baker SC, Weinstein JJ, Sharp ME, et al. Neuromelanin-sensitive MRI as a noninvasive proxy measure of dopamine function in the human brain. Proc Natl Acad Sci USA. (2019) 116:5108–17. doi: 10.1073/pnas.1807983116
10. Zucca FA, Vanna R, Cupaioli FA, Bellei C, De Palma A, Di Silvestre D, et al. Neuromelanin organelles are specialized autolysosomes that accumulate undegraded proteins and lipids in aging human brain and are likely involved in Parkinson's disease. Npj Park Dis. (2018) 4:8. doi: 10.1038/s41531-018-0050-8
11. Sulzer D, Cassidy C, Horga G, Kang UJ, Fahn S, Casella L, et al. Neuromelanin detection by magnetic resonance imaging (MRI) and its promise as a biomarker for Parkinson ' s disease. NPJ Parkinson's Dis. (2018) 4:11. doi: 10.1038/s41531-018-0047-3
12. Sasaki M, Shibata E, Tohyama K, Takahashi J, Otsuka K, Tsuchiya K, et al. Neuromelanin magnetic resonance imaging of locus ceruleus and substantia nigra in Parkinson's disease. Neuroreport. (2006) 17:1215–8. doi: 10.1097/01.wnr.0000227984.84927.a7
13. Jalles C, Chendo I, Levy P, Reimão S. Neuromelanin changes in first episode psychosis with substance abuse. Schizophr Res. (2020) 220:283–4. doi: 10.1016/j.schres.2020.03.034
14. Shibata E, Sasaki M, Tohyama K, Otsuka K, Endoh J, Terayama Y, et al. Use of neuromelanin-sensitive MRI to distinguish schizophrenic and depressive patients and healthy individuals based on signal alterations in the substantia nigra and locus ceruleus. Biol Psychiatry. (2008) 64:401–6. doi: 10.1016/j.biopsych.2008.03.021
15. Watanabe Y, Tanaka H, Tsukabe A, Kunitomi Y, Nishizawa M, Hashimoto R, et al. Neuromelanin magnetic resonance imaging reveals increased dopaminergic neuron activity in the substantia nigra of patients with schizophrenia. PLoS ONE. (2014) 9:e104619. doi: 10.1371/journal.pone.0104619
16. Cho SJ, Bae YJ, Kim J, Kim D, Baik SH, Sunwoo L, et al. Diagnostic performance of neuromelanin-sensitive magnetic resonance imaging for patients with Parkinson ' s disease and factor analysis for its heterogeneity : a systematic review and meta-analysis. Eur Radiol. (2020) 31:1268–80. doi: 10.1007/s00330-020-07240-7
17. McCutcheon RA, Abi-Dargham A, Howes OD. Schizophrenia, dopamine and the striatum: from biology to symptoms. Trends Neurosci. (2019) 42:205–20. doi: 10.1016/j.tins.2018.12.004
18. Langley J, Huddleston DE, Liu CJ, Hu X. Reproducibility of locus coeruleus and substantia nigra imaging with neuromelanin sensitive MRI. Magn Reson Mater Phys Biol Med. (2017) 30:121–5. doi: 10.1007/s10334-016-0590-z
19. Pluijm M, Van Der Cassidy C, Zandstra M. Reliability and reproducibility of neuromelanin-sensitive imaging of the substantia nigra : a comparison of three different sequences. JMRI. (2020) 53:712–21. doi: 10.1002/jmri.27384
20. Wengler K, He X, Abi-Dargham A, Horga G. Reproducibility assessment of neuromelanin-sensitive magnetic resonance imaging protocols for region-of-interest and voxelwise analyses. Neuroimage. (2020) 208:116457. doi: 10.1016/j.neuroimage.2019.116457
21. Moher D, Liberati A, Tetzlaff J, Altman DG, Group TP. Preferred reporting items for systematic reviews and meta-analyses : The PRISMA statement. PLoS Med. (2009) 6:e1000097. doi: 10.1371/journal.pmed.1000097
22. Yamashita F, Sasaki M, Fukumoto K, Otsuka K, Uwano I, Kameda H, et al. Detection of changes in the ventral tegmental area of patients with schizophrenia using neuromelanin-sensitive MRI. Neuroreport. (2016) 27:289–94. doi: 10.1097/WNR.0000000000000530
23. Sasaki M, Shibata E, Ohtsuka K, Endoh J, Kudo K, Narumi S, et al. Visual discrimination among patients with depression and schizophrenia and healthy individuals using semiquantitative color-coded fast spin-echo T1-weighted magnetic resonance imaging. Neuroradiology. (2010) 52:83–9. doi: 10.1007/s00234-009-0595-7
24. Wells GA, Shea B, O'Connel D. The Newcastle-Ottawa Scale (NOS) for Assessing the Quailty of Nonrandomised Studies in Meta-Analyses. (2009). Available online at: http://wwwohrica/programs/clinical_epidemiology/oxfordhtm (accessed February 1, 2009).
25. Balduzzi S, Rücker G, Schwarzer G. How to perform a meta-analysis with {R}: a practical tutorial. Evid Based Ment Health. (2019) 22:153–60. doi: 10.1136/ebmental-2019-300117
26. Viechtbauer W. Conducting meta-analyses in R with the metafor package. JSS J Statist Softw. (2010) 36:3. doi: 10.18637/jss.v036.i03
27. Borenstein M, Higgins JPT. Meta-analysis and subgroups. Prev Sci. (2013) 14:134–43. doi: 10.1007/s11121-013-0377-7
28. Nakagawa S, Poulin R, Mengersen K, Reinhold K, Engqvist L, Lagisz M, et al. Meta-analysis of variation: Ecological and evolutionary applications and beyond. Methods Ecol Evol. (2015) 6:143–52. doi: 10.1111/2041-210X.12309
29. Higgins JPT, Thompson SG. Quantifying heterogeneity in a meta-analysis. Stat Med. (2002) 21:1539–58. doi: 10.1002/sim.1186
30. Egger M, Smith GD, Schneider M, Minder C. Bias in meta-analysis detected by a simple, graphical test. BMJ. (1997) 315:629–34. doi: 10.1136/bmj.315.7109.629
31. Martinez D, Slifstein M, Broft A, Mawlawi O, Hwang DR, et al. Imaging human mesolimbic dopamine transmission with positron emission tomography. Part II: amphetamine-induced dopamine release in the functional subdivisions of the striatum. J Cereb Blood Flow Metab Off J Int Soc Cereb Blood Flow Metab. (2003) 23:285–300. doi: 10.1097/01.WCB.0000048520.34839.1A
32. Mccutcheon RA, Jauhar S, Pepper F, Nour MM, Rogdaki M, Veronese M, et al. Archival report the topography of striatal dopamine and symptoms in psychosis : an integrative positron emission tomography and magnetic resonance imaging study. Biol Psychiatry Cogn Neurosci Neuroimaging. (2020) 5:1040–51. doi: 10.1016/j.bpsc.2020.04.004
33. Katthagen T, Kaminski J, Heinz A, Buchert R, Schlagenhauf F. Striatal dopamine and reward prediction error signaling in unmedicated schizophrenia patients. Schizophr Bull. (2020) 46:1535–46. doi: 10.1093/schbul/sbaa055
34. Thompson JL, Urban N, Slifstein M, Xu X, Kegeles LS, Girgis RR, et al. Striatal dopamine release in schizophrenia comorbid with substance dependence. Mol Psychiatry. (2013) 18:909–15. doi: 10.1038/mp.2012.109
35. Barnett JH, Werners U, Secher SM, Hill KE, Brazil R, Masson K, et al. Substance use in a population-based clinic sample of people with first-episode psychosis. Br J Psychiatry. (2007) 190:515–20. doi: 10.1192/bjp.bp.106.024448
36. Cooper G, Hirsch S, Scheel M, Brandt AU, Paul F, Finke C, et al. Quantitative multi-parameter mapping optimized for the clinical routine. Front Neurosci. (2020) 14:e611194. doi: 10.3389/fnins.2020.611194
37. He N, Ghassaban K, Huang P, Jokar M, Wang Y, Cheng Z, et al. Imaging iron and neuromelanin simultaneously using a single 3D gradient echo magnetization transfer sequence: Combining neuromelanin, iron and the nigrosome-1 sign as complementary imaging biomarkers in early stage Parkinson's disease. Neuroimage. (2021) 230:117810. doi: 10.1016/j.neuroimage.2021.117810
Keywords: neuromelanin, biomarker, schizophrenia, quantitative MRI, psychosis
Citation: Wieland L, Fromm S, Hetzer S, Schlagenhauf F and Kaminski J (2021) Neuromelanin-Sensitive Magnetic Resonance Imaging in Schizophrenia: A Meta-Analysis of Case-Control Studies. Front. Psychiatry 12:770282. doi: 10.3389/fpsyt.2021.770282
Received: 03 September 2021; Accepted: 04 October 2021;
Published: 28 October 2021.
Edited by:
Mihai Avram, University of Lübeck, GermanyReviewed by:
Robert McCutcheon, King's College London, United KingdomKenneth Wengler, Columbia University, United States
Copyright © 2021 Wieland, Fromm, Hetzer, Schlagenhauf and Kaminski. This is an open-access article distributed under the terms of the Creative Commons Attribution License (CC BY). The use, distribution or reproduction in other forums is permitted, provided the original author(s) and the copyright owner(s) are credited and that the original publication in this journal is cited, in accordance with accepted academic practice. No use, distribution or reproduction is permitted which does not comply with these terms.
*Correspondence: Lara Wieland, bGFyYS53aWVsYW5kQGNoYXJpdGUuZGU=