 Ting Zhang1,2
 Xiao-mei Cui2Yu-ying Zhang2Tao Xie2Yuan-jia Deng2Fang-xi Guo2Qi Wang3Qing-feng Wu3Ming-hua Dong3Xiao-ting Luo1,4*
- 1Key Laboratory of Cardiovascular and Cerebrovascular Diseases, Ministry of Education, Gannan Medical University, Ganzhou, China
- 2School of Public Health and Health Management, Gannan Medical University, Ganzhou, China
- 3Department of Epidemiology, Gannan Medical University, Ganzhou, China
- 4Department of General Practice, Gannan Medical University, Ganzhou, China
Background and aims: Previous studies showed that inflammation affects depressive symptoms. Dietary fiber may be associated with inflammation and depressive symptoms. We aimed to investigate the relationship between inflammation and depressive symptoms at different levels of dietary fiber intake and to explore whether dietary fiber affects depression through inflammation.
Methods: A total of 8,430 National Health and Nutrition Examination Survey (NHANES) samples were collected between 2015 and 2018. Factor analysis was used to determine dietary patterns. Linear regression and logistic regression analysis were used to explore the relationship between nutrients, inflammation, and depressive symptoms, and the mediation analysis was conducted using the bootstrap method.
Results: Factor 3 (dietary fiber and vitamins) was inversely associated with depressive symptoms and inflammation. The upper quartile scores of the dietary inflammatory index (DII) and C-reactive protein (CRP) were associated with depressive symptoms compared with controls (DII: OR = 1.851, 95% CI: 1.267–2.705; CRP: OR = 1.737, 95% CI: 1.136–2.656). The DII score and CRP were associated with depressive symptoms in the group with low dietary fiber intake (DII: OR = 2.736, 95% CI: 1.628–4.598; CRP: OR = 2.092, 95% CI: 1.196–3.658) but not in the high dietary fiber intake group. Mediating analysis showed that CRP partially mediated the effect of dietary fiber intake on depressive symptoms (βindirect = −0.0025, 95% CI: −0.0038 to −0.0013), and the mediated proportion was 10.5%.
Conclusion: In this study, we found that DII scores and CRP were not associated with depressive symptoms in participants with high dietary fiber intake, and inflammation partially mediates the effect of dietary fiber on depressive symptoms.
Introduction
Depressive symptoms were one of three major causes of global years lived with disability (YLD) for women in 2017 (1). They are projected to be the leading cause of the global burden of disease by 2030 (2). Major depressive symptoms have a high prevalence in the United States and are a widespread and serious health problem; the lifetime and 12-month prevalence of major depressive symptoms were 20.6 and 10.4%, respectively (3), and the majority of Americans with depressive symptoms do not receive treatment (4). Depressive symptoms, as a psychological disease, bring serious burdens to individuals and society. They frequently reoccur, and the longer they persist, the worse the prognosis. In addition, depressive symptoms can lead to suicidal tendencies (5–7) and are also strongly associated with cardiovascular disease (8, 9). Therefore, identifying the relevant factors of depressive symptoms plays an important role in the prevention and management of depressive symptoms.
Unhealthy diets are a significant contributor to the Global Burden of Disease (GBD), with a 2017 GBD analysis showing that diets contribute to 11 million deaths and 255 million disability-adjusted life years (10). Dietary consumption is continually changing as industrialization and globalization progresses. Some studies showed that nutritionally unbalanced diets, such as those based on ultra-processed foods, are harmful to health (11). In a prospective study of 5.4 years, a 10% increase in the proportion of ultra-processed foods in the diet was associated with a 1.21-fold increased risk of depressive symptoms (12). Numerous studies linked nutrients such as zinc, dietary fiber, folic acid, and vitamins in the serum to depressive symptoms (13–17). Balanced and healthy nutrient intake plays an important role in reducing inflammation and oxidative stress (18). Nutrients are associated with inflammation, and the dietary inflammation index was developed to represent the anti-inflammatory or pro-inflammatory nature of the diet of an individual (19). Studies linked dietary inflammatory index (DII) score to depressive symptoms and inflammation (20, 21).
The pathogenesis of depressive symptoms is closely associated with inflammation (22). In recent years, studies found that dietary fiber is associated with depressive symptoms (23). Dietary fiber may reduce inflammation by altering the intestinal microenvironment (24), and decreased inflammation reduces the effects of neurotransmitters on depressive symptoms (22, 25). We hypothesized that nutritional fiber consumption would possibly have an effect on depressive symptoms via inflammation and that higher nutritional fiber consumption would possibly reduce inflammation, leading to an altered association between inflammation and depressive symptoms. However, few studies examined the association of inflammation with depressive symptoms in participants with different intakes of dietary fiber. Therefore, we used data from the 2015–2018 National Health and Nutrition Examination Survey (NHANES) to explore the associations between inflammation and depressive symptoms within the levels of dietary fiber intake and whether dietary fiber affects depression through inflammation. In future, it is expected to regulate the level of inflammation by changing dietary fiber intake and ultimately prevent depressive symptoms.
The purpose of this study was to investigate the association of nutritional intake with depressive symptoms and inflammation among U.S. residents from 2015 to 2018 and to explore the distribution of DII scores in patients with different degrees of depressive symptoms. Logistic regression was used to analyze the_association of DII and C-reactive protein (CRP) quartile scores with depressive symptoms in total participants and participants with different dietary fiber intakes and to further explore whether dietary fiber influences depression through inflammation.
Methods
Study design of NHANES 2015–2018
The National Health and Nutrition Examination Survey is one of a series of health-related projects conducted by the National Center for Health Statistics (NCHS) to provide information on the health and nutrition status of non-hospital residents in the United States (26). Approximately 5,000 nationally representative participants are sampled annually through multistage, complex, stratified, and cluster sampling methods. The details of NHANES 2015–2018 have been reported in previous studies (27). We used data from NHANES from the 2015–2016 and 2017–2018 survey cycles (28, 29). The NHANES research was approved by the NCHS Research Ethics Review Board. All participants provided written informed consent.
Study participants
We collected 9,972 individual records in the NHANES 2015–2016 survey cycle and 9,255 individual records in the NHANES 2017–2018 survey cycle. We excluded participants under the age of 18 (n = 7,377) and those with an incomplete dietary and depressive record (n = 3,420). Finally, 8,430 samples were included.
Exposures
Nutrient measurements
Dietary intake data were obtained by estimating the type and amount of food and drink consumed in the 24-h dietary recall interviews and by estimating the energy (28, 29), nutrients, and other food components consumed from these foods and drinks. The Food Surveys Research Group (FSRG) of the USDA is responsible for dietary data collection methodology (30). All NHANES participants attended two 24-h dietary recall interviews. The first dietary recall interview was collected in person at the Mobile Examination Center (MEC), and the second interview was collected by telephone 3–10 days later. We extracted the following 30 variables from the nutrient intake information: energy, protein, carbohydrate, dietary fiber, total fat, saturated fatty acid (SFA), monounsaturated fatty acids (MUFA), polyunsaturated fatty acids (PUFA), cholesterol, vitamin E, retinol, vitamin A, vitamin B1, vitamin B2, niacin, vitamin B6, folic acid, total choline, vitamin B12, vitamin C, vitamin D, vitamin K, calcium, iron, zinc, copper, sodium, potassium, alcohol, and caffeine.
DII
The DII score (19), which describes levels of dietary inflammation, was originally developed from 45 dietary variables. We extracted 22 nutrients (alcohol, vitamin B12, vitamin B6, caffeine, carbohydrate, cholesterol, energy, total fat, dietary fiber, folic acid, iron, MUFA, PUFA, SFA, niacin, protein, vitamin A, vitamin C, vitamin D, vitamin E, zinc, and vitamin B2) to calculate DII. DII was calculated by subtracting the global average intake from the extracted nutrient level and dividing it by the standard deviation of the global average intake (19). This value was converted to a centered percentile score to minimize the effect of “right skew.” The centered percentile for each nutrient was multiplied by its respective inflammation score (19), and these new values were finally added to obtain the overall DII index for each participant. Higher DII scores indicate higher levels of dietary inflammation. Lower DII scores indicate lower levels of dietary inflammation.
Outcomes
Depressive symptoms
We administered the Patient Health Questionnaire (PHQ-9) to determine the frequency of depressive symptoms over the past 2 weeks (31). For each question, the scores ranged from 0 to 3 for “none at all”, “several days”, “more than half”, and “almost every day.” Scores can range from 0 to 27. Higher scores were associated with a higher risk of depressive symptoms. A PHQ-9 score range of 5 to 9 indicates mild depressive symptoms, 10 to 14 indicates moderate depressive symptoms, 15 to 19 indicates moderately severe depressive symptoms, and 20 to 27 indicates severe depressive symptoms (31).
Sociodemographic characteristics
Sociodemographic characteristics included age, gender, race, days of vigorous recreational activities, minutes of sedentary activity, systolic blood pressure (SBP), diastolic blood pressure (DBP), body mass index (BMI), CRP, serious difficulty hearing, serious difficulty seeing, serious difficulty concentrating, and taking medication for depressive symptoms.
All SBP and DBP measurements were taken at the MEC. After resting quietly in a seated position for 5 min, three consecutive BP measurements (systolic and diastolic) were taken 60 s apart using a digital upper-arm electronic blood pressure measurement device, the Omron HEM−907XL. In our study, we used the mean of the readings to define the final blood pressure. The data on the body measurement were collected at the Mobile Examination Center (MEC) by trained health technicians: BMI = (weight)/(height)2. “Minutes of sedentary activity” is defined as time spent sitting at a desk, traveling in a car, reading, playing cards, watching TV, using the computer, and so on; however, time spent sleeping is not included. “Vigorous recreational activities” is defined as a large increase in breathing or heart rate that is done for at least 10 min continuously. The participants were also asked the following questions: Do you have severe difficulty hearing? Do you have serious difficulty seeing even when wearing glasses? Do you have serious trouble concentrating, remembering things, or making decisions?
Statistical analysis
We used means, standard deviation (SD), and percentages to describe the basic characteristics of the groups with depressive symptoms and non-depressive symptoms. The T-test was used for numerical variables, and the chi-square test was used for categorical variables. Simple linear regression and multiple linear regression were used to find dietary nutrition variables associated with the PHQ-9. After converting nutrients into Z-scores, radar and heat maps were created to describe the distribution of nutrients among varying levels of depressive symptoms and non-depressive symptoms. We simplified the 28 nutrient variables into 4 factors through factor analysis and performed multiple linear regression with the PHQ-9 and CRP. The Kaiser-Meyer-Olkin (KMO) test is used to verify the applicability of factor analysis, and a KMO value exceeding 0.7 is considered suitable for factor analysis. Correlation between nutrients was tested using Bartlett's test of sphericity. A P-value of <0.05 is acceptable (32). Principal component analysis was used to extract factors and orthogonal rotation (varimax option) to derive uncorrelated factors (33). We obtained a total of four factors and calculated a score for each of the four factors for each participant. Multivariate logistic regression was used to estimate odds ratios (OR) and 95% confidence intervals (CI) between the DII index, CRP, and depressive symptoms (PHQ-9 score >15, moderate-severe, and severe depressive symptoms). We adjusted the models for confounding factors: model 2 adjusted for sex, age, and race; model 3 adjusted for vigorous exercise, minutes of sedentary time, SBP, DBP, and BMI based on model 2; and model 4 continued to adjust for serious difficulty concentrating, serious difficulty hearing, serious difficulty hearing, and depression medication based on model 3.
Mediation analysis
The SPSS PROCESS plug-in was used for mediation analysis, with dietary fiber as the independent variable, the depressive symptoms score (PHQ-9) as the dependent variable, and CRP as the intermediate variable. Pathway (c) represents the total effect of exposure factors (dietary fiber) on outcome variables (PHQ-9), pathway (c') represents the direct effect of exposure variables on outcome variables, pathway (a) represents the impact of exposure variables on mediators, and pathway (b) represents the impact of mediators on outcome variables. The proportion of the mediated effect was calculated using the following formula: (indirect effect/total effect) × 100%. Statistical analysis was performed using SPSS 23.0 (IBM SPSS, Inc., Chicago, IL, USA). A P-value of <0.05 was considered statistically significant.
Sensitivity analysis
We hypothesize that dietary patterns affect depressive symptoms, but it is reasonable that depressive symptoms also have an effect on dietary patterns. Therefore, we conducted sensitivity analyses using linear regression to investigate the association of depressive symptoms with dietary patterns and adjusted for the abovementioned confounding factors. In addition, acute inflammation may affect the association between dietary fiber intake and CRP with depressive symptoms. We did a sensitivity analysis by excluding participants with acute inflammation.
Results
The basic sociodemographic characteristics of this study are shown in Table 1. Among the participants with non-depressive symptoms and depressive symptoms, those aged over 50 years (51.8, 54.3%), non-Hispanic whites (34.9, 39.0%), those with serious difficulty hearing (7.4, 14.6%), those with serious difficulty seeing (4.2, 11,9%), and those with serious difficulty concentrating (4.1, 29.0%) accounted for a large proportion in participants with depressive symptoms. The majority of patients who are depressed are women, while the majority of patients who are not depressed are men; the difference was statistically significant (P < 0.05). BMI, CRP, and minutes of sedentary time were higher in participants with depressive symptoms than in participants with non-depressive symptoms (P < 0.05).
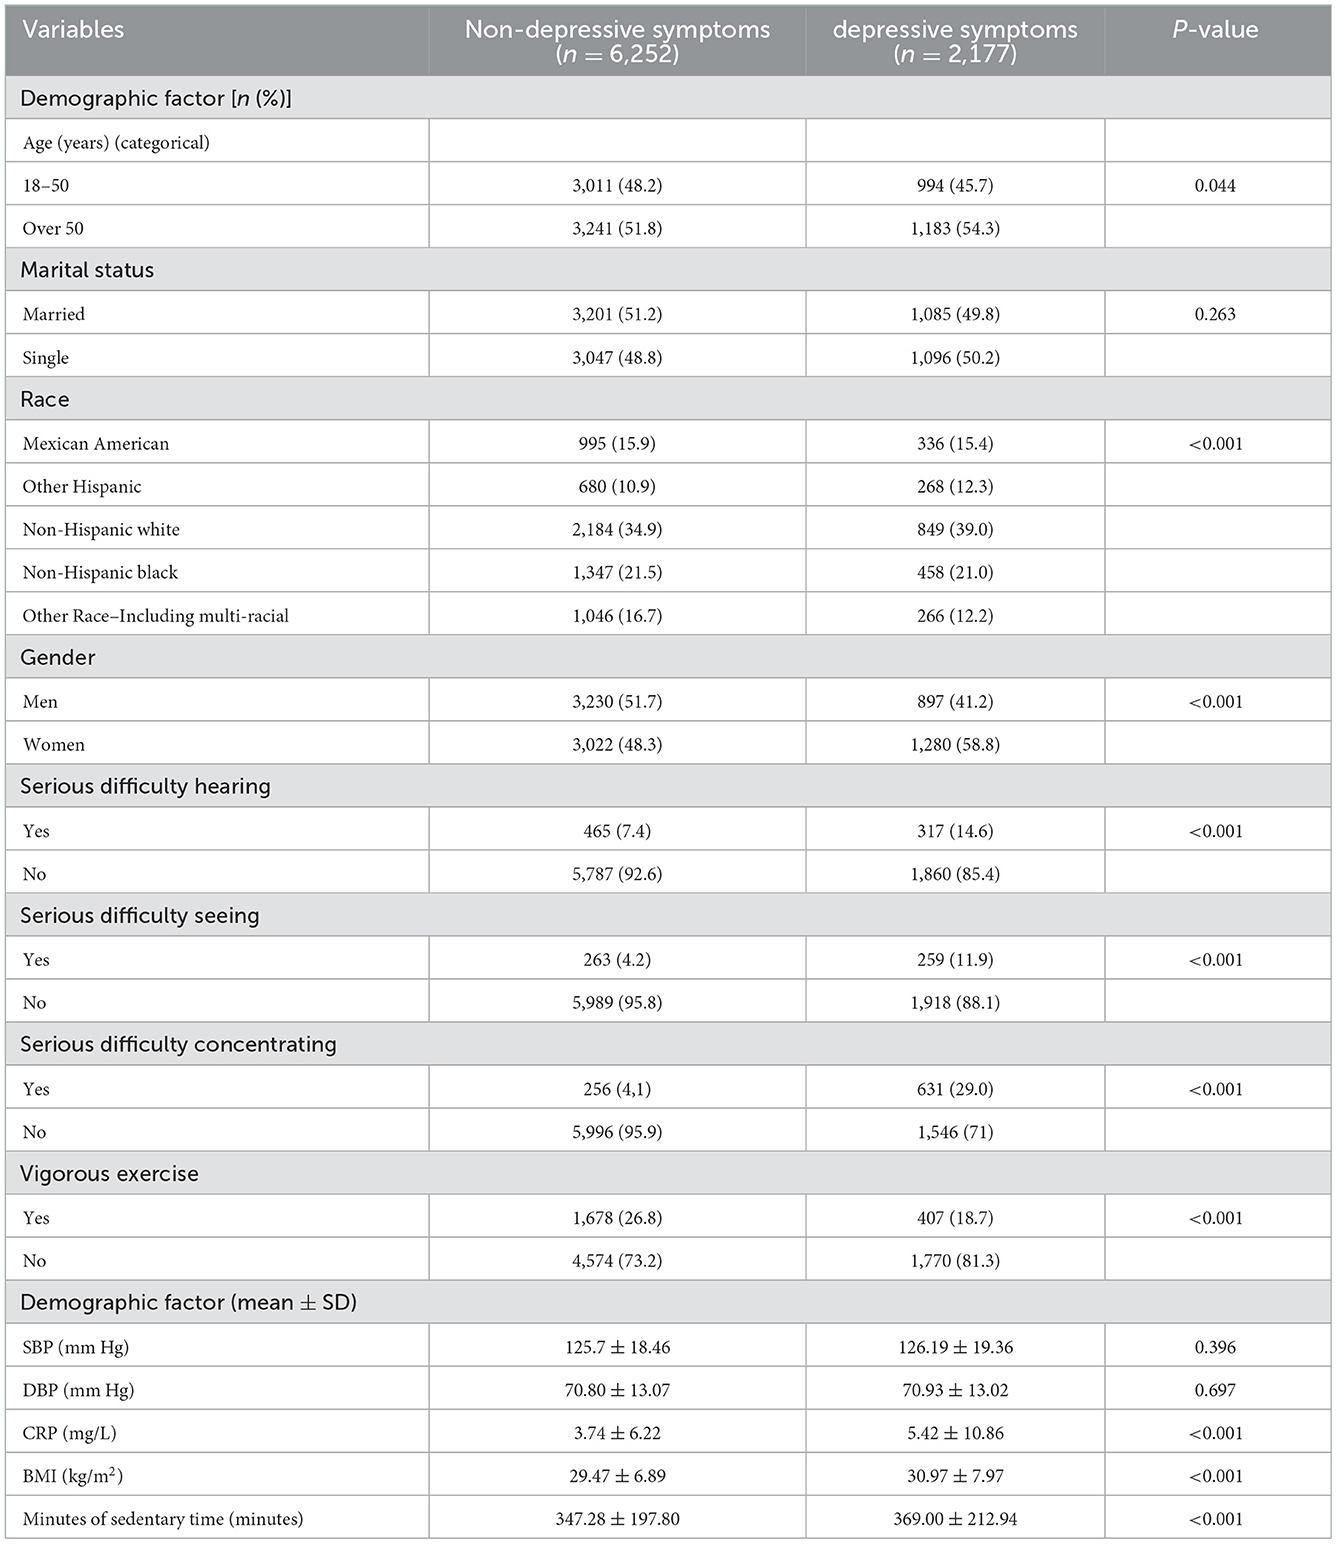
Table 1. Basic characteristics of the participants.
Patients who are depressed had higher intakes of vitamin B6 and saturated fatty acids than participants who are not depressed, and lower intakes of dietary fiber, folic acid, vitamin C, vitamin K, and zinc than participants who are not depressed. Among patients who are depressed, the intake of vitamin B6 was higher in patients with major depressive symptoms than in those with other depressive symptoms, but the intake of protein, dietary fiber, MUFA, PUFA, cholesterol, vitamin E, folic acid, choline, and iron was lower in patients with the major depressive disorder than in those with other depressive symptoms (Supplementary Figures 1, 2).
Association of nutritional composition with depressive symptoms
The results of the simple linear regression between nutrient intake and the PHQ-9 score of participants are shown in Table 2. Protein, dietary fiber, PUFA, vitamin E, vitamin B1, folate, choline, vitamin C, vitamin K, iron, zinc, copper, sodium, potassium, and caffeine intake were associated with the PHQ-9 scores (P < 0.05). Multiple linear regression results showed that vitamin E and caffeine were positively correlated with the PHQ-9 scores (P < 0.05), and protein, dietary fiber, total folate, and copper were negatively correlated with the PHQ-9 scores (P < 0.05) (Supplementary Table 1).
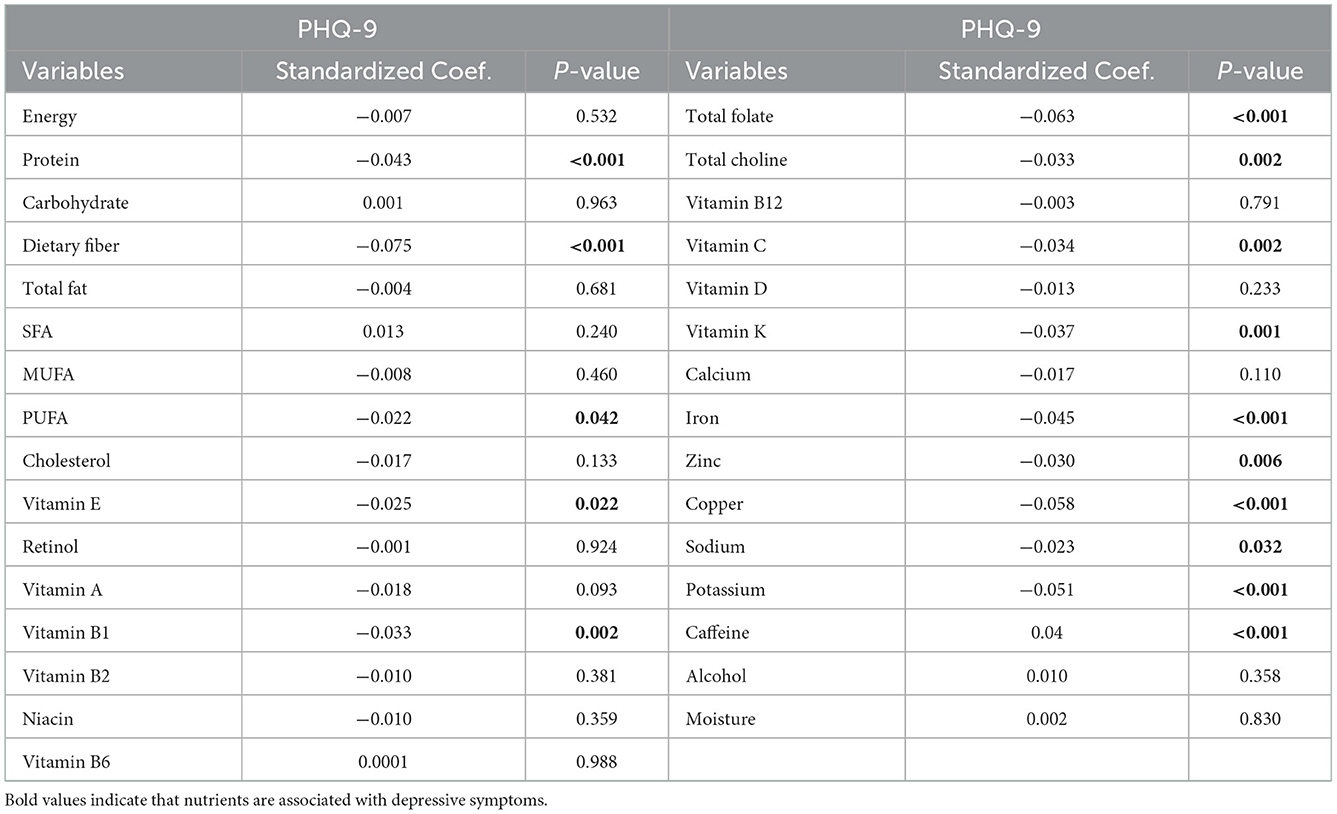
Table 2. Simple linear regression between nutrient intake and PHQ-9 score in the participants.
Factor rotation of nutrient intake variables and multiple linear regression with the PHQ-9 scores and CRP
The score of 28 nutrients through factor rotation is shown in Table 3. Total fat, MUFA, SFA, energy, PUFA, sodium, cholesterol, protein, choline, and carbohydrates had the highest scores in factor 1. Vitamin B1, niacin, vitamin B2, zinc, iron, vitamin B6, and vitamin B12 had the highest scores in factor 2. Potassium, vitamin E, copper, dietary fiber, folic acid, vitamin K, and vitamin C scored highest in factor 3, and calcium, vitamin D, vitamin A, and retinol scored highest in factor 4.
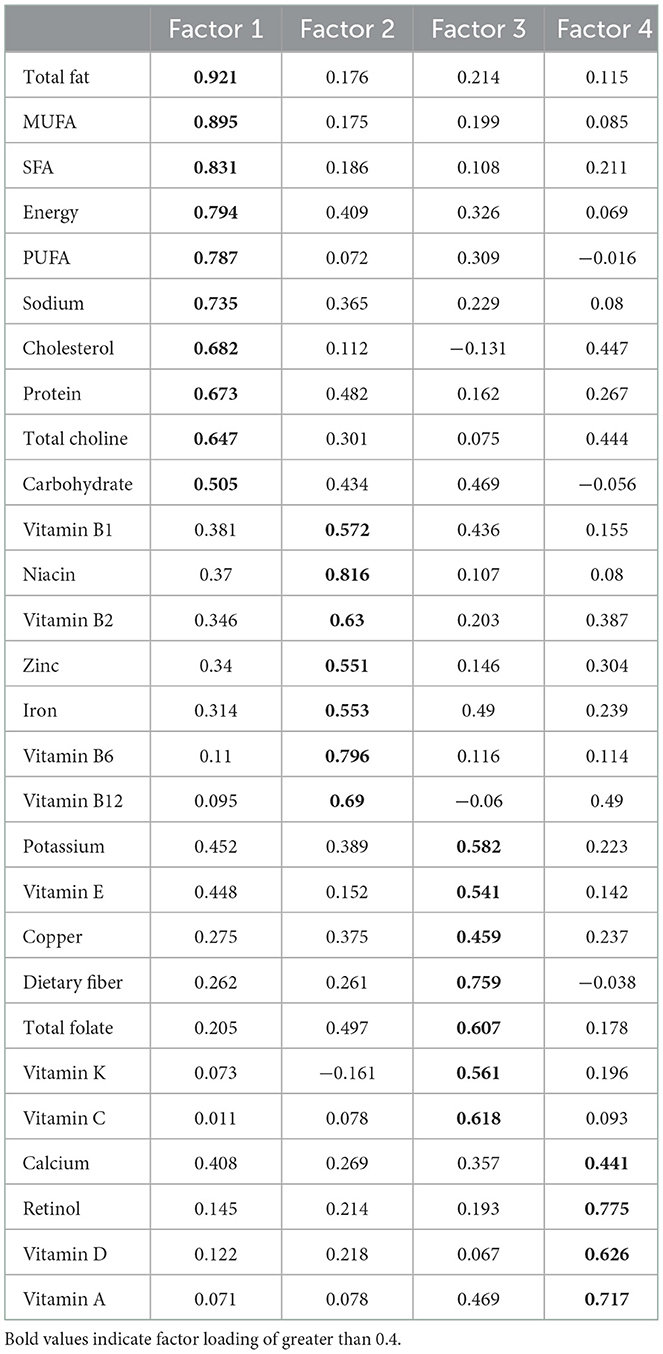
Table 3. The result of factor rotation.
After multivariate adjustment, factor 3 was negatively associated with depressive symptoms and CRP (Table 4). In addition, sensitivity analysis showed that depressive symptoms were negatively correlated with factor 3 (Supplementary Table 2).
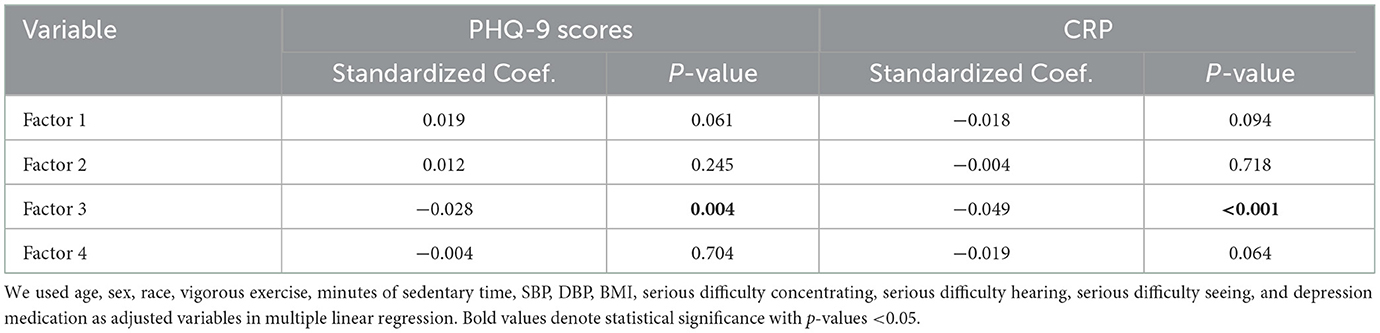
Table 4. Multiple linear regression of 4 factors with PHQ-9 scores and CRP.
Effects of DII scores and CRP on depressive symptoms in the total participants and different dietary fiber subgroups
We used the T-test to analyze differences in DII scores between patients who are depressed and those who are not depressed in the total participants. There were differences in DII scores between non-depressive symptoms and depressive symptoms of different degrees among all participants (P < 0.05) (Supplementary Figure 3).
Table 5 shows the correlation between DII scores and CRP on depressive symptoms (moderate and severe depressive symptoms) in total participants and different dietary fiber intake groups. The median dietary fiber intake was calculated. Those below the median were defined as a low dietary fiber intake group, while those above the median were defined as a high dietary fiber intake group. With Q1 as the reference group, the Q4 group of DII scores was significantly associated with depressive symptoms, and the degree of association was constant after the addition of adjusted variables (OR = 1.851, 95% CI: 1.267–2.705). In the subgroup with low dietary fiber intake, the upper quartile of DII scores was significantly associated with depressive symptoms compared with the control group (OR = 2.736, 95% CI: 1.628–4.598) and the degree of association increased. DII scores were not significantly associated with depressive symptoms in the subgroup with high dietary fiber intake. The CRP of the Q4 group was significantly associated with depressive symptoms, and the degree of association was constant after adjusting for variables (OR = 1.737, 95% CI: 1.136–2.656). In the subgroup with low dietary fiber intake, the upper quartile of CRP was significantly associated with depressive symptoms compared with the control group (OR = 2.092, 95% CI: 1.196–3.658), and there was no correlation in the high dietary fiber intake group. Sensitivity analyses showed that, when participants with acute inflammation (CRP ≥ 10) were excluded, the association between CRP and depressive symptoms was consistent with previous results, indicating that our results were robust (Supplementary Table 3).
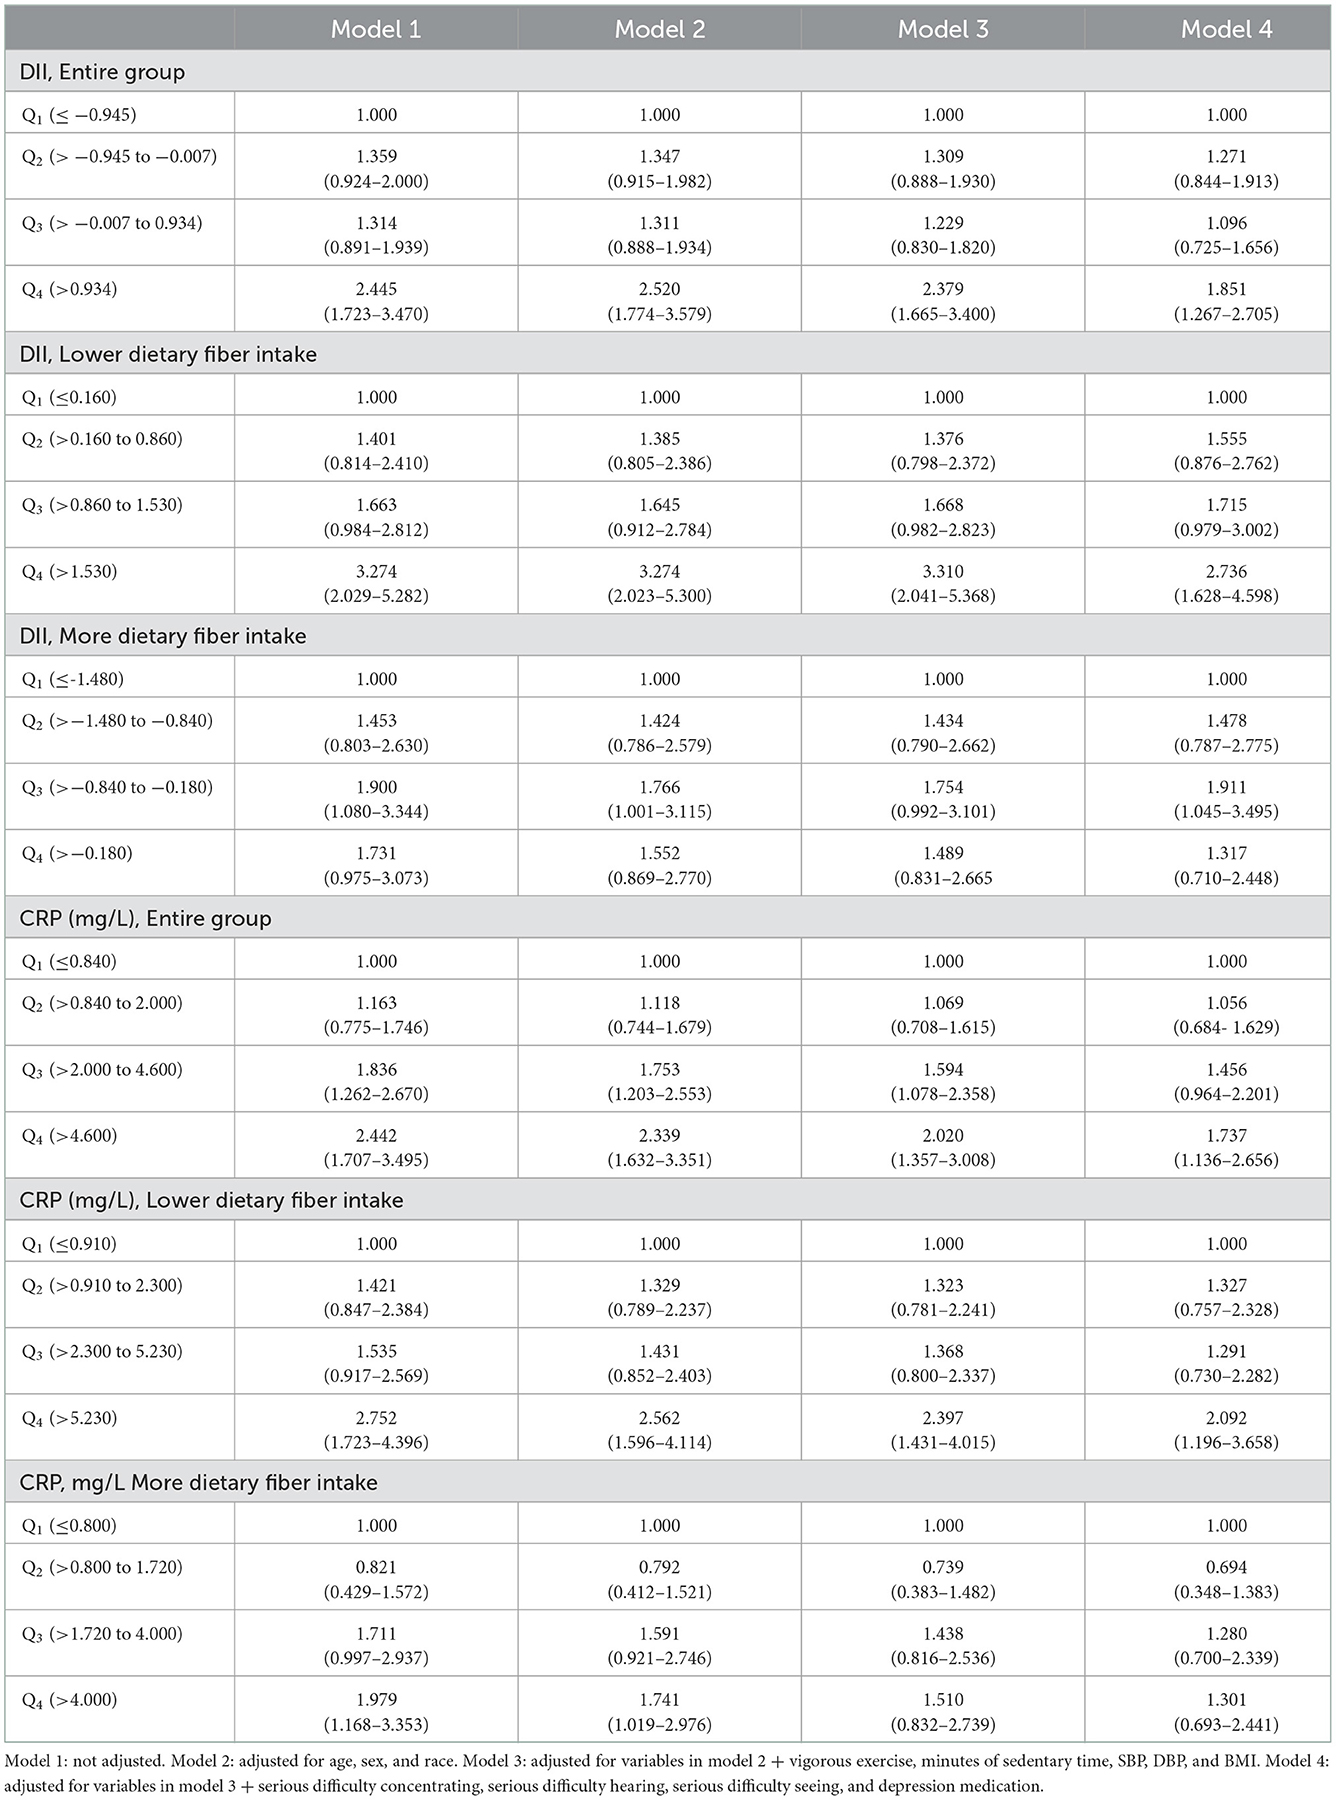
Table 5. OR and 95% CI for depressive symptoms (moderately severe and severe depressive symptoms) according to DII scores and CRP in the entire group and different dietary fiber intake groups.
Mediating analysis of dietary fiber, CRP, and depressive symptoms
The correlation between inflammation and depressive symptoms varied across stratified analyses of dietary fiber intake, so we further explored whether CRP for the intermediary role in the process of dietary fiber intake influences depressive symptoms. The results showed that CRP partially mediates the effect of dietary fiber on depressive symptoms (βindirect = −0.0025, 95% CI: −0.0038 to −0.0013), and the mediated proportion was 10.5% (Table 6, Figure 1).
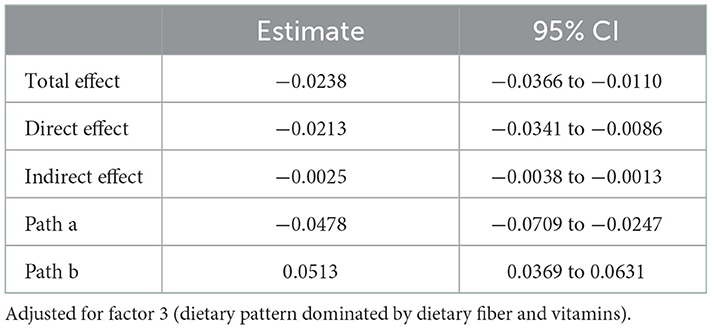
Table 6. Mediating analysis of dietary fiber, CRP, and depressive symptoms.
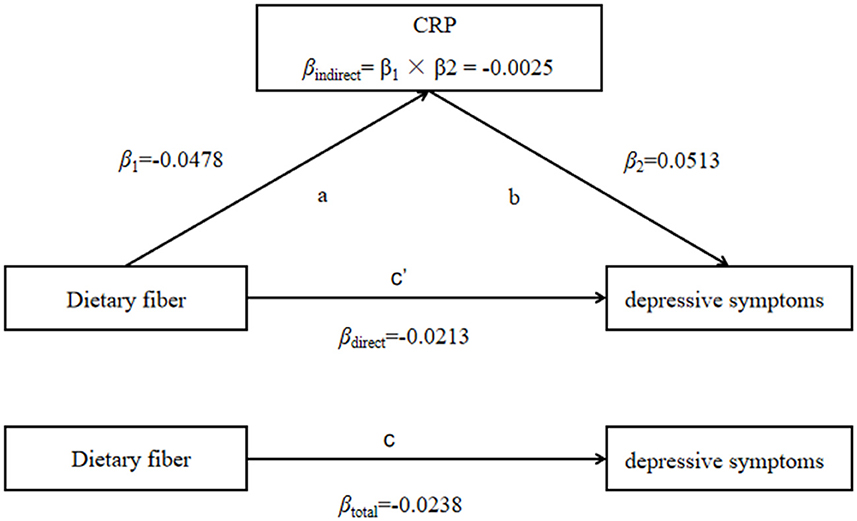
Figure 1. CRP mediated the association between dietary fiber intake and depressive symptoms (PHQ-9 score as continuity variable), path ab represents the indirect effect, path c represents the direct effect, and path c represents the total effect.
Discussion
This study provides evidence that dietary fiber, CRP, and DII scores are associated with depressive symptoms. Protein, dietary fiber, folic acid, and copper intake were negatively correlated to PHQ-9 scores, while vitamin E and caffeine intake were positively correlated with PHQ-9 scores. Dietary patterns dominated by dietary fiber and vitamins were negatively correlated with depression and CRP. We showed that dietary fiber is associated with depression and inflammation. DII scores as an indicator of dietary inflammation were significantly associated with depressive symptoms, with an increased association among participants with low dietary fiber intake but no significant association among participants with high dietary fiber intake. As with DII results, the CRP levels were significantly associated with depressive symptoms, but there was no significant association among participants with high dietary fiber intake. Finally, we further demonstrated that CRP plays a partial mediating role in the effect of dietary fiber on depressive symptoms.
Previous studies explained a significant association between folic acid levels and depressive symptoms (34, 35). Protein consumption was associated with a lower risk of depressive symptoms (36), and higher dietary fiber intake was inversely associated with depressive symptoms (37, 38). Li et al. used NHANES data from 2009 to 2014 to show that copper is inversely related to depressive symptoms, which is consistent with the results of our study (39). In contrast to our study, a meta-analysis of 25 observational studies showed an inverse association between vitamin E and depressive symptoms (40). Second, our study showed that, after adjusting for a variety of nutrients, caffeine consumption is positively associated with depressive symptoms. However, caffeine consumption was inversely associated with the prevalence of self-reported lifetime depression among Koreans (41), and future research needs to be designed to observe the potential benefits of caffeine.
Factor 3, mainly vitamins and dietary fiber, was negatively correlated with depressive symptoms and CRP, with the same results in the entire group, the >50-year-old subgroup, and the male subgroup. A meta-analysis showed that vitamin C intake was inversely associated with depressive symptoms (40), and that tocopherol treatment prevented TNF-α-induced depressive symptoms in mice (42). In addition, studies showed that oxidative stress in patients with depressive symptoms increases (43, 44), and the intake of vitamin C, vitamin E, and folic acid is related to a reduction in oxidative stress (45–47). Vitamin C has the potential to prevent and treat depressive symptoms because it protects neurons from oxidative stress and reduces inflammation (48). Folic acid treatment in mice restored the activity of antioxidant enzymes and reduced lipid peroxidation in the hippocampus (49). Vitamins may play a potential role in the treatment of depressive symptoms in the future, but the pathophysiological mechanism still needs to be further explored.
A review by Olivia et al. elucidated the underlying mechanism of the association between dietary fiber and depressive symptoms (25). Dietary fiber intake can alter the composition of intestinal flora and the amount of short-chain fatty acids (SCFAs) (50, 51). SCFAs inhibit histone deacetylases, which play an important role in epigenetic gene regulation (52), and high expression of histone deacetylases has been associated with depressive symptoms (53). In addition, dietary fiber may affect depressive symptoms through the activation of GPCR by SCFAs and affect depressive symptoms through intestinal flora production of tryptophan (25, 54). We also found a bidirectional association between depression and dietary patterns dominated by dietary fiber and vitamins, which may partly explain the effect of dietary fiber on depression.
There is a two-way communication between the central nervous system and the gut. Gut microbes play a key role in regulating the normal function of the gut-brain axis as well as having important effects on tryptophan metabolism and the serotonergic system (54). The intervention of some gut microbiota has the effect of serotonin synthesis and alleviates depressive symptoms (55). Second, dietary fiber may affect the level of inflammation by reducing membrane permeability through the production of short-chain fatty acids. Low dietary fiber consumption leads to increased intestinal permeability, which leads to increased endotoxin activity and induces inflammation (56).
There may be a potential association between diet and inflammation levels (57). Dietary fiber is closely associated with inflammation, and it may reduce inflammation levels by protecting the intestinal barrier and activating GPCRs (58, 59). Intestinal microbiota play an important role in the intestinal immune response. Intestinal microbial metabolite SCFAs promote innate lymphocytes and T cells to produce IL-22 through G protein receptor 41 and protect intestinal immunity (60). GPR43 and GPR41 knockout mice have defects in regulating inflammatory mediators and establishing inflammatory responses after intestinal barrier disruption. SCFAs play a role in the immune response by inducing endothelial cells to produce cytokines and chemokines, and this effect is dependent on GPR43 and GPR41 (61). Immunity has a potential regulatory effect on depressive symptoms (22). The elevated levels of inflammation have been associated with increased susceptibility to depressive symptoms (62). These results were further supported by the negative correlation between factor 3 and CRP levels. The results of our mediation analysis support that inflammation partially mediates the relationship between dietary fiber intake and depressive symptoms.
The results of previous studies are consistent with our findings that DII scores are negatively associated with depressive symptoms (63). The DII score was an indicator of overall dietary inflammation based on multiple nutrient assessments, so we used the DII score as an inflammation index. Our results also showed that the DII score was positively correlated with CRP. To ensure the independence of the DII score and individual nutrients, we made a collinearity diagnosis. The results showed that there was no collinearity between DII scores and each nutrient, which was independent. In addition, we found differences in the extent to which the DII scores and CRP levels were associated with depressive symptoms in different dietary fiber intake groups. It may be that higher dietary fiber intake can mitigate the effects of inflammation on depressive symptoms. It is necessary to further study the effects of dietary fiber intake on inflammation and depressive symptoms in future, which is of great significance to the pathogenesis and prevention of depressive symptoms.
Our study had the following limitations: (1) The cross-sectional study could not determine the causal relationship, and the dietary data were 24-h recall data, which was not representative enough. In the follow-up study, we will use image collection and a written diary to investigate dietary intake and encourage participants to record their dietary intake for a week by using mobile phone photos and written records. Considering that a very long recording time may reduce the compliance of the participants, we chose a period of 1 week as the recording time. Second, further animal experiments were conducted to explore the causal relationship between dietary fiber, inflammation, and depression. (2) In the mediation analysis model, we could not adjust for some potential confounders of the mediation results, such as sleep disorders and disease status, so the mediation model had some bias. However, we will use animal experiments in subsequent studies to prove that dietary fiber affects depression through inflammation.
Conclusion
Our results suggest that dietary fiber intake was associated with depressive symptoms and CRP levels. The DII scores and CRP levels were not associated with depressive symptoms in people with higher dietary fiber intake. In addition, inflammation partially mediated the relationship between dietary fiber and depressive symptoms. Further prospective studies are needed to investigate the effects of dietary fiber and other nutrients on inflammation and depressive symptoms, and it is important to clarify the pathophysiological mechanisms for the prevention of depressive symptoms.
Data availability statement
The original contributions presented in the study are included in the article/Supplementary material, further inquiries can be directed to the corresponding author.
Ethics statement
The studies involving human participants were reviewed and approved by NCHS Ethics Review Board (ERB). The patients/participants provided their written informed consent to participate in this study.
Author contributions
TZ was responsible for data analysis and assisting in paper writing. X-mC, Y-yZ, TX, Y-jD, and F-xG were responsible for collecting, sorting out, and analyzing data. QW, Q-fW, and M-hD were responsible for assisting in paper writing. X-tL was responsible for research design and paper writing. All authors contributed to the article and approved the submitted version.
Funding
Thanks for the support and help from the teachers and students in the research group and the Open Project Fund of the Key Laboratory of Cardiovascular and Cerebrovascular Diseases of the Ministry of Education (XN201907).
Conflict of interest
The authors declare that the research was conducted in the absence of any commercial or financial relationships that could be construed as a potential conflict of interest.
Publisher's note
All claims expressed in this article are solely those of the authors and do not necessarily represent those of their affiliated organizations, or those of the publisher, the editors and the reviewers. Any product that may be evaluated in this article, or claim that may be made by its manufacturer, is not guaranteed or endorsed by the publisher.
Supplementary material
The Supplementary Material for this article can be found online at: https://www.frontiersin.org/articles/10.3389/fpsyt.2022.989492/full#supplementary-material
References
1. Collaborators GDAI. Global, regional, and national incidence, prevalence, and years lived with disability for 354 diseases and injuries for 195 countries and territories, 1990–2017: a systematic analysis for the global burden of disease study 2017. Lancet. (2018) 392:1789–858. doi: 10.1016/S0140-6736(18)32279-7
2. Mathers CD, Loncar D. Projections of global mortality and burden of disease from 2002 to 2030. PLoS Med. (2006) 3:e442. doi: 10.1371/journal.pmed.0030442
3. Hasin DS, Sarvet AL, Meyers JL, Saha TD, Ruan WJ, Stohl M, et al. Epidemiology of adult dsm-5 major depressive disorder and its specifiers in the united states. JAMA Psychiatry. (2018) 75:336–46. doi: 10.1001/jamapsychiatry.2017.4602
4. Olfson M, Blanco C, Marcus SC. Treatment of adult depression in the United States. JAMA Intern Med. (2016) 176:1482–91. doi: 10.1001/jamainternmed.2016.5057
5. Johnson D, Dupuis G, Piche J, Clayborne Z, Colman I. Adult mental health outcomes of adolescent depression: a systematic review. Depress Anxiety. (2018) 35:700–16. doi: 10.1002/da.22777
6. Jonsson U, Bohman H, von Knorring L, Olsson G, Paaren A, von Knorring AL. Mental health outcome of long-term and episodic adolescent depression: 15-year follow-up of a community sample. J Affect Disord. (2011) 130:395–404. doi: 10.1016/j.jad.2010.10.046
7. Patel RS, Onyeaka H, Youssef NA. Suicidal ideation and attempts in unipolar vs. bipolar depression: analysis of 131,740 adolescent inpatients nationwide. Psychiatry Res. (2020) 291:113231. doi: 10.1016/j.psychres.2020.113231
8. Hare DL, Toukhsati SR, Johansson P, Jaarsma T. Depression and cardiovascular disease: a clinical review. Eur Heart J. (2014) 35:1365–72. doi: 10.1093/eurheartj/eht462
9. Carney RM, Freedland KE. Depression and coronary heart disease. Nat Rev Cardiol. (2017) 14:145–55. doi: 10.1038/nrcardio.2016.181
10. Collaborators GD. Health effects of dietary risks in 195 countries, 1990–2017: a systematic analysis for the global burden of disease study 2017. Lancet. (2019) 393:1958–72. doi: 10.1016/S0140-6736(19)30041-8
11. Elizabeth L, Machado P, Zinocker M, Baker P, Lawrence M. Ultra-processed foods and health outcomes: a narrative review. Nutrients. (2020) 12:1955. doi: 10.3390/nu12071955
12. Adjibade M, Julia C, Alles B, Touvier M, Lemogne C, Srour B, et al. Prospective association between ultra-processed food consumption and incident depressive symptoms in the french nutrinet-sante cohort. BMC Med. (2019) 17:78. doi: 10.1186/s12916-019-1312-y
13. Swardfager W, Herrmann N, Mazereeuw G, Goldberger K, Harimoto T, Lanctot KL. Zinc in depression: a meta-analysis. Biol Psychiatry. (2013) 74:872–8. doi: 10.1016/j.biopsych.2013.05.008
14. Anglin RE, Samaan Z, Walter SD, McDonald SD. Vitamin d deficiency and depression in adults: systematic review and meta-analysis. Br J Psychiatry. (2013) 202:100–7. doi: 10.1192/bjp.bp.111.106666
15. Gilbody S, Lightfoot T, Sheldon T. Is low folate a risk factor for depression? A meta-analysis and exploration of heterogeneity. J Epidemiol Community Health. (2007) 61:631–7. doi: 10.1136/jech.2006.050385
16. Xu H, Li S, Song X, Li Z, Zhang D. Exploration of the association between dietary fiber intake and depressive symptoms in adults. Nutrition. (2018) 54:48–53. doi: 10.1016/j.nut.2018.03.009
17. Firth J, Teasdale SB, Allott K, Siskind D, Marx W, Cotter J, et al. The efficacy and safety of nutrient supplements in the treatment of mental disorders: a meta-review of meta-analyses of randomized controlled trials. World Psychiatry. (2019) 18:308–24. doi: 10.1002/wps.20672
18. Iddir M, Brito A, Dingeo G, Fernandez DCS, Samouda H, La Frano MR, et al. Strengthening the immune system and reducing inflammation and oxidative stress through diet and nutrition: considerations during the covid-19 crisis. Nutrients. (2020) 12:1562. doi: 10.3390/nu12061562
19. Shivappa N, Steck SE, Hurley TG, Hussey JR, Hebert JR. Designing and developing a literature-derived, population-based dietary inflammatory index. Public Health Nutr. (2014) 17:1689–96. doi: 10.1017/S1368980013002115
20. Shakya PR, Melaku YA, Shivappa N, Hebert JR, Adams RJ, Page AJ, et al. Dietary inflammatory index (dii(r)) and the risk of depression symptoms in adults. Clin Nutr. (2021) 40:3631–42. doi: 10.1016/j.clnu.2020.12.031
21. Shivappa N, Steck SE, Hurley TG, Hussey JR, Ma Y, Ockene IS, et al. A population-based dietary inflammatory index predicts levels of c-reactive protein in the seasonal variation of blood cholesterol study (seasons). Public Health Nutr. (2014) 17:1825–33. doi: 10.1017/S1368980013002565
22. Beurel E, Toups M, Nemeroff CB. The bidirectional relationship of depression and inflammation: double trouble. Neuron. (2020) 107:234–56. doi: 10.1016/j.neuron.2020.06.002
23. Saghafian F, Sharif N, Saneei P, Keshteli AH, Hosseinzadeh-Attar MJ, Afshar H, et al. Consumption of dietary fiber in relation to psychological disorders in adults. Front Psychiatry. (2021) 12:587468. doi: 10.3389/fpsyt.2021.587468
24. Ma W, Nguyen LH, Song M, Wang DD, Franzosa EA, Cao Y, et al. Dietary fiber intake, the gut microbiome, and chronic systemic inflammation in a cohort of adult men. Genome Med. (2021) 13:102. doi: 10.1186/s13073-021-00921-y
25. Swann OG, Kilpatrick M, Breslin M, Oddy WH. Dietary fiber and its associations with depression and inflammation. Nutr Rev. (2020) 78:394–411. doi: 10.1093/nutrit/nuz072
26. Centers for Disease Control Prevention. National Health and Nutrition Examination Survey (nhanes). (2022). Available online at: https://wwwn.cdc.gov/nchs/nhanes/search/datapage.aspx?Component=Dietary&CycleBeginYear=2017 (accessed May 19, 2022).
27. Chen TC, Clark J, Riddles MK, Mohadjer LK, Fakhouri T. National health and nutrition examination survey, 2015–2018: sample design and estimation procedures. Vital Health Stat. (2020) 2:1–35.
28. Centers for Disease Control Prevention. National Health and Nutrition Examination Survey 2017–2018 (nhanes). (2022). Available online at: https://wwwn.cdc.gov/Nchs/Nhanes/2017-2018/DR1TOT_J.htm (accessed May 19, 2022).
29. Centers for Disease Control Prevention. National Health and Nutrition Examination Survey 2015–2016 (nhanes). (2022). Available online at: https://wwwn.cdc.gov/nchs/nhanes/search/datapage.aspx?Component=Dietary&Cycle=2015-2016 (accessed May 19, 2022).
30. Agricultural Research Service. (2022). Available online at: https://www.ars.usda.gov/northeast-area/beltsville-md-bhnrc/beltsville-human-nutrition-research-center/food-surveys-research-group/docs/dmr-food-categories/ (accessed May 19, 2022).
31. Kroenke K, Spitzer RL, Williams JB. The phq-9: validity of a brief depression severity measure. J Gen Intern Med. (2001) 16:606–13. doi: 10.1046/j.1525-1497.2001.016009606.x
32. Venkaiah K, Brahmam GN, Vijayaraghavan K. Application of factor analysis to identify dietary patterns and use of factor scores to study their relationship with nutritional status of adult rural populations. J Health Popul Nutr. (2011) 29:327–38. doi: 10.3329/jhpn.v29i4.8448
33. Newby PK, Muller D, Hallfrisch J, Andres R, Tucker KL. Food patterns measured by factor analysis and anthropometric changes in adults. Am J Clin Nutr. (2004) 80:504–13. doi: 10.1093/ajcn/80.2.504
34. Khosravi M, Sotoudeh G, Amini M, Raisi F, Mansoori A, Hosseinzadeh M. The relationship between dietary patterns and depression mediated by serum levels of folate and vitamin b12. BMC Psychiatry. (2020) 20:63. doi: 10.1186/s12888-020-2455-2
35. Huang X, Fan Y, Han X, Huang Z, Yu M, Zhang Y, et al. Association between serum vitamin levels and depression in U.S. Adults 20 years or older based on national health and nutrition examination survey 2005–2006. Int J Environ Res Public Health. (2018) 15:1215. doi: 10.3390/ijerph15061215
36. Oh J, Yun K, Chae JH, Kim TS. Association between macronutrients intake and depression in the United States and South Korea. Front Psychiatry. (2020) 11:207. doi: 10.3389/fpsyt.2020.00207
37. Liu Y, Ju Y, Cui L, Liu T, Hou Y, Wu Q, et al. Association between dietary fiber intake and incidence of depression and anxiety in patients with essential hypertension. Nutrients. (2021) 13:1215. doi: 10.3390/nu13114159
38. Kim CS, Byeon S, Shin DM. Sources of dietary fiber are differently associated with prevalence of depression. Nutrients. (2020) 12:2813. doi: 10.3390/nu12092813
39. Li Z, Wang W, Xin X, Song X, Zhang D. Association of total zinc, iron, copper and selenium intakes with depression in the us adults. J Affect Disord. (2018) 228:68–74. doi: 10.1016/j.jad.2017.12.004
40. Ding J, Zhang Y. Associations of dietary vitamin c and e intake with depression. A meta-analysis of observational studies. Front Nutr. (2022) 9:857823. doi: 10.3389/fnut.2022.857823
41. Kim J, Kim J. Green tea, coffee, and caffeine consumption are inversely associated with elf-report lifetime depression in the Korean population. Nutrients. (2018) 10:1201. doi: 10.3390/nu10091201
42. Manosso LM, Neis VB, Moretti M, Daufenbach JF, Freitas AE, Colla AR, et al. Antidepressant-like effect of alpha-tocopherol in a mouse model of depressive-like behavior induced by tnf-alpha. Prog Neuropsychopharmacol Biol Psychiatry. (2013) 46:48–57. doi: 10.1016/j.pnpbp.2013.06.012
43. Kodydkova J, Vavrova L, Zeman M, Jirak R, Macasek J, Stankova B, et al. Antioxidative enzymes and increased oxidative stress in depressive women. Clin Biochem. (2009) 42:1368–74. doi: 10.1016/j.clinbiochem.2009.06.006
44. Lindqvist D, Dhabhar FS, James SJ, Hough CM, Jain FA, Bersani FS, et al. Oxidative stress, inflammation and treatment response in major depression. Psychoneuroendocrinology. (2017) 76:197–205. doi: 10.1016/j.psyneuen.2016.11.031
45. Paschalis V, Theodorou AA, Kyparos A, Dipla K, Zafeiridis A, Panayiotou G, et al. Low vitamin c values are linked with decreased physical performance and increased oxidative stress: reversal by vitamin c supplementation. Eur J Nutr. (2016) 55:45–53. doi: 10.1007/s00394-014-0821-x
46. Moosavian SP, Arab A, Mehrabani S, Moradi S, Nasirian M. The effect of omega-3 and vitamin e on oxidative stress and inflammation: systematic review and meta-analysis of randomized controlled trials. Int J Vitam Nutr Res. (2020) 90:553–63. doi: 10.1024/0300-9831/a000599
47. Reus GZ, Maciel AL, Abelaira HM, de Moura AB, de Souza TG, Dos ST, et al. Omega-3 and folic acid act against depressive-like behavior and oxidative damage in the brain of rats subjected to early- or late-life stress. Nutrition. (2018) 53:120–33. doi: 10.1016/j.nut.2018.03.006
48. Han QQ, Shen TT, Wang F, Wu PF, Chen JG. Preventive and therapeutic potential of vitamin c in mental disorders. Curr Med Sci. (2018) 38:1–10. doi: 10.1007/s11596-018-1840-2
49. Budni J, Zomkowski AD, Engel D, Santos DB, Dos SA, Moretti M, et al. Folic acid prevents depressive-like behavior and hippocampal antioxidant imbalance induced by restraint stress in mice. Exp Neurol. (2013) 240:112–21. doi: 10.1016/j.expneurol.2012.10.024
50. So D, Whelan K, Rossi M, Morrison M, Holtmann G, Kelly JT, et al. Dietary fiber intervention on gut microbiota composition in healthy adults: a systematic review and meta-analysis. Am J Clin Nutr. (2018) 107:965–83. doi: 10.1093/ajcn/nqy041
51. Macfarlane S, Macfarlane GT. Regulation of short-chain fatty acid production. Proc Nutr Soc. (2003) 62:67–72. doi: 10.1079/PNS2002207
52. Sealy L, Chalkley R. The effect of sodium butyrate on histone modification. Cell. (1978) 14:115–21. doi: 10.1016/0092-8674(78)90306-9
53. Machado-Vieira R, Ibrahim L, Zarate CJ. Histone deacetylases and mood disorders: epigenetic programming in gene-environment interactions. CNS Neurosci Ther. (2011) 17:699–704. doi: 10.1111/j.1755-5949.2010.00203.x
54. O'Mahony SM, Clarke G, Borre YE, Dinan TG, Cryan JF. Serotonin, tryptophan metabolism and the brain-gut-microbiome axis. Behav Brain Res. (2015) 277:32–48. doi: 10.1016/j.bbr.2014.07.027
55. Tian P, Wang G, Zhao J, Zhang H, Chen W. Bifidobacterium with the role of 5-hydroxytryptophan synthesis regulation alleviates the symptom of depression and related microbiota dysbiosis. J Nutr Biochem. (2019) 66:43–51. doi: 10.1016/j.jnutbio.2019.01.007
56. Pendyala S, Walker JM, Holt PR, A. high-fat diet is associated with endotoxemia that originates from the gut. Gastroenterology. (2012) 142:1100–1. doi: 10.1053/j.gastro.2012.01.034
57. Smidowicz A, Regula J. Effect of nutritional status and dietary patterns on human serum c-reactive protein and interleukin-6 concentrations. Adv Nutr. (2015) 6:738–47. doi: 10.3945/an.115.009415
58. Peng L, Li ZR, Green RS, Holzman IR, Lin J. Butyrate enhances the intestinal barrier by facilitating tight junction assembly via activation of amp-activated protein kinase in caco-2 cell monolayers. J Nutr. (2009) 139:1619–25. doi: 10.3945/jn.109.104638
59. Maslowski KM, Vieira AT, Ng A, Kranich J, Sierro F, Yu D, et al. Regulation of inflammatory responses by gut microbiota and chemoattractant receptor gpr43. Nature. (2009) 461:1282–6. doi: 10.1038/nature08530
60. Yang W, Yu T, Huang X, Bilotta AJ, Xu L, Lu Y, et al. Intestinal microbiota-derived short-chain fatty acids regulation of immune cell il-22 production and gut immunity. Nat Commun. (2020) 11:4457. doi: 10.1038/s41467-020-18262-6
61. Kim MH, Kang SG, Park JH, Yanagisawa M, Kim CH. Short-chain fatty acids activate gpr41 and gpr43 on intestinal epithelial cells to promote inflammatory responses in mice. Gastroenterology. (2013) 145:396–406. doi: 10.1053/j.gastro.2013.04.056
62. Au B, Smith KJ, Gariepy G, Schmitz N. The longitudinal associations between c-reactive protein and depressive symptoms: evidence from the english longitudinal study of ageing (elsa). Int J Geriatr Psychiatry. (2015) 30:976–84. doi: 10.1002/gps.4250
Keywords: depression, nutrition, dietary fiber, dietary inflammatory index, CRP
Citation: Zhang T, Cui X-m, Zhang Y-y, Xie T, Deng Y-j, Guo F-x, Wang Q, Wu Q-f, Dong M-h and Luo X-t (2023) Inflammation mediated the effect of dietary fiber on depressive symptoms. Front. Psychiatry 13:989492. doi: 10.3389/fpsyt.2022.989492
Received: 08 July 2022; Accepted: 12 December 2022;
Published: 11 January 2023.
Edited by:
Yang Xia, ShengJing Hospital of China Medical University, ChinaReviewed by:
Akira Monji, Saga University, JapanDorina Cadar, Brighton and Sussex Medical School, United Kingdom
Copyright © 2023 Zhang, Cui, Zhang, Xie, Deng, Guo, Wang, Wu, Dong and Luo. This is an open-access article distributed under the terms of the Creative Commons Attribution License (CC BY). The use, distribution or reproduction in other forums is permitted, provided the original author(s) and the copyright owner(s) are credited and that the original publication in this journal is cited, in accordance with accepted academic practice. No use, distribution or reproduction is permitted which does not comply with these terms.
*Correspondence: Xiao-ting Luo,  eHRsdW83NkAxNjMuY29t