 Makoto Wada
 Katsuya Hayashi2
- 1Developmental Disorders Section, Department of Rehabilitation for Brain Functions, Research Institute of National Rehabilitation Center for Persons With Disabilities, Tokorozawa, Japan
- 2Information and Support Center for Persons With Developmental Disorders, National Rehabilitation Center for Persons With Disabilities, Tokorozawa, Japan
- 3Psychological Experiment Section, Department of Social Rehabilitation, Research Institute of National Rehabilitation Center for Persons With Disabilities, Tokorozawa, Japan
- 4Hospital of National Rehabilitation Center for Persons With Disabilities, Tokorozawa, Japan
Introduction: Individuals with neurodevelopmental disorders, such as autism spectrum disorder (ASD), attention-deficit/hyperactivity disorder (ADHD), and specific learning disorders (SLD) have various types of sensory characteristics.
Methods: This study investigated sensory issues in individuals with neurodevelopmental disorders using a web-based questionnaire for qualitative and quantitative analysis, categorized the contents of their three most distressful sensory issues, and evaluated their order of priority.
Results: Auditory problems were reported as the most distressing sensory issue among the participants. In addition to auditory problems, individuals with ASD frequently reported more tactile problems, and individuals with SLD reported more visual problems. Among the individual sensory issues, in addition to aversion to sudden, strong, or specific stimuli, some participants reported confusions regarding multiple stimuli presenting concurrently. Additionally, the sensory issues related to foods (i.e., taste) was relatively more common in the minor group.
Conclusion: These results suggest that the diversity of sensory issues experienced should be carefully considered when aiding persons with neurodevelopmental disorders.
1. Introduction
Atypicality in social communication and restricted and repetitive behaviors or interests are major characteristics of individuals with autism spectrum disorder (ASD), as described in the Diagnostic and Statistical Manual of Mental Disorders, fifth edition (DSM-5), published by the American Psychiatric Association (APA) in 2013. Such conditions are accompanied with a wide variety of sensory characteristics, and the DSM-5 states that excessive or restricted responses to sensory stimuli—hypersensitivity and hyposensitivity, respectively—are often observed in individuals with ASD. Sensory issues in individuals with ASD, such as hypersensitivity and hyposensitivity, are not minor issues but are important factors pointing to the core of the disorder because some of these sensory characteristics directly decrease individuals’ quality of life [QoL; (1)]. Additionally, it is possible that differences in sensory processing between individuals with ASD and typically developing individuals may cause discrepancies in communication methods (2, 3).
A total of 60% to 90% of individuals with ASD experience sensory issues (4–10). Although difficult to generalize, individuals with ASD show a range of sensitivity preferences (including hypersensitivity and hyposensitivity), sensory distortions, overload, multichannel receptivity, and processing difficulties (11). Sensory issues in individuals with ASD are evident in auditory, visual, and tactile sensory modalities (12), and meta-analytic studies have indicated the existence of atypical sensory modulation in many individuals with ASD (13, 14).
Moreover, in addition to ASD, attention-deficit/hyperactivity disorder (ADHD) and specific learning disorder (SLD) are also included in neurodevelopmental disorders in the DSM-5, and these may also cause sensory issues, similar to ASD. For example, individuals with ADHD also show high scores for sensory sensitivity and sensation avoidance (15); although, it is difficult to determine how much of this is owing to a potential overlap with ASD. Neuroimaging studies have revealed shared alterations in the brain’s white matter and its connections with ASD regarding hypersensitivity (16, 17). Contrastingly, higher visual processing scores were observed in children with ADHD, compared to children with ASD and typically developing children, while oral processing scores were highest in children with ASD (18). These reports suggest that there are shared but partially distinct sensory features in between individuals with ASD and ADHD.
Among SLD, Irlen syndrome has been described as individuals having low reading ability owing to low color matching and distorted vision (19–21). Patients with this syndrome also experience visual hypersensitivity. Currently, the diagnoses of ASD, ADHD, and SLD may overlap (22), and the degree of overlap varies across individuals. We speculate that there are many differences in their sensory issues, and understanding these differences is important for the development of clinical support.
Auditory problems are major sensory issues in individuals with ASD (10, 23, 24). That is, such individuals feel distressed by some kind of sound or sometimes find it difficult to listen to someone talking. Problems related to touch, smell, and taste lead to serious difficulties, such as maladaptation to the living environment and selective eating problems (25, 26). Additionally, individuals with ASD are sometimes distressed by glaring lights (27). Contrastingly, some individuals with ASD tend to be insensitive to pain and temperature (28), and hypersensitivity and hyposensitivity are sometimes co-localized (12). However, owing to the great diversity of sensory issues, further investigation is needed to determine the sensory issues of individuals with neurodevelopmental disorders (13, 29).
Dunn and Westman (30) established a classification and evaluation method for sensory issues to provide intervention support. According to them, the two axes of threshold values for sensory stimuli and high activity of the participant were divided into independent quadrants of “low registration,” “sensory seeking,” “sensory sensitivity,” and “sensation avoidance.” A quadrant with a high threshold value for sensory stimuli and low activity was defined as “low registration,” whereas a quadrant with a high threshold value for sensory stimuli and high activity (i.e., seeking sensory stimuli) was classified as “sensory seeking.” Contrastingly, they defined a quadrant with a low threshold value for sensory stimuli and low activity as “sensory sensitivity” (hypersensitivity), and that with a low threshold value for sensory stimuli and active effort to avoid it as “sensation avoidance.” Subsequently, the adult/adolescent sensory profiles were standardized based on this classification (31).
Using the existing questionnaire (e.g., “Sensory Profile”) for each sensory issue, an appropriate support plan can be developed by evaluating the issues of each participant. Thus far, many previous studies that assessed sensory issues have used existing questionnaires [Sensory Profile, Sensory Sensitivity Questionnaire-Revised, Sensory Experiences Questionnaire, etc.; (13, 14)]. Several studies have attempted to classify the sensory features among individuals with ASD using scores from these questionnaires, and the existence of ASD subgroups widely documented (32–36). For example, some of these subgroups are characterized by difficulties with taste, smell, movement, and energy regulation (35, 36). Therefore, the existing questionnaires are very useful for such clustering and comparisons among groups.
Notably, since sensory characteristics of neurodevelopmental disorders seem to be diverse and have many aspects as reported previously (37), there are likely to be issues that are not covered by existing questionnaires. Therefore, we used a free-writing field for sensory issues as well as multiple-choice questions to clarify and categorize diverse sensory issues. This may be important for providing evidence-based support for individuals experiencing sensory issues. Moreover, it is important from a support perspective to evaluate a priority among these sensory issues. Hence, in this study, we investigated sensory issues in individuals with neurodevelopmental disorders using a web-based questionnaire for qualitative and quantitative analysis and examined a hierarchy of the most distressful sensory issues for each person.
2. Materials and methods
2.1. Questionnaire
We targeted participants who had a diagnosis (or suspicion) of neurodevelopmental disorders (ASD, ADHD, SLD, intellectual disability, and others), which are defined as “発達障害” (developmental disorders) in the Act on Support for Persons with Developmental Disorders in Japan. The original web-based questionnaire was written in Japanese (Supplementary material). First, an explanation of the study purpose was provided to participants, and after confirming the consent to participate in the study by ticking a check box, participants were asked to answer the questionnaire (in case of minors, their guardians needed to agree on their behalf). Multiple-choice questions and free-writing fields were combined in the questionnaire. Multiple-choice questions that identified the respondent’s gender, age, responder (concerned individuals themselves, support providers, or parents), current position regarding employment or educational status, and diagnosis were presented first. Subsequently, participants had to choose the modality of the most distressful sensory issues that they experienced (i.e., “visual,” “auditory,” “tactile,” “taste,” “olfactory,” “proprioception,” “vestibular,” and “others”). Thereafter, a free-writing field was provided to describe concrete examples of these issues. The free-writing field asked, “Please describe concrete examples of your issues. What are the triggers and reasons for their occurrence?” In case participants recognized second and third-most distressing issues; similar questions were presented to identify these distressing issues. For each sensory issue, questions about severity and restrictions in daily life using a Likert-type scale (0: not severe to 5: most severe, and “unanswerable”) were also presented (Supplementary Table S1). Additionally, the questionnaire included additional free-writing fields (about self-coping) and questions regarding where and when the problems arose; these were preliminary investigations for future studies (Supplementary material).
The questionnaire items were co-developed with the cooperation of volunteer group members (“OhToT”) who discussed new support methods for neurodevelopmental disorders. Individuals with ASD/ADHD/SLD, researchers, occupational therapists, engineers, medical doctors, and administrative officers joined this group. Thus, the persons who concerned to neurodevelopmental disorders were directly involved in this study.
2.2. Participants and procedure
The questionnaire was posted on the website of the Developmental Disorders Information and Support Center of the National Rehabilitation Center for Persons with Disabilities, Ministry of Health, Labor and Welfare of Japan. The response period was from August 2018 to January 2019, during which 432 responses were received. There was one duplicate response in which all items were completely matched to another response, which was removed from further analysis. Furthermore, because the contents of some descriptions included issues other than sensory issues (e.g., difficulties related to communication), we deleted these responses from further analysis (16 cases in the “most distressful” sensory issue category); thus, 415 responses were finally included. The demographic characteristics such as sex, age range, responder information, and current positions are shown in Table 1.
Table 1. Participants’ demographics.
This research was reviewed and approved by the Ethics Review Committee of the National Rehabilitation Center for Persons with Disabilities (29–175, 30–154, 31–109, 2021–136) and was conducted in compliance with Declaration of Helsinki and the “Medical Research Guidelines for Humans” of the Ministry of Health, Labor and Welfare of Japan.
2.3. Analysis
Responses were analyzed using Microsoft Excel (Office2019, Microsoft, Redmond, WA, United States). Participants were asked to answer a multiple-choice question regarding their diagnoses; possible answers included, “ASD (including autism, Asperger’s syndrome, and pervasive developmental disorders),” “ADHD,” “SLD,” “intellectual disabilities,” “others,” and “none (including suspicion).” Additionally, there was a free-writing field to specify the situation for “others” and “none” responses below the multiple-choice question. If the response of the free-writing field included “suspicion of ASD/ADHD/SLD at clinic,” the person was included in the ASD/ADHD/SLD group, respectively. There was overlap in the diagnosis or suspicion; thus, to clarify the differences in the characteristics of sensory issues in ASD, ADHD, and SLD, three types of classification were performed as follows.
First, participants were divided into two groups: those with ASD (n = 281, ASD group) and those without ASD (n = 134, non-ASD group). The ASD group included 11 ASD-suspected cases (Table 2A). Second, participants were divided into two groups: those with ADHD (n = 164, ADHD group) and those without ADHD (n = 256, non-ADHD group). The ADHD group included five ADHD-suspected cases (Table 2B). Third, participants were divided into two groups: those with SLD (n = 56, SLD group) and those without SLD (n = 361, non-SLD group). The SLD group included two SLD-suspected cases (Table 2C). Then, cross-tabulation was performed between the groups (i.e., “ASD group” vs. “non-ASD group;” “ADHD group” vs. “non-ADHD group;” and “SLD group” vs. “non-SLD group”), and Χ2 tests (test of independence) were performed to examine statistical differences between groups.
Table 2. Diagnosis of participants.
For the free-writing field (“Please describe concrete examples of issue. What are the triggers and reasons for their occurrence?”), four persons (two parents of children: T. N and N. I, two researchers: MW and KS for medical science and welfare, respectively) classified and categorized the descriptions. When a description contained more than one element (e.g., painful sounds and difficulty hearing in a crowded room), it was aggregated in each category in duplicate. Differences in categorization among the four persons were discussed until they reached a satisfactory decision. We certified the sensory modality of each sensory issue by checking the content of the free-writing field. If there were obvious mistakes in choosing the sensory modality, we re-sorted them into a more appropriate sensory modality group (e.g., “confusions by a loud voice” in the “visual problem” choice). Typical descriptions of the categories are presented in Table 3.
Table 3. An example of the descriptions of sensory issues in a free-writing field.
Figure 1. Sensory issues experienced by individuals with developmental disorders. (A) Percentage of each sensory modality in the most distressful, second-most distressful, and third-most distressful sensory issues, respectively. (B) Relationships between the most distressful and second/third-most distressful sensory issues.
3. Results
We investigated the frequency of each sensory modality in the most, the second-most, and the third-most distressful sensory issues categories.
3.1. Frequency of each sensory issue
Figure 1A shows the frequency of each sensory issue: the most, the second-most, and the third-most distressful issue. Approximately half of the most distressful sensory issues were auditory (223 out of 415 responses, 53.7%), followed by visual (45 responses, 10.8%) issues.
More than half the participants (262 of 415, 63%) mentioned and described the second-most distressing problem, in which auditory problems were still the most common (67 of 262 responses, 25.6%); however, visual problems became more prominent (64 responses, 24.4%), followed by olfactory (40 responses, 15.3%), and tactile (35 responses, 13.4%) problems.
More than one-third of participants (152, 36.6%) mentioned the third-most distressing problem. In this category, visual problems had the highest percentage (40 of 158 responses, 26.3%), followed by olfactory (27 responses, 17.8%), and tactile (22 responses, 14.5%) problems. Additionally, in the free-writing field about “other” sensory modalities, 10 participants reported severe sensory issues with multiple modalities. The relationships between the most distressful sensory issues and the second- and third-most distressing problems are shown in Figure 1B.
3.2. Differences in sensory issues among groups
To clarify the differences in sensory issues among the groups, participants were first divided into the ASD and non-ASD groups. For the most distressful sensory issue (Figure 2A), the Χ2 test revealed significant group differences in the modalities of sensory issues (Χ2 = 22.2, df = 7, p = 0.0023). Residual analysis (Supplementary Table S1A) showed that both groups had many auditory problems; however, the difference was not significant (adjusted residual = 0.42, p = 0.67). However, there were significantly more reports of visual problems (adjusted residual = 3.54, p = 0.00041; Supplementary Table S2A), after auditory problems in the non-ASD group. In the ASD group, there was a significantly higher number of tactile problems (adjusted residual =2.19, p = 0.028; Supplementary Table S2A) after auditory problems. For the second or third distressful problem (Supplementary Figures S1A,B), the Χ2 test revealed no significant difference between the groups in the modalities of sensory issues (second-most distressful problem: Χ2 = 9.67, df = 7, p = 0.21; third-most distressful problem: Χ2 = 6.44, df = 7, p = 0.49). The results of the Χ2 test and the residual analysis showed similar trends (most distressful problem: Χ2 = 22.1, df = 7, p = 0.0024; second-most distressful problem: Χ2 = 11.1, df = 7, p = 0.13; third-most distressful problem: Χ2 = 5.83, df = 7, p = 0.56, Supplementary Table S3A), when the ASD-suspected cases (n = 11) were excluded.
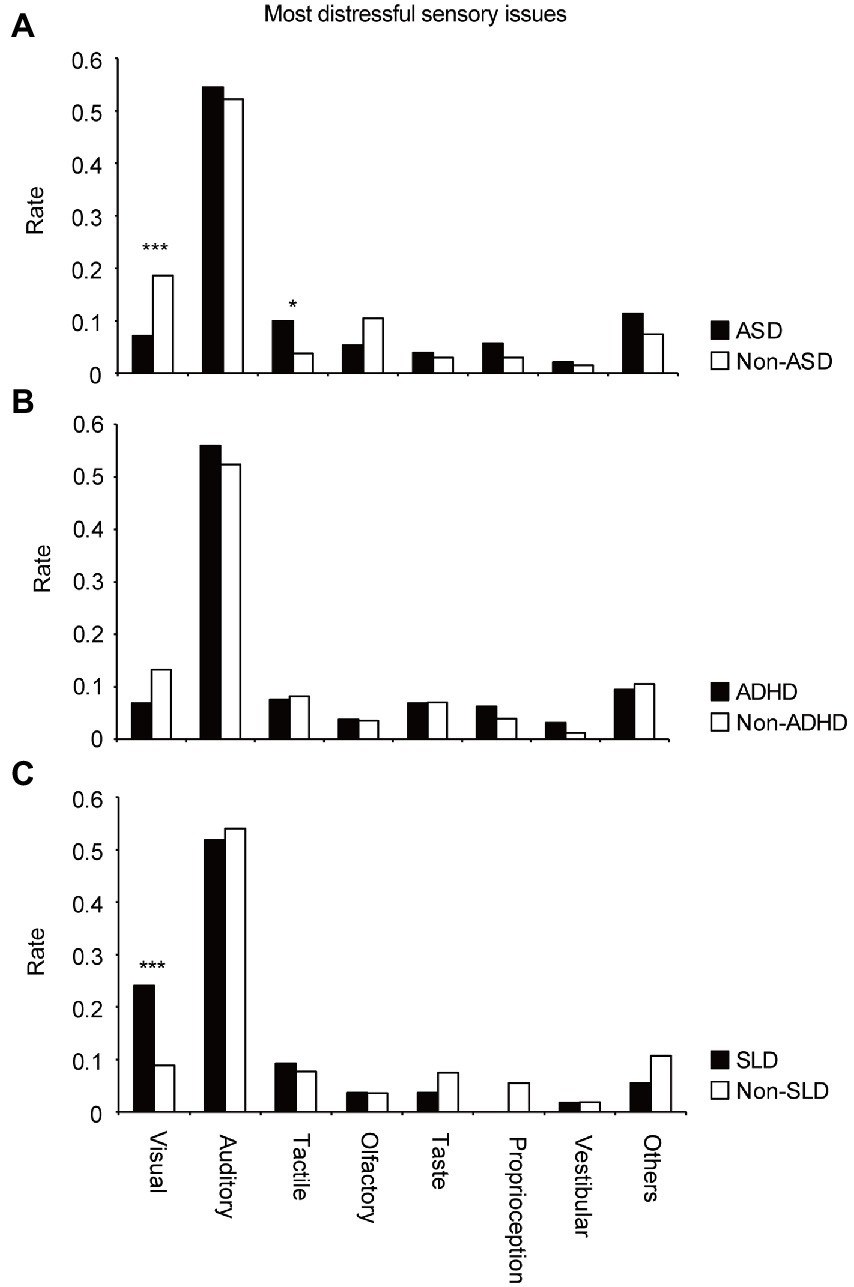
Figure 2. Differences in appearance rates of sensory issues in each modality for the most distressful sensory issues in the (A) ASD and non-ASD groups, (B) ADHD and non-ADHD groups, and (C) SLD and non-SLD groups.
Next, participants were divided into the ADHD and non-ADHD groups. For the most, second-most, and third-most distressful problem (Figure 2B; Supplementary Figures S1C,D), the Χ2 test revealed that there were no significant differences between the two groups in the modalities of sensory issues (Χ2 = 8.14, df = 7, p = 0.32; Χ2 = 6.69, df = 7, p = 0.46; Χ2 = 5.29, df = 7, p = 0.62, respectively). There was no difference in trend (Χ2 = 7.32, df = 7, p = 0.40; Χ2 = 6.57, df = 7, p = 0.48; Χ2 = 5.19, df = 7, p = 0.64, respectively), when ADHD-suspected cases (n = 5) were excluded.
Third, participants were divided into the SLD and non-SLD groups. For the most distressful sensory issue (Figure 2C), the Χ2 test revealed significant differences between the two groups in the modalities of sensory issues (Χ2 = 17.0, df = 7, p = 0.017). Residual analysis (Supplementary Table S1B) revealed significantly more reports of visual problems (adjusted residual =3.66, p = 0.00025) following the auditory problems in the SLD group. For the second or third-most distressful problem (Supplementary Figures S1E,F), the Χ2 test revealed no significant difference in the modalities of sensory issues (second-most distressful problem: Χ2 = 1.99, df = 7, p = 0.96; third-most distressful problem: Χ2 = 7.29, df = 7, p = 0.40). The results of the Χ2 test and the residual analysis showed almost same trends (most distressful problem: Χ2 = 15.9, df = 7, p = 0.026; second-most distressful problem: Χ2 = 2.29, df = 7, p = 0.94; third-most distressful problem: Χ2 = 7.33, df = 7, p = 0.40, Supplementary Table S3B), when the SLD-suspected cases (n = 2) were excluded.
3.3. Differences in sensory issues among age ranges
To clarify the differences in sensory problems among different age groups, participants were divided into four groups: minors (<18-years-old), adolescents (<30-years-old), middle-aged (<50-years-old), and late middle-aged (≧50-years-old). In this analysis, data for the most distressful, second-most distressful, and third-most distressful sensory problems were combined. The Χ2 test revealed differences in the modalities of sensory problems based on participants’ age (Χ2 = 41.3, df = 21, p = 0.0051). The residual analysis showed that there were significantly more reports of taste problems in minors (adjusted residual = 4.77, p = 0.000002, Supplementary Table S4) and fewer reports in the middle-aged group (adjusted residual = −2.58, p = 0.0099), compared with the other groups. Further, there were significantly more reports of visual problems in the middle-aged group (adjusted residual = 2.00, p = 0.046), compared with the other groups.
3.4. Free writing about the kinds of issues
Regarding the free-writing field (“Please describe concrete examples of the issues. What are the triggers and reasons for their occurrence?”), the descriptions were classified and categorized, as described in the Methods section. The overall frequency of each problem categorized by sensory modality is shown in Figure 3, and examples of problems included in each category are shown in Table 2.
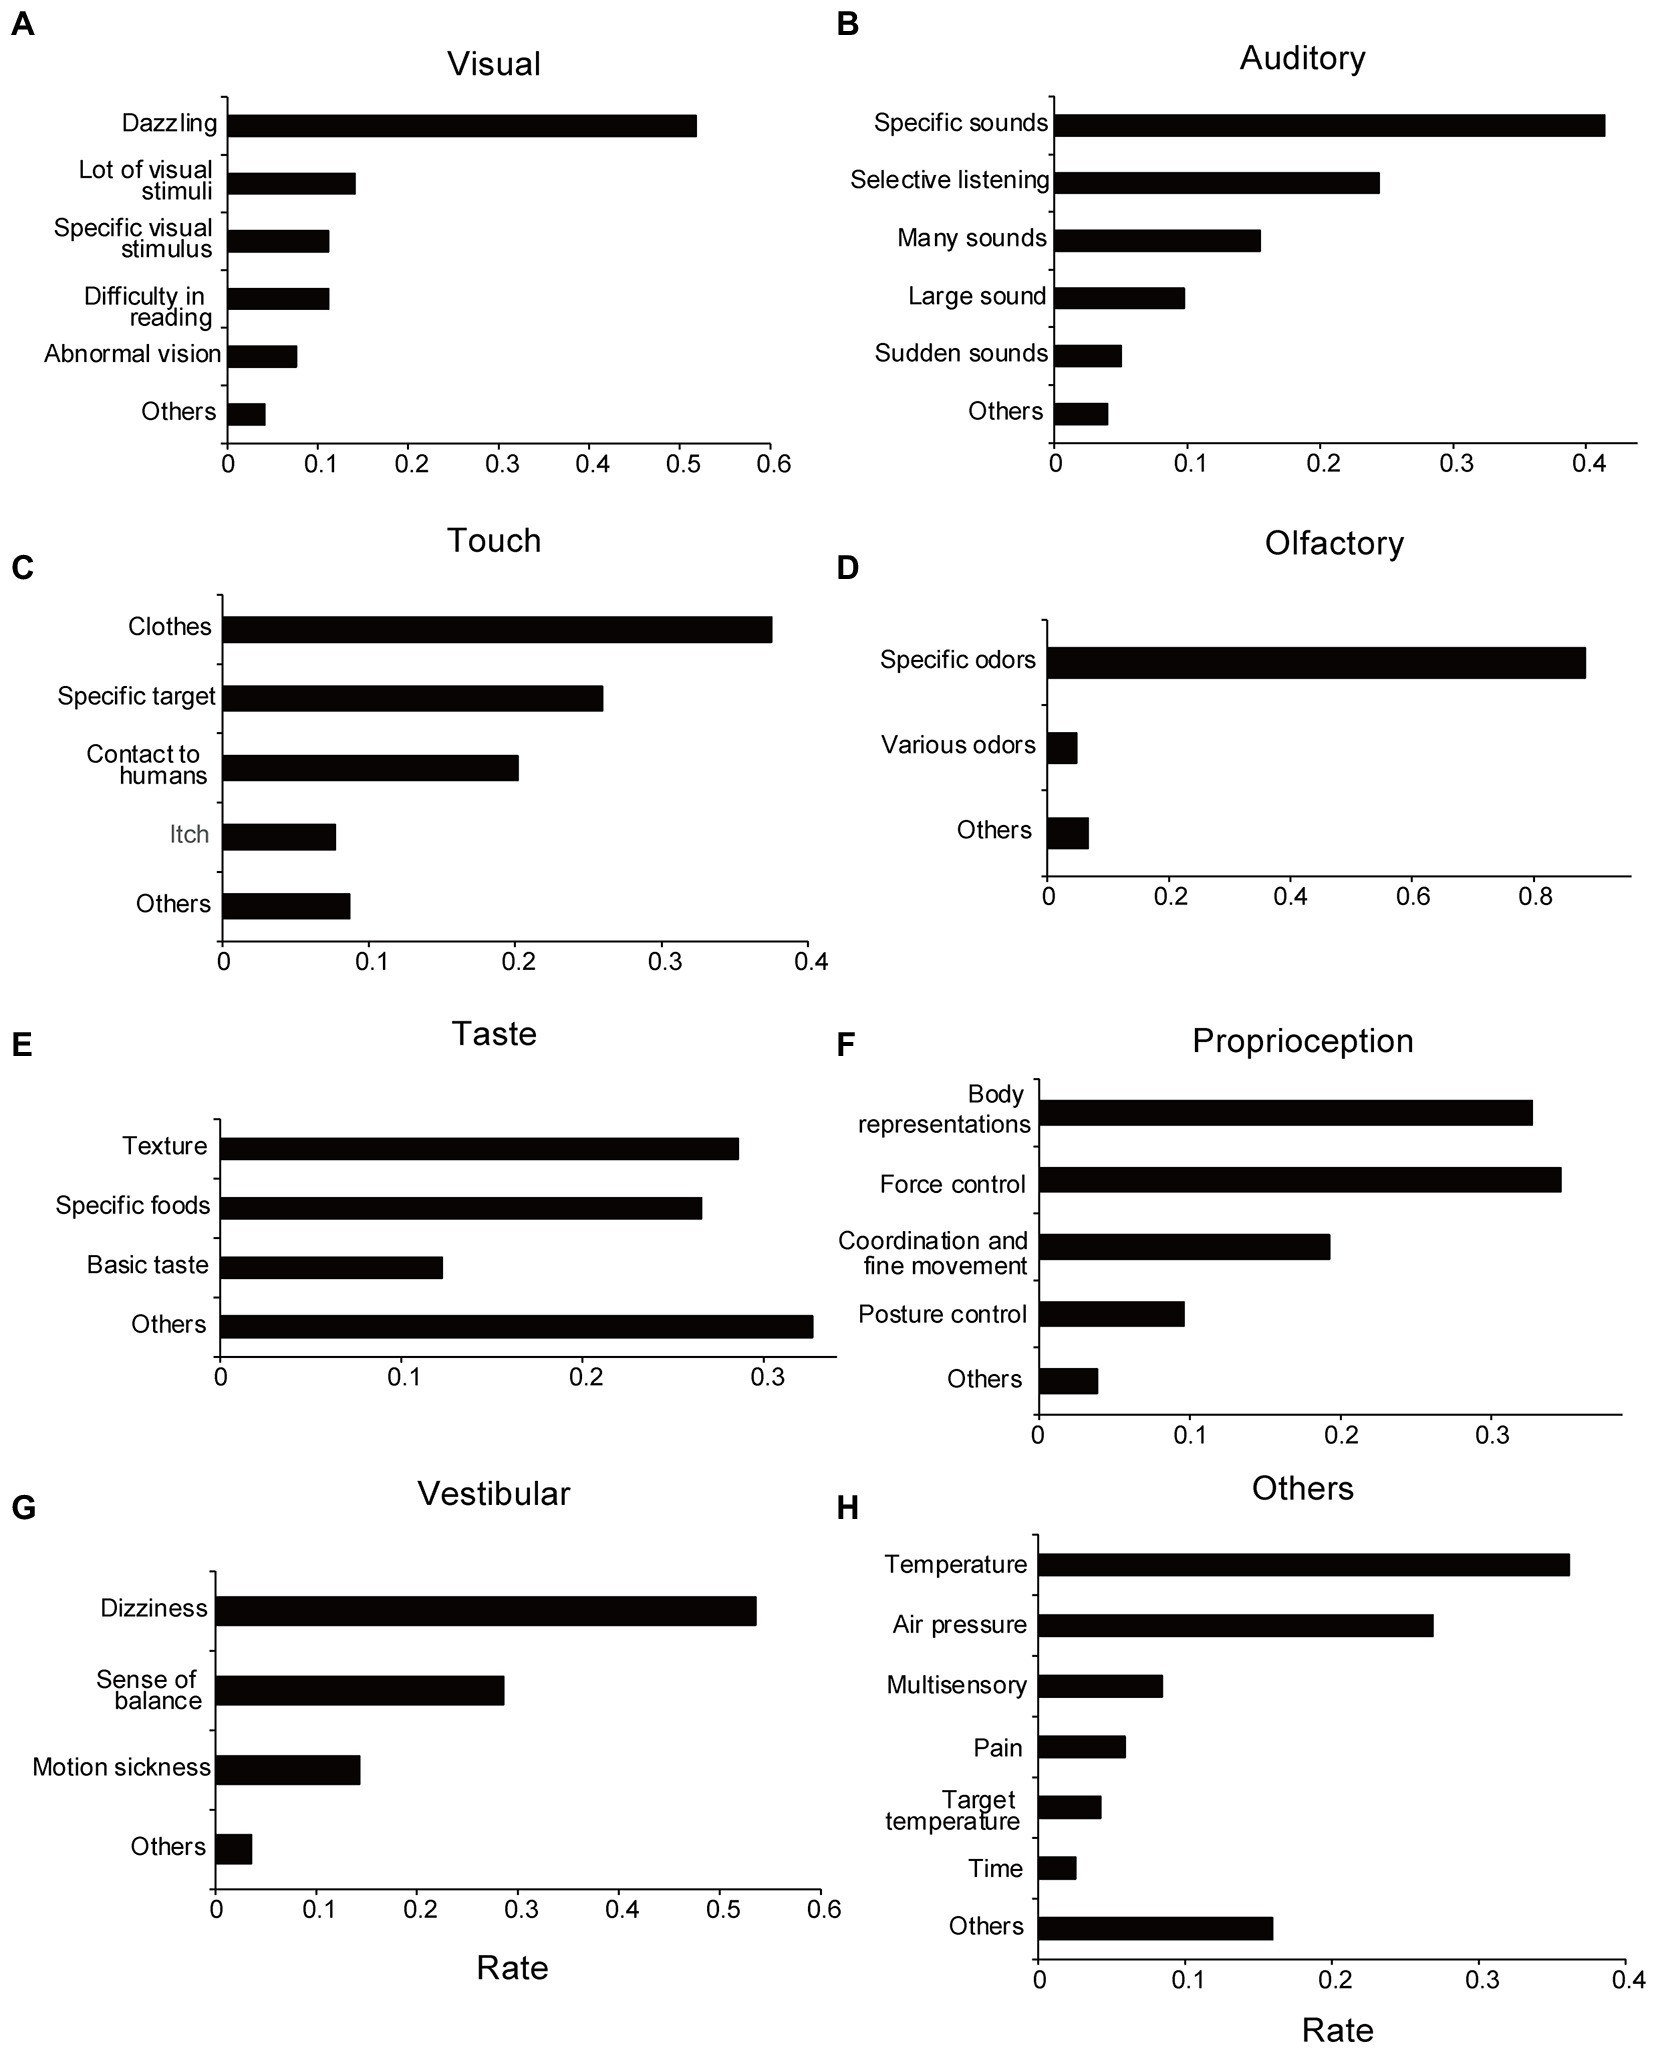
Figure 3. Categories of sensory issues extracted from free-writing fields. (A) Visual. (B) Auditory. (C) Tactile. (D) Olfactory. (E) Taste. (F) Proprioception. (G) Vestibular. (H) Others sensory issues. The rate of each category represents the ratio of response numbers to the total number of sensory issues aggregated by each modality. Note that when multiple categories are included in a single submission, they are counted in duplicate.
3.4.1. Visual problems
Approximately half the participants reported that they disliked dazzling lights (Figure 3A; Table 2A). Responses related to detesting a specific visual target and confusion regarding multiple visual stimuli were also presented. These are related to visual hypersensitivity.
The Χ2 test revealed marginally significant differences in visual problems (Χ2 = 10.3, df = 5, p = 0.066; without suspected cases: Χ2 = 9.32, df = 5, p = 0.097) between the ASD and non-ASD groups. Residual analysis showed that reading difficulty was frequently reported in the non-ASD group (adjusted residual = 3.07, p = 0.0021; without suspected cases: adjusted residual = 2.93, p = 0.0034; Supplementary Figure S2A; Supplementary Tables S5A, S6A). Moreover, between the ADHD and non-ADHD groups, the Χ2 test showed marginally significant differences in visual problems (Χ2 = 10.7, df = 5, p = 0.057; without suspected cases: Χ2 = 10.3, df = 5, p = 0.068). Furthermore, residual analysis showed frequent reports of “dazzling” in the ADHD group (adjusted residual = 2.78, p = 0.0054; without suspected cases: adjusted residual = 2.94, p = 0.0034; Supplementary Figure S2B; Supplementary Tables S5B, S6B).
Next, the Χ2 test revealed significant group differences in sensory issue modalities between the SLD and non-SLD groups (Χ2 = 28.1, df = 5, p = 0.000035; without suspected cases: Χ2 = 25.7, df = 5, p = 0.00010). Residual analysis revealed that “difficulty in reading” and “abnormal vision” were frequently reported in the SLD group (adjusted residual = 4.38, p = 0.00001 and adjusted residual =2.45, p = 0.014, respectively; without suspected cases: adjusted residual = 4.08, p = 0.000045 and adjusted residual = 2.52, p = 0.012, respectively; Supplementary Figure S2C; Supplementary Tables S5C, S6C). Contrastingly, there were significantly fewer reports of “dazzling” (adjusted residual = −2.53, p = 0.011; without suspected cases: adjusted residual = −2.40, p = 0.016; Supplementary Tables S5C, S6C) in the SLD group.
In summary, participants in the SLD group reported more reading problems and abnormal vision. Additionally, participants in the ADHD group may have had more problems with dazzling lights.
3.4.2. Auditory problems
Most auditory problems were related to hypersensitivity, except for those classified as difficult-to-selective hearing, such as the inability to hear another person’s voice well in noisy conditions (Figure 3B). Of these, the most common answer was a description of specific sounds that were disliked, as well as loudness or unpredictable sudden changes in sounds. Examples of disliked sounds included children crying, electronic beeps, motor sounds, and human-generated sounds, such as those of chewing. Overall, participants tended to dislike sounds containing high-frequency components with a loud sound. Additionally, there were several descriptions in which various sounds, such as surrounding noises and speaking voices, were heard at the same volume, which made the participant feel tired. Regarding these auditory problems, there were no significant differences between the ASD and non-ASD groups (Χ2 = 6.77, df = 5, p = 0.24; without suspected cases: Χ2 = 6.40, df = 5, p = 0.27), the ADHD and non-ADHD groups (Χ2 = 5.63, df = 5, p = 0.34; without suspected cases: Χ2 = 4.88, df = 5, p = 0.43), and SLD and non-SLD groups (Χ2 = 2.00, df = 5, p = 0.85; without suspected cases: Χ2 = 2.86, df = 5, p = 0.72).
3.4.3. Tactile problems
Most tactile problems were related to unpleasant tactile sensations (tactile hypersensitivity), such as problems with clothes, human contact, and specific targets (e.g., water; Figure 3C). Many participants described that they were concerned about clothes tags and disliked touching certain materials. Some participants described that they disliked human contact, such as handshakes, hugs, and contact in crowded trains. Some participants also stated that they disliked specific targets, such as water or paper-based materials, and could not touch them. Regarding tactile problems, no significant difference was found between the ASD and non-ASD groups (Χ2 = 3.50, df = 4, p = 0.48; without suspected cases: Χ2 = 3.45, df = 4, p = 0.49), the ADHD and non-ADHD groups (Χ2 = 2.36, df = 4, p = 0.67), and the SLD and non-SLD groups (Χ2 = 7.00, df = 4, p = 0.14). As for the ADHD and SLD groups, suspected cases were not included in the tactile problems. For the following sensory modalities, only the statistical results for all cases will be listed in the same way, if no suspected cases are included.
3.4.4. Olfactory problems
Most responses were related to unpleasant odors. For example, odors related to humans, such as sweat; odors related to cars, such as gasoline; and daily life odors, such as kitchen waste, were typical responses (Figure 3D). Regarding olfactory problems, there were no significant differences between the ASD and non-ASD groups (Χ2 = 0.72, df = 2, p = 0.70; without suspected cases: Χ2 = 0.79, df = 2, p = 0.67), the ADHD and non-ADHD groups (Χ2 = 4.21, df = 2, p = 0.12; without suspected cases: Χ2 = 4.01, df = 2, p = 0.13), and SLD and non-SLD groups (Χ2 = 2.44, df = 2, p = 0.29).
3.4.5. Taste problems
There were many descriptions of the textures and certain foods (Figure 3E). There were few answers regarding “salty/sour/sweet/bitter/umami” (basic taste) tastes; however, some participants reported that they disliked strong tastes, such as strong seasonings (umami), salty, and sour tastes. Academically, texture is considered a somatosensory sensation, not a taste sensation. No significant differences were found between the ASD and non-ASD groups (X2 = 0.082, df = 3, p = 0.99; without suspected cases: Χ2 = 0.047, df = 3, p = 0.997), ADHD and non-ADHD groups (Χ2 = 1.64, df = 3, p = 0.65), and SLD and non-SLD groups (Χ2 = 1.89, df = 3, p = 0.60) regarding taste problems.
3.4.6. Proprioception problems
Representative descriptions were categorized as “problems with body representations,” “problems with force controls,” “problems with coordination/fine movements,” and “problems with posture control” (Figure 3F). No significant differences were found between the ASD and non-ASD groups (Χ2 = 3.24, df = 4, p = 0.52), ADHD and non-ADHD groups (Χ2 = 5.09, df = 4, p = 0.28), and SLD and non-SLD groups (Χ2 = 5.20, df = 3, p = 0.27; Without suspected cases: Χ2 = 6.54, df = 4, p = 0.16).
3.4.7. Vestibular problems
Vestibular problems were categorized as “dizziness,” “not good at balance,” and “prone to motion sickness” (Figure 3G). Regarding “prone to motion sickness,” only responses by the non-ASD group were classified in this category. Therefore, between the ASD and non-ASD groups, the X2 test revealed group differences in vestibular problems (Χ2 = 11.4, df = 3, p = 0.0097; without suspected cases: Χ2 = 10.7, df = 3, p = 0.013). The residual analysis showed fewer reports for “prone to motion sickness” in the ASD group (adjusted residual = −2.90, p = 0.0038; without suspected cases: adjusted residual = −2.83, p = 0.0047; Supplementary Figure S2D; Supplementary Tables S5D, S6D). Contrastingly, no significant difference was found between the ADHD and non-ADHD groups (Χ2 = 2.44, df = 3, p = 0.49) and the SLD and non-SLD groups (Χ2 = 1.59, df = 3, p = 0.66).
3.4.8. Other problems
For “other sensory problems,” the descriptions were categorized as temperature-related problems, weather-related problems (such as temperature and atmospheric pressure), and pain-related issues (Figure 3H). Some participants described multiple sensory issues that could occur simultaneously, such as audiovisual, tactile, temperature, and olfactory problems. No significant difference was found between the ASD and non-ASD groups (Χ2 = 9.09, df = 6, p = 0.17) or the SLD and non-SLD groups (Χ2 = 3.37, df = 6, p = 0.76; without suspected cases: Χ2 = 3.44, df = 6, p = 0.84). Contrastingly, the Χ2 test revealed marginally significant differences between the ADHD and non-ADHD groups (Χ2 = 12.3, df = 6, p = 0.055; without suspected cases: Χ2 = 12.1, df = 6, p = 0.096). The residual analysis showed that reports regarding problems about “pain” were fewer in the ADHD group (adjusted residual = −2.36, p = 0.018; without suspected cases: adjusted residual = −2.32, p = 0.021; Supplementary Figure S2E; Supplementary Tables S5E, S6E). Additionally, as described in the Methods section, there were some descriptions of communication and interpersonal difficulties that could not be considered as sensory issues.
4. Discussion
This study investigated the characteristics of sensory issues in individuals with neurodevelopmental disorders using a web-based questionnaire and examined (1) the priority of the sensory issues; (2) the differences in sensory issues among individuals with ASD, ADHD, and SLD; and (3) the content of sensory issues with wide diversities.
Auditory problems accounted for nearly half of the most distressful sensory issues reported by participants, which coincides with previous studies suggesting the significance of auditory problems (23, 24). Therefore, the results suggest that auditory problems account for most distressful problems in individuals with neurodevelopmental disorders and that coping with auditory hypersensitivity and difficulty in selective listening are important for reducing issues in their daily life. Reduction of background noise by headphones or earplugs with a noise-canceling function is one of the most promising solutions to improve QoL for individuals with neurodevelopmental disorders (38).
As shown in Figure 1A, the frequency of visual problems was the highest after auditory problems. Particularly, in the SLD group, there was a high frequency of visual problems, (Figure 2C). In addition to typical visual hypersensitivity (e.g., aversion to dazzling lights), confusion about visual information and reading difficulties were also reported. Problems with difficulty in reading and abnormal vision, which were highlighted in the SLD group, may be related to the features of dyslexia. The SLD group may have included individuals with Irlen syndrome, which is also characterized by reading difficulties, abnormal vision, and visual hypersensitivity (19, 20, 39, 40). These characteristics were similar to those of the visual problems found in the SLD group. However, Irlen syndrome is not a medical diagnosis, and some researchers believe that some of its symptoms can be explained by eye movement disorders rather than sensory processing (21, 41, 42). Additionally, visual problems tended to be relatively more common in the middle-aged group (Supplementary Table S4). The effects of aging may be related to this result.
Contrastingly, in the ASD group, except for “other problems,” tactile problems were the most common, after auditory problems (Figure 2A). This result suggests that tactile problems are more likely to manifest in individuals with ASD. Most tactile problems were related to disturbing tactile sensations (e.g., clothes tags, clothing materials, and human contact), suggesting the existence of tactile hypersensitivity. Consistently, several previous studies have suggested that sensitivity for detection of tactile stimuli is high among individuals with ASD (43, 44), supporting the present result that aversion to touch is more critical than selective attention. The relationship between tactile temporal resolution and hypersensitivity in individuals with ASD (45) also supports this view. Additionally, among those who reported tactile problems, a certain percentage of participants also reported auditory problems (Figure 1B). Therefore, we must consider the possibility that tactile hypersensitivity prevents the use of headphones to cope with auditory hypersensitivity. Furthermore, various other sensory modalities were selected as distressful sensory issues (olfactory, taste, proprioception, vestibular, and others). Considering methods to cope with various sensory issues, this study clearly shows that we need to consider the co-occurrence of auditory and tactile problems.
In the free-writing analysis, we asked participants to describe the kinds of sensory issues that they face. Most responses were related to sensory hypersensitivity; in auditory, visual, and olfactory problems, there were cases where some distressful sensations such as specific stimuli, strong stimuli, and fluctuating stimuli were reported. In the case of auditory problems, examples of specific sounds included high-frequency sounds, such as children’s crying and electronic sounds. Loud and sudden sounds were also reported as distressful, suggesting that difficulty in stimulus prediction is related to hypersensitivity, as previously hypothesized (46). In other words, if a sensory stimulus is difficult to predict for the person, it will be perceived as a strong stimulus that arises suddenly. Regarding visual stimulus, it was noticeable that strong light such as sunlight was dazzling; however, the responses also suggested that visual stimulus at specific wavelengths, such as LEDs, primary colors, and blinking lights, are distressing. The fact that changing stimuli, such as blinking lights, is distressful, suggests a commonality with auditory problems. Regarding olfactory problems, descriptions of specific odors, such as daily life and car odors, were conspicuous. Most of the odors were generally so-called bad odors.
In other cases, various stimuli occurring simultaneously made respondents feel tired, even if individual stimuli were not distressful (confusions by “many sounds,” “lot of visual information,” and “various odors”). This type of hypersensitivity may be caused by sensory filtering for suppressing distractors or paying attention to targets (47, 48). We speculated that the difficulty in selective listening was caused by a similar mechanism; that is, it is difficult to suppress noise and voices other than that of the speaker’s (“the cocktail party effect”).
An additional analysis was conducted to examine changes in the priority of sensory issues by age groups. The result shows that the taste problem was relatively more common in the minor group, while it was less common in the middle-aged group. The taste problem may decrease with age. The fact that minors cannot choose the content of their meals, as represented by school lunches, may make the taste problem more apparent. Additionally, some taste problems (more than one-fourth) are related to food textures and should be strictly classified as somatosensory in the oral cavity. Considering this, it is appropriate to interpret “taste problems” in this survey as problems related to food (including taste, tactile, and olfactory), rather than simple taste problems. However, since there were some descriptions of basic tastes, we believe that there is indeed an issue with the taste itself. For proprioception and vestibular problems, a variety of answers were provided in the free-writing field. Since integration with other sensory signals is also important for body representation and postural control, and not only sensory information processing but also motor control issues are involved (49), the background needs to be carefully considered.
To implement evidence-based supports for the sensory issues in individuals with neurodevelopmental disorders, it is critical to clarify the neural basis of the sensory issues. Although deficits in sensory filtering, impaired predictions of sensory signals and so on (46, 48) have been proposed as possible mechanisms, the neural basis remains unclear. In this context, it is important to consider several syndromes with ASD characteristics, such as Fragile X syndrome, for which the causative gene (Fmr1) has been identified and the pathophysiology is becoming clearer. Moreover, Fragile X syndrome have prominent sensory issues such as auditory hypersensitivity, along with ASD characteristics (50–52). A variety of electrophysiological features have been reported, and it has been discussed that abnormalities in inhibitory PV neurons are associated with auditory hypersensitivity from studies of the model mice. It is also known in other mouse models (e.g., Shank3-KO mice) with a disturbance in the excitatory-inhibitory balance have characteristics related to the sensory hypersensitivity, such as enhanced tactile responses (53), and it is quite possible that a similar phenomenon may be responsible for sensory hypersensitivity in humans. Thus, basic research at the molecular level is promising for elucidating the mechanisms of sensory issues. Clarification of the basic mechanisms for each of the diverse sensory issues presented in this study will be essential for development of evidence-based support in the future.
This study had some limitations. First, diagnoses were based on participants’ self-reports, which included a small number of cases of “suspicion at the clinic.” Although the results showed almost same trends when the suspected cases were removed, these could be potential limitations. Additionally, regarding their diagnoses, participants were asked to respond based on their diagnosis at the time they were diagnosed. Thus, the ASD group includes participants with diagnosis of autism, Asperger’s syndrome, and pervasive developmental disorders. Moreover, many overlapping cases (e.g., ASD and ADHD) were included. The present analysis focused on the characteristics of each disorder; however, this is another limitation of this study, as overlap might cause unique sensory issues. Further investigation is needed with more cases with clear diagnoses. Second, the survey was restricted to individuals who were aware of their sensory issues and voluntarily participated in the survey. Therefore, it is possible that a sample bias exists when compared to the average representation of individuals with neurodevelopmental disorders. In addition to the possibility of differences in the manifestation of sensory issues, this might reflect differences in interest in the topic and hesitancy to participate in a research study. In addition, respondents’ cognitive capacity was not controlled for in this study because the respondents were widely recruited. Therefore, future surveys with diverse samples should control variables such as gender, social background, and cognitive capacity to reduce bias in responses. Third, the survey asked participants to list the sensory issues they experienced and assess their diversity and severity. Therefore, the degree of impact on QoL needs to be re-evaluated.
Among sensory issues, auditory problems (i.e., mainly hypersensitivity) are the most distressing in individuals with neurodevelopmental disorders. However, individuals with ASD also experience more tactile problems along with auditory problems. Contrastingly, individuals with SLD frequently report more visual problems. Among sensory issues, in addition to aversion to sudden, strong, or specific stimuli, they often reported confusions regarding multiple simultaneous stimuli. These results suggest that the diversity of sensory issues should be carefully considered when aiding individuals with neurodevelopmental disorders.
Data availability statement
The raw data supporting the conclusions of this article will be made available by the authors, without undue reservation.
Ethics statement
The studies involving human participants were reviewed and approved by Ethics Review Committee of the National Rehabilitation Center for Persons With Disabilities (29–175, 30–154, 31–109, 2021–136). Written informed consent for participation was not provided by the participants’ legal guardians/next of kin because: This is an anonymous web survey. An explanation of the purpose of the study was provided to the participants on the web, and after confirming the consent to participate in the study by ticking a check box (in case of minors, their guardians needed to agree on their behalf), the web survey was started.
Author contributions
MW conceived the research and wrote the first draft. KH and KN conducted the web surveys. MW, KS, NI, and TN analyzed the data. All authors revised and approved the final manuscript.
Funding
This study was partly supported by JSPS grants (JP 19H00532, JP 21H05053, JP19K22885, and JP22K18666) and MEXT grants (JP19H04921 and JP20H04595).
Acknowledgments
We thank Hideki Nishiyama for website management; Ms. Mio Ozaki, Dr. Satoshi Kataoka, Prof. Eiko Todo, and Dr. Noriko Yasuda for recruiting participants; OhToT members for preparing question items and discussions; and Drs. Eiichi Ono, Masafumi Hizume, Reiko Fukatsu, and Yuko Seko for their continuous encouragement.
Conflict of interest
The authors declare that the research was conducted in the absence of any commercial or financial relationships that could be construed as a potential conflict of interest.
Publisher’s note
All claims expressed in this article are solely those of the authors and do not necessarily represent those of their affiliated organizations, or those of the publisher, the editors and the reviewers. Any product that may be evaluated in this article, or claim that may be made by its manufacturer, is not guaranteed or endorsed by the publisher.
Supplementary material
The Supplementary material for this article can be found online at: https://www.frontiersin.org/articles/10.3389/fpsyt.2023.1077542/full#supplementary-material
References
1. Ismael, N, Lawson, LM, and Hartwell, J. Relationship between sensory processing and participation in daily occupations for children with autism spectrum disorder: a systematic review of studies that used Dunn’s sensory processing framework. Am J Occup Ther. (2018) 72:7203205030p1. doi: 10.5014/ajot.2018.024075
2. Glod, M, Riby, DM, Honey, E, and Rodgers, J. Psychological correlates of sensory processing patterns in individuals with autism spectrum disorder: a systematic review. Rev J Autism Dev Disord. (2015) 2:199–221. doi: 10.1007/s40489-015-0047-8
3. Tomchek, SD, Little, LM, and Dunn, W. Sensory pattern contributions to developmental performance in children with autism spectrum disorder. Am J Occup Ther. (2015) 69:6905185040p1. doi: 10.5014/ajot.2015.018044
4. Baranek, GT, David, FJ, Poe, MD, Stone, WL, and Watson, LR. Sensory experiences questionnaire: discriminating sensory features in young children with autism, developmental delays, and typical development. J Child Psychol Psychiatry. (2006) 47:591–601. doi: 10.1111/j.1469-7610.2005.01546.x
5. Crane, L, Goddard, L, and Pring, L. Sensory processing in adults with autism spectrum disorders. Autism. (2009) 13:215–28. doi: 10.1177/1362361309103794
6. Hazen, EP, Stornelli, JL, O'Rourke, JA, Koesterer, K, and McDougle, CJ. Sensory symptoms in autism spectrum disorders. Harv Rev Psychiatry. (2014) 22:112–24. doi: 10.1097/01.HRP.0000445143.08773.58
7. Klintwall, L, Holm, A, Eriksson, M, Carlsson, LH, Olsson, MB, Hedvall, A, et al. Sensory abnormalities in autism: a brief report. Res Dev Disabil. (2011) 32:795–800. doi: 10.1016/j.ridd.2010.10.021
8. Leekam, SR, Nieto, C, Libby, SJ, Wing, L, and Gould, J. Describing the sensory abnormalities of children and adults with autism. J Autism Dev Disord. (2007) 37:894–910. doi: 10.1007/s10803-006-0218-7
9. Marco, EJ, Hinkley, LB, Hill, SS, and Nagarajan, SS. Sensory processing in autism: a review of neurophysiologic findings. Pediatr Res. (2011) 69:48R–54R. doi: 10.1203/PDR.0b013e3182130c54
10. Tomchek, SD, and Dunn, W. Sensory processing in children with and without autism: a comparative study using the short sensory profile. Am J Occup Ther. (2007) 61:190–200. doi: 10.5014/ajot.61.2.190
11. O'Neill, M, and Jones, RS. Sensory-perceptual abnormalities in autism: a case for more research? J Autism Dev Disord. (1997) 27:283–93. doi: 10.1023/a:1025850431170
12. Kern, JK, Trivedi, MH, Grannemann, BD, Garver, CR, Johnson, DG, Andrews, AA, et al. Sensory correlations in autism. Autism. (2007) 11:123–34. doi: 10.1177/1362361307075702
13. Ben-Sasson, A, Gal, E, Fluss, R, Katz-Zetler, N, and Cermak, SA. Update of a meta-analysis of sensory symptoms in ASD: a new decade of research. J Autism Dev Disord. (2019) 49:4974–96. doi: 10.1007/s10803-019-04180-0
14. Ben-Sasson, A, Hen, L, Fluss, R, Cermak, SA, Engel-Yeger, B, and Gal, E. A meta-analysis of sensory modulation symptoms in individuals with autism spectrum disorders. J Autism Dev Disord. (2009) 39:1–11. doi: 10.1007/s10803-008-0593-3
15. Bijlenga, D, Tjon-Ka-Jie, JYM, Schuijers, F, and Kooij, JJS. Atypical sensory profiles as core features of adult ADHD, irrespective of autistic symptoms. Eur Psychiatry. (2017) 43:51–7. doi: 10.1016/j.eurpsy.2017.02.481
16. Itahashi, T, Fujino, J, Sato, T, Ohta, H, Nakamura, M, Kato, N, et al. Neural correlates of shared sensory symptoms in autism and attention-deficit/hyperactivity disorder. Brain Commun. (2020) 2:fcaa 186. doi: 10.1093/braincomms/fcaa186
17. Ohta, H, Aoki, YY, Itahashi, T, Kanai, C, Fujino, J, Nakamura, M, et al. White matter alterations in autism spectrum disorder and attention-deficit/hyperactivity disorder in relation to sensory profile. Mol Autism. (2020) 11:77. doi: 10.1186/s13229-020-00379-6
18 Little, LM, Dean, E, Tomchek, S, and Dunn, W. Sensory processing patterns in autism, attention deficit hyperactivity disorder, and typical development. Phys Occup Ther Pediatr. (2018) 38:243–54. doi: 10.1080/01942638.2017.1390809
19. Miyasaka, JDS, Vieira, RVG, Novalo-Goto, ES, Montagna, E, and Wajnsztejn, R. Irlen syndrome: systematic review and level of evidence analysis. Arq Neuropsiquiatr. (2019) 77:194–207. doi: 10.1590/0004-282X20190014
20. Nandakumar, K, and Leat, SJ. Dyslexia: a review of two theories. Clin Exp Optom. (2008) 91:333–40. doi: 10.1111/j.1444-0938.2008.00277.x
21. Uccula, A, Enna, M, and Mulatti, C. Colors, colored overlays, and reading skills. Front Psychol. (2014) 5:833. doi: 10.3389/fpsyg.2014.00833
22. American Psychiatric Association. Diagnostic and statistical manual of mental disorders: DSM-5. Arlington, VA: American Psychiatric Association (2013) doi: 10.1176/appi.books.9780890425596.
23. Gomes, E, Rotta, NT, Pedroso, FS, Sleifer, P, and Danesi, MC. Auditory hypersensitivity in children and teenagers with autistic spectrum disorder. Arq Neuropsiquiatr. (2004) 62:797–801. doi: 10.1590/s0004-282x2004000500011
24. Hitoglou, M, Ververi, A, Antoniadis, A, and Zafeiriou, DI. Childhood autism and auditory system abnormalities. Pediatr Neurol. (2010) 42:309–14. doi: 10.1016/j.pediatrneurol.2009.10.009
25. Cermak, SA, Curtin, C, and Bandini, LG. Food selectivity and sensory sensitivity in children with autism spectrum disorders. J Am Diet Assoc. (2010) 110:238–46. doi: 10.1016/j.jada.2009.10.032
26. Chistol, LT, Bandini, LG, Must, A, Phillips, S, Cermak, SA, and Curtin, C. Sensory sensitivity and food selectivity in children with autism spectrum disorder. J Autism Dev Disord. (2018) 48:583–91. doi: 10.1007/s10803-017-3340-9
27. Davis, RA, Bockbrader, MA, Murphy, RR, Hetrick, WP, and O'Donnell, BF. Subjective perceptual distortions and visual dysfunction in children with autism. J Autism Dev Disord. (2006) 36:199–210. doi: 10.1007/s10803-005-0055-0
28. Vaughan, S, McGlone, F, Poole, H, and Moore, DJ. A quantitative sensory testing approach to pain in autism spectrum disorders. J Autism Dev Disord. (2020) 50:1607–20. doi: 10.1007/s10803-019-03918-0
29. Rogers, SJ, and Ozonoff, S. Annotation: what do we know about sensory dysfunction in autism? A critical review of the empirical evidence. J Child Psychol Psychiatry. (2005) 46:1255–68. doi: 10.1111/j.1469-7610.2005.01431.x
30. Dunn, W, and Westman, K. The sensory profile: the performance of a national sample of children without disabilities. Am J Occup Ther. (1997) 51:25–34. doi: 10.5014/ajot.51.1.25
31. Brown, C, Tollefson, N, Dunn, W, Cromwell, R, and Filion, D. The adult sensory profile: measuring patterns of sensory processing. Am J Occup Ther. (2001) 55:75–82. doi: 10.5014/ajot.55.1.75
32. Baker, AE, Lane, A, Angley, MT, and Young, RL. The relationship between sensory processing patterns and behavioral responsiveness in autistic disorder: a pilot study. J Autism Dev Disord. (2008) 38:867–75. doi: 10.1007/s10803-007-0459-0
33. Kaneko, A, Ohshima, R, Noda, H, Matsumaru, T, Iwanaga, R, and Ide, M. Sensory and social subtypes of Japanese individuals with autism spectrum disorders. J Autism Dev Disord. (2022). doi: 10.1007/s10803-022-05577-0
34. Lane, AE, Molloy, CA, and Bishop, SL. Classification of children with autism spectrum disorder by sensory subtype: a case for sensory-based phenotypes. Autism Res. (2014) 7:322–33. doi: 10.1002/aur.1368
35. Lane, AE, Young, RL, Baker, AE, and Angley, MT. Sensory processing subtypes in autism: association with adaptive behavior. J Autism Dev Disord. (2010) 40:112–22. doi: 10.1007/s10803-009-0840-2
36. Scheerer, NE, Curcin, K, Stojanoski, B, Anagnostou, E, Nicolson, R, Kelley, E, et al. Exploring sensory phenotypes in autism spectrum disorder. Mol Autism. (2021) 12:67. doi: 10.1186/s13229-021-00471-5
37. Tomchek, SD, Huebner, RA, and Dunn, W. Patterns of sensory processing in children with an autism spectrum disorder. Res Autism Spectr Disord. (2014) 8:1214–24. doi: 10.1016/j.rasd.2014.06.006
38. Pfeiffer, B, Stein Duker, L, Murphy, A, and Shui, C. Effectiveness of noise-attenuating headphones on physiological responses for children with autism spectrum disorders. Front Integr Neurosci. (2019) 13:65. doi: 10.3389/fnint.2019.00065
39. Evans, BJ, Busby, A, Jeanes, R, and Wilkins, AJ. Optometric correlates of Meares-Irlen syndrome: a matched group study. Ophthalmic Physiol Opt. (1995) 15:481–7. doi: 10.1046/j.1475-1313.1995.9500063j.x
40. Evans, BJ, Patel, R, Wilkins, AJ, Lightstone, A, Eperjesi, F, Speedwell, L, et al. A review of the management of 323 consecutive patients seen in a specific learning difficulties clinic. Ophthalmic Physiol Opt. (1999) 19:454–66. doi: 10.1046/j.1475-1313.1999.00465.x
41. Blaskey, P, Scheiman, M, Parisi, M, Ciner, EB, Gallaway, M, and Selznick, R. The effectiveness of Irlen filters for improving reading performance: a pilot study. J Learn Disabil. (1990) 23:604–12. doi: 10.1177/002221949002301007
42. Ciuffreda, KJ, Scheiman, M, Ong, E, Rosenfield, M, and Solan, HA. Irlen lenses do not improve accommodative accuracy at near. Optom Vis Sci. (1997) 74:298–302. doi: 10.1097/00006324-199705000-00026
43. Blakemore, SJ, Tavassoli, T, Calo, S, Thomas, RM, Catmur, C, Frith, U, et al. Tactile sensitivity in Asperger syndrome. Brain Cogn. (2006) 61:5–13. doi: 10.1016/j.bandc.2005.12.013
44. Cascio, C, McGlone, F, Folger, S, Tannan, V, Baranek, G, Pelphrey, KA, et al. Tactile perception in adults with autism: a multidimensional psychophysical study. J Autism Dev Disord. (2008) 38:127–37. doi: 10.1007/s10803-007-0370-8
45. Ide, M, Yaguchi, A, Sano, M, Fukatsu, R, and Wada, M. Higher tactile temporal resolution as a basis of hypersensitivity in individuals with autism spectrum disorder. J Autism Dev Disord. (2019) 49:44–53. doi: 10.1007/s10803-018-3677-8
46. Sinha, P, Kjelgaard, MM, Gandhi, TK, Tsourides, K, Cardinaux, AL, Pantazis, D, et al. Autism as a disorder of prediction. Proc Natl Acad Sci U S A. (2014) 111:15220–5. doi: 10.1073/pnas.1416797111
47. Orekhova, EV, and Stroganova, TA. Arousal and attention re-orienting in autism spectrum disorders: evidence from auditory event-related potentials. Front Hum Neurosci. (2014) 8:34. doi: 10.3389/fnhum.2014.00034
48. Seif, A, Shea, C, Schmid, S, and Stevenson, RA. A systematic review of brainstem contributions to autism spectrum disorder. Front Integr Neurosci. (2021) 15:760116. doi: 10.3389/fnint.2021.760116
49. Henry, M, and Baudry, S. Age-related changes in leg proprioception: implications for postural control. J Neurophysiol. (2019) 122:525–38. doi: 10.1152/jn.00067.2019
50. Budimirovic, DB, Subramanian, M, Johnston, M, Michael, A, Harold,, Fatemi, M, et al. Neurobiology of autism and intellectual disability: fragile X syndrome In: Neurobiology of disease. Oxford, UK: Oxford University Press (2016).
51. Paluszkiewicz, SM, Martin, BS, and Huntsman, MM. Fragile X syndrome: the GABAergic system and circuit dysfunction. Dev Neurosci. (2011) 33:349–64. doi: 10.1159/000329420
52. Razak, KA, Binder, DK, and Ethell, IM. Neural correlates of auditory hypersensitivity in fragile X syndrome. Front Psych. (2021) 12:720752. doi: 10.3389/fpsyt.2021.720752
Keywords: sensory issue, developmental disorder, quality of life, hypersensitivity, autism spectrum disorder
Citation: Wada M, Hayashi K, Seino K, Ishii N, Nawa T and Nishimaki K (2023) Qualitative and quantitative analysis of self-reported sensory issues in individuals with neurodevelopmental disorders. Front. Psychiatry 14:1077542. doi: 10.3389/fpsyt.2023.1077542
Edited by:
Lawrence Fung, Stanford University, United StatesReviewed by:
Dejan Budimirovic, Johns Hopkins University, United StatesMaria Mody, Massachusetts General Hospital and Harvard Medical School, United States
Copyright © 2023 Wada, Hayashi, Seino, Ishii, Nawa and Nishimaki. This is an open-access article distributed under the terms of the Creative Commons Attribution License (CC BY). The use, distribution or reproduction in other forums is permitted, provided the original author(s) and the copyright owner(s) are credited and that the original publication in this journal is cited, in accordance with accepted academic practice. No use, distribution or reproduction is permitted which does not comply with these terms.
*Correspondence: Makoto Wada,✉ d2FkYS1tYWtvdG9AcmVoYWIuZ28uanA=