- 1The First Dongguan Affiliated Hospital, Guangdong Medical University, Dongguan, Guangdong, China
- 2Department of Epidemiology and Medical Statistics, School of Public Health, Guangdong Medical University, Dongguan, Guangdong, China
- 3Department of Maternal, Child and Adolescent Health, School of Public Health, Tongji Medical College, Huazhong University of Science and Technology, Wuhan, Hubei, China
- 4Department of Epidemiology, School of Public Health, Sun Yat-sen University, Guangzhou, Guangdong, China
- 5Key Laboratory of Chronic Disease Prevention and Control and Health Statistics, School of Public Health, Guangdong Medical University, Dongguan, Guangdong, China
Objective: We aimed to evaluate whether depression is associated with increased risk of dietary inflammatory index (DII) or energy-adjusted DII (E-DII) and whether the association is partly explained by insulin resistance (IR).
Methods: Base on the National Health and Nutrition Examination Survey (NHANES) 2005–2018. Univariate analyses of continuous and categorical variables were performed using t-test, ANOVA, and χ2 test, respectively. Logistic regression was used to analyze the relationship between DII or E-DII and depression in three different models. Mediation analysis was used to assess the potential mediation effects of homeostatic model assessment-IR (HOMA-IR).
Results: A total of 70,190 participants were included, and the DII score was higher in the depressed group. DII score was related to all participant characteristics except age (p < 0.05). After being included in covariates (Model 3), participants in the highest quartile of DII score have increased odds of depression (OR: 1.82, 95% CI: 1.28–2.58) compared with those in the first quartile of DII score. And, a significant dose–response relationship was found (p-trend <0.05). No interaction between DII and HOMA-IR was observed in terms of the risk of depression, and HOMA-IR did not find to play a mediating role in the association between DII and depression. Similar results were obtained for the association between E-DII and depression.
Conclusion: Our results suggest that a higher pro-inflammatory diet increases the risk of depression in U.S. adults, while there was no evidence of a multiplicative effect of DII or E-DII and HOMA-IR on disease risk, nor of a mediating effect of HOMA-IR.
1. Introduction
Depression is one of the most common mental illnesses and a leading cause of disability worldwide, which has become an increasingly serious public health problem (1, 2). At present, the exact etiology and mechanism of depression are not fully understood, but it is certain that inflammation plays a key role in the occurrence and development of depression (1). Elevated levels of inflammatory factors such as C-reactive protein (CRP) and interleukin 6 (IL-6) may promote the development of depression (3). At the same time, different dietary patterns may show different inflammatory states (4). Previous studies have shown that unhealthy dietary patterns can increase the blood concentration of inflammatory markers such as CRP, complement component C3 and other cytokines (5). So, anti-inflammatory diet may be used as a potential prevention and intervention for depression (6, 7).
Dietary inflammatory index (DII) is developed to assess the overall inflammatory potential of an individual’s diet in a quantitative manner, avoiding the problems of single nutrient-disease studies that struggle to capture the overall impact of diet on health (8). Although several studies have analyzed the association between dietary inflammation and depression, the results have been inconsistent (9, 10). The differences in the results of these studies may be attributed to potential factors which have not been fully considered, such as insulin resistance (IR). IR is a pathological condition defined as an impaired response to insulin stimulation in peripheral tissues, resulting in elevated peripheral insulin levels (11). Existing evidence shows that DII is positively associated with homeostatic model assessment of insulin resistance (HOMA-IR), in which a more pro-inflammatory diet can increase the probability of IR (8). Furthermore, IR is a known risk factor that is positively associated with depression (12, 13), and it has been considered a mediator of the increased risk of depression observed in various clinical populations (14). Therefore, IR may play an important role between dietary inflammation and depression.
At present, there is currently no effective treatment to cure or prevent depression, and it is crucial to have a comprehensive understanding of the risk factors for depression and to improve prevention and treatment in a targeted manner (15). Inflammation and IR are inextricably linked to depression respectively, and inflammation and insulin resistance are closely related processes. However, the relationship between these three is not yet clear, unraveling the association will help to determine the prevention and treatment strategies of the disease. Therefore, we evaluated the association between dietary inflammatory potential and depression in adult population based on the National Health and Nutrition Examination Survey (NHANES), and analyzed the mediating role of IR in this relationship.
2. Methods
2.1. Participants and study design
We used seven cycles of the NHANES (2005–2018), a population-based, nationwide cross-sectional survey. NHANES recruited a representative sample of civilian, community dwelling members of the US population using a complex, multistage probability design. Details of the study design and data collection have been previously described.1 Among 42,143 adult participants (aged ≥18 years) were included, and we excluded (1) special dietary, abnormal energy intake (daily energy intake ≤500 kcal or ≥5,000 kcal) or missing dietary records (n = 11,061); (2) without depression assessment results (n = 1,952); (3) without fasting plasma glucose (FPG) or insulin value (n = 15,826); (4) without demographics [gender, education level, race, marital status and poverty index ratio (PIR)] or serum cotinine data or physical examination data [height, weight and waist circumference (WC)] or medical history data [diabetes mellitus (DM), cardiovascular diseases (CVD) and hypertension] (n = 2,353). Finally, 10,951 participants were obtained for the statistical analysis (Figure 1).
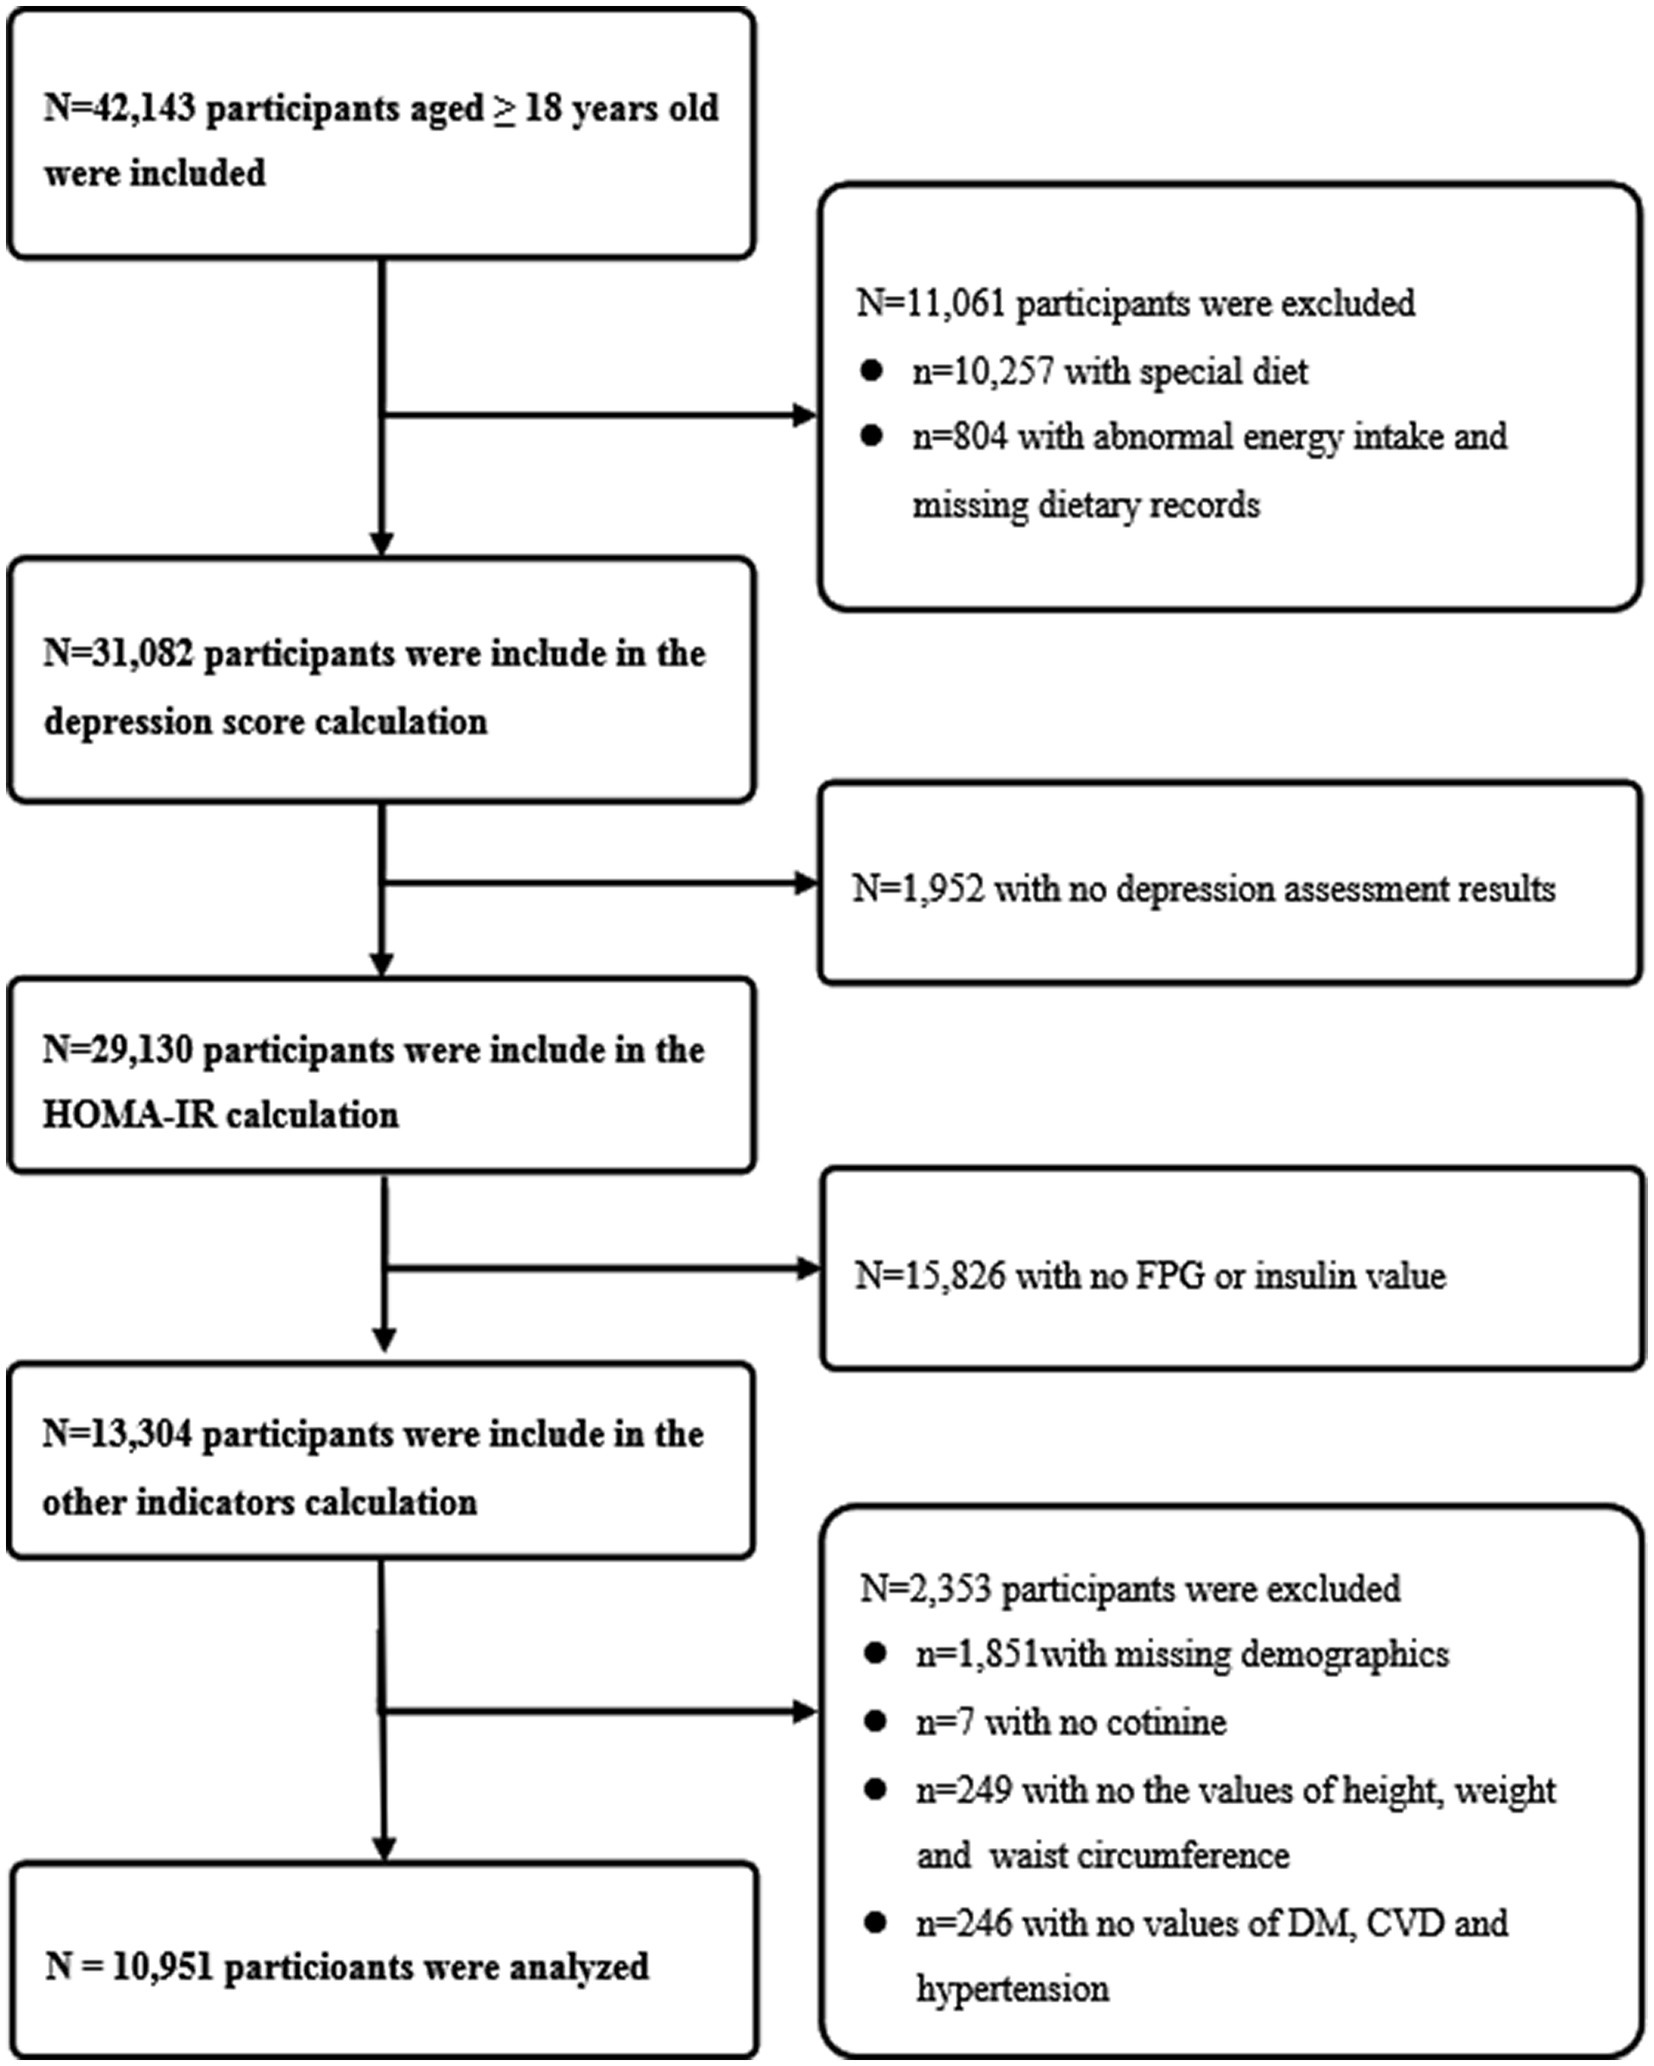
Figure 1. Flow chart of the study design. The NHANES 2005–2018 dataset included a total of 42,143 adult participants (aged ≥18 years). First, 10,257 participants with special dietary, 804 participants with abnormal energy intake (daily energy intake ≤500 kcal or ≥ 5,000 kcal) or missing dietary records were excluded. Second, 1,952 participants without depression assessment results were excluded. Third, 15,826 participants without fasting plasma glucose or insulin value were excluded. Fourth, 1,851 participants without demographics (gender, education level, race, marital status and poverty index ratio), 7 participants without serum cotinine data, 249 participants without physical examination data (height, weight and waist circumference) or 246 participants without medical history data (diabetes mellitus, cardiovascular diseases and hypertension) were excluded. Finally, 10,951 participants were included in the final analysis.
2.2. Dietary inflammatory index
The overall inflammatory potential of individual diets was assessed using the DII. The standard mean and standard deviation of each dietary ingredient or nutrient parameter are available through the world database. For each dietary ingredient or nutrient, create a Z-score by subtracting the individual’s estimated intake from the standard average. It is then divided by the world standard deviation and converted to a distribution centred at 0 and bounded between −1 and +1 (16). Then, this value is multiplied by the corresponding inflammatory effect score, and then all dietary ingredient or nutrient parameters are summed together to obtain the overall DII score for the individual’s diet. DII scores range from negative tail to positive tail, more negative values indicate anti-inflammatory properties and corrected scores indicate proinflammatory properties (17). Considering the effect of total energy intake, the energy-adjusted dietary inflammatory index (E-DII) based on DII was created (18–20). All nutrient data in the dietary records and the global dietary intake database were converted to values per 1,000 kcal by dividing these data by the energy intake from the diet and multiplying by 1,000 (18–2018–20).
Dietary intake was assessed from a single 24-h dietary recall in NHANES. It contains 27 dietary ingredient or nutrient parameters used to calculate the E-DII or DII score, including carbohydrates, protein, fat, cholesterol, (saturated, monounsaturated and polyunsaturated) fatty acids, omega-3 and omega-6 polyunsaturated fatty acids, vitamins (A, B1, B2, B6, B12, C, D, E), niacin, iron, magnesium, zinc, selenium, folic acid, beta carotene, alcohol, fiber and caffeine (21).
2.3. Depression
Depressive symptoms were evaluated using the 9-item Patient Health Questionnaire (PHQ-9), which is a validated 9-item screening instrument that asks about the frequency of depressive symptoms over the past 2 weeks. Each of the nine items consists of four questions, including “not at all,” “several days,” “more than half the day,” and “nearly every day,” and is scored from 0 to 3. Total scores of PHQ-9 range from 0 to 27. The higher the score, the more severe the depressive symptoms. The PHQ-9 scores of 10 or higher was used as the cut-off point to identify depression which had a sensitivity of 88% and a specificity of 88% for the diagnosis of major depression (22).
2.4. Homeostatic model assessment-insulin resistance
The HOMA-IR was used to assess the level of IR in individuals. HOMA-IR is the product of fasting insulin (μU/mL) and fasting blood glucose (mmol/L) divided by 22.5 (23). The value of HOMA-IR of normal individuals is 1, and the higher the value of HOMA-IR is, the stronger the resistance of individuals to insulin is (23).
2.5. Study covariates
The included covariates included gender (female or male), education level (less than high school, completed high school and more than high school), race (non-Hispanic white, non-Hispanic black, Mexican American, other Hispanic and other), marital status (never married, married, separated and divorced, widowed), age, PIR, CVD, DM, hypertension, body mass index (BMI), WC, energy intake, alcohol use, and serum cotinine.
2.6. Statistical analysis
The recommended weighting method was used to analyze NHANES data. Sample characteristics were reported as weighted mean ± standard deviation for normally distributed continuous variables, weighted medians (interquartile ranges) for nonnormally distributed continuous variables, and weighted proportions for categorical variables. Differences in characteristics between depressed and non- depressed groups were compared using Student’s t-test (continuous variables with normal distribution), Wilcoxon rank sum test (continuous variables with non-normal distribution) or χ2 test (categorical variables). One-way ANOVA tests were utilized to evaluate between-group differences of distributions across quartiles of E-DII or DII. Three statistical models were fitted and a logistic regression was used to estimate odds ratio (OR) and 95% confidence interval (CI) of depression in relation to quartiles of E-DII. Model 1 did not adjust any covariates; Model 2 adjusted for gender, education level, race, marital status, age, PIR, CVD, DM, hypertension, BMI, WC, energy intake, alcohol use and serum cotinine. Model 3 is adjusted for all covariates included in Model 2 as well as HOMA-IR. In order to assess the dose–response relationship between E-DII or DII and depression in all three models, using a restricted cubic spline model with three knots located at the 25th, 50th and 75th percentiles of E-DII levels.
Stratified analysis of HOMA-IR (quartile) was performed under Model 1 and Model 2 to assess the potential regulatory role of IR, and analyzed the effect of the interaction between E-DII or DII and HOMA-IR on depression. The mediation model and the outcome model used linear regression and logistic regression, respectively, to assess the direct and indirect effects of HOMA-IR between E-DII or DII and depression. In addition, we performed a sensitivity analysis. The interval of E-DII or DII was re-divided in tertiles, excluding the influence of different division methods of E-DII or DII interval on the results. All statistical analysis was performed by R 4.1.2 (R Foundation for Statistical Computing, Vienna, Austria). Two-sided p < 0.05 was considered statistically significant.
3. Results
3.1. Characteristics of participants
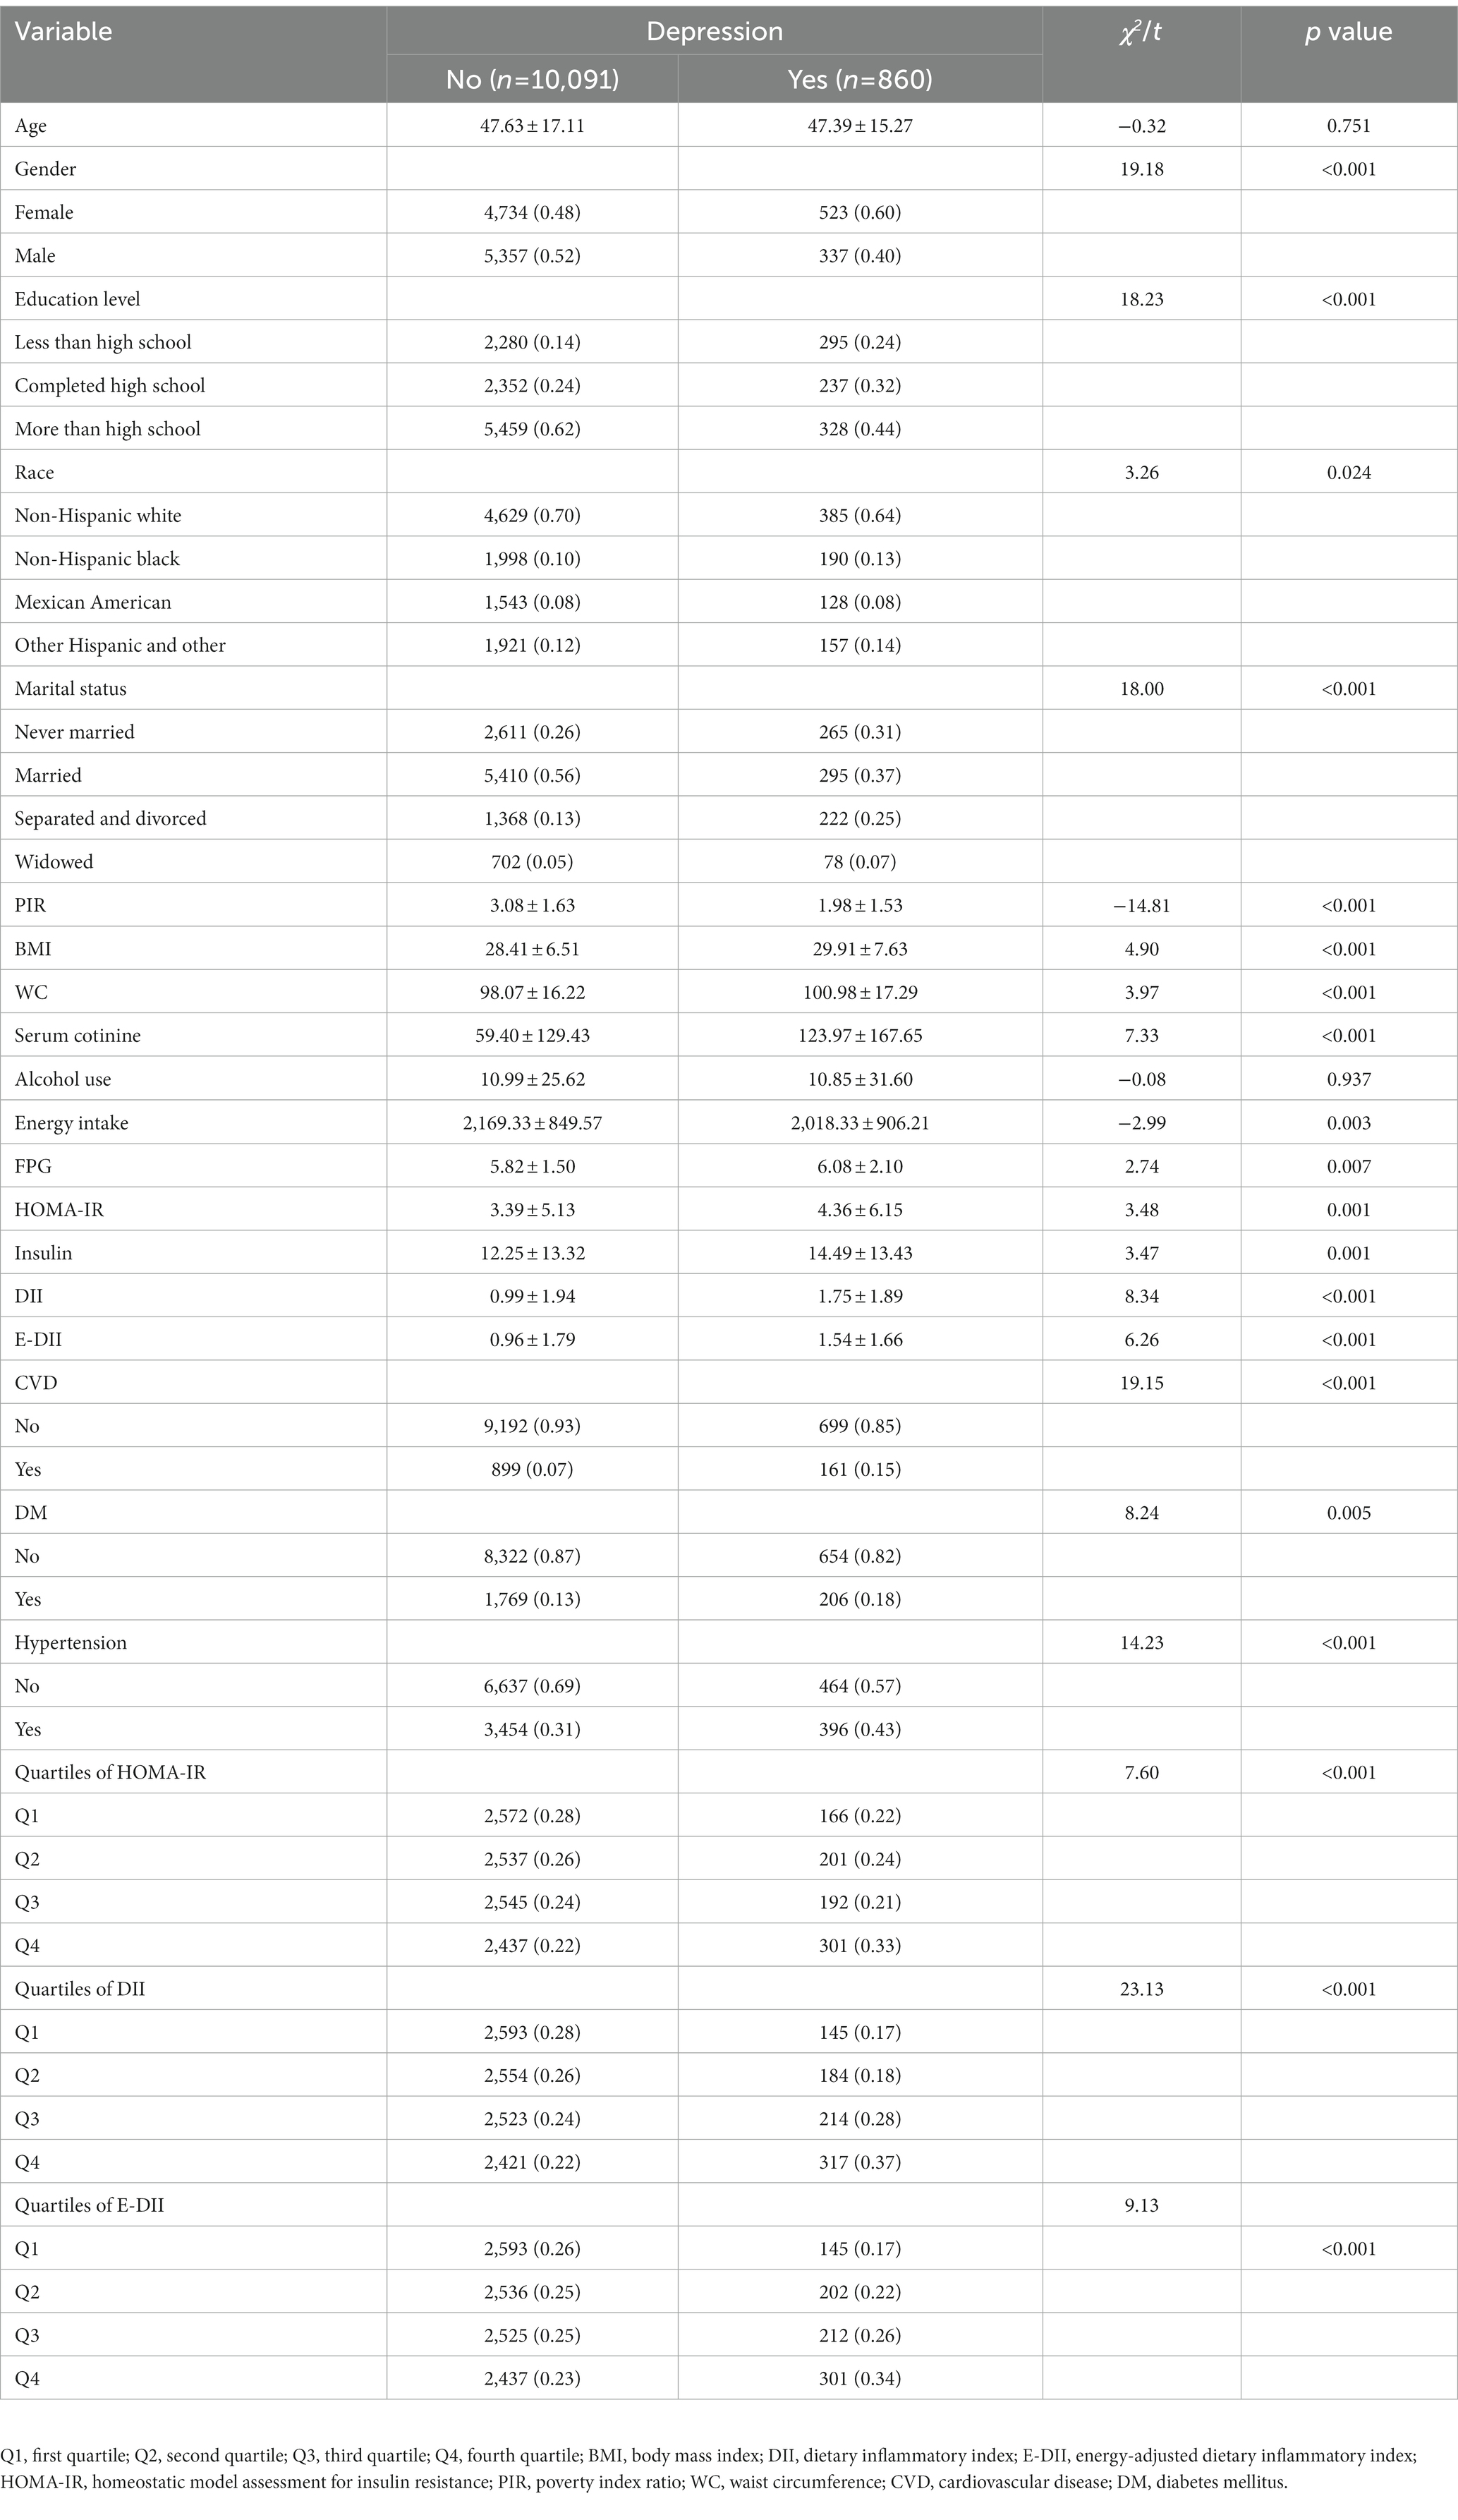
10,091 participants were included in the non-depressed group, and the remaining 860 participants were included in the depressed group. Compared with non-depressed, depressed participants had higher proportions of female, education level less than high school, non-Hispanic black, separated and divorced and serum cotinine (p < 0.05). Meanwhile, depressed participants had higher levels of physical examination indexes (BMI and WC), sugar metabolism measurements (FPG, insulin and HOMA-IR), and the basic diseases (CVD, DM and hypertension) (p < 0.05). Furthermore, the participants with depression had a higher level of DII or E-DII. The general characteristics of the study population were shown in Table 1.
3.2. Characteristics of the participants according to the quartiles of DII or E-DII
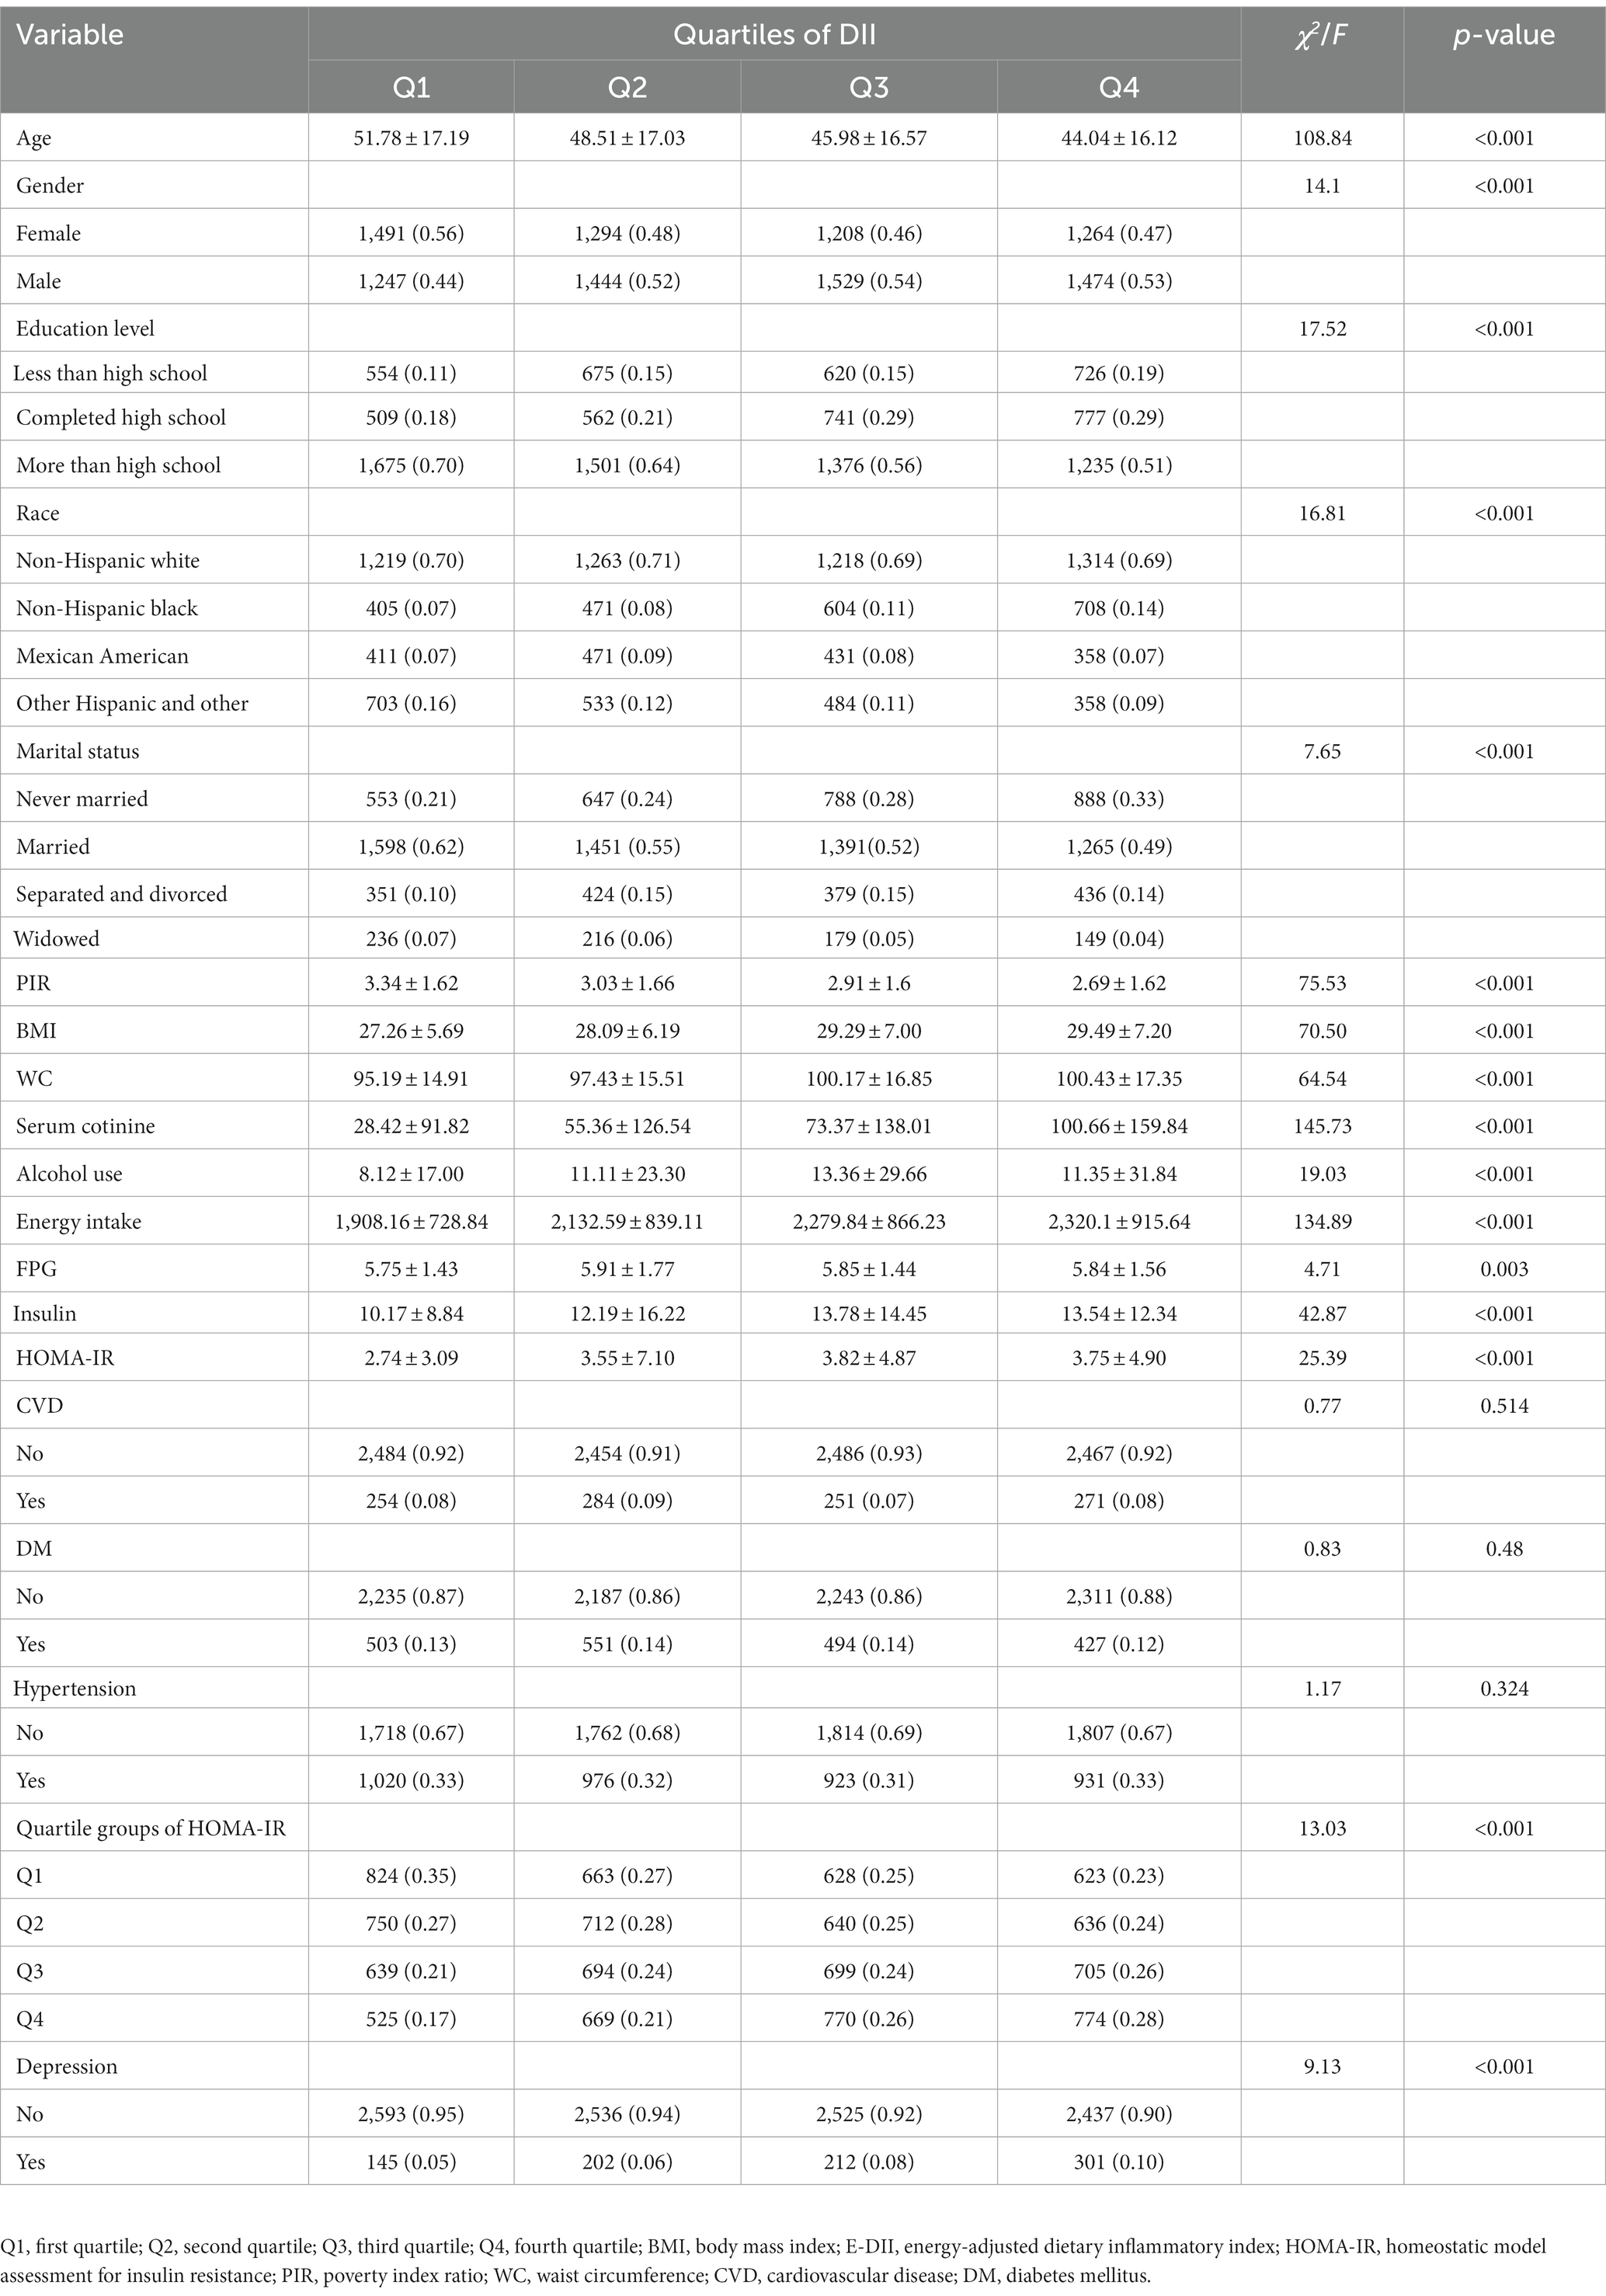
The characteristics of participants by DII quartiles were shown in Table 2. The higher the DII scores, the higher the BMI, waist circumference, serum cotinine, energy intake, FPG, insulin and HOMA-IR (p < 0.05). In contrast, age and PIR decreased gradually (p < 0.05). Simultaneously, compared with first quartile, those participants who in the second quartile to the fourth quartile of DII group had higher proportions of male, non-Hispanic black, never married, and the risk of depression (p < 0.05). However, according to the E-DII quartiles, the higher E-DII scores, the higher proportions of CVD, DM, Hypertension were (p < 0.05), and age was no longer significantly different (p > 0.05). The remaining characteristics of the participants according to the quartiles of E-DII were similar to those of DII (Supplementary Table S1).
3.3. Association between DII or E-DII and depression
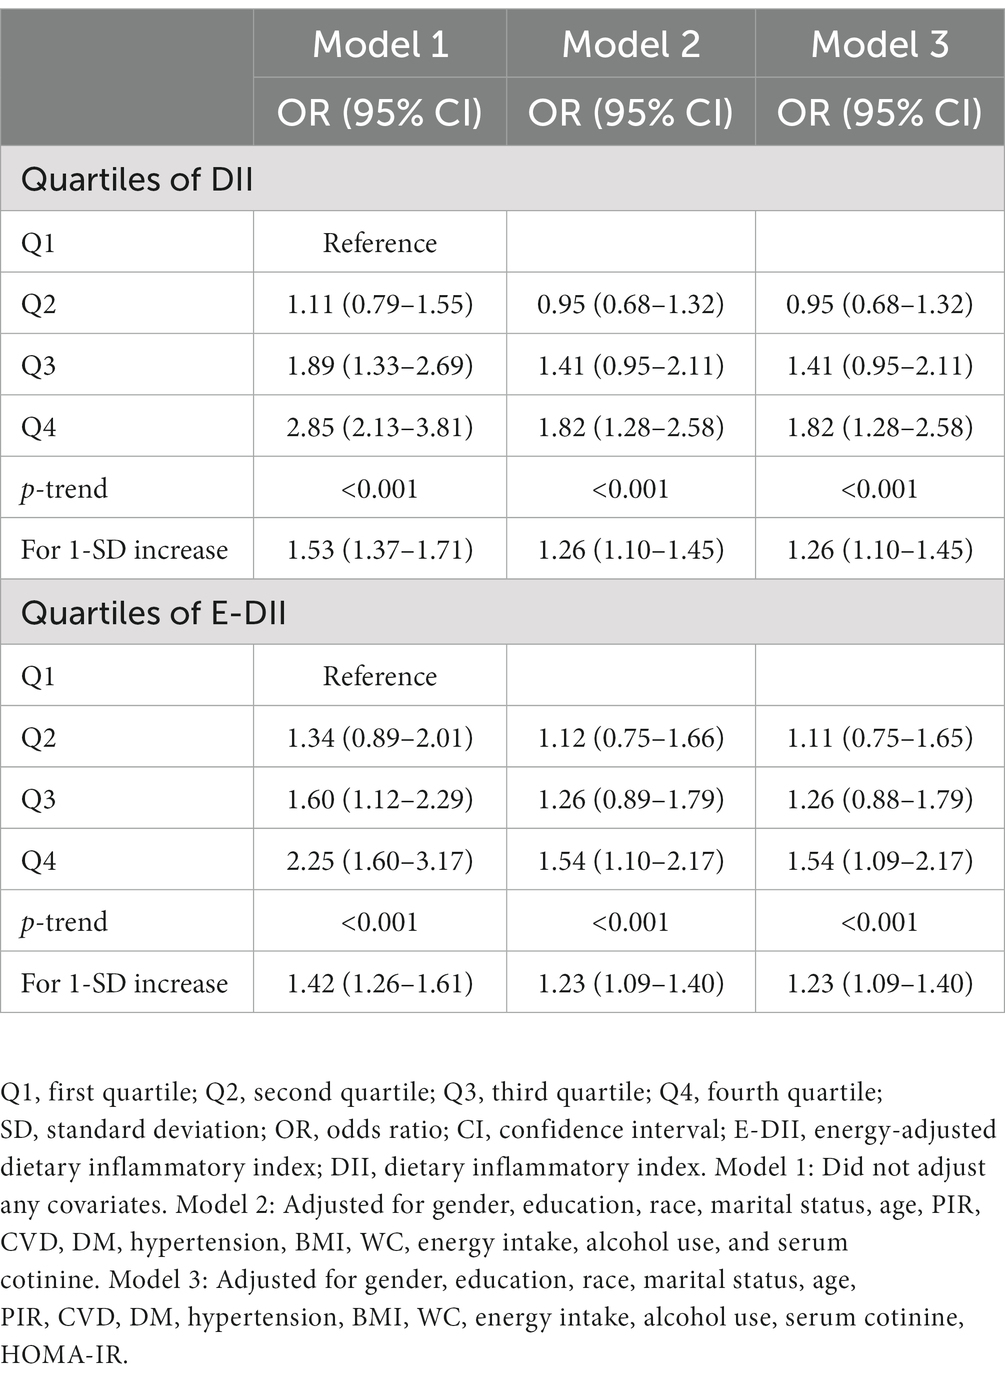
As shown in Table 3, DII was positively correlated with the risk of depression in the third quartile [OR: 1.89 (95% CI: 1.33–2.69)] to the fourth quartile [OR: 2.85 (95% CI: 2.13–3.81)] compared with the first quartile in Model 1. DII was also positively correlated with the risk of depression in the fourth quartile compared with the first quartile in Model 2 and Model 3 [OR:1.82 (95% CI: 1.28–2.58)]. Moreover, a significant dose–response relationship was found in all three models (p-trend <0.001). An analysis with DII to increase 1-SD yielded similar results in Model 1 [OR: 1.53 (95% CI: 1.37–1.71)], Model 2 and Model 3 [OR: 1.26 (95% CI: 1.10–1.45)]. Meanwhile, the association between E-DII and depression had the same characteristics. As shown in Figure 2, the spline variable confirmed that DII in all three models and E-DII in Model 1 were significant non-linearly associated with the risk of depression (Pnonlinear < 0.05). While there was a linear dose–response relationship between E-DII score and the risk of depression in Model 2 (Pnonlinear = 0.069) and Model 3 (Pnonlinear = 0.074).
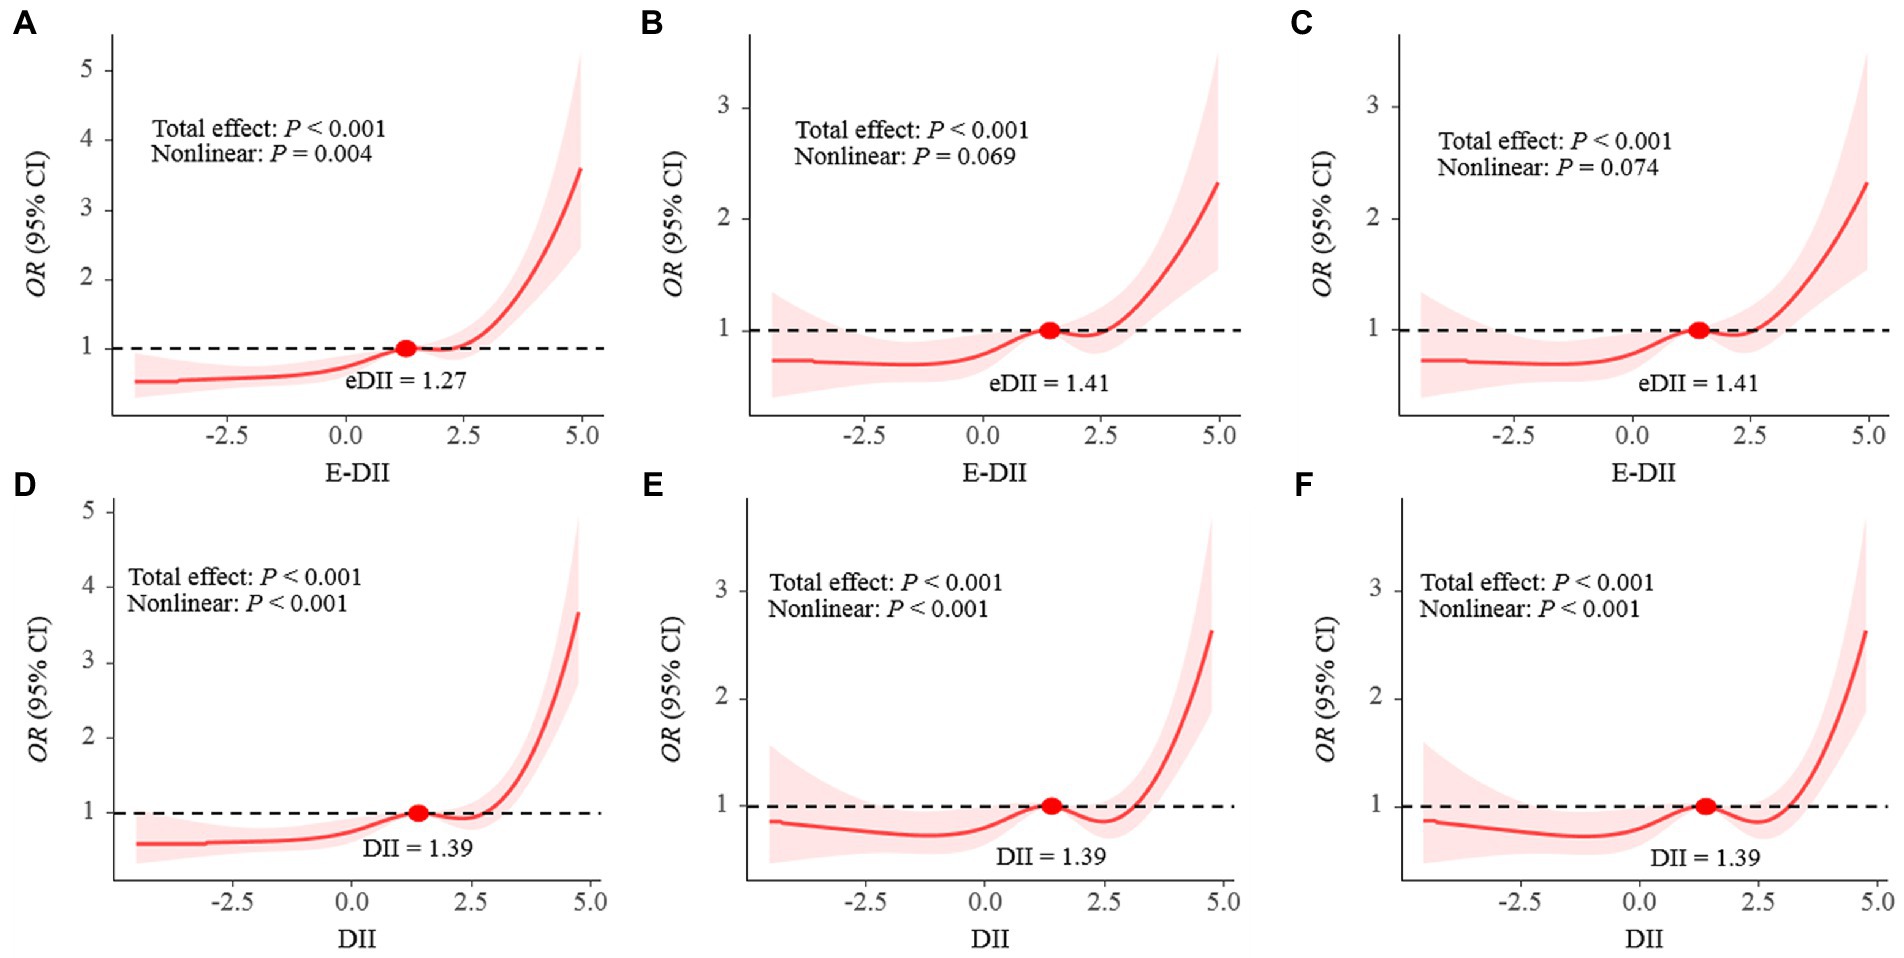
Figure 2. The dose–response relationships of E-DII (A–C) and DII (D–F) with depression in all participants. Results were from restricted cubic spline models; A and D did not adjust any covariates; B and E were adjusted for gender, education, race, marital status, age, PIR, CVD, DM, hypertension, BMI, WC, energy intake, alcohol use, serum cotinine; C and F was adjusted for gender, education, race, marital status, age, PIR, CVD, DM, hypertension, BMI, WC, energy intake, alcohol use, serum cotinine, HOMA-IR.
3.4. DII or E-DII and depression risk stratified by HOMA-IR category
As shown in Table 4, when stratified by HOMA-IR category, the risk of DII and depression was mainly reflected in fourth quartile of DII except people with 2.42 ≤HOMA-IR <4.20 in Model 1 [the ORs (95% CIs) were 5.07 (2.67–9.62), 4.04 (2.21–7.38), 1.67 (1.01–2.77), respectively]. And in Model 2, the risk of DII and depression was mainly reflected in the fourth quartile of DII in the population with HOMA-IR <2.42 [the ORs (95% CIs) were 2.48 (1.15–5.36), 2.04 (1.03–4.02), respectively]. The risk of E-DII and depression had the same characteristics. Besides, there was no interaction between DII or E-DII and depression on depression risk (Pinteraction > 0.05).
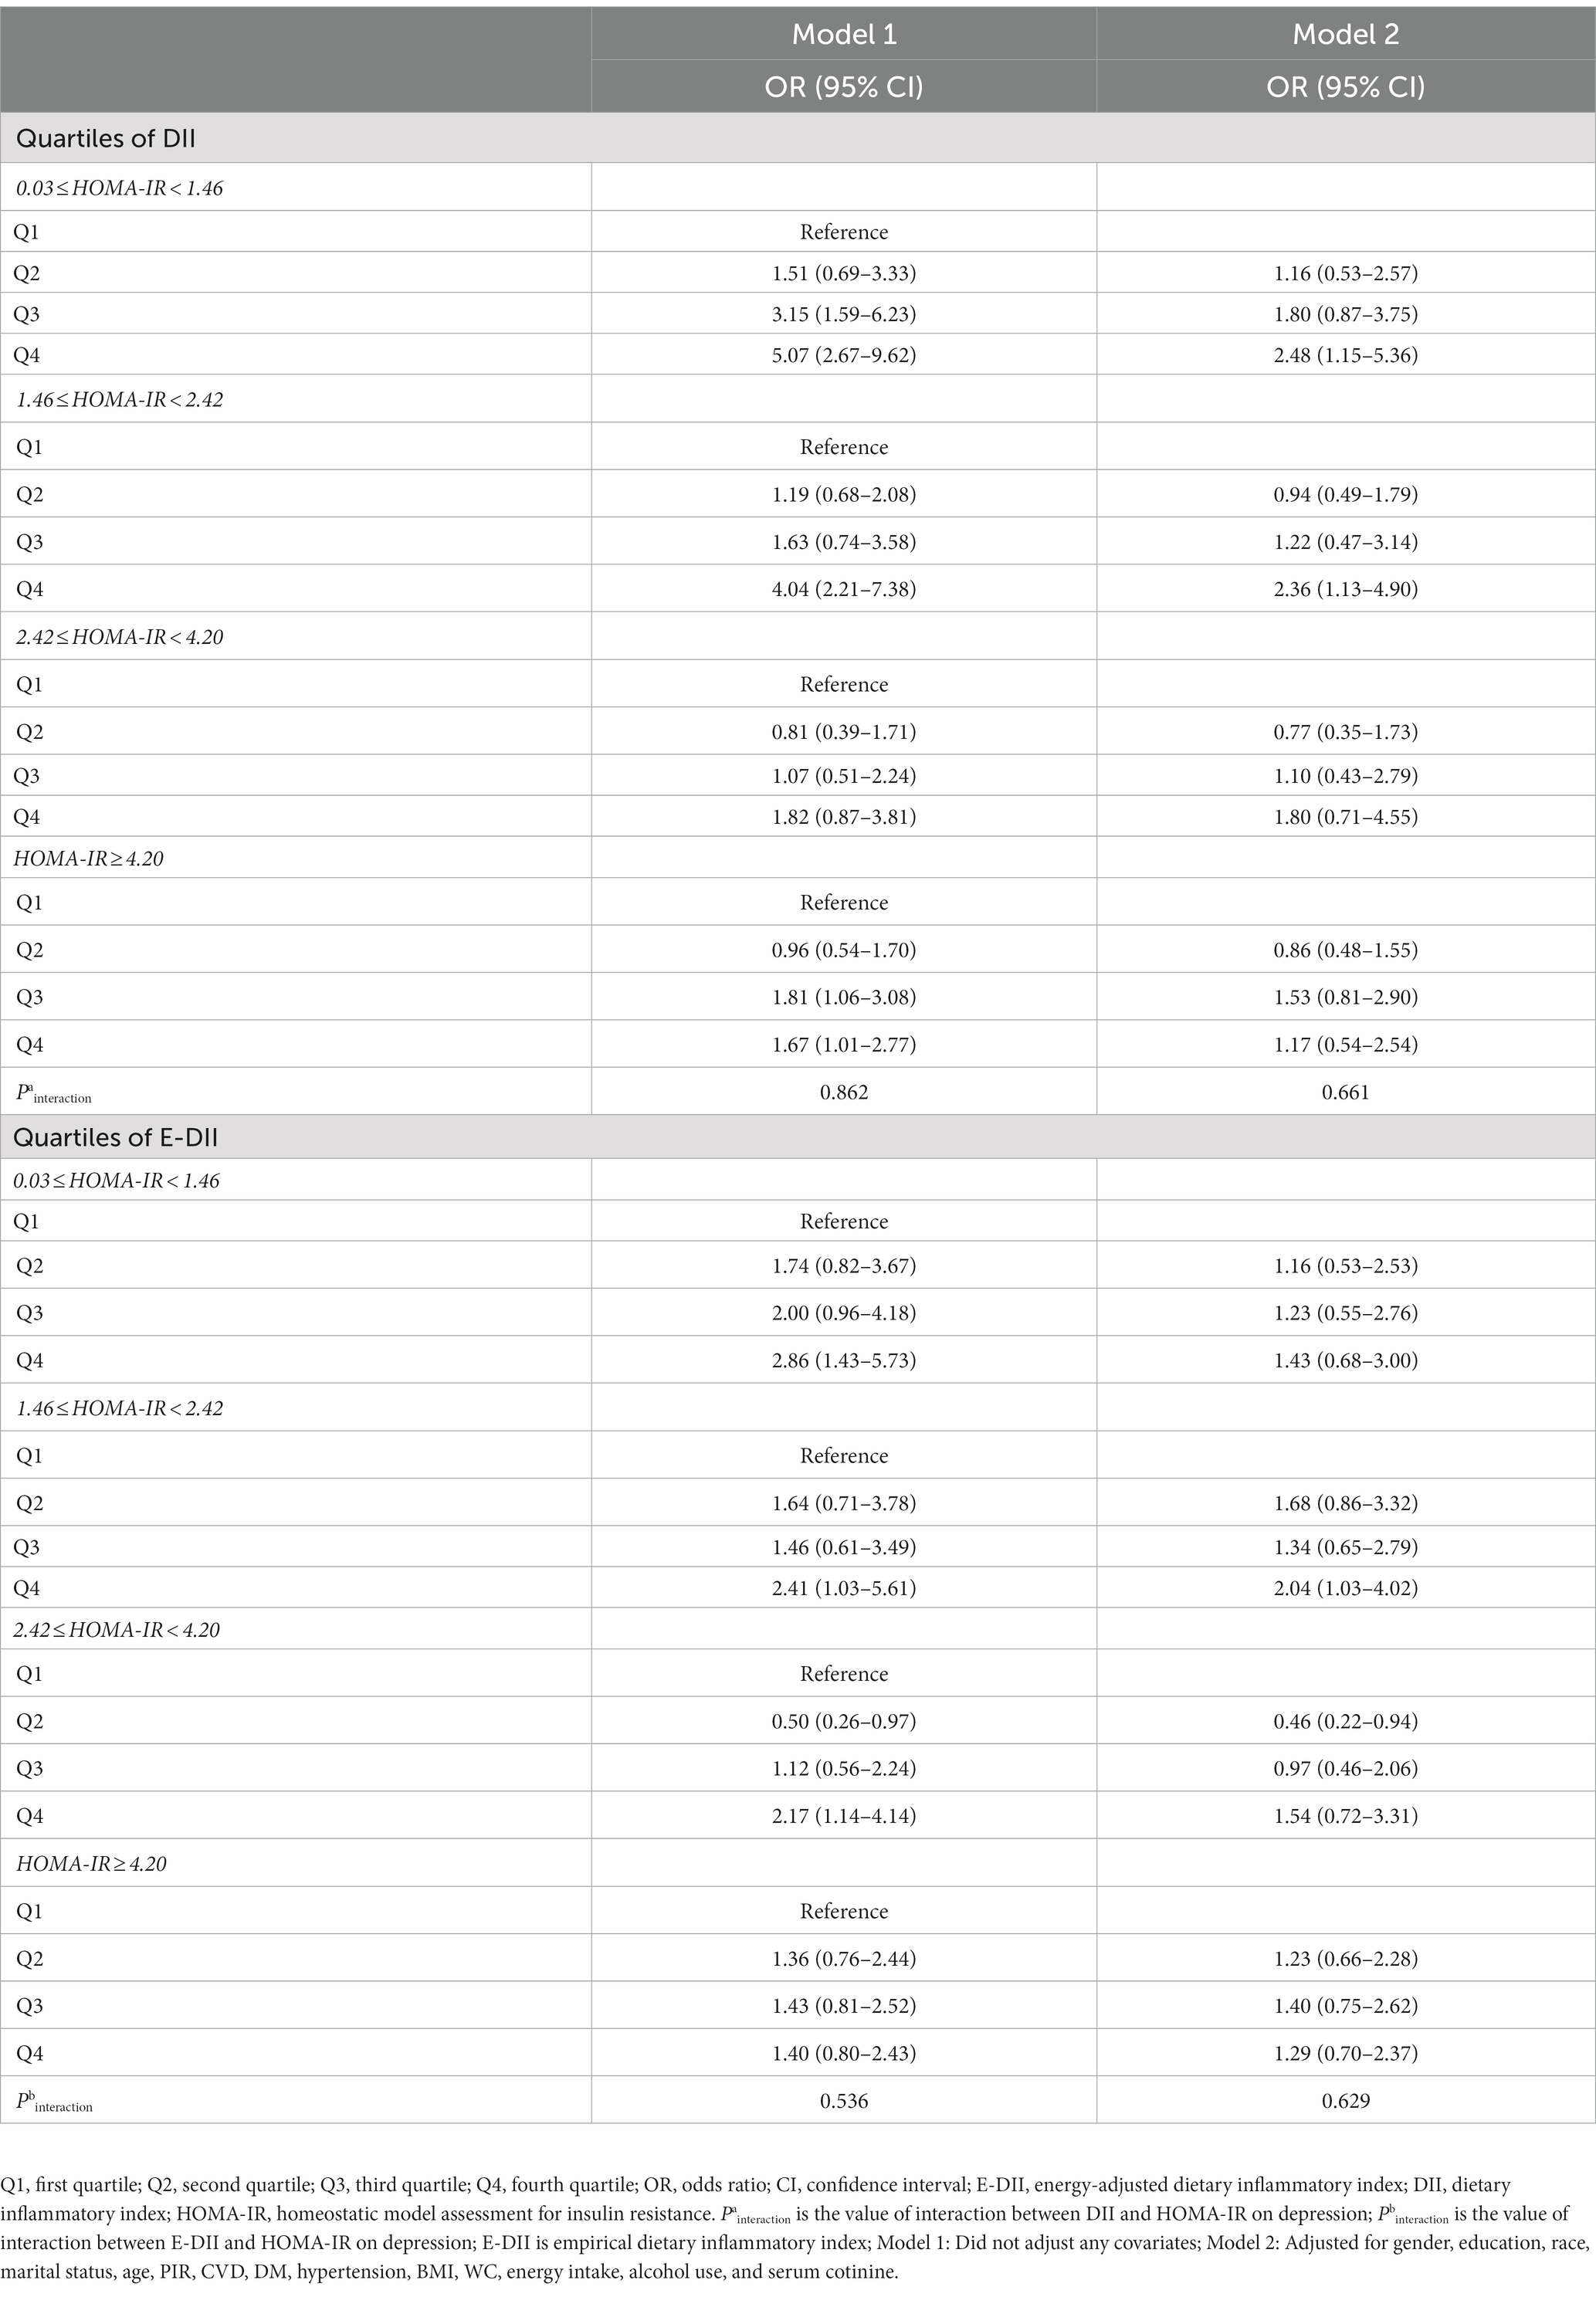
Table 4. Risk of depression by quartile of DII or E-DII stratified according to quartiles of HOMA-IR.
3.5. Mediating role of HOMA-IR
As shown in Figure 3, increased E-DII was associated with an increased risk of depression, and the effect (2.35%) can be explained by a significant indirect effect of HOMA-IR (OR: 2.42 × 10⁻⁴, 95% CI: 1.26 × 10⁻⁴ − 4.80 × 10⁻⁴) (Figure 3A). After adjusting for covariates, the indirect effect was not statistically significant (OR: 2.67 × 10⁻⁵, 95% CI: −6.58 × 10⁻⁶ − 8.78 × 10⁻⁵) (Figure 3B). The data were analyzed using the DII quartiles, and the same result was reached (Figures 3C,D).
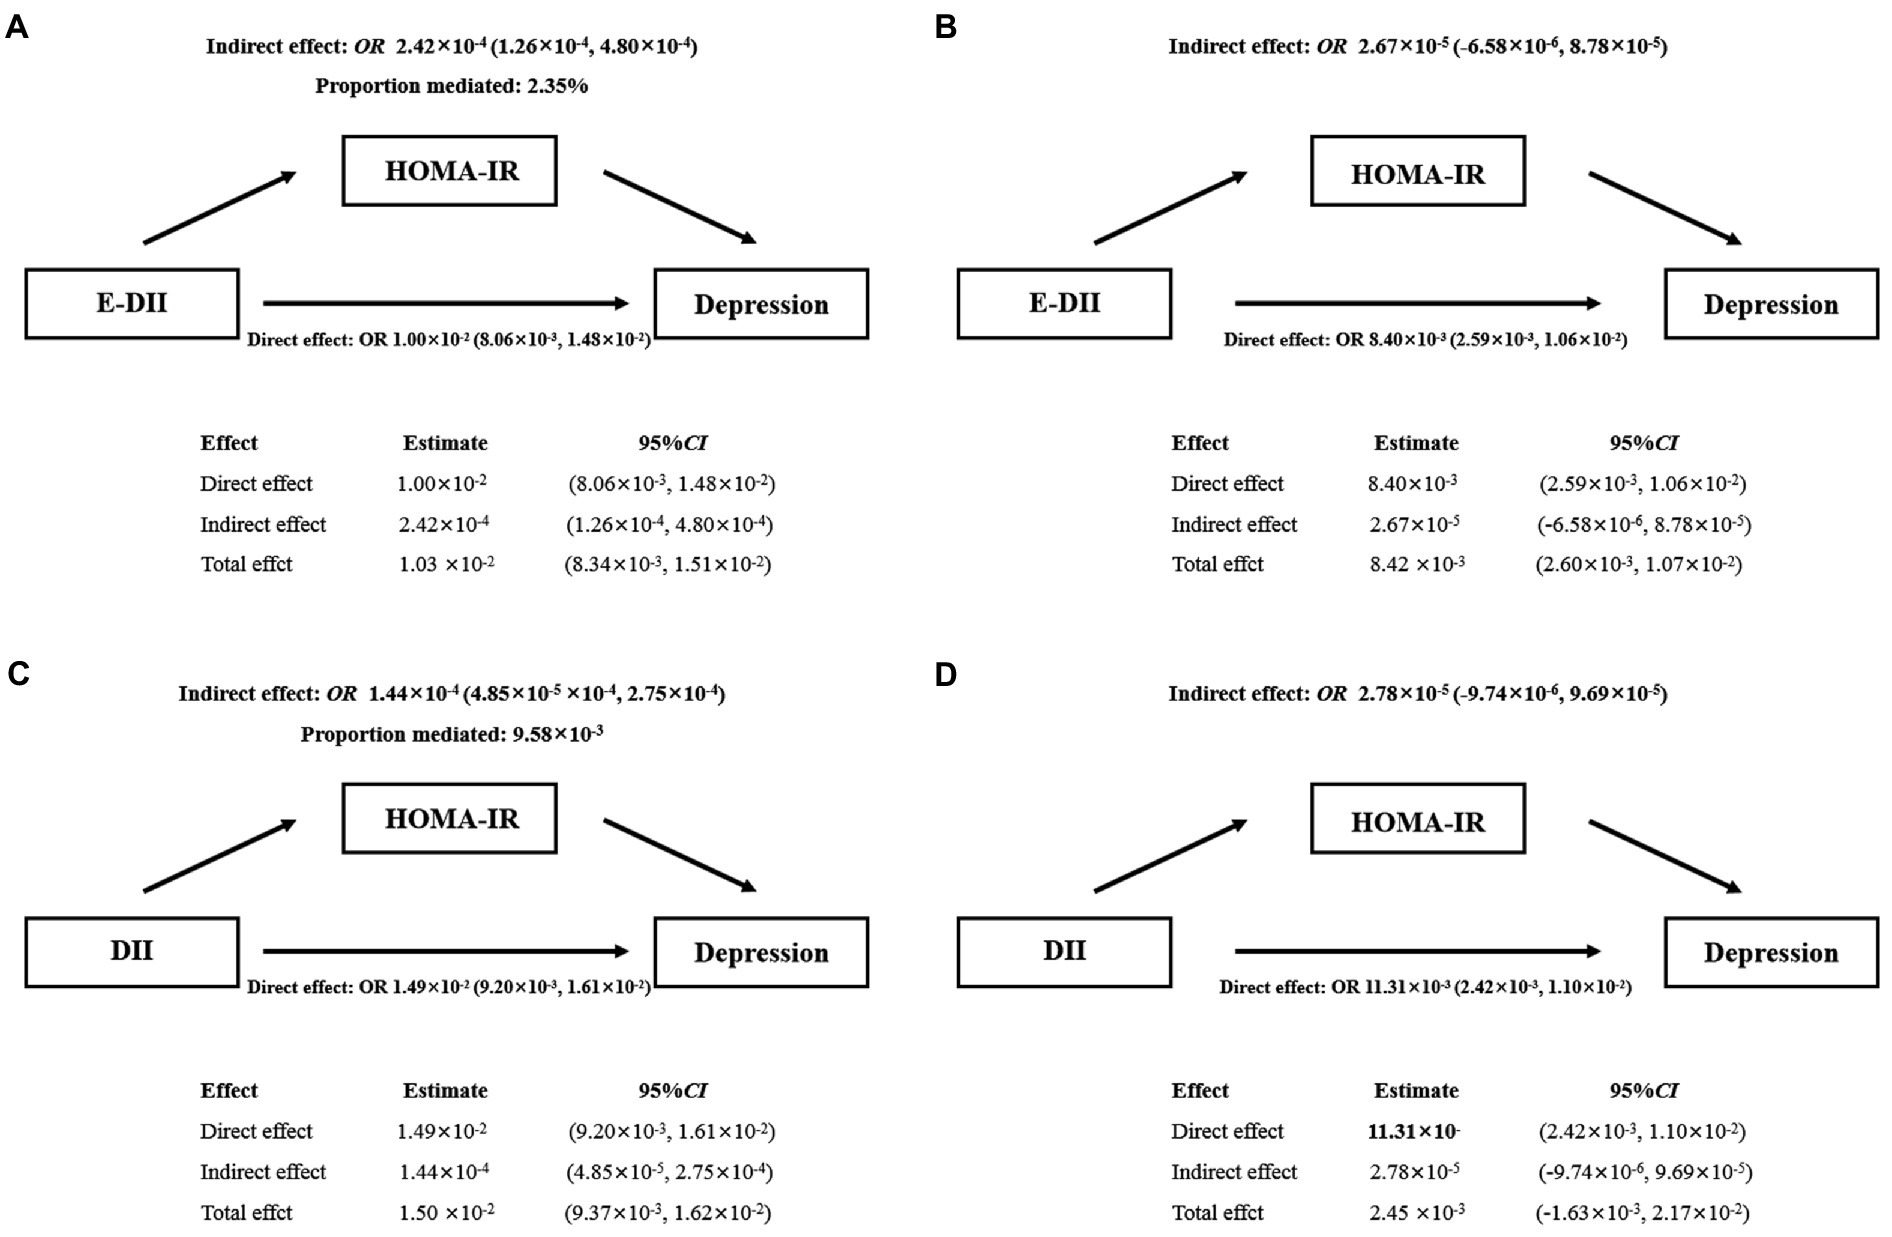
Figure 3. Mediating effect of HOMA-IR between E-DII (A,B) or DII (C,D) and depression. The 95% CI of these estimates was computed using the bootstrap method (1,000 samples); A and C did not adjust any covariates; B and D were adjusted for gender, education, race, marital status, age, PIR, CVD, DM, hypertension, BMI, WC, energy intake, alcohol use, serum cotinine.
3.6. Mediating role of HOMA-IR
According to the DII tertiles, the ORs (95% CIs) for the depression were 1.42 (1.00–2.00) and 1.61 (1.17–2.21) for the second and third tertile in Model 3 (p-trend <0.05). And, E-DII was positively correlated with the risk of depression in the third tertile compared with the first tertile [OR:1.45 (95% CI:1.13–1.86)] (Supplementary Table S2). The risk of DII and depression was found in the second and third tertile of DII except people with HOMA-IR ≥ 4.20 in Model 1. In addition, the ORs and 95% CIs for the risk of DII and depression was mainly reflected in third tertile of DII with 0.03 ≤ HOMA-IR < 1.46 and 1.46 ≤ HOMA-IR < 2.42 in Model 2 were 1.90 (1.04–3.49) and 1.91 (1.03–3.55), respectively. Meanwhile, the risk of E-DII and depression was mainly reflected in third tertile of E-DII with 0.03 ≤ HOMA-IR < 1.46 and 2.42 ≤ HOMA-IR < 4.20 in Model 1 [the ORs (95% CIs) were 2.50 (1.44–4.35), 2.44 (1.34–4.46), respectively] (Supplementary Table S3).
4. Discussion
In this large cross-sectional study to investigate how DII or E-DII and IR contribute to depression risk, we found that DII or E-DII was an independent risk factor for depression, and there was a positive non-linear relationship between the DII and the risk of depression. While, there was a linear dose–response relationship between E-DII score and the risk of depression in Model 2 and Model 3. In addition, IR-related indicators (insulin level, FPG and HOMA-IR) were higher in depressed patients, and these indicators gradually increased as the score of E-DII or DII increased. In models not adjusted for covariates, HOMA-IR had a weak mediating effect on E-DII or the association between DII and depression. After adjusting the model, the mediating effect of HOMA-IR between E-DII or DII and depression disappeared. Moreover, there was no evidence of significant interactions on the multiplicative scale between E-DII or DII and HOMA-IR on the risk of depression.
Our results showed that both DII and E-DII scored higher in the depressed group compared to the non-depressed group (Table 1). The higher the DII or E-DII score, the higher the risk of depression (Table 3). This was consistent with some studies. Both in the North West Adelaide Health Study cohort (10) and Chen et al. (24) study found that patients with depression had a higher dietary inflammatory potential compared with the general population control group, and those with higher DII or E-DII scores had higher odds of depression. However, the sample sizes of their researches were relatively small, and the representativeness of the sample still needed to be further improved. In addition, their studies only analyzed the association between DII or E-DII and depression alone, and only considered one division method (using quartiles or tertiles) for DII or E-DII. In this way, the false positive or false negative results caused by the interference of the division interval of DII or E-DII could not be ruled out, so the robustness of the data results still needed to be further improved. In contrast, our study not only used data from a large, nationally representative population sample, but also analyzed the correlation between DII and E-DII and depression, and the sensitivity analysis was made. This greatly improves the representativeness of the sample and the robustness of the data results.
But it was also inconsistent with the results of some studies. The DII was not associated with incident depressive symptoms in the Suppl émentation en Vitamines et Min éraux Antioxydants (SU.VI.MAX) cohort (25). Meanwhile, in the Korea National Health and Nutrition Examination Survey (KNHANES) 2014–2017, no association between E-DII and depression/depressive symptoms was found among adults in other parts of South Korea except the Capital area, Chungcheong-do and Jeju-do (26). These are somewhat different from our findings, and we speculate that the possible reasons are as follows. First, it may be affected by the different ethnicity, dietary patterns and living area of the study population. Our study subjects are from the United States, while the subjects included in SU.VI.MAX cohort are from France, and the KNHANES is included in the South Korean population. Second, affected by the age difference of the study population. Adults (≥18 years) were included in our study, while 35–60 years were included in SU.VI.MAX cohort and aged ≥19 years were included in KNHANES.
In our study, FBG, insulin levels and HOMA-IR were higher in depressed patients compared with controls (Table 1), and with the increase of DII or E-DII, FBG, insulin levels and HOMA-IR also gradually increased (Table 2). A large meta-analysis found increased insulin levels and HOMA-IR in patients with depression (12), which was consistent with our findings. Some of studies have confirmed the correlation between IR and depression. Kan et al. found that, a small but significant cross-sectional association was observed between depression and IR (27). Studies from a large United Kingdom birth cohort showed that IR was positively associated with depression (28). According to a cross-sectional study in Korea, after adjusting covariates, increased IR was weakly associated with greater depressive symptoms (adjusted OR = 1.01, 95% CI = 1.0001–1.03) (29). So far, the relationship between IR and DII or E-DII has not yet reached a consensus. In an Iranian adult cohort, no significant associations were observed between DII and risk of FPG (p = 0.07), fasting insulin (p = 0.07) or HOMA-IR (p = 0.08) (30). However, more research supported that IR or IR-related indicators were closely related to DII or E-DII (8, 30, 31). Our study also confirmed this point of view, providing new supporting evidence for the association between IR and dietary inflammation. Existing studies have shown that the key metabolic changes caused by inflammation are an important factor leading to insulin receptor dysfunction, which further has a major impact on the metabolism of the brain and promotes the occurrence and development of mental diseases including depression (32). However, our results showed that the association of DII or E-DII with depression was significant regardless of adjustment for HOMA-IR (Table 3), suggesting that the association of DII or E-DII with depression may be independent of IR. Additionally, in the stratified model, there was only an increased risk of depression in the Q3 or Q4 range of DII or E-DII in some intervals of HOMA-IR, and no interaction between DII or E-DII and HOMA-IR was found to reach statistical significance (Table 4). This means that HOMA-IR and DII or E-DII may have independent effects on depression. If there are interactions between HOMA-IR and E-DII or DII, they are likely to be small, undetectable by conventional methods, or influenced by other unknown factors. In the mediation analysis, HOMA-IR only played a weak mediating effect in the unadjusted model (Figures 3A,C), and the mediating effect did not exist after multivariate adjustment (Figures 3B,D). This suggests that the effect of HOMA-IR on the association between DII or E-DII and depression may be influenced by other variables. Future studies could select potential mediators from the adjusted covariates and investigate their role in the association of DII or E-DII with depression.
The strengths of this study include the use of large sample data with national representation, and the simultaneous exploration of the association between DII or E-DII and depression, as well as the role of IR in it, through multiple analytical methods. Furthermore, we found consistency in sensitivity analyses. Our study elucidated that DII or E-DII was independently associated with depression risk, that IR and DII or E-DII had no synergistic effect on disease risk, and that IR did not mediate this association, which had important clinical and public health implications. Since diet is a relatively easy and modifiable factor, it may be possible to prevent depression and reduce depressive symptoms by limiting pro-inflammatory diets or encouraging anti-inflammatory diets. However, we have to admit that our study still has some limitations. First, the E-DII or DII comprised 45 food parameters, but only 27 food parameters were included in the calculations and the estimates of the potential of dietary inflammation might have deviations. But this is common because a complete assessment of all food intakes is difficult and DII scores can be calculated using >20 items from the list of required food parameters (33). Second, the PHQ-9 parental questionnaire was used to assess depressive symptoms, which was only a screening tool, not an exact diagnostic tool. However, its sensitivity and specificity are high, and the misclassification may be relatively few (34). Third, the results of the present study were based on American adults, which the true state of other populations might not be accurately reflected. Fourthly, this study was a cross-sectional study, which leaded to a lack of evidence of the cause and effect. Further prospective field intervention studies should be conducted in the future to provide stronger evidence for the relationship between DII or E-DII and depression.
In conclusion, increased E-DII or DII promoted elevated levels of indicators related to IR and were independently associated with the risk of depression in U.S. adults. There was no evidence of a multiplicative effect of E-DII or of DII and HOMA-IR on disease risk, nor of a mediating effect of HOMA-IR.
Data availability statement
The original contributions presented in the study are included in the article/Supplementary material, further inquiries can be directed to the corresponding author/s.
Ethics statement
The NHANES protocols were approved by the ethics review board and included the written informed consent of all participants, following the principles of the Declaration of Helsinki.
Author contributions
Study conception and design by WH, JH, and YD. Data screening, sorting and analysis were performed by WH, LL, JH, RH, DK, and HY. The first draft of the manuscript was written by LL. Critical revision of the manuscript for important intellectual content by WH, JH, and HY. Study supervision by HY and YD. All authors contributed to the article and approved the submitted version.
Funding
This work was supported by the Discipline Construction Project of Guangdong Medical University (4SG21276P); The Basic and Applied Basic Research Foundation of Guangdong Province Regional Joint Fund Project (The Key Project) (2020B1515120021); The Natural Science Foundation of Guangdong Basic and Applied Basic Research Fund (2022A1515012407) and Guangdong Province Traditional Chinese Medicine Science and Technology Research Project (20221209 and 20211215).
Acknowledgments
The authors thank all of the people who participated in this study.
Conflict of interest
The authors declare that the research was conducted in the absence of any commercial or financial relationships that could be construed as a potential conflict of interest.
Publisher’s note
All claims expressed in this article are solely those of the authors and do not necessarily represent those of their affiliated organizations, or those of the publisher, the editors and the reviewers. Any product that may be evaluated in this article, or claim that may be made by its manufacturer, is not guaranteed or endorsed by the publisher.
Supplementary material
The Supplementary material for this article can be found online at: https://www.frontiersin.org/articles/10.3389/fpsyt.2023.1131802/full#supplementary-material
Footnotes
References
1. Ma, Y, Li, R, Zhan, W, Huang, X, Zhang, Z, Lv, S, et al. Role of BMI in the relationship between dietary inflammatory index and depression: an intermediary analysis. Front Med (Lausanne). (2021) 8:748788. doi: 10.3389/fmed.2021.748788
2. Osimo, EF, Pillinger, T, Rodriguez, IM, Khandaker, GM, Pariante, CM, and Howes, OD. Inflammatory markers in depression: a meta-analysis of mean differences and variability in 5,166 patients and 5,083 controls. Brain Behav Immun. (2020) 87:901–9. doi: 10.1016/j.bbi.2020.02.010
3. Mac Giollabhui, N, Ng, TH, Ellman, LM, and Alloy, LB. The longitudinal associations of inflammatory biomarkers and depression revisited: systematic review, meta-analysis, and meta-regression. Mol Psychiatry. (2021) 26:3302–14. doi: 10.1038/s41380-020-00867-4
4. Lassale, C, Batty, GD, Baghdadli, A, Jacka, F, Sánchez-Villegas, A, Kivimäki, M, et al. Healthy dietary indices and risk of depressive outcomes: a systematic review and meta-analysis of observational studies. Mol Psychiatry. (2019) 24:965–86. doi: 10.1038/s41380-018-0237-8
5. Phillips, CM, Shivappa, N, Hebert, JR, and Perry, IJ. Dietary inflammatory index and biomarkers of lipoprotein metabolism, inflammation and glucose homeostasis in adults. Nutrients. (2018) 10:1033. doi: 10.3390/nu10081033
6. Martinez-Gonzalez, MA, and Sanchez-Villegas, A. Food patterns and the prevention of depression. Proc Nutr Soc. (2016) 75:139–46. doi: 10.1017/S0029665116000045
7. Tolkien, K, Bradburn, S, and Murgatroyd, C. An anti-inflammatory diet as a potential intervention for depressive disorders: a systematic review and meta-analysis. Clin Nutr. (2019) 38:2045–52. doi: 10.1016/j.clnu.2018.11.007
8. Shu, Y, Wu, X, Wang, J, Ma, X, Li, H, and Xiang, Y. Associations of dietary inflammatory index with prediabetes and insulin resistance. Front Endocrinol (Lausanne). (2022) 13:820932. doi: 10.3389/fendo.2022.820932
9. Kheirouri, S, and Alizadeh, M. Dietary inflammatory potential and the risk of incident depression in adults: a systematic review. Adv Nutr. (2019) 10:9–18. doi: 10.1093/advances/nmy100
10. Shakya, PR, Melaku, YA, Shivappa, N, Hébert, JR, Adams, RJ, Page, AJ, et al. Dietary inflammatory index (DII®) and the risk of depression symptoms in adults. Clin Nutr. (2021) 40:3631–42. doi: 10.1016/j.clnu.2020.12.031
11. Luo, J, Hou, Y, Xie, M, Ma, W, Shi, D, and Jiang, B. Cyc31, a natural bromophenol Ptp1b inhibitor, activates insulin signaling and improves long chain-fatty acid oxidation in C2c12 Myotubes. Mar Drugs. (2020) 18:267. doi: 10.3390/md18050267
12. Fernandes, BS, Salagre, E, Enduru, N, Grande, I, Vieta, E, and Zhao, Z. Insulin resistance in depression: a large meta-analysis of metabolic parameters and variation. Neurosci Biobehav Rev. (2022) 139:104758. doi: 10.1016/j.neubiorev.2022.104758
13. Watson, KT, Simard, JF, Henderson, VW, Nutkiewicz, L, Lamers, F, Rasgon, N, et al. Association of Insulin Resistance with depression severity and remission status: defining a metabolic Endophenotype of depression. JAMA Psychiat. (2021) 78:439–41. doi: 10.1001/jamapsychiatry.2020.3669
14. Greenwood, EA, Pasch, LA, Cedars, MI, Legro, RS, Eisenberg, E, Huddleston, HG, et al. Insulin resistance is associated with depression risk in polycystic ovary syndrome. Fertil Steril. (2018) 110:27–34. doi: 10.1016/j.fertnstert.2018.03.009
15. Menard, C, Hodes, GE, and Russo, SJ. Pathogenesis of depression: insights from human and rodent studies. Neuroscience. (2016) 321:138–62. doi: 10.1016/j.neuroscience.2015.05.053
16. Shivappa, N, Steck, SE, Hurley, TG, Hussey, JR, and Hebert, JR. Designing and developing a literature-derived, population-based dietary inflammatory index. Public Health Nutr. (2014) 17:1689–96. doi: 10.1017/S1368980013002115
17. Haghighatdoost, F, Feizi, A, Esmaillzadeh, A, Feinle-Bisset, C, Keshteli, AH, Afshar, H, et al. Association between the dietary inflammatory index and common mental health disorders profile scores. Clin Nutr. (2019) 38:1643–50. doi: 10.1016/j.clnu.2018.08.016
18. Chen, WY, Fu, YP, Zhong, W, and Zhou, M. The association between dietary inflammatory index and sex hormones among postmenopausal women in the US. Front Endocrinol (Lausanne). (2021) 12:771565. doi: 10.3389/fendo.2021.771565
19. Ma, Y, Li, R, Zhan, W, Huang, X, Zhou, Y, Sun, Y, et al. Associations between dietary inflammatory index and sex hormones among 6- to 19-year-old children and adolescents in Nhanes 2015-2016. Front Endocrinol (Lausanne). (2021) 12:792114. doi: 10.3389/fendo.2021.792114
20. Mazidi, M, Shivappa, N, Wirth, MD, Hebert, JR, Vatanparast, H, and Kengne, AP. The association between dietary inflammatory properties and bone mineral density and risk of fracture in us adults. Eur J Clin Nutr. (2017) 71:1273–7. doi: 10.1038/ejcn.2017.133
21. Wang, H, Jian, L, Li, H, Li, Z, Luo, H, Gao, Y, et al. Dietary inflammation index and osteoarthritis in the elderly: is there a mediating role of physical activity? Br J Nutr. (2022) 128:1–12. doi: 10.1017/S0007114521002841
22. Kroenke, K, Spitzer, RL, and Williams, JB. The Phq-9: validity of a brief depression severity measure. J Gen Intern Med. (2001) 16:606–13. doi: 10.1046/j.1525-1497.2001.016009606.x
23. Wallace, TM, Levy, JC, and Matthews, DR. Use and abuse of Homa modeling. Diabetes Care. (2004) 27:1487–95. doi: 10.2337/diacare.27.6.1487
24. Chen, W, Faris, MAE, Bragazzi, NL, AlGahtani, HMS, Saif, Z, Jahrami, A, et al. Diet-related inflammation is associated with major depressive disorder in Bahraini adults: results of a case-control study using the dietary inflammatory index. J Inflamm Res. (2021) 14:1437–45. doi: 10.2147/JIR.S306315
25. Adjibade, M, Andreeva, VA, Lemogne, C, Touvier, M, Shivappa, N, Hébert, JR, et al. The inflammatory potential of the diet is associated with depressive symptoms in different subgroups of the general population. J Nutr. (2017) 147:879–87. doi: 10.3945/jn.116.245167
26. Shin, D, Shivappa, N, Hebert, JR, and Lee, KW. Examining regional differences of dietary inflammatory index and its association with depression and depressive symptoms in Korean adults. Int J Environ Res Public Health. (2020) 17:3205. doi: 10.3390/ijerph17093205
27. Kan, C, Silva, N, Golden, SH, Rajala, U, Timonen, M, Stahl, D, et al. A systematic review and meta-analysis of the association between depression and insulin resistance. Diabetes Care. (2013) 36:480–9. doi: 10.2337/dc12-1442
28. Perry, BI, Khandaker, GM, Marwaha, S, Thompson, A, Zammit, S, Singh, SP, et al. Insulin resistance and obesity, and their association with depression in relatively young people: findings from a large UK birth cohort. Psychol Med. (2020) 50:556–65. doi: 10.1017/S0033291719000308
29. Lee, JH, Park, SK, Ryoo, JH, Oh, CM, Mansur, RB, Alfonsi, JE, et al. The association between insulin resistance and depression in the Korean general population. J Affect Disord. (2017) 208:553–9. doi: 10.1016/j.jad.2016.10.027
30. Moslehi, N, Ehsani, B, Mirmiran, P, Shivappa, N, Tohidi, M, Hébert, J, et al. Inflammatory properties of diet and glucose-insulin homeostasis in a cohort of Iranian adults. Nutrients. (2016) 8:735. doi: 10.3390/nu8110735
31. Farhangi, MA, Nikniaz, L, Nikniaz, Z, and Dehghan, P. Dietary inflammatory index potentially increases blood pressure and markers of glucose homeostasis among adults: findings from an updated systematic review and meta-analysis. Public Health Nutr. (2020) 23:1362–80. doi: 10.1017/S1368980019003070
32. Leonard, BE, and Wegener, G. Inflammation, insulin resistance and neuroprogression in depression. Acta Neuropsychiatr. (2020) 32:1–9. doi: 10.1017/neu.2019.17
33. Gialluisi, A, Santonastaso, F, Bonaccio, M, Bracone, F, Shivappa, N, Hebert, JR, et al. Circulating inflammation markers partly explain the link between the dietary inflammatory index and depressive symptoms. J Inflamm Res. (2021) 14:4955–68. doi: 10.2147/JIR.S312925
Keywords: dietary inflammatory index, depression, insulin resistance, National Health and Nutrition Examination Survey, mediation analysis
Citation: Luo L, Hu J, Huang R, Kong D, Hu W, Ding Y and Yu H (2023) The association between dietary inflammation index and depression. Front. Psychiatry. 14:1131802. doi: 10.3389/fpsyt.2023.1131802
Edited by:
Yongcong Shao, Beijing Sport University, ChinaReviewed by:
Liyun Lei, Chinese Center for Disease Control and Prevention, ChinaKun Ding, Lishui Traditional Chinese Medicine Hospital, China
Copyright © 2023 Luo, Hu, Huang, Kong, Hu, Ding and Yu. This is an open-access article distributed under the terms of the Creative Commons Attribution License (CC BY). The use, distribution or reproduction in other forums is permitted, provided the original author(s) and the copyright owner(s) are credited and that the original publication in this journal is cited, in accordance with accepted academic practice. No use, distribution or reproduction is permitted which does not comply with these terms.
*Correspondence: Wei Hu, aHV3MTk5MUBob3RtYWlsLmNvbQ==; Yuanlin Ding, Z2RtdXNiZEBnZG11LmVkdS5jbg==; Haibing Yu, aGJ5NjE2Njg4QGdkbXUuZWR1LmNu
†These authors have contributed equally to this work and share first authorship
 Ling Luo1,2
†
 Ruixian Huang
 Wei Hu
 Yuanlin Ding