Abstract
Introduction:
This systematic review and meta-analysis aims to explore changes in sleep quality and sleep disturbances in the general population from before to during the COVID-19 lockdown.
Methods:
The protocol was registered in PROSPERO (CRD42021256378) and the PRISMA guidelines were followed. The major databases and gray literature were systematically searched from inception to 28/05/2021 to identify observational studies evaluating sleep changes in the general population during the lockdown with respect to the pre-lockdown period. A random effects meta-analysis was undertaken for studies reporting (a) the means of the Pittsburgh Sleep Quality Index (PSQI) global scores or the means of the sleep onset latency (SOL) times (minutes - min) before and during the lockdown, (b) the percentages of poor sleep quality before and during the lockdown, or (c) the percentages of changes in sleep quality. Subgroup analysis by risk of bias and measurement tool utilized was carried out. A narrative synthesis on sleep efficiency, sleep disturbances, insomnia and sleep medication consumption was also performed.
Results:
Sixty-three studies were included. A decline in sleep quality, reflected in a pooled increase in the PSQI global scores (standardized mean difference (SMD) = 0.26; 95% CI 0.17–0.34) and in SOL (SMD = 0.38 min; 95% CI 0.30–0.45) were found. The percentage of individuals with poor sleep quality increased during the lockdown (pooled relative risk 1.4; 95% CI 1.24–1.61). Moreover, 57.3% (95% CI 50.01–61.55) of the individuals reported a change in sleep quality; in 37.3% (95% CI 34.27–40.39) of these, it was a worsening. The studies included in the systematic review reported a decrease in sleep efficiency and an increase in sleep disturbances, insomnia, and in sleep medication consumption.
Discussion:
Timely interventions are warranted in view of the decline in sleep quality and the increase in sleep disturbances uncovered and their potentially negative impact on health. Further research and in particular longitudinal studies using validated instruments examining the long-term impact of the lockdown on sleep variables is needed.
Systematic review registration:
https://www.crd.york.ac.uk/prospero/display_record.php?ID=CRD42021256378, identifier CRD42021256378.
Introduction
Alarmed by its severity, transmissibility, rising levels of contagion, and the strain on healthcare systems, on March 11, 2020, the World Health Organization (WHO) declared the Coronavirus disease 2019 (COVID-19) outbreak, a global pandemic (1). In the absence of vaccines or pharmaceutical treatment, non-pharmaceutical interventions (NPIs) were implemented in most countries of the world to limit the diffusion of the virus and to mitigate the burden on health systems. The NPIs included strict hand hygiene and the use of face masks and more restrictive measures such as isolation, quarantine, social distancing, curfews, travel bans, remote working, school closures, and full or partial lockdowns (2). A growing body of evidence has, however, shown that these restrictive measures have adversely affected people’s mental health and well-being. For instance, in several studies more stringent NPIs have been associated with higher anxiety and depressive symptoms (3), a decrease in mental well-being (4, 5) as well as to an increase in psychological distress (6).
The negative influence of the COVID-19 pandemic and restrictive measures on mental wellbeing translated also in a significant impact on sleep health. Several studies have in fact described an increase in sleep duration, delayed sleep timing, and a reduction in sleep variability (a feature of social jet lag) during the pandemic with only a gradual return of some of these parameters to pre-pandemic levels when those measures were revoked or mitigated (7, 8). Not all the data regarding the effects of restrictive measures on sleep disturbances are, however, congruent. If on the one hand, the prevalence of sleep disturbances appeared to be higher during the lockdown with respect to non-lockdown periods (9, 10), two systematic reviews and meta-analyses have reported an inverse association between the severity of restrictive measures and the prevalence of sleep disturbances (11, 12). Nutrition, physical activity and sleep are almost unanimously considered the three pillars of health. In particular, in reference to sleep, it is known that quantitative and/or qualitative sleep disturbances can have short- and long-term consequences such as worse cognitive performance, mood disorders, worse quality of life, hypertension, diabetes, weight gain/obesity, cardiovascular and cerebrovascular diseases, and increased mortality (13, 14). Several systematic reviews and meta-analyses evaluating the impact of the COVID-19 pandemic on sleep disturbances in different populations, including the general one, reported that sleep disturbances during the COVID-19 pandemic were common, although the general population seemed to be the least affected (9–12, 15, 16). Those works did not evaluate changes in sleep quality and sleep disturbances during the lockdown with respect to pre-lockdown levels nor did they focus on the lockdown, which, by any definition, was an extraordinary measure taken by authorities constraining practically all citizens living in that country to make radical changes in their daily routine. Even if three systematic reviews and meta-analyses evaluated changes in mental health outcomes, including sleep disturbances, during the pandemic (17, 18) or lockdown (19) with respect to before, only a very few studies examining sleep disorders were included. The current systematic review and meta-analysis aimed to present an overview and synthesis of changes in sleep quality and sleep disturbances during the lockdown in the general population with respect to the pre-lockdown levels, and more specifically to delineate the changes in several different sleep outcomes such as sleep onset latency, sleep efficiency and insomnia symptoms.
Methods
Protocol and registration
This systematic review was conducted in accordance with the Preferred Reporting Items for Systematic Reviews and Meta-Analyses (PRISMA) guidelines (20) and registered in the International Prospective Register of Systematic Reviews (PROSPERO, protocol ID: CRD42021256378).
Search strategy
Four electronic academic databases (PubMed, Cochrane Library, Ebsco, and Web of Science -WOS), a preprint server (MedRxiv), and a gray literature database (OpenGrey) were searched systematically from inception to 28/05/2021, corresponding to the end of the 1st year of the pandemic, using the search terms listed in the Supplementary Table 1.
All the references were downloaded in Zotero, a citation manager software used for all the steps of the studies’ selection process, from downloading and removing duplicates, to the title-abstract and full-text screenings, which were performed independently by two researchers (EP, FR). The reference lists of the relevant systematic reviews and of the articles identified were checked for references that might lead to additional studies. To mediate any disputes, the final decision regarding a study’s eligibility was made together with the senior authors (SM, CT, and FP).
Selection criteria
The inclusion and exclusion criteria used, in accordance with the PICOS (Population, Intervention, Comparison, Outcome, and Study design) description, are outlined below.
Inclusion criteria
Population: general adult population (≥18 years) and studies whose samples were mainly composed of adults with adolescents making up at most 30%.
Intervention(s)/exposure: COVID-19 lockdown.
Outcomes: changes in sleep characteristics assessed by self-report validated instruments [e.g., Pittsburgh Sleep Quality Index – PSQI (21), Insomnia Severity Index - ISI (22)], self-report researcher-developed tools or device-based measures.
The PSQI is a self-report questionnaire that assesses global sleep quality relative to the previous 30 days’ time. The global score ranges from 0 to 21, with a cut-off >5 indicating “poor sleep quality.” The questionnaire also evaluates seven sleep components: subjective sleep quality, sleep latency, sleep duration, sleep efficiency, sleep disturbances, sleep medication use, and daytime dysfunction (21). The ISI is a 7-item self-report questionnaire that assesses the nature, severity, and impact of insomnia on a scale from 0 to 28. The scores have been classified as: 0–7 = “no insomnia,” 8–14 = “subthreshold or mild insomnia,” 15–21 = “clinical insomnia or moderate insomnia,” and 22–28 = “severe clinical insomnia” (22).
The current study has focused on the following sleep characteristics: sleep quality, sleep onset latency (the length of time, in minutes, it takes to transition from wake to sleep), sleep efficiency (the ratio of total sleep time to time in bed) (23), sleep disturbances, insomnia, insomnia types (sleep onset insomnia, sleep maintenance insomnia, early morning awakening insomnia), and sleep medication consumption.
Study design: original observational cross-sectional, prospective or retrospective cohort studies.
Exclusion criteria
(1) Studies in languages other than English, Italian or Spanish;
(2) Studies evaluating changes in subjects with specific diseases (e.g., obesity, diabetes, neuromuscular disease, cancer, osteoarthritis, and dementia) and in specific groups not representing the general population (e.g., professional athletes, health-care workers).
Data extraction
The data were extracted by two authors (EP, FR) using a pre-designed spreadsheet: the first author’s name, year of publication, country, study design, outcome, the sample size, the measurement tool utilized, the percentage of female participants, the participants’ ages (mean, median, or interval), the assessment period, and the main study results on sleep health changes. The corresponding author was contacted whenever a study appeared incomplete or in case any clarification on the presented data was needed.
Risk of bias assessment
The risk of bias was assessed by two independent authors (FL, PS) using the Newcastle Ottawa Scale (NOS) for longitudinal (24) and cross-sectional studies (25). The NOS assesses selection, comparability, and outcome by assigning a congruent number of stars: cross-sectional studies can achieve a score from 0 to 10 stars and the longitudinal ones a score from 0 to 9, with higher scores corresponding to a lower risk of bias. Studies whose NOS <5 are identified as having a low quality and a high risk of bias (26). A third author (MN) was involved in resolving any discrepancies.
Data synthesis
A meta-analysis was performed for data regarding sufficiently homogenous outcomes in terms of statistical and methodological characteristics. A narrative synthesis approach was used for those studies not included in the meta-analysis.
Meta-analysis
A random-effects meta-analysis was carried out for sleep quality and sleep onset latency, using the DerSimonian and Laird method, with studies weighted according to the inverse of the standard error, using MedCalc Statistical Software version 20.118 (27).
Studies reporting the following data were included in the meta-analysis:
-
•
the means of the PSQI global scores or the means of the sleep onset latency times (minutes - min) before and during the lockdown;
-
•
the percentages of poor sleep quality (researcher-developed questions or PSQI global score >5) before and during the lockdown;
-
•
the percentages of changes in the individuals who improved or worsened, or maintained the same sleep quality during the lockdown with respect to pre-lockdown levels.
For each type of data, the effect was expressed as standardized mean difference (SMD) (Cohen’s rule of thumb for the interpretation of the total SMD suggested that a value of 0.2 indicates a small effect, a value of 0.5 indicates a medium effect and a value of 0.8 or larger indicates a large effect), relative risks or proportions. The between-study heterogeneity was analyzed using I2 statistic: a value of 0% indicates no observed heterogeneity, and higher values show increasing heterogeneity (28). The publication bias was assessed with Egger’s test (29).
Subgroup analysis
Given the different ways that the data were synthesized, whenever possible, additional stratified meta-analyses by risk of bias (NOS <5 vs. NOS ≥5) and measurement tool utilized (self-reported validated vs researcher-developed instruments) were conducted. T-test and Chi-squared test were used to compare subgroups.
Results
The initial search yielded 2,212 results. After removing 745 duplicates, 1,467 articles were retained and screened based on the title and abstract. Of these, 154 together with other 21 studies identified via citation searches and systematic reviews were selected for full-text screening. Ninety-seven articles were selected for inclusion when the full texts were assessed. Of these, 63 contained data on outcomes pertinent to this study (30–92): 49 on sleep quality (30–33, 36–51, 53–55, 57, 60–63, 65, 67–69, 71–74, 76, 80–89, 91, 92), 16 on sleep onset latency (43, 48–50, 54, 57, 61, 63, 71, 73, 78, 83, 85, 88, 90, 92), 9 on sleep efficiency (43, 49, 63, 73, 77, 78, 83, 85, 88), 10 on sleep disturbances (35, 45, 46, 52, 58, 63, 70, 73, 83, 88), 13 on insomnia and insomnia symptom types (5 on insomnia, 8 on sleep onset insomnia, 8 on sleep maintenance insomnia, 5 on early morning awakening insomnia) (34, 45, 46, 49, 54, 56, 59, 61, 64, 66, 71, 73, 75), and 11 on sleep medication consumption (35, 43, 49, 50, 56, 61, 63, 70, 79, 83, 88). The complete PRISMA flow diagram is shown in Figure 1. The characteristics of the studies included are shown in Table 1. The studies were conducted in Argentina (N = 1), Australia (N = 2), Brazil (N = 1), China (N = 5), Cyprus (N = 1), France (N = 4), Germany (N = 3), India (N = 5), Italy (N = 8), Libya (N = 1), Multi-country (N = 9), Romania (N = 1), Russia (N = 1), Saudi Arabia (N = 1), Singapore (N = 1), Spain (N = 7), UK (N = 6), United Arab Emirates (N = 1), and USA (N = 5). Due to pandemic restrictions, most of the studies collected data through online surveys. Sixty-one studies used self-reported instruments (30–76, 79–92) and 2 device-based (DB) ones (77, 78). Of the former, 20 used validated instruments (32, 33, 42, 43, 47, 51, 54, 61, 63, 65, 66, 68, 69, 71–73, 84, 85, 88, 90) (17 PSQI), and 41 used researcher-developed ones (31, 34–41, 44–46, 48–50, 52, 53, 55–60, 62, 64, 67, 70, 74–76, 79–83, 86, 87, 89, 91, 92). With regard to the researcher-developed instruments, some studies utilized selected items of validated tools, but in the majority of cases the investigators asked the participants to evaluate if they had noted a change (either an improvement, worsening or no change) in the sleep outcome being examined during the lockdown with respect to pre-lockdown status. Forty-eight of the studies were cross-sectional (30, 31, 33–50, 52, 53, 57, 58, 60–64, 66, 67, 69–71, 73–75, 79–83, 86–90, 92) and 15 were longitudinal (32, 51, 54–56, 59, 65, 68, 72, 76–78, 84, 85, 91). The mean NOS score for the cross-sectional studies was 4.1 (SD = 1.3; range 1-7); it was 5.1 (SD = 1.0; range 3-8) for the longitudinal studies (see Supplementary Table 2 for full scoring information). Out of the total number of studies, 49.2% (31 studies) were of high quality.
FIGURE 1

PRISMA flow diagram showing the process of study selection.
TABLE 1
| References | Country | Study design | Assessment period | Population | N | Age | Data collection/Type of recruitment | Measurement tool | Risk of bias score | Q | SOL | SE | SDIST | IN | SOI | SMI | EMA | MED |
| Aguiar et al. (30) | Brazil | cross-sectional | August 17–31, 2020 | University students | 527; F 81% | 24 ± 5.6 y | Online questionnaire/snowball sampling | Researcher- developed questions | 5 | 1 | ||||||||
| Allen et al. (31) | UK | cross-sectional | April 15–June 8, 2020 | General population | 200; F 86% | 18–62 y; 24.7 ± 7.2 y | Online questionnaire/convenience sampling | Researcher- developed questions | 4 | 1 | ||||||||
| Al-Musharaf et al. (32) | Saudi Arabia | longitudinal | B: February–April, 2019; D: April–May, 2020 | University students | 297; F 100% | 19–30 y; 20.7 ± 1.4 y | Telephonic interview/NR | PSQI | 5 | 1 | ||||||||
| Ammar et al. (33) | Multi-country: Western Asia/North Africa/Europe/Americas | cross-sectional | April 6–11, 2020 | General population | 1047; F 53.8% | ≥18 y | Online survey/convenience sampling | PSQI | 3 | 1 | ||||||||
| Bacaro et al. (34) | Italy | cross-sectional | April 1–May 4, 2020 | General population | 1989; F 76.2% | 38.4 ± 12.8 y | Online survey/convenience sampling | Researcher- developed questions | 5 | 1 | ||||||||
| Beck et al. (35) | France | cross-sectional | March 31–April 2, 2020 | General population | 1500; F 52% | ≥18 y | Online survey/random sampling | Researcher- developed questions | 6 | 1 | 1 | |||||||
| Ben Salah et al. (36) | Multi-country: USA/Germany/India/Tunisia | cross-sectional | March 31–May 15, 2020 | General population | 3816; F 70.5% | ≥18 y; 38.6 ± 14 y | Online survey/convenience sampling | Researcher- developed questions | 3 | 1 | ||||||||
| Bigalke et al. (37) | USA | cross-sectional | April 25–May 18, 2020 | General population | 103; F 59% | Media 38y | Online survey/convenience sampling | Researcher- developed questions | 5 | 1 | ||||||||
| Blume et al. (38) | Multi-country: Austria/Germany/Switzerland | cross-sectional | March 23–April 26, 2020 | General population | 435; F 75.2% | ≥18 y; median 26–35 y | Online survey/convenience sampling | Researcher- developed questions | 4 | 1 | ||||||||
| Brindal et al. (39) | Australia | cross-sectional | May 2020 | General population | 3745; F 85.7% | 56.4 ± 12.6 y | Online survey/convenience sampling | Researcher- developed questions | 2 | 1 | ||||||||
| Buoite Stella et al. (40) | Italy | cross-sectional | March 23–29, 2020 | General population | 400; F 69% | 35 ± 15 y | Online survey/convenience sampling | Researcher- developed questions | 6 | 1 | ||||||||
| Cancello et al. (41) | Italy | cross-sectional | April 15–May 4, 2020 | General population | 490; F 84% | ≥18 y | Online survey/convenience sampling | Researcher- developed questions | 2 | 1 | ||||||||
| Cellini et al. (42) | Italy | cross-sectional | March 24–28, 2020 | Students, workers | 1310; F 67.2% | 23.91 ± 3.6 y | Online survey/convenience sampling | PSQI | 5 | 1 | ||||||||
| Cellini et al. (43) | Multi-country: Italy/Belgium | cross-sectional | April 1–May 19, 2020 | General population | 1662 Italians, 650 Belgian; F 72.19%, 78.3% | 34.1 ± 13.6 y; 43.0 ± 16.8 y | Online survey/convenience sampling | PSQI | 5 | 1 | 1 | 1 | 1 | |||||
| Celorio-Sardà et al. (44) | Spain | cross-sectional | May 22–July 3, 2020 | Students, workers | 321; F 79.8% | ≥18 y | Online survey/convenience sampling | Researcher- developed questions | 3 | 1 | ||||||||
| Cheikh Ismail et al. (45) | Multi-country: MENA region. | cross-sectional | April 15–29, 2020 | General population | 2970; F 71⋅6% | ≥18 y | Online survey/convenience and snowball sampling | Researcher- developed questions | 5 | 1 | 1 | 1 | 1 | 1 | ||||
| Cheikh Ismail et al. (46) | United Arab Emirates | cross-sectional | April and May 2020 | General population | 1012; F 75.9% | ≥18 y | Online survey/snowball sampling | Researcher- developed questions | 5 | 1 | 1 | 1 | 1 | 1 | ||||
| Chopra et al. (47) | India | cross-sectional | August 15–30, 2020 | General population | 995; F 41.4% | 33.33 ± 14.5 y; range 18–85 y | Online and telephonic survey/quota sampling | Validated questionnaire | 5 | 1 | ||||||||
| Chouchou et al. (48) | France | cross-sectional | 35th–45th days of lookdown | General population | 400; F 58.3% | ≥18 y; 29.8 ± 11.5 y | Online survey/convenience sampling | Researcher- developed questions (PSQI, selected items) | 4 | 1 | 1 | |||||||
| Diz-Ferreira et al. (49) | Spain | cross-sectional | March 30–April 12, 2020 | General population | 451; F 73.4% | ≥18 y | Paper and online survey/convenience sampling | Researcher- developed questions (OSQ adapted) | 7 | 1 | 1 | 1 | 1 | 1 | ||||
| Elhadi et al. (50) | Libya | cross-sectional | July 18–August 23, 2020 | General population | 10296; F 76.6% | 28.9 ± 8.5 y | Online survey/convenience sampling | Researcher- developed questions | 3 | 1 | 1 | 1 | ||||||
| Evans et al. (51) | UK | longitudinal | B: October 2019; D: May 1–30, 2020 | Students | 254; F 86.2% | 18–31 y; 19.76 ± 1.28 y | Paper and online survey/NR | PSQI | 4 | 1 | ||||||||
| Fernandez-Ballesteros and Sánchez-Izquierdo (52) | India | cross-sectional | April 1–May 5, 2020 | General population | 315; F 47.9% | 60–93 y | Online survey/convenience sampling | Researcher- developed questions | 2 | 1 | ||||||||
| Flanagan et al. (53) | Multi-country: USA/Australia/Canada/Ireland/UK | cross-sectional | April 3–May 3, 2020 | General population | 7753; F 80.0% | ≥18 y; 51.2 ± 0.17 y | Online survey/convenience sampling | Researcher- developed questions | 5 | 1 | ||||||||
| Gao and Scullin (54) | USA | longitudinal | B: February 17, 2020; D: March 25–27, 2020 | General population | 699 (B:199; D: 500; B/D: 86); F 44.78% | 38.04 ± 11.65 y | Online survey/convenience sampling | PSQI + researcher developed questions (SOL, SMI) | 5 | 1 | 1 | 1 | ||||||
| García-Esquinas et al. (55) | Spain | longitudinal | B: 2019; D: April 27–June 22, 2020 | General population | 3041; F 57.7% | ≥65 y; mean 74.5 y | Telephonic interview/cohort | Researcher- developed questions | 5 | 1 | ||||||||
| Ge et al. (56) | China | longitudinal | B: January 1–December 31, 2019; D: February 1–March 8, 2020 | General population | 2061; F 32.6% | ≥18 y; 27.21 ± 7.16 y | Online survey/snowball sampling | Researcher- developed questions (PSQI, selected items) | 3 | 1 | 1 | |||||||
| Gupta et al. (57) | India | cross-sectional | April 28–May 10, 2020 | General population | 958; F 41.2% | 37.32 ± 13.09 y | Online survey/snowball sampling | Researcher- developed questions | 5 | 1 | 1 | |||||||
| Hetkamp et al. (58) | Germany | cross-sectional | March 10–April 30, 2020 | General population | 16245; F 70.8% | ≥18 y | Online survey/convenience sampling | Researcher- developed questions (PHQ-9, single item) | 3 | 1 | ||||||||
| Hisler and Twenge (59) | USA | longitudinal | B: 2018; D: April 27, 2020 | General population | B: 19433, D: 2059; F 51.8%, 50.7% | ≥18 y; B: 42.84 ± 14.84 y; D: 43.35 ± 14.88 y | Online survey/probability sampling | Researcher- developed questions | 5 | 1 | 1 | |||||||
| Ingram et al. (60) | UK (Scotland) | cross-sectional | First lookdown | General population | 399; F 56.4% | 18–72 y; 32.4 ± 11.4 y | Online survey/convenience sampling | Researcher- developed questions | 3 | 1 | ||||||||
| Innocenti et al. (61) | Italy | cross-sectional | First lookdown | General population | 1035; F 82.9% | ≥18 y; 30–50 y | Online survey/convenience sampling | PSQI | 1 | 1 | 1 | 1 | 1 | |||||
| Knell et al. (62) | USA | cross-sectional | April 15–May 5, 2020 | General population | 1809; F 67.4% | 35–49 y; | Online survey/convenience sampling | Researcher- developed questions | 3 | 1 | ||||||||
| Kolokotroni et al. (63) | Cyprus | cross-sectional | April 10–May 12, 2020 | General population | 745; F 73.8% | ≥18 y; median 39 (IQR 13) y; range 18–76 y | Online survey/convenience sampling | PSQI | 4 | 1 | 1 | 1 | 1 | 1 | ||||
| Kontsevaya et al. (64) | Russia | cross-sectional | April 26–June 6, 2020 | General population | 2432; F 83% | ≥18 y; 37.6 ± 13.4 y | Online survey/convenience sampling | Researcher- developed questions | 6 | 1 | 1 | |||||||
| Leone et al. (65) | Argentina | longitudinal | B: February and May 2018 and 2019/February 2020; D: April 2020 | General population | 1021; F 69.64% | 13–74 y; 37.4 ± 13.21 y | Online survey/convenience sampling | PSQI | 6 | 1 | ||||||||
| Lin et al. (66) | China | cross-sectional | February 5–23, 2020 | General population | 5641; F70.1% | ≥18 y; 37.6 y | Online questionnaire/snowball sampling | ISI | 5 | 1 | 1 | 1 | 1 | |||||
| López-Moreno et al. (67) | Spain | cross-sectional | May 28–June 21, 2020 | General population | 675; F 30.1% | ≥18 y; 39.1 ± 12.9 y; range 18–85 y | Online survey/snowball sampling | Researcher- developed questions | 3 | 1 | ||||||||
| Maher et al. (68) | USA | longitudinal | B: January 21–March 11, 2020; D: April 17–May 5, 2020 | Students | 107; F 66% | 21.7 ± 2.6 y; 18–34 | Online survey/convenience sampling | PSQI | 4 | 1 | ||||||||
| Majumdar et al. (69) | India | cross-sectional | April 14–May 2, 2020 | University students, workers | 325 students, 203 workers; F 60.9%, 18.2% | 33.1 ± 7.11 y; 22.1 ± 1.66 y | Online survey/convenience sampling | ESS | 2 | 1 | ||||||||
| Mandelkorn et al. (70) | Multi-country: Multinations/USA | cross-sectional | March 26–April 26, 2020 | General population | 2562 study 1, 971 study 2; F 68%, 52.8% | 45.18 ± 14.46 y; 40.36 ± 13.61 y | Online survey/convenience sampling | Researcher- developed questions (PSQI, ISI, SST: selected items) | 4 | 1 | 1 | |||||||
| Marelli et al. (71) | Italy | cross-sectional | March 24–May 2, 2020 | University students, workers | 400; F 75.8% | 22.84 ± 2.68 y | Online survey/convenience sampling | PSQI, ISI | 6 | 1 | 1 | 1 | 1 | 1 | 1 | |||
| Martinez-de-Quel et al. (72) | Spain | longitudinal | B: March 16–31, 2020; D: April 30–May 11, 2020 | General population | 161; F 37% | 35.0 ± 11.2 y | Online survey/convenience sampling | PSQI | 6 | 1 | ||||||||
| Martínez-Lezaun et al. (73) | Spain | cross-sectional | After 20 days of lookdown | University students | 102; F 80.4% | 21.8 ± 2.97 y | Online questionnaire/convenience sampling quasi-experimental design | PSQI | 3 | 1 | 1 | 1 | 1 | 1 | 1 | |||
| Micheletti Cremasco et al. (74) | Italy | cross-sectional | May 14–31, 2020 | Students, workers | 3666; F 73% | 29.12 ± 12 y | Online survey/convenience sampling | Researcher- developed questions | 5 | 1 | ||||||||
| Mititelu (75) | Romania | cross-sectional | July 8–26, 2020 | General population | 805, F 19.7% | ≥20 y | Online survey/convenience sampling | Researcher- developed questions | 4 | 1 | ||||||||
| Okely et al. (76) | UK (Scotland) | longitudinal | B: 2014–2017; D: May 27–June 8, 2020 | General population | 137; F 48.2% | mean 79 y | Online questionnaire/cohort | Researcher- developed questions (PSQI, adapted single item) | 5 | 1 | ||||||||
| Ong et al. (77) | Singapore | longitudinal | B: January 2–22, 2020; D: April 7–27, 2020 | City-dwelling, workers | 1824; F 51.64% | 21–40 y; 30.94 ± 4.62 y | Device data/convenience sampling | DB (wrist-worn wearable technology) | 8 | 1 | ||||||||
| Pépin et al. (78) | France | longitudinal | B: February–March 16, 2020; D: March 17–May 11, 2020 | General population | 599; F 29% | Median 47 (IQR 36–59) y | Device data/convenience sampling | DB (Dream sleep-monitoring headband) | 7 | 1 | 1 | |||||||
| Perez-Carbonell et al. (79) | UK | cross-sectional | May 12–June 2, 2020 | General population | 843; F 67.4% | ≥18 y; median 52 (IQR 40–63) y | Online survey/convenience sampling | Researcher- developed questions | 2 | 1 | ||||||||
| Robinson et al. (80) | UK | cross-sectional | April 28–May 22, 2020 | General population | 2002; F 61.7% | ≥18 y; 34.74 ± 12.3 y | Online survey/convenience sampling | Researcher- developed questions | 4 | 1 | ||||||||
| Rossinot et al. (81) | France | cross-sectional | April 23– May 7, 2020 | General population | 1454; F 63.5% | 24–65 y; | Online survey/convenience sampling | Researcher- developed questions | 5 | 1 | ||||||||
| Saalwirth and Leipold (82) | Germany | cross-sectional | April 1–19, 2020 | General population | 665; F 53.8% | 18–73 y; 36 ± 14 y | Online questionnaire/convenience sampling | Researcher- developed questions (PSQI, adapted and selected items) | 4 | 1 | ||||||||
| Salehinejad et al. (83) | Germany | cross-sectional | April 20–28, 2020 | General population | 160; F 85.6% | 18–60 y; 25.79 ± 7.31 y | Online survey/convenience sampling | Researcher- developed questions (PSQI, item 2) | 4 | 1 | 1 | 1 | 1 | 1 | ||||
| Sañudo et al. (84) | Spain | longitudinal | B: February 2020; D: March 24–April 3, 2020 | General population | 20; F 45% | 22.6 ± 3.4 y | Online questionnaire/convenience sampling | PSQI | 4 | 1 | ||||||||
| Sella et al. (85) | Italy | longitudinal | B: End 2017- mid 2018; D: April 27–May 4, 2020 | General population | 17 young, 21 older; F 52.9%, 52.4% | Young 18–35; older 65–90 | Telephonic interview/convenience sampling | PSQI | 5 | 1 | 1 | 1 | ||||||
| Sinha et al. (86) | India | cross-sectional | April 1–May 6, 2020 | General population | 1511; F 50.9% | ≥18 y; 18–80 y | Online survey/convenience sampling | Researcher- developed questions | 4 | 1 | ||||||||
| Stanton et al. (87) | Australia | cross-sectional | April 9–9, 2020 | General population | 1491; F 67% | 50.5 ± 14.9 y | Online survey/convenience sampling | Researcher- developed questions | 4 | 1 | ||||||||
| Trabelsi et al. (88) | Multi-country: Western Asia/North Africa/Europe/Americas | cross-sectional | April 6–June 28, 2020 | General population | 517; F 52.2% | ≥56 y; 63.2 ± y | Online survey/convenience sampling | PSQI | 5 | 1 | 1 | 1 | 1 | 1 | ||||
| Trakada et al. (89) | Multi-country: Greece/Switzerland/Austria/Germany/France/Brazil | cross-sectional | March 25–April 6, 2020 (Europe); June 10–14, 2020 (Brazil) | General population, health professionals | 1908; F 68.9% | 42.6 ± 12.7 y | Online questionnaire/convenience sampling | Researcher- developed questions | 5 | 1 | ||||||||
| Wang et al. (90) | China | cross-sectional | March 23–April 26, 2020 | General population | 2289; F 48.6% | 27.5 ± 12.0 y; range 18–81 y | Online survey/convenience sampling | PSQI | 4 | 1 | ||||||||
| Zheng et al. (91) | China | longitudinal | B: 2019; D: April 15–26, 2020 | General population | 631 (B/D: 70); F 61.2% | 18–35 y; 21.1 ± 2.9 y | Online survey/convenience sampling | Researcher- developed questions | 5 | 1 | ||||||||
| Zhu et al. (92) | China | cross-sectional | March 29–April 5, 2020 | General population | 889; F 61% | 16–70 y; 31.8 ± 11.4 y | Online questionnaire/convenience sampling | Researcher- developed questions | 3 | 1 | 1 |
Descriptive characteristics of included studies.
B, before the lockdown; D, during the lockdown; F, female; NR, not reported; PSQI, Pittsburgh Sleep Quality Index; ISI, Insomnia Severity Index; ESS, Epworth Sleepiness Scale; OSQ, Oviedo Sleep Questionnaire; PHQ-9, Patient-Health-Questionnaire-9; SST, Sleep Satisfaction Tool; Q, sleep quality; SOL, sleep onset latency; SE, sleep efficiency; SDIST, sleep disturbances; IN, insomnia: SOI, sleep onset insomnia; SMI, sleep maintenance insomnia; EMA, early morning awakening insomnia; MED, sleep medication consumption; MENA, Middle East and North Africa (Algeria, Bahrain, Egypt, Iraq, Jordan, Kuwait, Lebanon, Libya, Morocco, Oman, Palestine, Qatar, Saudi Arabia, Sudan, Syria, Tunisia, United Arab Emirates, and Yemen).
Sleep quality
Forty-six out of 49 studies examining sleep quality were included in the meta-analysis: 23 reported data regarding both before and during the COVID-19 lockdown (32, 33, 40, 42, 43, 45–48, 51, 54, 55, 61, 63, 68, 71–73, 76, 83–85, 88), 24 reported percentage changes during the lockdown with respect to pre-lockdown levels (30, 31, 36, 37, 39, 41, 44, 50, 53, 54, 57, 60, 62, 65, 67, 74, 80–82, 86, 87, 89, 91, 92); the remaining three were only narratively described (38, 49, 69).
Meta-analytic changes in sleep quality
Means pre- and during-lockdown
The changes in the PSQI global scores were evaluated considering 33 outcomes reported in 14 studies (32, 33, 42, 43, 51, 54, 56, 71–73, 83–85, 88). With regard to the PSQI global score (see Figure 2), there was a significant increase (SMD = 0.26; 95% CI 0.17–0.34; I2 = 80.6%) corresponding to a worsening in sleep quality. The analysis did not show a significant publication bias (Egger’s p = 0.568).
FIGURE 2
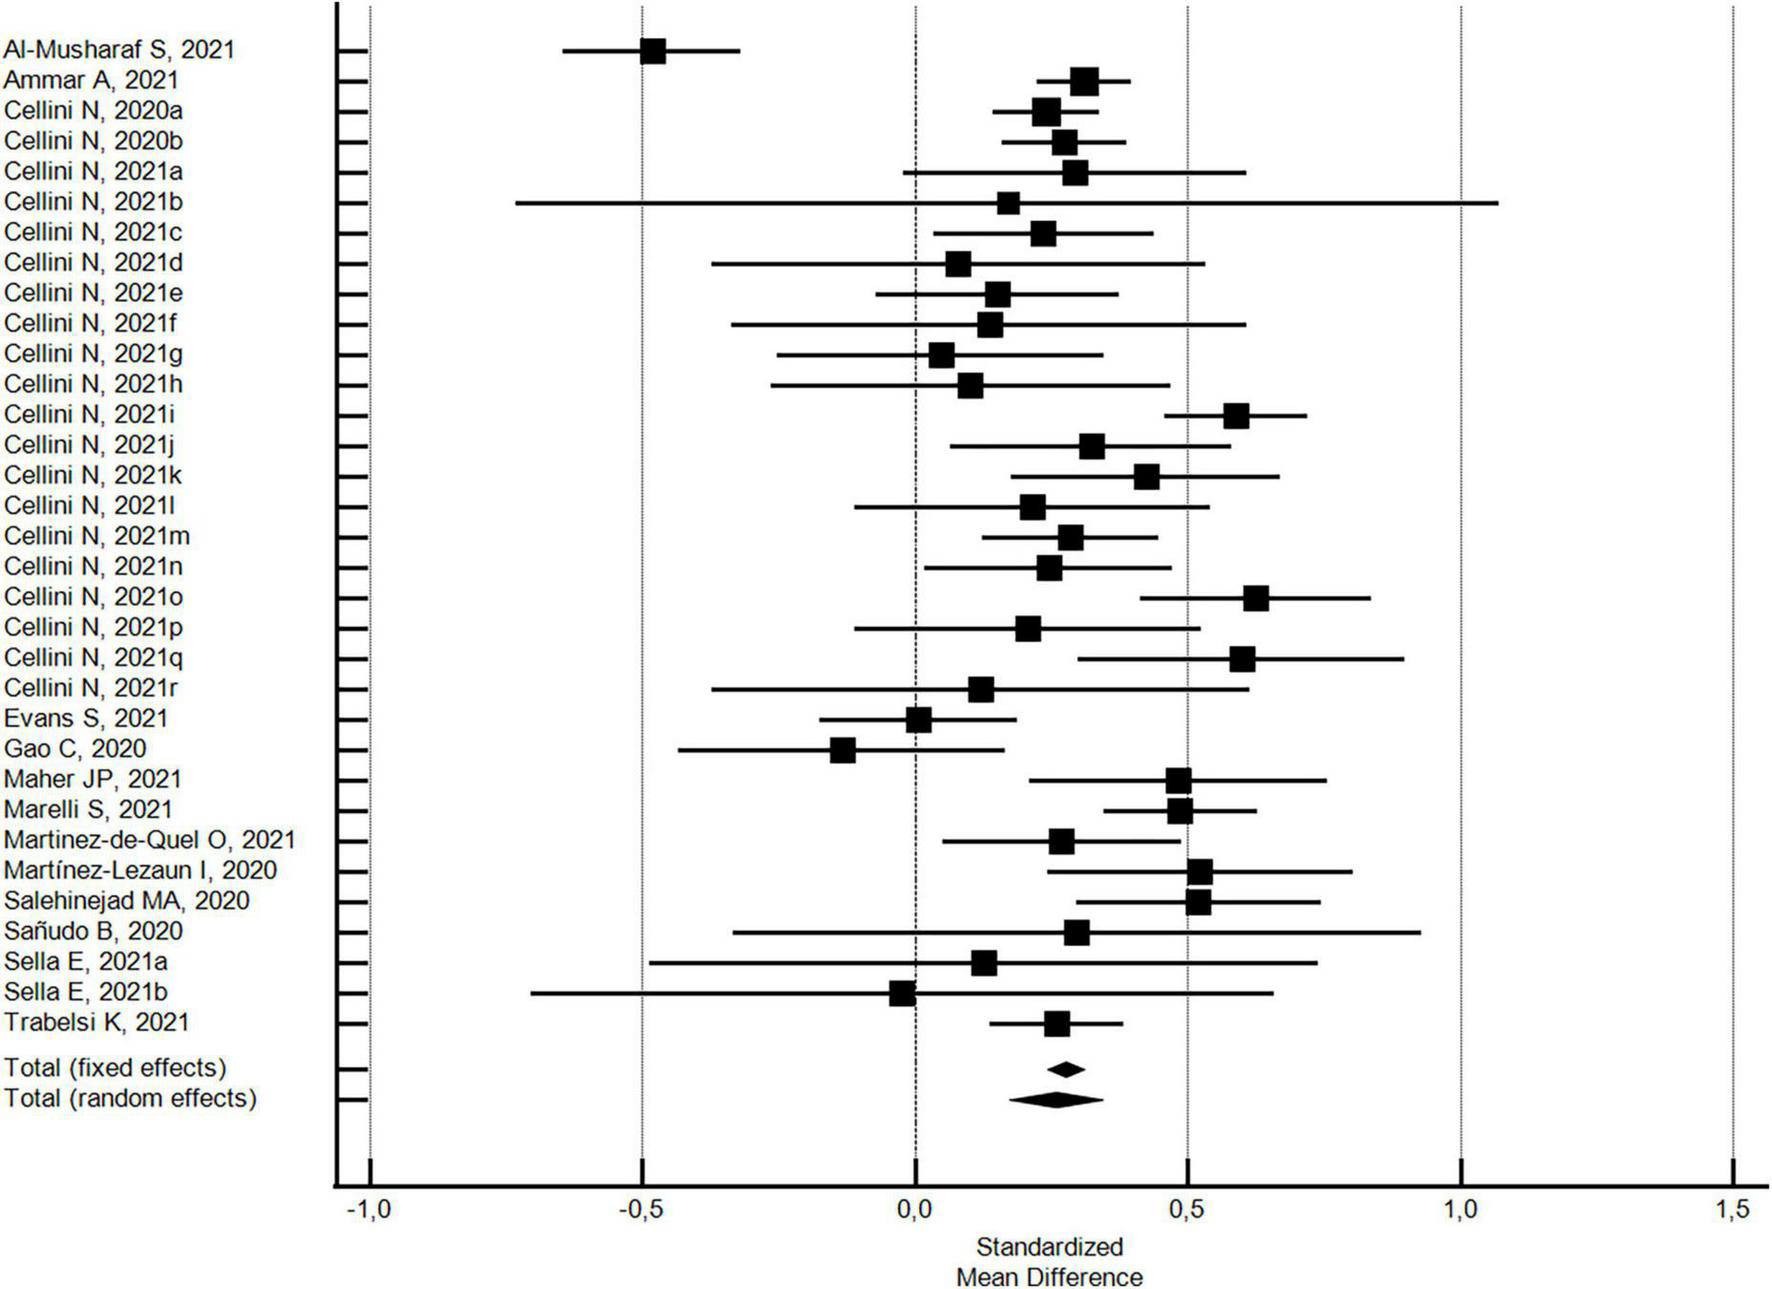
Forest plot showing pooled changes in sleep quality PSQI global score from before to during the COVID-19 lockdown. Cellini N, 2020a: Student; Cellini N, 2020b: Worker; Cellini N, 2021a: Belgian Students, Female; Cellini N, 2021b: Belgian Students, Male; Cellini N, 2021c: Belgian Regular workers, Female; Cellini N, 2021d: Belgian Regular workers, Male; Cellini N, 2021e: Belgian Remote workers, Female; Cellini N, 2021f: Belgian Remote workers, Male; Cellini N, 2021g: Belgian Unemployed/retired, Female; Cellini N, 2021h: Belgian Unemployed/retired, Male; Cellini N, 2021i: Italian Students, Female; Cellini N, 2021j: Italian Students, Male; Cellini N, 2021k: Italian Regular workers, Female; Cellini N, 2021l: Italian Regular workers, Male; Cellini N, 2021m: Italian Remote workers, Female; Cellini N, 2021n: Italian Remote workers, Male; Cellini N, 2021o:Italian Stop working, Female; Cellini N, 2021p: Italian Stop working, Male; Cellini N, 2021q: Italian Unemployed/retired, Female; Cellini N, 2021r: Italian Unemployed/retired, Male; Sella E, 2021a: Older; Sella E, 2021b: Young. Error bars = 95% confidence interval; Square boxes = individual study point estimates; and Diamond box = Pooled point estimates.
In addition, with regard to 27 outcomes in 8 studies (32, 42, 43, 54, 71, 72, 85, 88) with a high NOS quality score ≥5, the significant increase in the PSQI global score was substantially confirmed (SMD = 0.24; 95% CI 0.13-0.34; I2 = 82.2%; not significant Egger’s publication bias). With regard to the six studies (33, 51, 68, 73, 83, 84) with a low NOS quality score <5, the significant increase in the PSQI global score was higher (SMD = 0.35; 95% CI 0.18–0.51; I2 = 72.6%; not significant Egger’s publication bias), but not significantly different.
Percentages of poor sleep quality pre- and during-lockdown
The changes in the percentages of individuals with poor sleep quality from before to during the COVID-19 lockdown were evaluated considering 19 outcomes reported in 19 studies (32, 33, 40, 42, 43, 45–48, 55, 61, 63, 71–73, 76, 84, 85, 88). With respect to pre-lockdown levels, the percentage of individuals with poor sleep quality increased by around 40% during the lockdown (pooled relative risk = 1.4, 95% CI 1.24–1.61; I2 = 95.4%) (see Figure 3). The analysis did not show a significant publication bias (Egger’s p = 0.178).
FIGURE 3
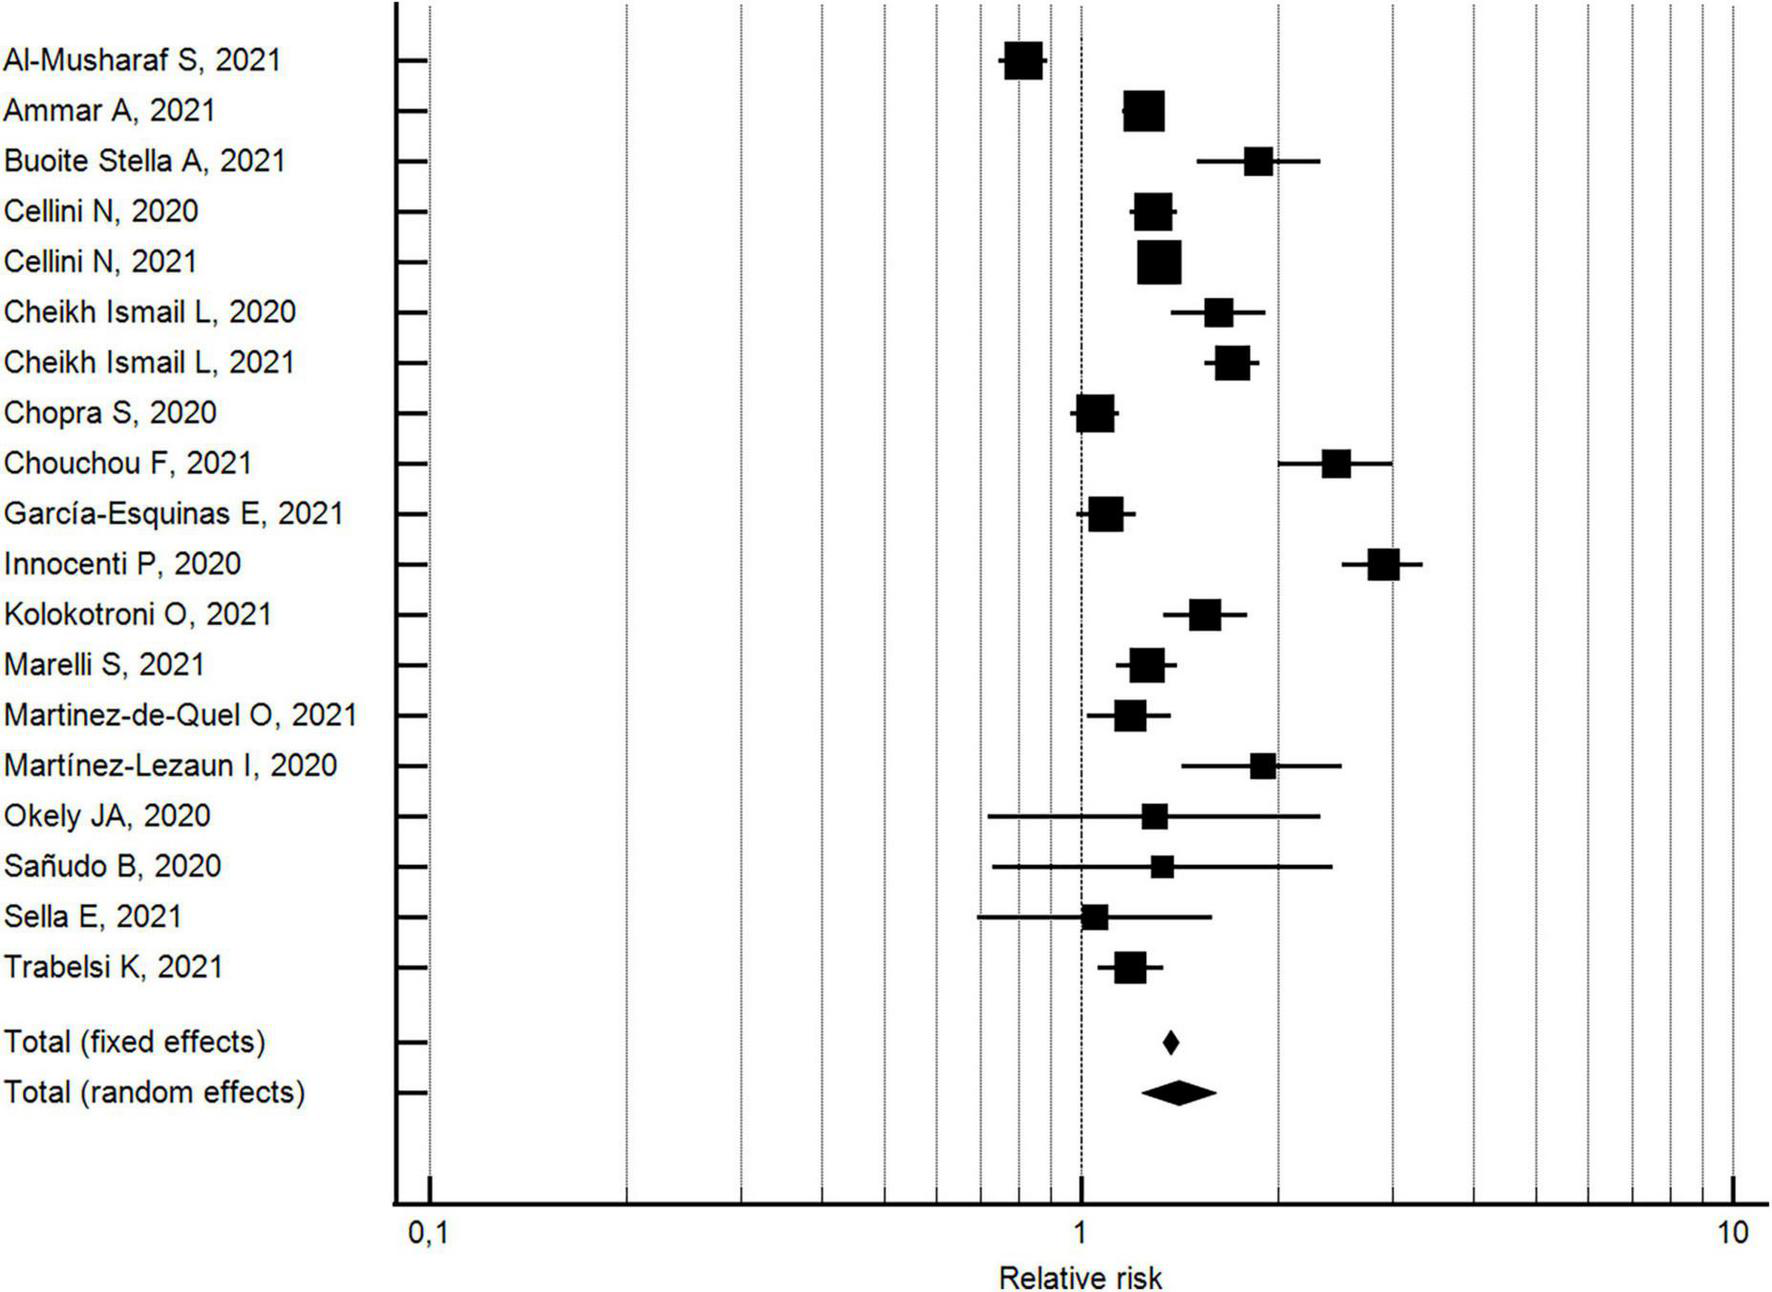
Forest plot showing pooled changes in poor sleep quality from before to during the COVID-19 lockdown. Error bars = 95% confidence interval; Square boxes = individual point estimates; and Diamond box = pooled point estimates.
With regard to the 13 studies (32, 40, 42, 43, 45–47, 55, 71, 72, 76, 85, 88) with a NOS quality score ≥5, the percentage of individuals with poor sleep quality increased by approximately 26% during the lockdown (pooled relative risk = 1.26, 95% CI 1.11–1.43; I2 = 936%; not significant Egger’s publication bias). With regard to the six studies (33, 48, 61, 63, 73, 84) with a NOS quality score <5, the percentage of individuals with poor sleep quality increased by approximately 83% during the lockdown (pooled relative risk = 1.8, 95% CI 1.28–2.62; I2 = 96.4%; not significant Egger’s publication bias). The two effects by risk of bias study resulted significantly different.
With regard to the 13 studies (32, 33, 42, 43, 47, 61, 63, 71–73, 84, 85, 88) using validated measurement tools, the percentage of individuals with poor sleep quality increased by approximately 32% during the lockdown (pooled relative risk = 1.3, 95% CI 1.14-1.54; I2 = 95.7%; not significant Egger’s publication bias). With regard to the six studies (40, 45, 46, 48, 55, 76) using researcher-developed tools, the percentage of individuals with poor sleep quality increased by approximately 64% during the lockdown (pooled relative risk = 1.6, 95% CI 1.28-2.10; I2 = 92.7%; not significant Egger’s publication bias). A significant difference was found for the measurement tool utilized.
Percentage of change in terms of improved, or worsened, or remained the same sleep quality
The percentages of changes in individuals who improved or worsened, or maintained the same sleep quality during the lockdown with respect to pre-lockdown levels, were evaluated by 24 studies (30, 31, 36, 37, 39, 41, 44, 50, 53, 54, 57, 60, 62, 65, 67, 74, 80–82, 86, 87, 89, 91, 92). As shown in Figure 4, the random effects model yielded 57.3% (95% CI 50.01 to 61.55, I2 = 98.7%; not significant Egger’s publication bias) of participants reporting a change in sleep quality. In particular, 18.6% (95% CI 15.03–22.35; I2 = 98.9%; not significant Egger’s publication bias) reported an improvement and 37.3% (95% CI 34.27–40.39; I2 = 97.5%; not significant Egger’s publication bias) a worsening in sleep quality.
FIGURE 4
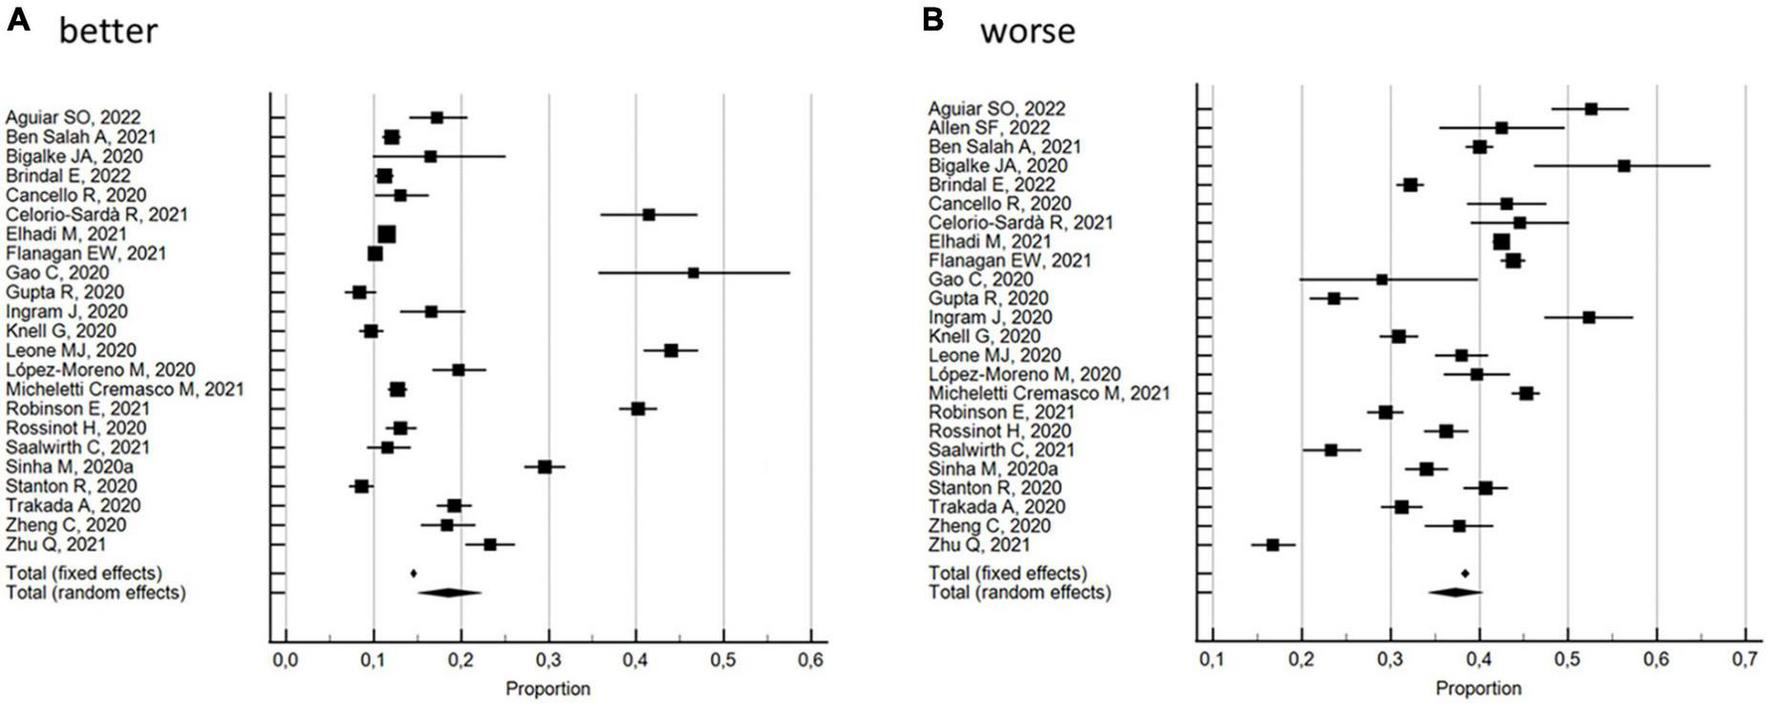
Forest plot showing pooled percentages changes in sleep quality from before to during the COVID-19 lockdown: better (A), worse (B). Error bars = 95% confidence interval; Square boxes = individual point estimates; and Diamond box = pooled point estimates.
With regard to the 10 studies (30, 37, 53, 54, 57, 65, 74, 81, 89, 91) with a NOS quality score ≥5, the random effects model substantially confirmed the overall results, with 59.9% (95% CI 52.40 to 67.21, I2 = 98.7%; not significant Egger’s publication bias) of the participants reporting a change in sleep quality. In particular, 19.2% (95% CI 13.68–25.40; I2 = 98.7%; not significant Egger’s publication bias) reported an improvement and 39.0% (95% CI 34.15–44.05; I2 = 97.0%; not significant Egger’s publication bias) a worsening in sleep quality. These results were also confirmed by the 14 studies (31, 36, 39, 41, 44, 50, 60, 62, 67, 80, 82, 86, 87, 92) with a NOS quality score <5: the random effects model yielded 55.4% (95% CI 49.85 to 60.95, I2 = 98.7%; not significant Egger’s publication bias) of the participants reporting a change in sleep quality. In particular, 18.1% (95% CI 13.29–23.46; I2 = 99.1%; not significant Egger’s publication bias) reported an improvement and 36.1% (95% CI 32.11–40.26; I2 = 97.8%; not significant Egger’s publication bias) a worsening in sleep quality. Subgroup analysis by risk of bias showed significant differences.
With regard to the 2 studies (54, 65) using validated measurement tools, the random effects model yielded 80.0% (95% CI 73.86 to 85.54, I2 = 53% not heterogeneity; significant Egger’s publication bias) of the participants reporting a change in sleep quality. In particular, 44.2% (95% CI 41.18–41.27; I2 = 0% not heterogeneity; significant Egger’s publication bias) reported an improvement and 34.9% (95% CI 27.00–43.33; I2 = 63.4% not heterogeneity; significant Egger’s publication bias) a worsening in sleep quality. With regard to the 22 studies (30, 31, 36, 37, 39, 41, 44, 50, 53, 57, 60, 62, 67, 74, 80–82, 86, 87, 89, 91, 92) using researcher-developed tools, the random effects model yielded 55.2% (95% CI 51.23 to 59.13, I2 = 98.4%; not significant Egger’s publication bias) of the participants reporting a change in sleep quality. In particular, 16.6% (95% CI 13.50–19.92; I2 = 98.7%; not significant Egger’s publication bias) reported an improvement and 37.5% (95% CI 34.34–40.81; I2 = 97.7%; not significant Egger’s publication bias) a worsening in sleep quality. Subgroup analysis by measurement tool utilized showed significant differences between the percentage of change and the percentage of improvement, but not for the percentage of worsening.
Synthesis of sleep quality changes
Out of the three studies not included in the meta-analysis (see Table 2), 2 reported a decrease in sleep quality (38, 49) and one an increase in feelings of sleepiness during the COVID-19 lockdown with respect to pre-lockdown levels (69). This trend agrees with the results of the meta-analysis.
TABLE 2
| References | Synthesis by outcome | ||
| Sleep quality | |||
| Blume et al. (38) | Significant slight decrease in sleep quality (p = 0.026). | ↓ | |
| Diz-Ferreira et al. (49) | Significant decrease in sleep satisfaction/sleep quality (p < 0.001)/half point decrease in sleep satisfaction in a 1 to 7 scale (p < 0.001). | ↓ | |
| Majumdar et al. (69) | Increase in feelings of sleepiness (decrease in sleep quality; p not-reported). | ↓ | |
| Sleep onset latency | |||
| Chouchou et al. (48) | Significant increase in sleep onset latency (p < 0.001). | ↑ | |
| Diz-Ferreira et al. (49) | Significant increase in sleep onset latency (p < 0.001). | ↑ | |
| Elhadi et al. (50) | Significant median increase in the time it took to fall to asleep. | ↑ | |
| Increase in the percentage of participants reporting a SOL ≥30 min (from 12.90 to 25.50%) (p not-reported). | ↑ | ||
| Gupta et al. (57) | Significant increase in the percentage of participants reporting a SOL ≥30 min (from 20.50 to 43.39%, p < 0.001). | ↑ | |
| Innocenti et al. (61) | Significant increase in the percentage of participants with a SOL >1 h (from 2.80 to 16%, p↑ < 0.001). | ↑ | |
| Kolokotroni et al. (63) | Significant increase in sleep onset latency (p < 0.01). | ↑ | |
| Martínez-Lezaun et al. (73) | Increase in sleep onset latency (p not-reported). | ↑ | |
| Pépin et al. (78) | Significant increase in sleep onset latency (p < 0.01). | ↑ | |
| Sella et al. (85) | Increase in sleep onset latency with a medium effect only in young but not in older adults. | ↑Y↓O | |
| Slight increase in the proportion of participants with SOL ≥30 min (young: from 17.65 to 29.42%; older: from 33.30 to 38.10% | ↑Y↑O | ||
| Wang et al. (90) | Approximately one third of the participants reported longer times to fall asleep. | NA | |
| Sleep efficiency | |||
| Cellini et al. (43) | Decrease in sleep efficiency (data and p not-reported). | ↓ | |
| Diz-Ferreira et al. (49) | Significant decrease (p < 0.001). | ↓ | |
| Kolokotroni et al. (63) | Significant improvement (p↑ < 0.01). | ↑ | |
| Martínez-Lezaun et al. (73) | Decrease in the percentage of participants with a good sleep efficiency (>85%) (p not-reported). | ↓ | |
| Ong et al. (77) | Slight but significant decrease (p < 0.001). | ↓ | |
| Pépin et al. (78) | No significant decrease. | ↓ | |
| Salehinejad et al. (83) | No significant improvement. | ↑ | |
| Sella et al. (85) | No any large decrease in SE both in young and older individuals. | ↓ | |
| Trabelsi et al. (88) | Significant decrease (p = 0.009). | ↓ | |
| Sleep disturbances | |||
| Beck et al. (35) | Among those who reported sleep problems in the previous 8 days, 54% indicated that these problems had increased since the lockdown. This was more frequently true for young people (<35 years) (60%) than for elderly people (51%, p = 0.02). | ↑ | |
| Cheikh Ismail et al. (45) | Increase in sleep disturbances (from 52.9 to 60.8%, p not-reported). | ↑ | |
| Cheikh Ismail et al. (46) | Increase in sleep disturbances (from 53.1 to 63.2%, p not-reported). | ↑ | |
| Fernandez-Ballesteros and Sánchez-Izquierdo (52) | 60% of the respondents did not report any changes, very few reported sleep disturbances. | = | |
| Hetkamp et al. (58) | Increase in sleep disturbances (from 13.5 to 30%, p not-reported). | ↑ | |
| Kolokotroni et al. (63) | Significant increase in sleep disturbances (p < 0.01). | ↑ | |
| Mandelkorn et al. (70) | About 40% of the responders reported a worsening of sleep disturbances while a 39% reported no change. | ↑ | |
| Martínez-Lezaun et al. (73) | Increase in sleep disturbances (p not-reported). | ↑ | |
| Salehinejad et al. (83) | Significant increase (p < 0.001). | ↑ | |
| Trabelsi et al. (88) | Significant increase (p < 0.001). | ↑ | |
| Insomnia, sleep onset insomnia, sleep maintenance insomnia, early morning awakening insomnia | |||
| Bacaro et al. (34) | IN | Decrease in insomnia prevalence (from 13.9 to 9.9%, p not-reported). | ↓ |
| Cheikh Ismail et al. (45) | SOI | Significant increase in the percentage of participants (from 19.7 to 35.4%, p < 0.001). | ↑ |
| SMI | Significant increase in the percentage of participants (from 18.5 to 33%, p < 0.001). | ↑ | |
| EMA | Significant decrease in the percentage of participants (from 22.9 to 14.5%, p < 0.001). | ↓ | |
| Cheikh Ismail et al. (46) | SOI | Significant increase in the percentage of participants (from 21.5 to 34.8%, p < 0.001). | ↑ |
| SMI | Significant increase in the percentage of participants (from 19.1 to 25.6%, p < 0.001). | ↑ | |
| EMA | Significant decrease in the percentage of participants (from 23.6 to 21.5%, p = 0.018). | ↓ | |
| Diz-Ferreira et al. (49) | IN | Significant increase in insomnia incidence (from 23.1 to 36.3%, p < 0.001). | ↑ |
| Significant increase in insomnia severity score (from 17.9 to 20.8, p < 0.001). | ↑ | ||
| Gao and Scullin (54) | SMI | Significant increase in number of awakenings in the middle of the night (p < 0.001). | ↑ |
| The majority of the participants reported no change in the number of night-time awakenings. | = | ||
| Ge et al. (56) | SOI | Increase in difficulty falling asleep (p not-reported). | ↑ |
| Hisler and Twenge (59) | SOI | Increase of participants reporting one or more days with difficulty falling asleep (from 39.1 to 76.1%, p not-reported). | ↑ |
| SMI | Increase of participants reporting one or more days with difficulty staying asleep (from 41.4 to 72.7%, p not-reported). | ↑ | |
| Innocenti et al. (61) | SMI | Significant increase in number of people with night-time awakenings or with early morning awakening (p < 0.0001). | ↑ |
| Kontsevaya et al. (64) | SOI | Significant increase in number of days per week with trouble falling asleep. | ↑ |
| EMA | No significant decrease in number of days per week waking up earlier than wanted. | ↓ | |
| Lin et al. (66) | IN | Increase in prevalence of clinical insomnia (from 5.7 to 9.10%, p not-reported). | ↑ |
| Increase in insomnia severity (p not-reported). | ↑ | ||
| SOI | Increase in difficulty falling asleep (p not-reported). | ↑ | |
| SMI | Increase in difficulty staying asleep (p not-reported). | ↑ | |
| EMA | Increase in waking up too early (p not-reported). | ↑ | |
| Marelli et al. (71) | IN | Significant increase in prevalence of clinical insomnia in the students group (from 6.90 to 16.30%, p < 0.001) but not in the workers group (from 4.70% to 12.90, p not-reported). | ↑S↑W |
| Significant increase in insomnia severity (p < 0.001). | ↑ | ||
| SOI | Significant increase in SOI both in students (from 38.9 to 55.4%, p < 0.001) and workers (from 15.1 to 41.9%, p < 0.001). | ↑S↑W | |
| SMI | Significant increase in SMI both in students (from 19.5 to 33.7%, p < 0.001) and workers (from 24.4 to 41.9%, p < 0.001). | ↑S↑W | |
| EMA | Significant increase in EMA both in students (from 21.4 to 30%, p < 0.001) and in workers (from 24.4 to 38.7%, p < 0.001). | ↑S↑W | |
| Martínez-Lezaun et al. (73) | SOI | Significant increase in trouble falling asleep during the first half hour (p = 0.01). | ↑ |
| SMI | No significant increase in problems getting back to sleep after waking up during the night. | ↑ | |
| Mititelu (75) | IN | Significant increase in the percentage of participants with insomnia (from 6.8 to 8.6%, p < 0.001). | ↑ |
| Sleep medication consumption | |||
| Beck et al. (35) | Among those who had taken sleeping pills in the last 12 months, 41% reported taking them since the lockdown: 32% for women vs 46% for men (p < 0.001). | NA | |
| Cellini et al. (42) | Decrease in the proportion of responders who used sleep medications in both Italians (from 12.3 to 10.3%, p not- reported) and Belgians (from 25.4 to 24.2%, p not-reported). | ↓ | |
| Diz-Ferreira et al. (49) | No significant increase. | ↑ | |
| Elhadi et al. (50) | 11.3% of the participants reported they had begun to take sleep medication to help them fall asleep during the lockdown. | NA | |
| Ge et al. (56) | Increase in sleep medications consumption (p not-reported). | ↑ | |
| Innocenti et al. (61) | 6% increase in number of people who took sleep medications 3 or more times a week, while those who did not take them decreased by about 10% (p↑ < 0.0001). | ↑ | |
| Kolokotroni et al. (63) | Significant increase in sleep medications consumption (p < 0.01). | ↑ | |
| Mandelkorn et al. (70) | Significant increase in sleep medications consumption in both studies (p < 0.001). | ↑ | |
| Perez-Carbonell et al. (79) | Increase in sleep medications consumption (from 5.3 to 7.4%, p not-reported). | ↑ | |
| Salehinejad et al. (83) | Significant increase (p < 0.001). | ↑ | |
| Trabelsi et al. (88) | Significant increase (p < 0.001). | ↑ | |
Synthesis of changes in sleep outcomes from before to during the COVID-19 lockdown.
Y, young; O, older; NA, not applicable; IN, insomnia: SOI, sleep onset insomnia; SMI, sleep maintenance insomnia; EMA, early morning awakening insomnia; S, students; W, workers.
Sleep onset latency
Out of 16 studies examining sleep onset latency, 6 reported data regarding both before and during the COVID-19 lockdown and were included in the meta-analysis (43, 54, 71, 83, 88, 92); the other ten were only narratively described (48–50, 57, 61, 63, 73, 78, 85, 90).
Meta-analytic changes in sleep onset latency
Means pre- and during-lockdown
Changes in sleep onset latency from before to during the COVID-19 lockdown were evaluated considering 23 outcomes examined by 6 studies (43, 54, 71, 83, 88, 92). The pooled results showed that there was a slightly significant increase in the sleep onset latency of a SMD of 0.38 min (95% CI 0.30–0.45; I2 = 63.7%, not shown, significant publication bias) (see Figure 5).
FIGURE 5
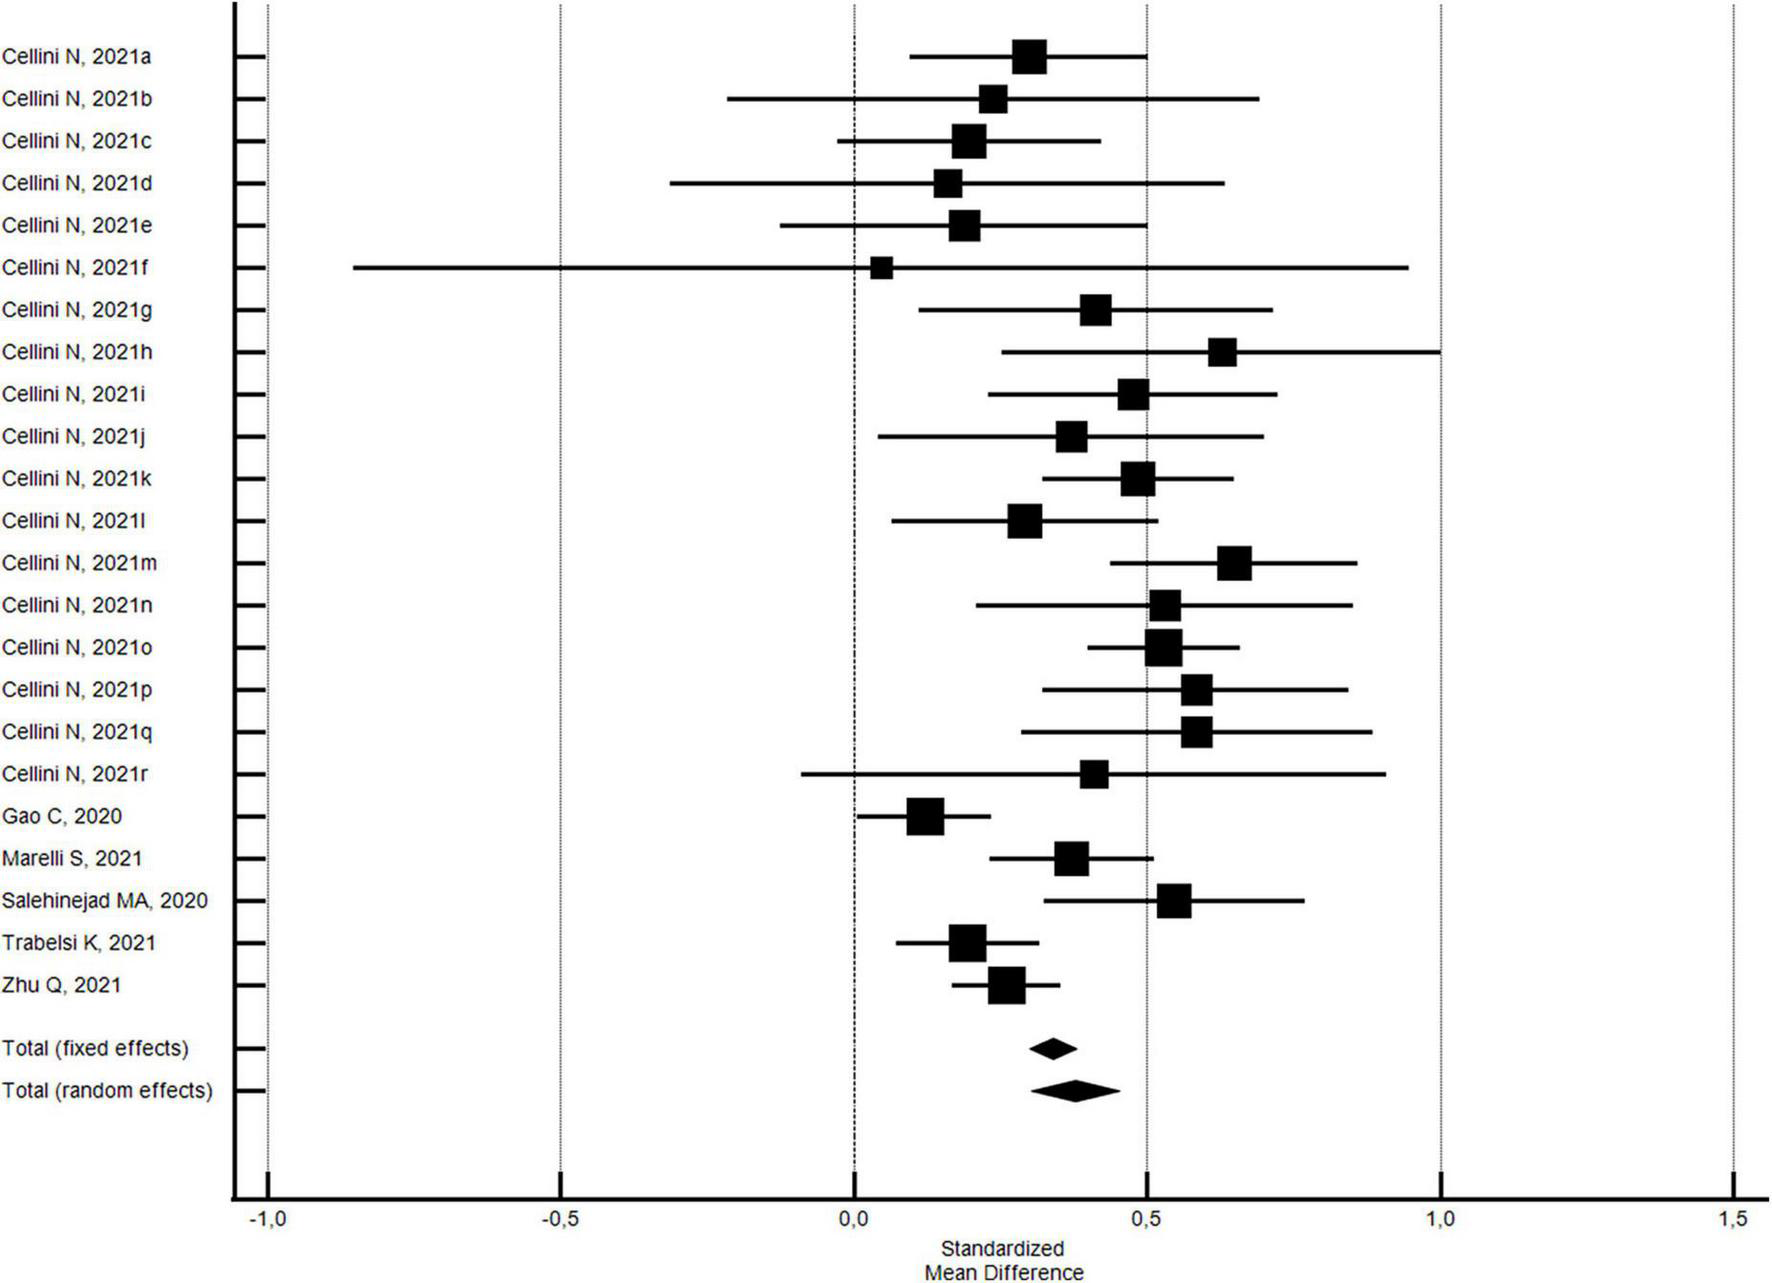
Forest plot showing pooled changes in sleep onset latency from before to during the COVID-19 lockdown. Cellini N, 2021a: Belgian Students, Female; Cellini N, 2021b: Belgian Students, Male; Cellini N, 2021c: Belgian Regular workers, Female; Cellini N, 2021d: Belgian Regular workers, Male; Cellini N, 2021e: Belgian Remote workers, Female; Cellini N, 2021f: Belgian Remote workers, Male; Cellini N, 2021g: Belgian Unemployed/retired, Female; Cellini N, 2021h: Belgian Unemployed/retired, Male; Cellini N, 2021i: Italian Students, Female; Cellini N, 2021j: Italian Students, Male; Cellini N, 2021k: Italian Regular workers, Female; Cellini N, 2021l: Italian Regular workers, Male; Cellini N, 2021m: Italian Remote workers, Female; Cellini N, 2021n: Italian Remote workers, Male; Cellini N, 2021o:Italian Stop working, Female; Cellini N, 2021p: Italian Stop working, Male; Cellini N, 2021q: Italian Unemployed/retired, Female; Cellini N, 2021r: Italian Unemployed/retired, Male. Error bars = 95% confidence interval; Square boxes = individual study effects; and Diamond box = Pooled effects.
The results were basically the same when the NOS quality score was stratified. With regard to 21 outcomes of the four studies (43, 54, 71, 88) with a NOS quality score ≥5, the pooled results confirmed a slightly significant increase in the sleep onset latency of a SMD of 0.38 min (95% CI 0.30–0.46; I2 = 63.1%; not significant Egger’s publication bias). With regard to the outcomes of two studies (83, 92) with a NOS quality score <5, the pooled results showed that there was a slightly significant increase in the sleep onset latency of a SMD of 0.39 min (95% CI 0.11–0.66; I2 = 81.6%; significant Egger’s publication bias). No significant differences by risk of bias were found.
With regard to the 20 outcomes of the 3 studies (43, 71, 88) using validated measurement tools, the pooled results uncovered a slightly significant increase in the sleep onset latency of a SMD of 0.40 min (95% CI 0.33–0.48; I2 = 47.4%; not significant Egger’s publication bias). With regard to the outcomes of 3 studies (54, 83, 92) using researcher-developed tools, the pooled results showed that there was a slightly significant increase in the sleep onset latency of a SMD of 0.28 min (95% CI 0.10–0.47; I2 = 82.8%; not significant Egger’s publication bias). No significant differences by measurement tool utilized were found.
Synthesis of sleep onset latency changes
Ten studies reported 14 outcomes regarding sleep onset latency changes during the COVID-19 lockdown with respect to pre-lockdown levels: 9 (48–50, 63, 73, 78, 85, 90) reported the time it took to fall asleep and 5 (50, 57, 61, 85) the percentage of persons with a sleep onset latency ≥30 or >60 min (see Table 2).
All of the studies, with the exception of Wang et al.’s (90), reported an increase in the sleep onset latency (48–50, 57, 61, 63, 73, 78, 85). According to Sella et al.’s work (85), the increase mostly regarded young adults; Wang’s study (90) reported that approximately one third of the participants responded that it took them longer to fall asleep. Once again, this trend agrees with the results of the meta-analysis.
Synthesis of sleep efficiency changes
Nine studies (43, 49, 63, 73, 77, 78, 83, 85, 88) with 10 outcomes evaluated changes in the sleep efficiency during the lockdown with respect to pre-lockdown values; of these, 77.8% (7/9) reported a decrease (43, 49, 73, 77, 78, 85, 88) and 2 an increase in sleep efficiency (63, 83) (see Table 2).
Synthesis of sleep disturbance changes
Out of ten studies (35, 45, 46, 52, 58, 63, 70, 73, 83, 88) examining changes in sleep disturbances during the lockdown with respect to pre-lockdown levels, one study reported no change (52), and 90% (9/10) reported an increase (35, 45, 46, 58, 63, 70, 73, 83, 88) (see Table 2). According to Beck et al.’s study (35), the increase was more frequent in young with respect to older people.
Synthesis of the insomnia changes
Thirteen studies (34, 45, 46, 49, 54, 56, 59, 61, 64, 66, 71, 73, 75) examining 34 outcomes evaluated changes in insomnia during the lockdown with respect to pre-lockdown period: in particular, 5 evaluated changes in the insomnia status (34, 49, 66, 71, 75), 8 in sleep onset insomnia (45, 46, 56, 59, 64, 66, 71, 73), 8 in sleep maintenance insomnia (45, 46, 54, 59, 61, 66, 71, 73), and 5 in early morning awakening insomnia (45, 46, 64, 66, 71) (see Table 2). With regard to the outcomes examining the insomnia status, 88.9% (8/9) reported an increase (49, 66, 71, 75) and one decrease (34) in insomnia. Marelli et al. reported that the increase was significant in the students but not in the workers (71). All of the studies reporting on sleep onset insomnia described an increase in this variable (45, 46, 56, 59, 64, 66, 71, 73). With regard to the outcomes examining the sleep maintenance insomnia, all reported an increase (45, 46, 54, 59, 61, 66, 71, 73). Marelli et al.’s work uncovered a more marked increase in the workers with respect to the students (71). According to Gao et al. (54), the majority of the participants did not report a change in symptoms although an increase in night-time awakenings was noted. Fifty percent (3/6) of the early morning awakening insomnia outcomes described an increase (66, 71), which seemed to be more marked in the workers with respect to that in the students (71), and three a decrease (45, 46, 64).
Synthesis of sleep medication consumption changes
Of the eleven studies examining changes in sleep medication consumption during the COVID-19 lockdown with respect to pre-lockdown levels (35, 43, 49, 50, 56, 61, 63, 70, 79, 83, 88), 72.7% (8/11) reported an increase (49, 56, 61, 63, 70, 79, 83, 88), and one a decrease in use (43). Two studies reported that 41% (35) and 11% (50) of the participants started taking sleep medication during the lockdown (see Table 2).
Discussion
This systematic review and meta-analysis of 63 studies aimed to examine and synthesize changes in sleep quality and sleep disturbances in the general population from before to during the COVID-19 lockdown. The main results of the meta-analysis indicated that during the lockdown, there was a significant worsening of sleep quality, and a 40% increased probability of reporting poor sleep quality. Analyses, moreover, uncovered that approximately 57% of the participants experienced a change in sleep quality, which was more frequently a worsening. Subgroup analysis showed a more marked, even if not statistically significant, worsening in sleep quality (a higher increase in the PSQI global score) and a significant higher increase in the percentage of individuals with poor sleep quality during the lockdown in the low quality studies with respect to the high quality ones, and in the studies using validated measurement tools with respect to those using researcher-developed ones. On the contrary, the percentages of participants reporting a change in sleep quality and of those experiencing a worsening are significantly higher in the high quality studies, as well as in the studies using validated measurement tools, in particular with regard to improvement. These results are partially in line with those presented by Jahrami et al. (9) who found a lower rate of sleep disturbances in the high quality studies with respect to the moderate and low quality ones, and a higher prevalence of sleep disturbances in the studies using validated measures with respect to those using researcher-developed ones (16). The meta-analysis also revealed a modest although significant increase in the sleep onset latency value (SMD = 0.38 min, 95% CI 0.30-0.45), an indicator of good sleep quality when values are lower than 30 min (21). Subgroup analysis found no significant differences by risk of bias and measurement tool utilized. Studies not included in the meta-analysis, similarly reported an increase in the time it took to fall asleep and in the percentage of individuals with a sleep onset latency ≥30 or >60. Sleep efficiency, an indicator of good sleep quality when values are ≥85% (23) also declined according to 7 out of 9 studies described in the systematic review. A growing body of evidence has demonstrated that poor sleep quality, poor sleep efficiency and longer sleep onset latency values have negative effects on health. Poor sleep quality has in fact been associated with a higher risk of type 2 diabetes (93), overweight/obesity (94), metabolic syndrome (95) and depressive and anxiety symptoms (96, 97). Similarly, a prolonged sleep onset latency has been associated with metabolic syndrome (95), and with an increased risk of cardiovascular disease (CVD) (98), and depressive symptoms (99). Finally, poor sleep efficiency is associated with a higher risk of incident CVD (100) and depression (101). Almost all of the studies included in our systematic review reported an increase in sleep disturbances, consistently with two meta-analyses that found a higher prevalence of sleep disturbances during the lockdown with respect to non-lockdown periods (9, 10). We also found an increase in the incidence, prevalence and severity of insomnia, an increase in the symptoms of sleep onset insomnia, sleep maintenance insomnia and early morning awakening insomnia. There was likewise an increase in the use of sleep medication. These results are, anew, consistent with those of other works in the literature (15, 102, 103). A significant increase in the prevalence of moderate to severe insomnia was uncovered by a study examining 900 Italian adults at the time the first rigid lockdown was implemented (102). The International COVID-19 Sleep Study, a multinational survey carried out across 14 countries, uncovered a 10% increase in a range of sleep disturbances including worse sleep quality, sleep onset and sleep maintenance problems, and greater use of hypnotics during the pandemic with respect to the precedent period. Confinement was associated with poor sleep quality and problems falling asleep (103). Finally, a recent meta-analysis found a marked increase in subthreshold insomnia symptoms but not in moderate or severe insomnia during the COVID-19 pandemic (15). Some of the long-term consequences of insomnia include impairment in cognitive performance (104), an increased risk of depression (105), and CVD (106). The lockdown did not, however, have the same effect on everyone. Indeed, our meta-analysis showed that 18.6% of individuals experienced an improvement in sleep quality, and some studies included in the systematic review reported an increase in sleep efficiency (63, 83), a decrease in insomnia prevalence (34), in early awakening sleep onset insomnia (45, 46, 64), and in sleep medication consumption (43). A variety of factors could explain these improvements in sleep parameters. According to Kocevska’s study, the lockdown’s impact on sleep largely depended on the individual’s pre-pandemic sleep quality: persons who suffered from pre-pandemic insomnia (bad sleepers) reported an improvement in sleep quality, while good sleepers before the pandemic reported a worsening in sleep quality; moreover, negative affect and worry were also found to be associated to changes in sleep quality (107). Some changes in individuals’ work routine such as the transition to working from home due to the implementation of lockdown measures may have given some the opportunity to adapt their sleep schedules to their chronotype and to sleep more, as has been underlined by some studies reporting an increased sleep duration during the pandemic (7, 8). Scarpelli et al., who found an inverse association between sleep alterations and the stringency of governmental restrictions, hypothesized that strict measures may have led some to feel safer and less vulnerable toward the virus, which translated into lower levels of anxiety and fear and better sleep (12). In accordance with that line of thought, Salanti et al. underlined that despite the general increase in the symptoms of depression and anxiety, some studies uncovered an improvement in symptoms, and he hypothesized that stricter lockdown measures may have had a positive effect on the mental health of some (17). Other psychological factors such as a highly adaptive personality and higher resilience seemed to have been associated to better sleep quality (108, 109).
The decline in sleep quality and the rise in sleep disturbances emerging from our study and the possible negative consequences of these changes on mental and physical health are cause for concern. The COVID-19 pandemic was in fact characterized by more than one wave and several sleep variables seem to have been undermined by the repeated implementation of strict restrictive measures, which may have determined an onset in sleep disturbances or aggravated them. Riva et al. pointed out that the prevalence of insomnia did not diminish when pandemic restrictions were reduced or lifted but it began to normalize only several months later and it never returned to pre-pandemic levels (102). Two studies examining the evolution of sleep variables in Italian adults during the total and partial COVID-19 lockdowns found diversified sleep patterns. Conte et al. reported that the delayed sleep timing found during the first lockdown returned to pre-pandemic levels, probably due to normalized working schedules. Instead, sleep quality, which continued to worsen during both lockdowns, appeared to be particularly sensitive to psychological variables such as stress (110). Salfi et al. reported that with regard to the period between the first and second waves of the pandemic and their relative lockdowns, on the one hand, an improvement in the symptoms of insomnia and a reduction in the prevalence of moderate/severe insomnia were noted, but on the other, the percentage of poor sleepers remained high (111).
The changes emerging in this study can be attributed to a variety of factors. The reduction in physical activity levels related to lockdown measures could have negatively affected sleep quality (112). At the same time, the greater exposure to electronic devices reported during the lockdown may have worsened sleep quality and the symptoms of insomnia, reduced sleep duration, and determined a prolonged sleep onset latency (113). Psychological factors such as an increase in loneliness (114, 115), COVID-19-related worry (82), COVID-19-related stress (116), and depressive and anxiety disorders (117, 118) may have also contributed to these changes.
Our study has several strengths. First, this systematic review and meta-analysis provided a synthesis of changes in several sleep outcomes in the general population during the lockdown, which represented an unprecedented condition within the context of a pandemic and that had a dramatic impact on daily life. Moreover, a rigorous methodological approach was used to achieve an overview of all the sleep variables linked to sleep quality and sleep disturbances via an extensive search of published peer-reviewed, preprint articles and gray literature, and to ensure the quality of the assessments and the synthesis of data. We summarized data using a random-effects model with a more conservative estimate to address heterogeneity given the many different ways the data were synthetized and cultural diversity across countries. There are nevertheless some limitations that must be considered when interpreting our results. The first one is represented by the high risk of bias of several of the studies included. As uncovered by subgroup analysis, the changes in sleep quality and in particular percent changes were more pronounced in the low quality studies with respect to the high quality ones. Another limitation is linked to the measurement tools because the use of non-validated instruments may have led to underestimated values. Moreover, because of the small number of the studies and the heterogeneity of the data collected, it was possible to carry out subgroup analysis only by risk of bias and measurement tool. Other limitations are linked to the characteristics of the studies included here. The majority adopted a cross-sectional design meaning that they did not collect data before the lockdown and thus did not allow to have an exhaustive evaluation of the changes in sleep outcomes. Most of the studies used convenience samples whose participants were for the most part recruited through social networks, excluding therefore individuals who are not regular internet users, such as elderly persons; this may have affected the generalizability of our results (119). Almost all of the studies utilized self-reported instruments: while on the one hand, these seem to be more sensitive to sleep disturbances (120), on the other they tend to be subject to memory recall bias and to social desirability bias. Moreover, several studies utilized a single question to collect information about very complex sleep variables. Finally, the term lockdown was frequently used to describe different degrees of restrictive measures and this too may have affected the outcomes of the study.
The findings of the present work have several research and practical implications. If on the one hand the implementation of rigid restrictive measures permitted government authorities to limit the transmission of SARS-CoV-2 infection and to mitigate its impact on health systems, on the other it has had negative consequences on sleep health in the general population. Given the importance of good sleep for our physical and mental health, sleep problems need to be detected early and treated using appropriate interventions such as the cognitive behavioral treatment for insomnia that appears to have significant effects on insomnia severity, sleep efficiency, sleep quality, sleep onset latency, and the number of awakenings (121).
As far as research is concerned, studies evaluating if and to what degree the effects on sleep health linked to the pandemic and the restrictive measures have lingered over time are warranted. These works should seek to overcome some methodological limitations by using probability-based sampling methods, validated, standardized measurement tools, and longitudinal research designs. In addition, and as underlined by other authors, instruments that are able to describe and compare lockdown measures need to be developed (122).
Conclusion
The lockdown measures have had an important impact on sleep health in the general population. The current work uncovered a worsening in sleep quality and sleep efficiency, a prolonged sleep onset latency, and an increase in sleep disturbances and insomnia. Given the risk of chronicization of sleep disturbances and their negative impact on mental and physical health, early detection and timely interventions are crucial. High quality research based on the use of validated measurement tools and longitudinal research designs is needed to evaluate the long-term effect of lockdown measures and to identify individuals at a higher risk of developing sleep disturbances and the role of moderators.
Statements
Author contributions
FL, CT, FP, and SM conceptualized the study. FL, PS, and CT contributed to the investigation and literature search. FL contributed to the team supervision. EP and FR performed data screening and data extraction. PS contributed to the supervision, coordination of data coding, and statistical analysis. FL and PS wrote the original draft. FL, PS, CT, MN, FC, CC, SC, ER, EP, FR, FP, and SM edited and revised critically the manuscript. All authors contributed to the article and approved the submitted version.
Acknowledgments
We would like to thank Linda Inverso Moretti for reviewing the English version of this manuscript.
Conflict of interest
The authors declare that the research was conducted in the absence of any commercial or financial relationships that could be construed as a potential conflict of interest.
Publisher’s note
All claims expressed in this article are solely those of the authors and do not necessarily represent those of their affiliated organizations, or those of the publisher, the editors and the reviewers. Any product that may be evaluated in this article, or claim that may be made by its manufacturer, is not guaranteed or endorsed by the publisher.
Supplementary material
The Supplementary Material for this article can be found online at: https://www.frontiersin.org/articles/10.3389/fpsyt.2023.1166815/full#supplementary-material
References
1.
World Health Organization. WHO Director-General’s Opening Remarks at the Media Briefing on COVID-19–11 March 2020. Geneva: World Health Organization (2022).
2.
Perra N . Non-pharmaceutical interventions during the COVID-19 pandemic: a review.Phys Rep. (2021) 913:1–52. 10.1016/j.physrep.2021.02.001
3.
Riehm KE Badillo Goicoechea E Wang FM Kim E Aldridge LR Lupton-Smith CP et al Association of non-pharmaceutical interventions to reduce the spread of SARS-CoV-2 with anxiety and depressive symptoms: a multi-national study of 43 countries. Int J Public Health. (2022) 67:1604430. 10.3389/ijph.2022.1604430
4.
Toffolutti V Plach S Maksimovic T Piccitto G Mascherini M Mencarini L et al The association between COVID-19 policy responses and mental well-being: evidence from 28 European countries. Soc Sci Med. (2022) 301:114906. 10.1016/j.socscimed.2022.114906
5.
Adams-Prassl A Boneva T Golin M Rauh C . The impact of the coronavirus lockdown on mental health: evidence from the United States.Econ Policy. (2022) 37:139–55. 10.1093/epolic/eiac002
6.
Niedzwiedz CL Green MJ Benzeval M Campbell D Craig P Demou E et al Mental health and health behaviours before and during the initial phase of the COVID-19 lockdown: longitudinal analyses of the UK household longitudinal study. J Epidemiol Community Health. (2021) 75:224–31.
7.
Rezaei N Grandner MA . Changes in sleep duration, timing, and variability during the COVID-19 pandemic: large-scale Fitbit data from 6 major US cities.Sleep Health. (2021) 7:303–13. 10.1016/j.sleh.2021.02.008
8.
Yuan RK Zitting KM Maskati L Huang J . Increased sleep duration and delayed sleep timing during the COVID-19 pandemic.Sci Rep. (2022) 12:10937. 10.1038/s41598-022-14782-x
9.
Jahrami HA Alhaj OA Humood AM Alenezi AF Fekih-Romdhane F AlRasheed MM et al Sleep disturbances during the COVID-19 pandemic: a systematic review, meta-analysis, and meta-regression. Sleep Med Rev. (2022) 62:101591. 10.1016/j.smrv.2022.101591
10.
Alimoradi Z Gozal D Tsang HWH Lin CY Broström A Ohayon MM et al Gender-specific estimates of sleep problems during the COVID-19 pandemic: systematic review and meta-analysis. J Sleep Res. (2022) 31:e13432. 10.1111/jsr.13432
11.
Nochaiwong S Ruengorn C Thavorn K Hutton B Awiphan R Phosuya C et al Global prevalence of mental health issues among the general population during the coronavirus disease-2019 pandemic: a systematic review and meta-analysis. Sci Rep. (2021) 11:10173. 10.1038/s41598-021-89700-8
12.
Scarpelli S Zagaria A Ratti PL Albano A Fazio V Musetti A et al Subjective sleep alterations in healthy subjects worldwide during COVID-19 pandemic: a systematic review, meta-analysis and meta-regression. Sleep Med. (2022) 100:89–102. 10.1016/j.sleep.2022.07.012
13.
Medic G Wille M Hemels ME . Short- and long-term health consequences of sleep disruption.Nat Sci Sleep. (2017) 9:151–61. 10.2147/NSS.S134864
14.
Ramar K Malhotra RK Carden KA Martin JL Abbasi-Feinberg F Aurora RN et al Sleep is essential to health: an American academy of sleep medicine position statement. J Clin Sleep Med. (2021) 17:2115–9. 10.5664/jcsm.9476
15.
AlRasheed MM Fekih-Romdhane F Jahrami H Pires GN Saif Z Alenezi AF et al The prevalence and severity of insomnia symptoms during COVID-19: a global systematic review and individual participant data meta-analysis. Sleep Med. (2022) 100:7–23. 10.1016/j.sleep.2022.06.020
16.
Jahrami H BaHammam AS Bragazzi NL Saif Z Faris M Vitiello MV . Sleep problems during the COVID-19 pandemic by population: a systematic review and meta-analysis.J Clin Sleep Med. (2021) 17:299–313. 10.5664/jcsm.8930
17.
Salanti G Peter N Tonia T Holloway A White IR Darwish L et al The impact of the COVID-19 pandemic and associated control measures on the mental health of the general population: a systematic review and dose-response meta-analysis. Ann Intern Med. (2022) 175:1560–71. 10.7326/M22-1507
18.
Kunzler AM Röthke N Günthner L Stoffers-Winterling J Tüscher O Coenen M et al Mental burden and its risk and protective factors during the early phase of the SARS-CoV-2 pandemic: systematic review and meta-analyses. Glob Health. (2021) 17:34. 10.1186/s12992-021-00670-y
19.
Prati G Mancini AD . The psychological impact of COVID-19 pandemic lockdowns: a review and meta-analysis of longitudinal studies and natural experiments.Psychol Med. (2021) 51:201–11. 10.1017/S0033291721000015
20.
Page MJ McKenzie JE Bossuyt PM Boutron I Hoffmann TC Mulrow CD et al The PRISMA 2020 statement: an updated guideline for reporting systematic reviews. BMJ. (2021) 372:n71. 10.1136/bmj.n71
21.
Buysse DJ Reynolds IIICF Monk TH Berman SR Kupfer DJ . The Pittsburgh sleep quality index: a new instrument for psychiatric practice and research.Psychiatr Res. (1989) 28:193–213. 10.1016/0165-1781(89)90047-4
22.
Bastien CH Vallières A Morin CM . Validation of the insomnia severity index as an outcome measure for insomnia research.Sleep Med. (2001) 2:297–307. 10.1016/s1389-9457(00)00065-4
23.
Ohayon M Wickwire EM Hirshkowitz M Albert SM Avidan A Daly FJ et al National sleep foundation’s sleep quality recommendations: first report. Sleep Health. (2017) 3:6–19. 10.1016/j.sleh.2016.11.006
24.
Wells GA Shea B O’connell D Peterson J Welch V Losos M et al The Newcastle-Ottawa Scale (NOS) for Assessing the Quality of Nonrandomised Studies in Meta-Analyses. (2000). Available online at: http://www.ohri.ca/programs/clinical_epidemiology/oxford.htm (accessed June 1, 2022).
25.
Modesti PA Reboldi G Cappuccio FP Agyemang C Remuzzi G Rapi S et al Panethnic differences in blood pressure in Europe: a systematic review and meta-analysis. PLoS One. (2016) 11:e0147601. 10.1371/journal.pone.0147601
26.
Luchini C Stubbs B Solmi M Veronese N . Assessing the quality of studies in meta-analyses: advantages and limitations of the Newcastle Ottawa scale.World J Meta Anal. (2017) 5:80–4. 10.13105/wjma.v5.i4.8
27.
MedCalc Software Ltd. User-Friendly Statistical Software. Ostend: MedCalc Software Ltd (2022).
28.
Higgins JP Thompson SG Deeks JJ Altman DG . Measuring inconsistency in meta-analyses.BMJ. (2003) 327:557–60. 10.1136/bmj.327.7414.557
29.
Egger M Davey Smith G Schneider M Minder C . Bias in meta-analysis detected by a simple, graphical test.BMJ. (1997) 315:629–34. 10.1136/bmj.315.7109.629
30.
Aguiar SO Auad SM Silveira KSR Hermont AP Prado IM Reis TVD et al The impact of social distancing caused by the COVID-19 pandemic in dietary and sleep features of graduate and postgraduate university students with different chronotype profiles. Biol Rhythm Res. (2022) 53:1244–60. 10.1080/09291016.2021.1920733
31.
Allen SF Stevenson J Lazuras L Akram U . The role of the COVID-19 pandemic in altered psychological well-being, mental health and sleep: an online cross-sectional study.Psychol Health Med. (2022) 27:343–51. 10.1080/13548506.2021.1916963
32.
Al-Musharaf S Aljuraiban G Bogis R Alnafisah R Aldhwayan M Tahrani A . Lifestyle changes associated with COVID-19 quarantine among young Saudi women: a prospective study.PLoS One. (2021) 16:e0250625. 10.1371/journal.pone.0250625
33.
Ammar A Trabelsi K Brach M Chtourou H Boukhris O Masmoudi L et al Effects of home confinement on mental health and lifestyle behaviours during the COVID-19 outbreak: insights from the ECLB-COVID19 multicentre study. Biol Sport. (2021) 38:9–21. 10.5114/biolsport.2020.96857
34.
Bacaro V Chiabudini M Buonanno C De Bartolo P Riemann D Mancini F et al Insomnia in the Italian population during Covid-19 outbreak: a snapshot on one major risk factor for depression and anxiety. Front Psychiatry. (2020) 11:579107. 10.3389/fpsyt.2020.579107
35.
Beck F Léger D Fressard L Peretti-Watel P Verger P Coconel Group. Covid-19 health crisis and lockdown associated with high level of sleep complaints and hypnotic uptake at the population level. J Sleep Res. (2021) 30:e13119. 10.1111/jsr.13119
36.
Ben Salah A DeAngelis BN al’Absi M . Resilience and the role of depressed and anxious mood in the relationship between perceived social isolation and perceived sleep quality during the COVID-19 pandemic.Int J Behav Med. (2021) 28:277–85. 10.1007/s12529-020-09945-x
37.
Bigalke JA Greenlund IM Carter JR . Sex differences in self-report anxiety and sleep quality during COVID-19 stay-at-home orders.Biol Sex Differ. (2020) 11:56. 10.1186/s13293-020-00333-4
38.
Blume C Schmidt MH Cajochen C . Effects of the COVID-19 lockdown on human sleep and rest-activity rhythms.Curr Biol. (2020) 30:R795–7. 10.1016/j.cub.2020.06.021
39.
Brindal E Ryan JC Kakoschke N Golley S Zajac IT Wiggins B . Individual differences and changes in lifestyle behaviours predict decreased subjective well-being during COVID-19 restrictions in an Australian sample.J Public Health. (2022) 44:450–6. 10.1093/pubmed/fdab040
40.
Buoite Stella A AjÈeviÆ M Furlanis G Cillotto T Menichelli A Accardo A et al Smart technology for physical activity and health assessment during COVID-19 lockdown. J Sports Med Phys Fitness. (2021) 61:452–60. 10.23736/S0022-4707.20.11373-2
41.
Cancello R Soranna D Zambra G Zambon A Invitti C . Determinants of the lifestyle changes during COVID-19 pandemic in the residents of northern Italy.Int J Environ Res Public Health. (2020) 17:6287. 10.3390/ijerph17176287
42.
Cellini N Canale N Mioni G Costa S . Changes in sleep pattern, sense of time and digital media use during COVID-19 lockdown in Italy.J Sleep Res. (2020) 29:e13074. 10.1111/jsr.13074
43.
Cellini N Conte F De Rosa O Giganti F Malloggi S Reyt M et al Changes in sleep timing and subjective sleep quality during the COVID-19 lockdown in Italy and Belgium: age, gender and working status as modulating factors. Sleep Med. (2021) 77:112–9. 10.1016/j.sleep.2020.11.027
44.
Celorio-Sardà R Comas-Basté O Latorre-Moratalla ML Zerón-Rugerio MF Urpi-Sarda M Illán-Villanueva M et al Effect of COVID-19 lockdown on dietary habits and lifestyle of food science students and professionals from Spain. Nutrients. (2021) 13:1494. 10.3390/nu13051494
45.
Cheikh Ismail L Osaili TM Mohamad MN Al Marzouqi A Jarrar AH Abu Jamous DO et al Eating habits and lifestyle during COVID-19 lockdown in the united Arab emirates: a cross-sectional study. Nutrients. (2020) 12:3314. 10.3390/nu12113314
46.
Cheikh Ismail L Osaili TM Mohamad MN Al Marzouqi A Jarrar AH Zampelas A et al Assessment of eating habits and lifestyle during the coronavirus 2019 pandemic in the Middle East and North Africa region: a cross-sectional study. Br J Nutr. (2021) 126:757–66. 10.1017/S0007114520004547
47.
Chopra S Ranjan P Singh V Kumar S Arora M Hasan MS et al Impact of COVID-19 on lifestyle-related behaviours–a cross-sectional audit of responses from nine hundred and ninety-five participants from India. Diabetes Metab Syndr. (2020) 14:2021–30. 10.1016/j.dsx.2020.09.034
48.
Chouchou F Augustini M Caderby T Caron N Turpin NA Dalleau G . The importance of sleep and physical activity on well-being during COVID-19 lockdown: reunion Island as a case study.Sleep Med. (2021) 77:297–301. 10.1016/j.sleep.2020.09.014
49.
Diz-Ferreira E Díaz-Vidal P Da Cunha Soares Nicolau ML Criado-Santos MP Ayán C Diz JC . Efecto del confinamiento por la pandemia de COVID-19 sobre la calidad del sueño en Galicia [Effect of confinement during COVID-19 outbreak on sleep quality in Galicia].Rev Esp Salud Publica. (2021) 95:e202101001.
50.
Elhadi M Alsoufi A Msherghi A Alshareea E Ashini A Nagib T et al Psychological health, sleep quality, behavior, and internet use among people during the COVID-19 pandemic: a cross-sectional study. Front Psychiatry. (2021) 12:632496. 10.3389/fpsyt.2021.632496
51.
Evans S Alkan E Bhangoo JK Tenenbaum H Ng-Knight T . Effects of the COVID-19 lockdown on mental health, wellbeing, sleep, and alcohol use in a UK student sample.Psychiatry Res. (2021) 298:113819. 10.1016/j.psychres.2021.113819
52.
Fernández-Ballesteros R Sánchez-Izquierdo M . Health, psycho-social factors, and ageism in older adults in Spain during the COVID-19 pandemic.Healthcare (Basel). (2021) 9:256. 10.3390/healthcare9030256
53.
Flanagan EW Beyl RA Fearnbach SN Altazan AD Martin CK Redman LM . The impact of COVID-19 stay-at-home orders on health behaviors in adults.Obesity. (2021) 29:438–45. 10.1002/oby.23066
54.
Gao C Scullin MK . Sleep health early in the coronavirus disease 2019 (COVID-19) outbreak in the United States: integrating longitudinal, cross-sectional, and retrospective recall data.Sleep Med. (2020) 73:1–10. 10.1016/j.sleep.2020.06.032
55.
García-Esquinas E Ortolá R Gine-Vázquez I Carnicero JA Mañas A Lara E et al Changes in health behaviors, mental and physical health among older adults under severe lockdown restrictions during the COVID-19 pandemic in Spain. Int J Environ Res Public Health. (2021) 18:7067. 10.3390/ijerph18137067
56.
Ge F Zheng A Wan M Luo G Zhang J . Psychological state among the general Chinese population before and during the COVID-19 epidemic: a network analysis.Front Psychiatry. (2021) 2:591656. 10.3389/fpsyt.2021.591656
57.
Gupta R Grover S Basu A Krishnan V Tripathi A Subramanyam A et al Changes in sleep pattern and sleep quality during COVID-19 lockdown. Indian J Psychiatry. (2020) 62:370–8. 10.4103/psychiatry.IndianJPsychiatry_523_20
58.
Hetkamp M Schweda A Bäuerle A Weismüller B Kohler H Musche V et al Sleep disturbances, fear, and generalized anxiety during the COVID-19 shut down phase in Germany: relation to infection rates, deaths, and German stock index DAX. Sleep Med. (2020) 75:350–3. 10.1016/j.sleep.2020.08.033
59.
Hisler GC Twenge JM . Sleep characteristics of U.S. adults before and during the COVID-19 pandemic.Soc Sci Med. (2021) 276:113849. 10.1016/j.socscimed.2021.113849
60.
Ingram J Maciejewski G Hand CJ . Changes in diet, sleep, and physical activity are associated with differences in negative mood during COVID-19 lockdown.Front Psychol. (2020) 11:588604. 10.3389/fpsyg.2020.588604
61.
Innocenti P Puzella A Mogavero MP Bruni O Ferri R . Letter to editor: CoVID-19 pandemic and sleep disorders-a web survey in Italy.Neurol Sci. (2020) 41:2021–2. 10.1007/s10072-020-04523-1
62.
Knell G Robertson MC Dooley EE Burford K Mendez KS . Health behavior changes during COVID-19 Pandemic and subsequent “stay-at-home” orders.Int J Environ Res Public Health. (2020) 17:6268. 10.3390/ijerph17176268
63.
Kolokotroni O Mosquera MC Quattrocchi A Heraclides A Demetriou C Philippou E . Lifestyle habits of adults during the COVID-19 pandemic lockdown in Cyprus: evidence from a cross-sectional study.BMC Public Health. (2021) 21:786. 10.1186/s12889-021-10863-0
64.
Kontsevaya AV Mukaneeva DK Myrzamatova AO Okely AD Drapkina OM . Changes in physical activity and sleep habits among adults in Russian Federation during COVID-19: a cross-sectional study.BMC Public Health. (2021) 21:893. 10.1186/s12889-021-10946-y
65.
Leone MJ Sigman M Golombek DA . Effects of lockdown on human sleep and chronotype during the COVID-19 pandemic.Curr Biol. (2020) 30:R930–1. 10.1016/j.cub.2020.07.015
66.
Lin LY Wang J Ou-Yang XY Miao Q Chen R Liang FX et al The immediate impact of the 2019 novel coronavirus (COVID-19) outbreak on subjective sleep status. Sleep Med. (2021) 77:348–54. 10.1016/j.sleep.2020.05.018
67.
López-Moreno M López MTI Miguel M Garcés-Rimón M . Physical and psychological effects related to food habits and lifestyle changes derived from Covid-19 home confinement in the Spanish population.Nutrients. (2020) 12:3445. 10.3390/nu12113445
68.
Maher JP Hevel DJ Reifsteck EJ Drollette ES . Physical activity is positively associated with college students’ positive affect regardless of stressful life events during the COVID-19 pandemic.Psychol Sport Exerc. (2021) 52:101826. 10.1016/j.psychsport.2020.101826
69.
Majumdar P Biswas A Sahu S . COVID-19 pandemic and lockdown: cause of sleep disruption, depression, somatic pain, and increased screen exposure of office workers and students of India.Chronobiol Int. (2020) 37:1191–200. 10.1080/07420528.2020.1786107
70.
Mandelkorn U Genzer S Choshen-Hillel S Reiter J Meira E Cruz M et al Escalation of sleep disturbances amid the COVID-19 pandemic: a cross-sectional international study. J Clin Sleep Med. (2021) 17:45–53. 10.5664/jcsm.8800
71.
Marelli S Castelnuovo A Somma A Castronovo V Mombelli S Bottoni D et al Impact of COVID-19 lockdown on sleep quality in university students and administration staff. J Neurol. (2021) 268:8–15. 10.1007/s00415-020-10056-6
72.
Martínez-de-Quel Ó Suárez-Iglesias D López-Flores M Pérez CA . Physical activity, dietary habits and sleep quality before and during COVID-19 lockdown: a longitudinal study.Appetite. (2021) 158:105019. 10.1016/j.appet.2020.105019
73.
Martínez-Lezaun I Santamaría-Vázquez M Del Líbano M . Influence of confinement by COVID-19 on the quality of sleep and the interests of university students.Nat Sci Sleep. (2020) 12:1075–81. 10.2147/NSS.S280892
74.
Micheletti Cremasco M Mulasso A Moroni A Testa A Degan R Rainoldi A et al Relation among perceived weight change, sedentary activities and sleep quality during COVID-19 lockdown: a study in an academic community in northern Italy. Int J Environ Res Public Health. (2021) 18:2943. 10.3390/ijerph18062943
75.
Mititelu M . The impact of covid-19 lockdown on the lifestyle and dietary patterns among Romanian population.Farmacia. (2021) 69:1–11. 10.31925/farmacia.2021.1.1
76.
Okely JA Corley J Welstead M Taylor AM Page D Skarabela B et al Change in physical activity, sleep quality, and psychosocial variables during COVID-19 lockdown: evidence from the Lothian birth cohort 1936. Int J Environ Res Public Health. (2020) 18:210. 10.3390/ijerph18010210
77.
Ong JL Lau T Massar SAA Chong ZT Ng BKL Koek D et al COVID-19-related mobility reduction: heterogenous effects on sleep and physical activity rhythms. Sleep. (2021) 44:zsaa179. 10.1093/sleep/zsaa179
78.
Pépin JL Bailly S Mordret E Gaucher J Tamisier R Ben Messaoud R et al Greatest changes in objective sleep architecture during COVID-19 lockdown in night owls with increased REM sleep. Sleep. (2021) 44:zsab075. 10.1093/sleep/zsab075
79.
Pérez-Carbonell L Meurling IJ Wassermann D Gnoni V Leschziner G Weighall A et al Impact of the novel coronavirus (COVID-19) pandemic on sleep. J Thorac Dis. (2020) 12(Suppl. 2):S163–75. 10.21037/jtd-cus-2020-015
80.
Robinson E Boyland E Chisholm A Harrold J Maloney NG Marty L et al Obesity, eating behavior and physical activity during COVID-19 lockdown: a study of UK adults. Appetite. (2021) 156:104853. 10.1016/j.appet.2020.104853
81.
Rossinot H Fantin R Venne J . Behavioral changes during COVID-19 confinement in France: a web-based study.Int J Environ Res Public Health. (2020) 17:8444. 10.3390/ijerph17228444
82.
Saalwirth C Leipold B . Well-being and sleep in stressful times of the COVID-19 pandemic: relations to worrying and different coping strategies.Stress Health. (2021) 37:973–85. 10.1002/smi.3057
83.
Salehinejad MA Majidinezhad M Ghanavati E Kouestanian S Vicario CM Nitsche MA et al Negative impact of COVID-19 pandemic on sleep quantitative parameters, quality, and circadian alignment: implications for health and psychological well-being. EXCLI J. (2020) 19:1297–308. 10.17179/excli2020-2831
84.
Sañudo B Fennell C Sánchez-Oliver AJ . Objectively-assessed physical activity, sedentary behavior, smartphone use, and sleep patterns pre- and during-COVID-19 quarantine in young adults from Spain.Sustainability. (2020) 12:5890. 10.3390/su12155890
85.
Sella E Carbone E Toffalini E Borella E . Self-reported sleep quality and dysfunctional sleep-related beliefs in young and older adults: changes in times of COVID-19 lockdown.Sleep Med. (2021) 81:127–35. 10.1016/j.sleep.2021.02.017
86.
Sinha M Pande B Sinha R . Association of mid sleep time and social jetlag with psychosocial behaviour of Indian population during COVID-19 lockdown.J Public Health Res. (2020) 9:1870. 10.4081/jphr.2020.1870
87.
Stanton R To QG Khalesi S Williams SL Alley SJ Thwaite TL et al Depression, anxiety and stress during COVID-19: associations with changes in physical activity, sleep, tobacco and alcohol use in Australian adults. Int J Environ Res Public Health. (2020) 17:4065. 10.3390/ijerph17114065
88.
Trabelsi K Ammar A Masmoudi L Boukhris O Chtourou H Bouaziz B et al sleep quality and physical activity as predictors of mental wellbeing variance in older adults during COVID-19 Lockdown: ECLB COVID-19 international online survey. Int J Environ Res Public Health. (2021) 18:4329. 10.3390/ijerph18084329
89.
Trakada A Nikolaidis PT Andrade MDS Puccinelli PJ Economou NT Steiropoulos P et al Sleep during “Lockdown” in the COVID-19 pandemic. Int J Environ Res Public Health. (2020) 17:9094. 10.3390/ijerph17239094
90.
Wang X Lei SM Le S Yang Y Zhang B Yao W et al Bidirectional influence of the COVID-19 pandemic lockdowns on health behaviors and quality of life among Chinese adults. Int J Environ Res Public Health. (2020) 17:5575. 10.3390/ijerph17155575
91.
Zheng C Huang WY Sheridan S Sit CH Chen XK Wong SH . COVID-19 pandemic brings a sedentary lifestyle in young adults: a cross-sectional and longitudinal study.Int J Environ Res Public Health. (2020) 17:6035. 10.3390/ijerph17176035
92.
Zhu Q Li M Ji Y Shi Y Zhou J Li Q et al “Stay-at-Home” lifestyle effect on weight gain during the COVID-19 outbreak confinement in China. Int J Environ Res Public Health. (2021) 18:1813. 10.3390/ijerph18041813
93.
Lee JA Sunwoo S Kim YS Yu BY Park HK Jeon TH et al The effect of sleep quality on the development of type 2 diabetes in primary care patients. J Korean Med Sci. (2016) 31:240–6. 10.3346/jkms.2016.31.2.240
94.
Kristièeviæ T Štefan L Sporiš G . The associations between sleep duration and sleep quality with body-mass index in a large sample of young adults.Int J Environ Res Public Health. (2018) 15:758. 10.3390/ijerph15040758
95.
Okubo N Matsuzaka M Takahashi I Sawada K Sato S Akimoto N et al Relationship between self-reported sleep quality and metabolic syndrome in general population. BMC Public Health. (2014) 14:562. 10.1186/1471-2458-14-562
96.
Joo HJ Kwon KA Shin J Park S Jang SI . Association between sleep quality and depressive symptoms.J Affect Disord. (2022) 310:258–65. 10.1016/j.jad.2022.05.004
97.
Shen J Zhang H Wang Y Abdulai T Niu M Luo Z et al Dose-response association of sleep quality with anxiety symptoms in Chinese rural population: the Henan rural cohort. BMC Public Health. (2020) 20:1297. 10.1186/s12889-020-09400-2
98.
Kadier K Qin L Ainiwaer A Rehemuding R Dilixiati D Du YY et al Association of sleep-related disorders with cardiovascular disease among adults in the United States: a cross-sectional study based on national health and nutrition examination survey 2005-2008. Front Cardiovasc Med. (2022) 9:954238. 10.3389/fcvm.2022.954238
99.
Omichi C Kadotani H Sumi Y Ubara A Nishikawa K Matsuda A et al Prolonged sleep latency and reduced REM latency are associated with depressive symptoms in a Japanese working population. Int J Environ Res Public Health. (2022) 19:2112. 10.3390/ijerph19042112
100.
Yan B Yang J Zhao B Fan Y Wang W Ma X . Objective sleep efficiency predicts cardiovascular disease in a community population: the sleep heart health study.J Am Heart Assoc. (2021) 10:e016201. 10.1161/JAHA.120.016201
101.
Yan B Zhao B Jin X Xi W Yang J Yang L et al Sleep efficiency may predict depression in a large population-based study. Front Psychiatry. (2022) 13:838907. 10.3389/fpsyt.2022.838907
102.
Riva E Terraneo M Lucchini M Gerosa T . The prevalence of insomnia in different COVID-19 policy phases: longitudinal evidence from ITA.LI – Italian lives.BMC Public Health. (2022) 22:1657. 10.1186/s12889-022-14048-1
103.
Partinen M Holzinger B Morin CM Espie C Chung F Penzel T et al Sleep and daytime problems during the COVID-19 pandemic and effects of coronavirus infection, confinement and financial suffering: a multinational survey using a harmonised questionnaire. BMJ Open. (2021) 11:e050672. 10.1136/bmjopen-2021-050672
104.
Wardle-Pinkston S Slavish DC Taylor DJ . Insomnia and cognitive performance: a systematic review and meta-analysis.Sleep Med Rev. (2019) 48:101205. 10.1016/j.smrv.2019.07.008
105.
Li L Wu C Gan Y Qu X Lu Z . Insomnia and the risk of depression: a meta-analysis of prospective cohort studies.BMC Psychiatry. (2016) 16:375. 10.1186/s12888-016-1075-3
106.
Zheng B Yu C Lv J Guo Y Bian Z Zhou M et al Insomnia symptoms and risk of cardiovascular diseases among 0.5 million adults: a 10-year cohort. Neurology. (2019) 93:e2110–20. 10.1212/WNL.0000000000008581
107.
Kocevska D Blanken TF Van Someren EJW Rösler L . Sleep quality during the COVID-19 pandemic: not one size fits all.Sleep Med. (2020) 76:86–8. 10.1016/j.sleep.2020.09.029
108.
Ahmed O Hossain KN Siddique RF Jobe MC . COVID-19 fear, stress, sleep quality and coping activities during lockdown, and personality traits: a person-centered approach analysis.Pers Individ Differ. (2021) 178:110873. 10.1016/j.paid.2021.110873
109.
Lenzo V Sardella A Musetti A Freda MF Lemmo D Vegni E et al The relationship between resilience and sleep quality during the second wave of the COVID-19 pandemic: a longitudinal study. Nat Sci Sleep. (2022) 14:41. 10.2147/NSS.S344042
110.
Conte F Cellini N De Rosa O Rescott ML Malloggi S Giganti F et al Dissociated profiles of sleep timing and sleep quality changes across the first and second wave of the COVID-19 pandemic. J Psychiatr Res. (2021) 143:222–9. 10.1016/j.jpsychires.2021.09.025
111.
Salfi F D’Atri A Tempesta D Ferrara M . Sleeping under the waves: a longitudinal study across the contagion peaks of the COVID-19 pandemic in Italy.J. Sleep Res. (2021) 30:e13313. 10.1111/jsr.13313
112.
Diniz TA Christofaro DGD Tebar WR Cucato GG Botero JP Correia MA et al Reduction of physical activity levels during the COVID-19 pandemic might negatively disturb sleep pattern. Front Psychol. (2020) 11:586157. 10.3389/fpsyg.2020.586157
113.
Salfi F Amicucci G Corigliano D D’Atri A Viselli L Tempesta D et al Changes of evening exposure to electronic devices during the COVID-19 lockdown affect the time course of sleep disturbances. Sleep. (2021) 44:zsab080. 10.1093/sleep/zsab080
114.
Ernst M Niederer D Werner AM Czaja SJ Mikton C Ong AD et al Loneliness before and during the COVID-19 pandemic: a systematic review with meta-analysis. Am Psychol. (2022) 77:660–77. 10.1037/amp0001005
115.
Hom MA Chu C Rogers ML Joiner TEA . Meta-analysis of the relationship between sleep problems and loneliness.Clin Psychol Sci. (2020) 8:799–824. 10.1177/2167702620922969
116.
Werner A Kater MJ Schlarb AA Lohaus A . Sleep and stress in times of the COVID-19 pandemic: the role of personal resources.Appl Psychol Health Well Being. (2021) 13:935–51. 10.1111/aphw.12281
117.
COVID-19 Mental Disorders Collaborators. Global prevalence and burden of depressive and anxiety disorders in 204 countries and territories in 2020 due to the COVID-19 pandemic. Lancet. (2021) 398:1700–12. 10.1016/S0140-6736(21)02143-7
118.
Alvaro PK Roberts RM Harris JKA . Systematic review assessing bidirectionality between sleep disturbances, anxiety, and depression.Sleep. (2013) 36:1059–68. 10.5665/sleep.2810
119.
Pierce M McManus S Jessop C John A Hotopf M Ford T et al Says who? The significance of sampling in mental health surveys during COVID-19. Lancet Psychiatry. (2020) 7:567–8. 10.1016/S2215-0366(20)30237-6
120.
Pan CW Cong X Zhou HJ Li J Ssssun HP Xu Y et al Self-reported sleep quality, duration, and health-related quality of life in older Chinese: evidence from a rural town in Suzhou, China. J Clin Sleep Med. (2017) 13:967–74. 10.5664/jcsm.6696
121.
van Straten A van der Zweerde T Kleiboer A Cuijpers P Morin CM Lancee J . Cognitive and behavioral therapies in the treatment of insomnia: a meta-analysis.Sleep Med Rev. (2018) 38:3–16. 10.1016/j.smrv.2017.02.001
122.
Wunsch K Kienberger K Niessner C . Changes in physical activity patterns due to the Covid-19 pandemic: a systematic review and meta-analysis.Int J Environ Res Public Health. (2022) 19:2250. 10.3390/ijerph19042250
Summary
Keywords
sleep quality, sleep disturbances, sleep onset latency, sleep efficiency, insomnia, general population, COVID-19 lockdown, changes
Citation
Limongi F, Siviero P, Trevisan C, Noale M, Catalani F, Ceolin C, Conti S, di Rosa E, Perdixi E, Remelli F, Prinelli F and Maggi S (2023) Changes in sleep quality and sleep disturbances in the general population from before to during the COVID-19 lockdown: A systematic review and meta-analysis. Front. Psychiatry 14:1166815. doi: 10.3389/fpsyt.2023.1166815
Received
15 February 2023
Accepted
27 March 2023
Published
13 April 2023
Volume
14 - 2023
Edited by
Tarak Driss, Université Paris Nanterre, France
Reviewed by
Mohamed Romdhani, Le Mans Université, France; Maher Souabni, Université Paris Nanterre, France
Updates
Copyright
© 2023 Limongi, Siviero, Trevisan, Noale, Catalani, Ceolin, Conti, di Rosa, Perdixi, Remelli, Prinelli and Maggi.
This is an open-access article distributed under the terms of the Creative Commons Attribution License (CC BY). The use, distribution or reproduction in other forums is permitted, provided the original author(s) and the copyright owner(s) are credited and that the original publication in this journal is cited, in accordance with accepted academic practice. No use, distribution or reproduction is permitted which does not comply with these terms.
*Correspondence: Paola Siviero, paola.siviero@in.cnr.it; orcid.org/0000-0001-6567-5808
†These authors have contributed equally to this work and share first authorship
This article was submitted to Sleep Disorders, a section of the journal Frontiers in Psychiatry
Disclaimer
All claims expressed in this article are solely those of the authors and do not necessarily represent those of their affiliated organizations, or those of the publisher, the editors and the reviewers. Any product that may be evaluated in this article or claim that may be made by its manufacturer is not guaranteed or endorsed by the publisher.