 Ji Hyun An
 Kyung-do Han
 Hong Jin Jeon
- 1Department of Psychiatry, Depression Center, Samsung Medical Center, Sungkyunkwan University School of Medicine, Seoul, Republic of Korea
- 2Department of Statistics and Actuarial Science, Soongsil University, Seoul, Republic of Korea
- 3Department of Health Sciences and Technology, Department of Medical Device Management and Research, Department of Clinical Research Design and Evaluation, Samsung Advanced Institute for Health Sciences and Technology, Sungkyunkwan University, Seoul, Republic of Korea
Background and objectives: While variabilities in metabolic parameters (METv) have been linked to adverse health outcomes in type 2 DM, their association with depression is yet to be studied. This research aimed to investigate the association between METv and depressive disorder in patients with type 2 DM.
Methods: The study involved a nationwide cohort of 1,119,631 type 2 DM patients who had undergone three or more serial health examinations between 2005 and 2012. At each visit, body mass index (BMI), fasting glucose (FG), systolic blood pressure (BP), and total cholesterol (TC) were measured and stratified into quartiles, with Q4 being the highest and Q1 the lowest. The risk of depressive disorder was evaluated using Cox proportional hazard regression models, which accounted for METs in the indexes, after adjusting for sex, income status, lifestyle habits, medical comorbidities, DM severity, and baseline levels of BMI, FG, BP, and TC.
Results: During a mean follow-up period of 6.00 ± 2.42 years, 239,477 (21.4%) cases of type 2 DM patients developed depressive disorder. The risk of developing depressive disorder was gradually increased as the number of METv increased (HR 1.18; 95% CI 1.13, 1.23 for the group with the highest METv in all parameters compared to those with the lowest METv in all parameters). In the subgroup analysis, the risk of developing depressive disorder was 43% higher in men (HR 1.43; 95% CI 1.34, 1.51), and 31% higher in those younger than 65 years of age (HR 1.31; 95% CI 1.23, 1.39) in the group with the highest number of METv compared to the group with the lowest number of METv.
Conclusion: In type 2 DM, higher METv was an independent risk factor for depressive disorder. This risk is notably elevated in men and individuals under the age of 65 years.
Introduction
Type 2 diabetes mellitus (DM) affects a substantial portion of the global population, with an estimated prevalence of 6.4% and projected growth to impact about 300 million individuals by 2025 (1, 2). In addition to the cardiovascular complications traditionally associated with the disease, individuals with DM are also at an elevated risk of developing psychiatric conditions, particularly depression (3). This underscores the need for comprehensive healthcare approaches to address both the physical and mental health needs of patients with DM.
Depression is the most prevalent comorbid psychiatric condition in individuals with type 2 DM, with a prevalence that is approximately twice that of the general population (4). The burden of DM management and diagnosis can engender the onset of depressive symptoms, exacerbating the risk for complications related to hyperglycemia, diabetic complications, poor adherence to DM management, unhealthy lifestyles, and increased mortality rates (5–8). Therefore, early identification and management of depression risk factors hold considerable clinical significance in type 2 DM (9).
Individuals with DM frequently exhibit a range of metabolic syndromes, including obesity, dyslipidemia, hypertension, and insulin resistance, which result from disruptions in glucose homeostasis (10–12). Previous studies have highlighted the importance of metabolic risk management in mitigating adverse health outcomes, including depression (13, 14).
Furthermore, recent studies have suggested that not only the static magnitude of metabolic parameters but also their variabilities over time may increase the risk of adverse health outcomes. High variability in metabolic parameters (METv), such as body weight, blood glucose, cholesterol, or blood pressure, has been associated with cardiovascular disease and mortality in both the general population (15–17) and individuals with type 2 DM (18–20). Such METv tend to exist consistently by individual and has emerged as new disease-modifiable indicators in chronic metabolic diseases such as DM.
A few studies have evaluated the association between depression and METv, including body mass index, lipid, or blood glucose levels. A recent study demonstrated that several METv increased the risk of depression in the general population (21), and BMI variability was associated with depression in individuals with type 2 DM (22). However, the association between depression and a composite of such METv in individuals with DM has not been studied.
In this large nationwide population-based study, we investigated the association between METv and incident depressive disorder in individuals with type 2 DM. We hypothesized that higher METv would increase the risk of depressive disorder.
Methods
Data source
This retrospective, longitudinal cohort study utilized data from the Korean National Health Insurance System (NHIS), a comprehensive single insurer operated by the government that includes health information for about 97% of the Korean population (≥51 million). NHIS enrollees are recommended to undergo annual or biennial general health examinations that include standardized assessments of sociodemographic information (age, sex, and level of income), lifestyle habits (alcohol consumption, smoking, and regular exercise), anthropometric measurements, and laboratory tests. The quality of the health examination process is closely monitored by the NHIS, and the health examination data are linked to a nationwide medical claim database that includes clinical diagnoses, medical procedures, prescriptions, and healthcare service utilization as described elsewhere (23, 24). Since the insured essential health services are all registered to the NHIS system, nationwide-scale epidemiological studies dealing with medical outcomes have been vigorously generated using the NHIS database.
Study population
We identified 2,746,079 individuals with type 2 DM who underwent general health examinations between 1 January 2009 and 12 December 2012 (index year) and had undergone serial health examinations at least twice in the previous 5 years (between 1 January 2005 and 12 December 2008) to measure intra-metabolic variability. Exclusions were made for individuals younger than 20 years old (n = 390), missing data (n = 78,479), and those who developed depressive disorder within a 1-year lag period (n = 230,240), resulting in a final sample size of 1,119,631. The study was approved by the institutional review board of Samsung Medical Center, and informed consent was waived due to the use of de-identified and anonymous information.
Ascertainment of type 2 DM
Individuals with type 2 DM were identified based on the presence of ≥1 annual claim under International Classification of Diseases, Tenth Revision (ICD-10) codes of E11 to E14 and ≥1 annual claim for antidiabetic medication prescriptions, or based on a fasting glucose level of ≥126 mg/dL according to the operational definition of DM provided by the Korean Diabetes Association (25).
Definition of covariates and measurement
Sociodemographic information, including age, sex, and level of income (presented as quartile), as well as lifestyle habits, such as heavy drinking (defined as ≥30 g of alcohol per day), smoking (defined as current, past, and never), and regular exercise (defined as moderate intensity physical activity more than five times per week or vigorous-intensity physical activity more than three times per week), were obtained via self-questionnaire. Anthropometric measurements, including height, weight, and waist circumference, were obtained using standardized units and protocols. Body mass index (BMI) was calculated as the weight (kg) divided by the square of the height (m2). Blood pressure (BP) was measured as both systolic and diastolic pressure by an expert clinician after a 5-min seated rest. Blood sampling for serum fasting glucose and lipid levels and urine analysis were performed after an overnight fast.
We also collected medical covariates, including hypertension (defined as ≥1 annual claim under ICD-10 codes of I10–13 or I15 with a history of antihypertensive medication use, or with systolic/diastolic BP ≥ 140/90 mmHg), dyslipidemia (defined as ≥1 annual claim under ICD-10 codes of E78 with a history of lipid-lowering medication use or with a total cholesterol level ≥240 mg/dL), and chronic kidney disease [defined as estimated glomerular filtration rate (eGFR) of <60 ml/min/1.73 m2].
Definition of metabolic parameters
METv was defined as the intra-individual variability of body mass index (BMI), systolic blood pressure (BP), fasting glucose (FG), and total cholesterol (TC) values measured at each visit of the health examination, as these parameters have been widely studied in relation to metabolic variabilities and health outcomes (15, 21, 26–28). METv was calculated using the variability independent of the mean (VIM) method, which involves calculating the VIM as 100 × SD/meanβ, where β is the regression coefficient based on the natural logarithm of SD on the natural logarithm of the mean.
Given the absence of a specific cutoff point, we chose to classify the data into quartiles for the Variability Index Measurement (VIM) analysis, which is consistent with its utilization in previous studies (15, 21, 22). Individuals with type 2 DM were allocated into quartiles of METv (Q1 as the lowest, Q4 as the highest). “High” variability was defined as Q4 variability, while “low” variability was defined as the lower Q1–Q3 variability level of each metabolic parameter. A score of 0 indicates no high-variability parameter, while scores of 1–4 indicate the number of high-variability parameters out of the total four parameters. For instance, a score of 3 indicates high variability in three of the four parameters.
To assess the cumulative impact of METv, we assigned 0 points to Q1, 1 point to Q2, 2 points to Q3, and 3 points to Q4 for each of the metabolic parameters and summed the score. This generated a total METv score ranging from 0 to 12 points for each individual, with those scoring 0 points belonging to the Q1 group and those scoring 12 points belonging to the Q4 group for all four metabolic parameters.
Study outcomes and follow-up
The study endpoint was the diagnosis of newly developed depressive disorder, defined by the International Classification of Diseases, Tenth Revision (ICD-10) codes of F32.0–F33.9. To minimize confounding and reverse causality by pre-existing depression, we set a 1-year lag period following the index year. The study cohort was followed until the date of depression diagnosis or death or until the end of the study (31 December 2018).
Statistical analysis
Baseline characteristics were presented as mean ± standard deviation (SD) or as number (%). For the analysis of continuous variables, we performed ANOVA, while for the analysis of categorical variables, we conducted the chi-square test with the effect size calculated as the absolute standardized mean difference (ASD). Study cohorts were categorized into five groups according to the number of high METv, ranging from 0 to 4. The incidence rate of the primary outcome was calculated by dividing the number of cases by the total duration of follow-up, measured in person-years. The cumulative incidence of the primary outcome for each group was depicted in Kaplan-Meier estimates, due to the large sample size and a balanced distribution of baseline variables. Differences between groups were compared using the log-rank test.
The risk of newly diagnosed depressive disorder was assessed using a multivariable-adjusted Cox proportional hazards model, with results presented as hazard ratios (HR) and 95% confidence intervals (CI). We have assessed the proportional hazard assumption using Schoenfeld's residuals and the Log-Log plot, which confirmed that the assumption is satisfied. No significant deviation from proportionality over time was observed.
Model 1 was adjusted for age and sex. Model 2 was adjusted further for alcohol drinking, smoking, regular exercise, income status, and variables related to the severity of diabetes, including insulin use, the number of oral hypoglycemic agents (more than three medications), and the duration of DM (more than 5 years). Model 3 was finally adjusted further for baseline levels of BMI, BP, FBG, and TC.
Subgroup analyses were performed to explore the potential effect of modifiable confounders, including age, sex, baseline obesity (defined as BMI ≥ 25 kg/m2), existing medical comorbidities, and DM severity. Statistical analyses were conducted using the SAS version 9.4 (SAS Institute Inc.), with a significance level set at p < 0.05.
Results
Baseline characteristics
The study population consisted of 1,119,631 individuals with type 2 DM [762,538 (68.1%) men and 357,093 (31.9%) women]. Baseline characteristics of the study cohort were stratified by the number of high METv and are presented in Table 1. Individuals with high METv tended to be older and female, have lower income, a higher prevalence of hypertension, dyslipidemia, chronic kidney disease, and more advanced DM with higher fasting glucose levels and an increased number of antidiabetic medications or insulin use. In contrast, they exhibited lower mean values of weight, waist circumference, and body mass index (BMI), as well as lower levels of blood pressure and total cholesterol. Individuals with high METv also demonstrated a lower propensity for smoking, drinking, and regular exercise.
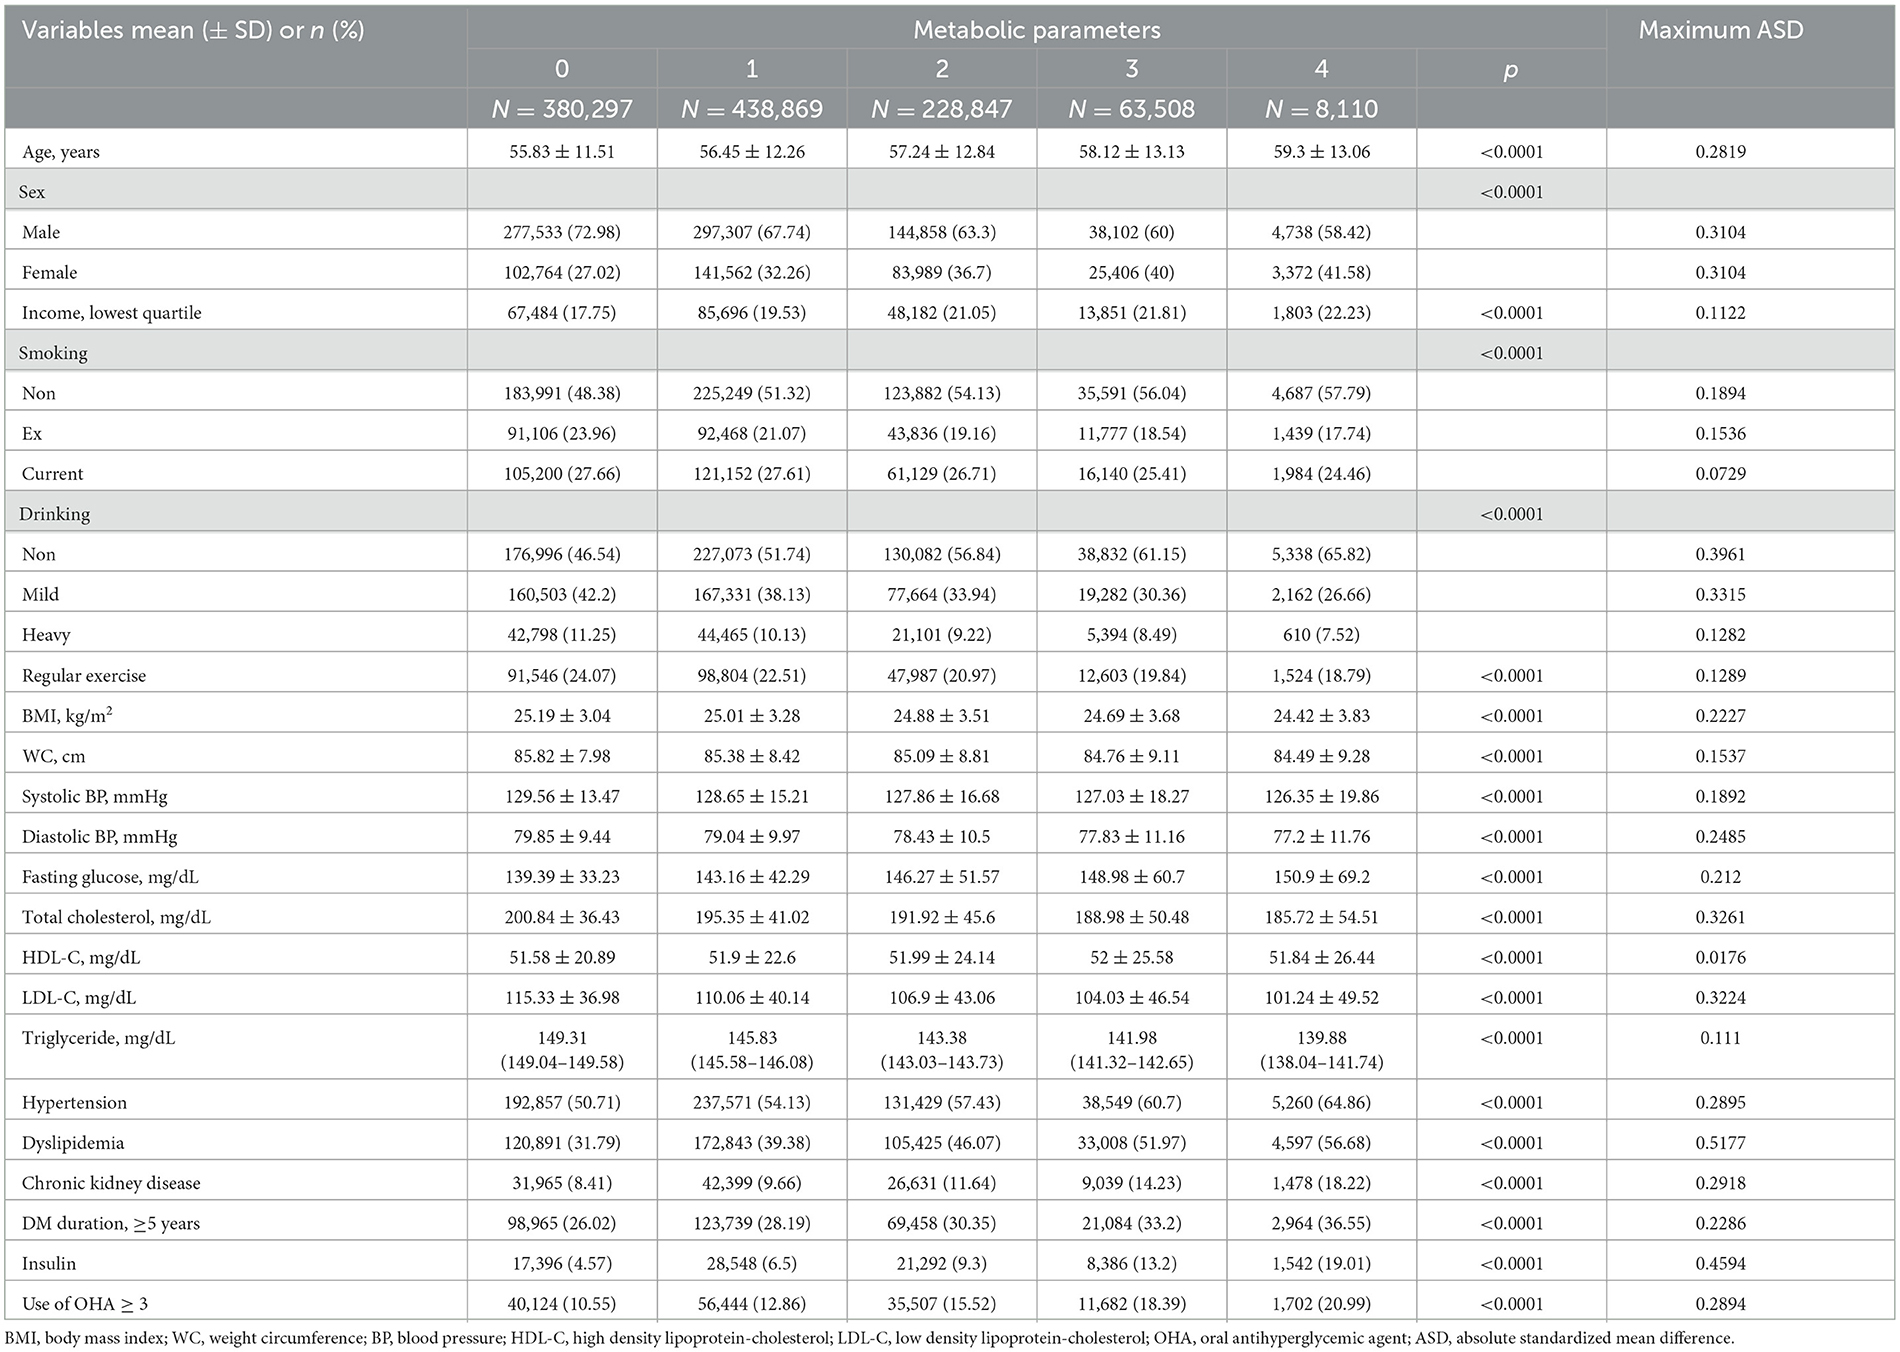
Table 1. Baseline characteristics of patients with type 2 DM according to the number of high metabolic variabilities.
Risk of the depressive disorder according to the variability of each metabolic parameters
During a mean follow-up period of 6.00 ± 2.42 (mean ± SD) years, 239,477 (21.4%) cases of newly diagnosed depressive disorder were observed. Incremental increases in the risk of depressive disorder were observed with increasing quartiles of each METv parameter in individuals with type 2 DM (Table 2). Compared to the lowest quartile (reference), the highest quartile of BMI variability increased the risk of depressive disorder by 12% (HR 1.10; 95% CI 1.10, 1.13), the highest quartile of SBP increased the risk by 6% (HR 1.06; 95% CI 1.04, 1.07), the highest quartile of fasting glucose increased the risk by 3% (HR 1.03; 95% CI 1.02, 1.04), and the highest quartile of total cholesterol increased the risk by 11% (HR 1.11; 95% CI 1.09, 1.12).
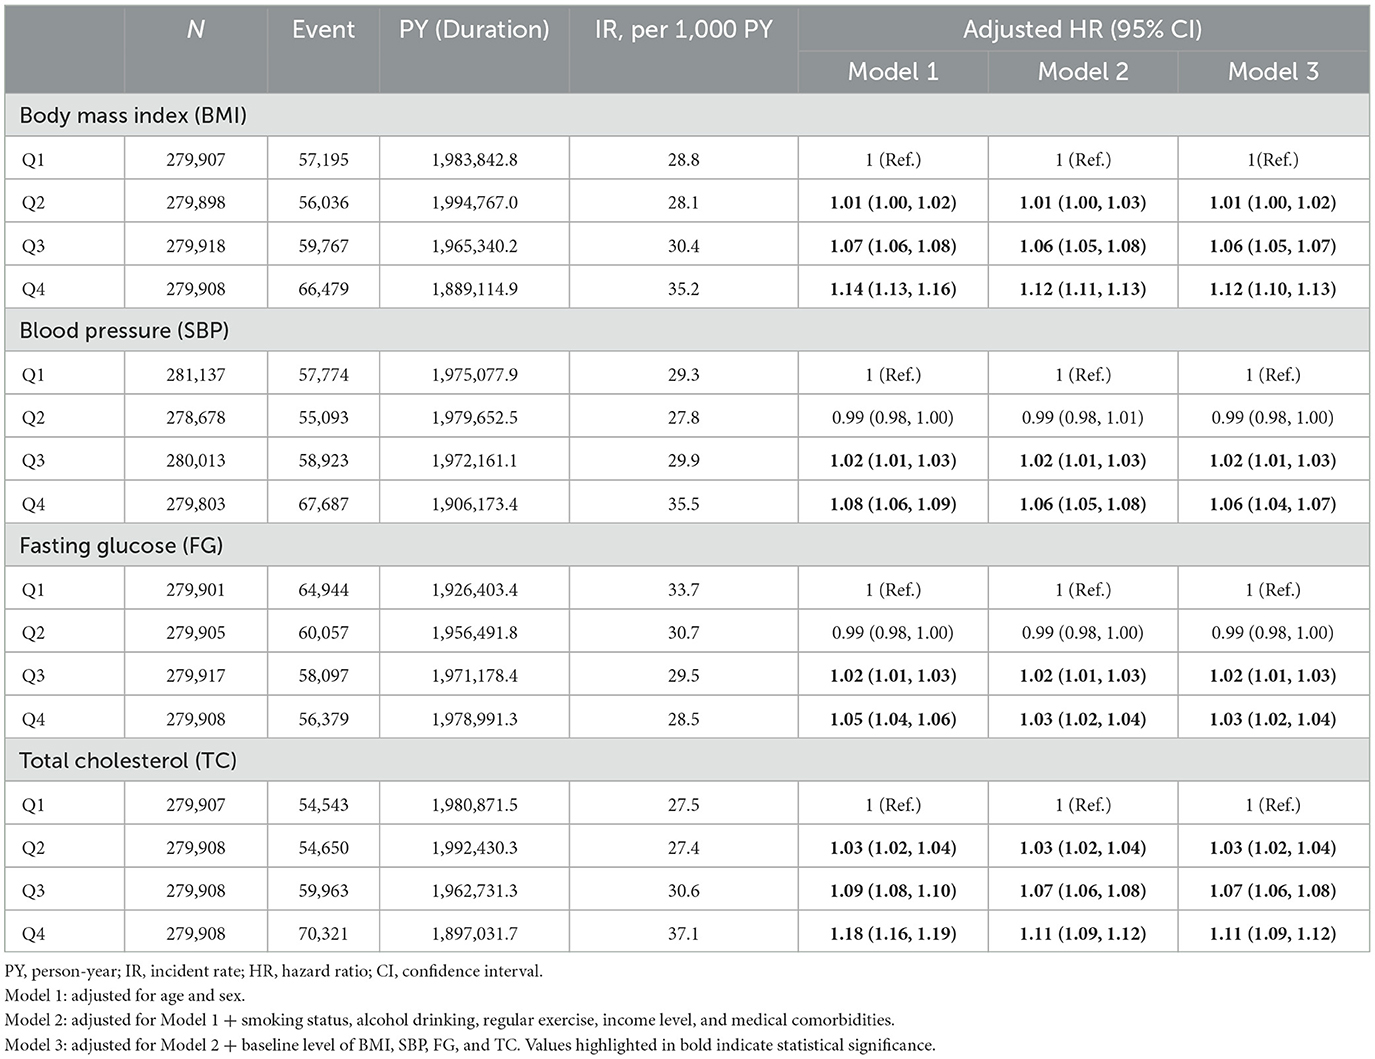
Table 2. Adjusted HR and 95% CI of depressive disorder by quartiles of variabilities in metabolic parameters in type 2 DM.
Risk of the depressive disorder according to the number of highest variability metabolic parameters
In individuals with type 2 DM, the risk of depressive disorder increased as the total number of high METv increased (Figure 1; Table 3). Compared to the group with the lowest number of high METv, the group with the highest number of high METv had a significantly higher risk of depressive disorder (HR 1.18; 95% CI 1.13, 1.23).
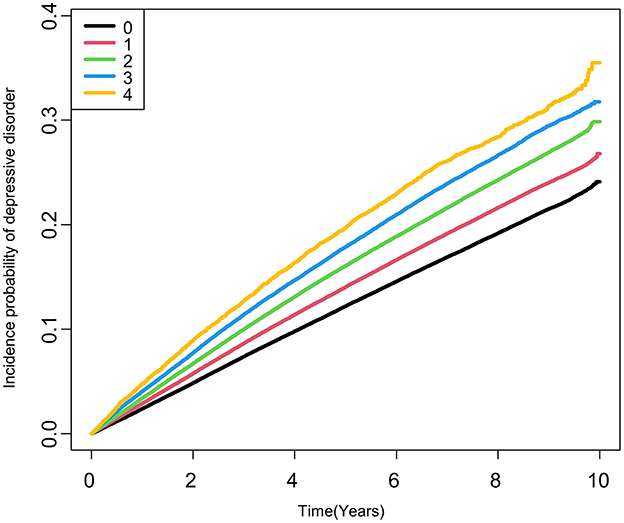
Figure 1. Kaplan-Meier estimates of cumulative incidence of depressive disorder according to the number of high metabolic variability in type 2 DM. High metabolic variabilities were defined as the fourth quartile of variabilities in each metabolic parameter.
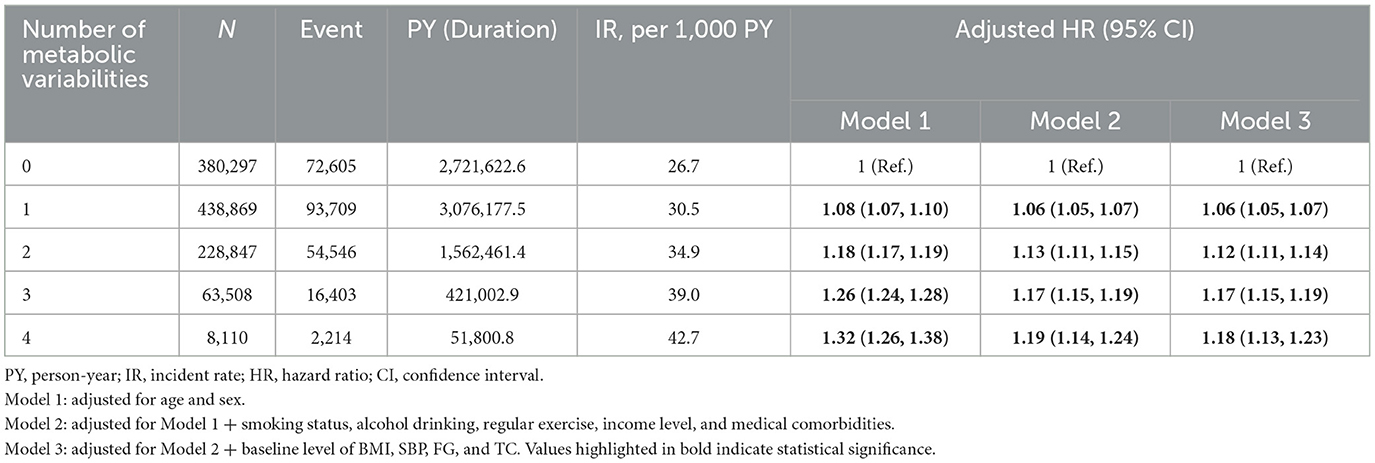
Table 3. Adjusted HR and 95 % CI of depressive disorder by summed number of high metabolic variability type 2 DM.
The incidence rate and risk of depressive disorder showed a linear increase as the METv score increased (ranging from 0 to 12 points), with a 28% increased risk (HR 1.28; 95% CI 1.19, 1.37) observed in the group with 12 points compared to the group with 0 points (Figure 2; Supplementary Table 1).
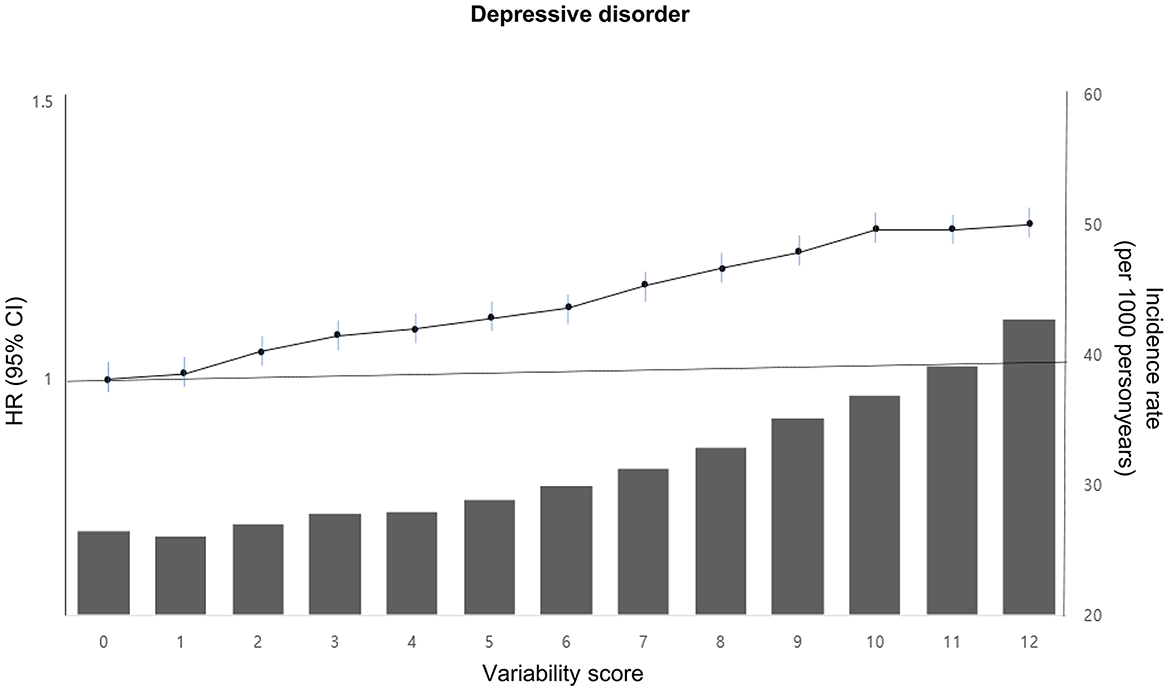
Figure 2. Incidence rate, adjusted HR, and 95% CI of depressive disorder according to the metabolic variability score in type 2 DM. The variability score for each of the four parameters (BMI, SBP, FG, and TC) was calculated by assigning points based on quartiles of variability. The lowest quartile (Q1) received 0 points, the second quartile (Q2) received 1 point, the third quartile (Q3) received 2 points, and the highest quartile (Q4) received 3 points. The total points were then summed for each individual to obtain a variability score ranging from 0 to 12. This score was adjusted for age, sex, alcohol drinking, smoking, regular exercise, income status, medical comorbidities, DM medications, and baseline levels of BMI, SBP, FG, and TC.
Subgroup analysis
Figure 3 depicts the risk of newly diagnosed depressive disorder based on age, sex, and BMI stratification, along with the number of high METv. The analysis showed higher adjusted hazard ratios (HR) of depression in subgroups with age <65 years, male, and obese. Specifically, the male subgroup had a 43% increased risk of depressive disorder (HR 1.43; 95% CI 1.34, 1.51), while the subgroup <65 years had a 31% increased risk (HR 1.31; 95% CI 1.23, 1.39) in the group with the highest number of high METv, compared to the group with the least number of high METv. In addition, the subgroup with the presence of medical comorbidities including chronic kidney disease and a longer duration of DM also showed a greater risk of depressive disorder as the number of metabolic variabilities increased (Supplementary Table 2).
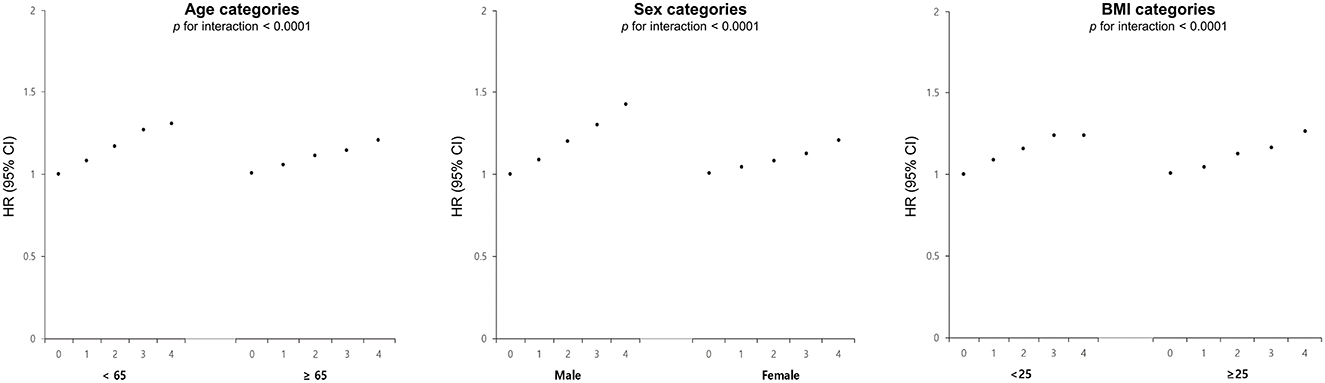
Figure 3. Adjusted HR and 95% CI of depressive disorder stratified by age, sex, and BMI categories according to the number of high metabolic variability in type 2 DM. This score was adjusted for age, sex, alcohol drinking, smoking, regular exercise, income status, medical comorbidities, DM medications, and baseline levels of BMI, SBP, FG, and TC.
Discussion
This study demonstrated the association between higher variability in BMI, SBP, FBG, and TC and higher risk for the development of depressive disorder in individuals with type 2 DM. We further found that the number of elevated metabolic variabilities was associated with new-onset depressive disorder in a graded manner. These associations persisted after multivariable adjustment including baseline metabolic parameters and medical comorbidities. Also, the effects of metabolic variability on depressive disorder were more pronounced in both men and those aged under 65 years.
In this study, 22% of individuals with type 2 DM have developed incident depression, which is comparable to previous studies (29). A number of biological processes, as well as the emotional disease burden, have been suggested to explain the high prevalence of depression in DM. Impaired insulin-glucose homeostasis cause activation of the hypothalamic-pituitary-adrenal (HPA) axis, dysfunction in the autonomic nervous system, or a pro-inflammatory state, and consequently alteration in metabolic networks (30–34). It may affect the production and transport of mood-regulatory neurotransmitters, such as brain-derived neurotrophic factor, neural growth, change in cerebral blood flow, and microvascular damage, which are known to be potential etiological mechanisms of depression (35–37). Also, the presence of coexisting metabolic syndrome in DM may hasten the onset of depression (38–40).
This study further highlighted that the composite of METv in type 2 DM was independently associated with incident depression even after adjusting the presence of metabolic syndromes. METv in type 2 DM has already been recognized as a critical concern, associated with an increased risk of medical comorbidities such as cardiovascular events, dementia, and elevated mortality rates (41, 42), but our study advances current knowledge by uncovering a significant association between METv and psychiatric symptoms, particularly depression in type 2 DM patients. While there is one comparable study demonstrating a similar association in non-diabetic populations (21), it is vital to underscore that metabolic variabilities are more prominent within metabolic disorders like diabetes and present a potentially modifiable target.
The development of metabolic variability in patients with DM is a complex and multi-factorial process that may involve an interplay between genetic and environmental factors (43–46). Also, the lifestyle factors, such as an unhealthy diet and physical inactivity and changes in the treatment regimen, including changes in insulin dose or the addition of other medications, can also impact the metabolic status of these individuals. It is imperative to recognize the bidirectional relationship between lifestyle changes, stigmatization of diabetes, emotional burden, and metabolic status, as it can ultimately lead to the development of depression.
The underlying mechanisms linking metabolic variability and depression are not well-understood. A few studies have postulated possible mechanisms of depression in each independent metabolic variability. Increased glucose variability might be related to changes in insulin sensitivity, insulin secretion, and increased oxidative stress on the endothelial function, which results in atherosclerotic change (47, 48). Blood pressure variability is an independent risk of micro-macrovascular complications and can impair cerebral blood flow (49, 50). BMI variabilities involve changes in appetite regulation, energy metabolism, and neuroendocrine function that occur with depression (22, 51). Cholesterol variability cause dysfunction in lipid metabolism, altering cellular membrane function, impairment in the production of stress hormones (45, 52). These variabilities result in alterations in neuronal plasticity, cellular architecture, decreased cellular resilience, or structural abnormalities in the brain (53, 54).
Rather than ascribing the complex etiology of depression to a singular factor, it is more prudent to contemplate a multifactorial approach that incorporates various metabolic variabilities, given their coexistence and the interdependent relationship between multiple metabolic parameters. Notably, changes in one metabolic factor can exert an effect on other interconnected metabolic factors, such as the association between glycemic change and blood pressure fluctuations (55–57). Further research is warranted to ascertain the precise nature of these associations, elucidate whether they are direct or indirect, and discern whether they stem from shared risk factors.
Furthermore, metabolic variability may serve as a clinical marker of underlying frailty or incipient stages of disease. Given the bidirectional association between DM and depression, wherein each condition can impact the other, metabolic variability may potentially represent a prodromal or early phase of depression (10, 58, 59). Additionally, as depression can trigger disruptions in neuroendocrine or immune function, the identification of metabolic variability could hold considerable value as an early predictor of depressive symptoms (60, 61).
The subgroup analysis revealed that high metabolic variability confers a greater risk of depression in men with type 2 DM, increasing it by approximately 40%. The elevated risk of depression in men with high metabolic variability may be due to several mechanisms. While depression is typically more prevalent in women, the negative health impact of metabolic syndrome is often more pronounced in women than in men (62). However, given the inherent metabolic vulnerability in DM (63), it appears that resilience to metabolic variability may be more reduced in men. Differences in hormonal factors, including visceral adipocyte activity, adrenergic stimulation, and sex hormones, may contribute to a higher risk of depression in men with DM (64, 65). Additionally, sex-specific differences in the pathophysiology of DM, such as those related to glucose and lipid metabolism, may further influence the association between depression and DM (66). However, women with type 2 DM may have a higher prevalence of comorbidities, such as cardiovascular disease and metabolic syndrome, which can exacerbate the impact of metabolic variability on the risk of depression (67). These findings underscore the need for gender-specific research in the identification and management of metabolic factors that may influence depression risk in DM.
Our findings also suggest that the impact of metabolic variability on depression is particularly notable in individuals under the age of 65 years. While the risk of metabolic disease, including type 2 DM, tends to increase with age due to declining metabolic homeostasis regulation (68, 69), recent research suggests that younger individuals may experience a higher level of metabolic variability (70, 71). This variability may arise from a range of lifestyle factors, including poor dietary habits, high calorie and fat intake, physical inactivity, and irregular sleep patterns, as well as genetic predisposition such as insulin resistance, which is particularly relevant to metabolic variability in younger age groups (72). These results highlight the complex interplay of genetic and environmental factors in shaping metabolic variability in younger individuals, emphasizing the critical need for early detection of metabolic disturbances and lifestyle interventions in this population.
Strengths and limitations
This is the first study to investigate the association between metabolic variability and the development of depression in type 2 DM. Moreover, the study entailed a substantial sample size of DM patients at a national level, with systematic and repeated assessments of metabolic parameters. In addition, the investigation examined not only a single factor but also a combination of multiple metabolic variabilities, which better represent real-life situations.
There are several limitations to this study. First, the diagnosis of depression was based on claim data, which may have underestimated the true prevalence of depression compared to clinically diagnosed cases. Second, although we excluded prior depression and applied a lag period, retrospective study designs like ours may be limited in detecting reverse causality between depression and DM. Future research should consider extending lag periods and utilizing prospective designs for a more robust causality analysis. Furthermore, the prodromal phase of depression may not have been fully captured in our study. Third, our investigation focused exclusively on the amplitude of metabolic variabilities and did not examine their directional impact, such as increased, decreased, or sustained changes. As such, future research is warranted to determine whether the direction of metabolic changes may influence the development of depression. Fourth, unmeasured confounders may exist, which could impact the development of depression. Finally, our study population consisted of individuals covered by NHIS and therefore did not include individuals who are not covered by this healthcare system.
Conclusion
In type 2 DM, the variability of metabolic parameters was an independent risk factor for depressive disorder. This risk is notably elevated in men and individuals under the age of 65 years. Thorough comprehension of the underlying mechanisms responsible for metabolic variability is pivotal for the successful management of depression in patients with type 2 DM.
Data availability statement
The raw data supporting the conclusions of this article will be made available by the authors, without undue reservation.
Ethics statement
The studies involving human participants were reviewed and approved by the Institutional Review Board of Samsung Medical Center. Written informed consent for participation was not required for this study in accordance with the national legislation and the institutional requirements.
Author contributions
JHA participated in the study design, conception, wrote the first manuscript drafting, and revised new drafts from KDH and HJJ. KDH conceptualized the study and participated in the directed acquisition of the data and data analysis. HJJ participated in the whole study design, conception, and manuscript drafting. All authors read and approved the final manuscript.
Funding
This study was supported by the Bio and Medical Technology Development Program of the National Research Foundation (NRF) funded by the Ministry of Science and ICT (No. 2021M3A9E4080784). This work was also supported by a grant (HR21C0885) of the Korea Health Technology R&D Project through the Korea Health Industry Development Institute (KHIDI) funded by the Ministry of Health and Welfare, Republic of Korea.
Conflict of interest
The authors declare that the research was conducted in the absence of any commercial or financial relationships that could be construed as a potential conflict of interest.
Publisher's note
All claims expressed in this article are solely those of the authors and do not necessarily represent those of their affiliated organizations, or those of the publisher, the editors and the reviewers. Any product that may be evaluated in this article, or claim that may be made by its manufacturer, is not guaranteed or endorsed by the publisher.
Supplementary material
The Supplementary Material for this article can be found online at: https://www.frontiersin.org/articles/10.3389/fpsyt.2023.1217104/full#supplementary-material
References
1. Green A, Christian Hirsch N, Pramming SK. The changing world demography of type 2 diabetes. Diabetes Metab Res Rev. (2003) 19:3–7. doi: 10.1002/dmrr.340
2. Roglic G. WHO Global report on diabetes: a summary. Int J Noncommun Dis. (2016) 1:3–8. doi: 10.4103/2468-8827.184853
3. Semenkovich K, Brown ME, Svrakic DM, Lustman PJ. Depression in type 2 diabetes mellitus: prevalence, impact, and treatment. Drugs. (2015) 75:577–87. doi: 10.1007/s40265-015-0347-4
4. Anderson RJ, Freedland KE, Clouse RE, Lustman PJ. The prevalence of comorbid depression in adults with diabetes: a meta-analysis. Diabetes Care. (2001) 24:1069–78. doi: 10.2337/diacare.24.6.1069
5. Kruse J, Schmitz N, Thefeld W, GNHI Examination Survey. On the association between diabetes and mental disorders in a community sample: results from the German National Health Interview and Examination Survey. Diabetes Care. (2003) 26:1841–6. doi: 10.2337/diacare.26.6.1841
6. Khan P, Qayyum N, Malik F, Khan T, Khan M, Tahir A. Incidence of anxiety and depression among patients with type 2 diabetes and the predicting factors. Cureus. (2019) 11:e4254. doi: 10.7759/cureus.4254
7. Nouwen A, Adriaanse MC, van Dam K, Iversen MM, Viechtbauer W, Peyrot M, et al. Longitudinal associations between depression and diabetes complications: a systematic review and meta-analysis. Diabet Med. (2019) 36:1562–72. doi: 10.1111/dme.14054
8. Wu CS, Hsu LY, Wang SH. Association of depression and diabetes complications and mortality: a population-based cohort study. Epidemiol Psychiatr Sci. (2020) 29:e96. doi: 10.1017/S2045796020000049
9. Owens-Gary MD, Zhang X, Jawanda S, Bullard KM, Allweiss P, Smith BD. The importance of addressing depression and diabetes distress in adults with type 2 diabetes. J Gen Intern Med. (2019) 34:320–4. doi: 10.1007/s11606-018-4705-2
10. Grundy SM. Pre-diabetes, metabolic syndrome, and cardiovascular risk. J Am Coll Cardiol. (2012) 59:635–43. doi: 10.1016/j.jacc.2011.08.080
11. Grundy SM, Cleeman JI, Daniels SR, Donato KA, Eckel RH, Franklin BA, et al. Diagnosis and management of the metabolic syndrome: an American Heart Association/National Heart, Lung, and Blood Institute Scientific Statement. Circulation. (2005) 112:2735–52. doi: 10.1161/CIRCULATIONAHA.105.169404
12. Alberti KG, Zimmet P, Shaw J, IDF Epidemiology Task Force Consensus Group. The metabolic syndrome–a new worldwide definition. Lancet. (2005) 366:1059–62. doi: 10.1016/S0140-6736(05)67402-8
13. McCaffery JM, Niaura R, Todaro JF, Swan GE, Carmelli D. Depressive symptoms and metabolic risk in adult male twins enrolled in the National Heart, Lung, and Blood Institute twin study. Psychosom Med. (2003) 65:490–7. doi: 10.1097/01.PSY.0000041545.52924.82
14. Marazziti D, Rutigliano G, Baroni S, Landi P, Dell'Osso L. Metabolic syndrome and major depression. CNS Spectr. (2014) 19:293–304. doi: 10.1017/S1092852913000667
15. Kim MK, Han K, Park YM, Kwon HS, Kang G, Yoon KH, et al. Associations of variability in blood pressure, glucose and cholesterol concentrations, and body mass index with mortality and cardiovascular outcomes in the general population. Circulation. (2018) 138:2627–37. doi: 10.1161/CIRCULATIONAHA.118.034978
16. Wu M, Shu Y, Wang L, Song L, Chen S, Liu Y, et al. Visit-to-visit variability in the measurements of metabolic syndrome components and the risk of all-cause mortality, cardiovascular disease, and arterial stiffness. Nutr Metab Cardiovasc Dis. (2021) 31:2895–903. doi: 10.1016/j.numecd.2021.07.004
17. Sponholtz TR, van den Heuvel ER, Xanthakis V, Vasan RS. Association of variability in body mass index and metabolic health with cardiometabolic disease risk. J Am Heart Assoc. (2019) 8:e010793. doi: 10.1161/JAHA.118.010793
18. Chiriaco M, Pateras K, Virdis A, Charakida M, Kyriakopoulou D, Nannipieri M, et al. Association between blood pressure variability, cardiovascular disease and mortality in type 2 diabetes: a systematic review and meta-analysis. Diabetes Obes Metab. (2019) 21:2587–98. doi: 10.1111/dom.13828
19. Buscemi S, Re A, Batsis JA, Arnone M, Mattina A, Cerasola G, et al. Glycaemic variability using continuous glucose monitoring and endothelial function in the metabolic syndrome and in Type 2 diabetes. Diabet Med. (2010) 27:872–8. doi: 10.1111/j.1464-5491.2010.03059.x
20. Luk AO, Ma RC, Lau ES, Yang X, Lau WW, Yu LW, et al. Risk association of HbA1c variability with chronic kidney disease and cardiovascular disease in type 2 diabetes: prospective analysis of the Hong Kong Diabetes Registry. Diabetes Metab Res Rev. (2013) 29:384–90. doi: 10.1002/dmrr.2404
21. Baek JH, Shin DW, Fava M, Mischoulon D, Kim H, Park MJ, et al. Increased metabolic variability is associated with newly diagnosed depression: a nationwide cohort study. J Affect Disord. (2021) 294:786–93. doi: 10.1016/j.jad.2021.07.006
22. An JH, Han KD, Jung JH, Yoo J, Fava M, Mischoulon D, et al. High bodyweight variability increases depression risk in patients with type 2 diabetes mellitus: a nationwide cohort study in Korea. Front Psychiatry. (2021) 12:765129. doi: 10.3389/fpsyt.2021.765129
23. Seong SC, Kim YY, Park SK, Khang YH, Kim HC, Park JH, et al. Cohort profile: the National Health Insurance Service-National Health Screening Cohort (NHIS-HEALS) in Korea. BMJ Open. (2017) 7:e016640. doi: 10.1136/bmjopen-2017-016640
24. Lee J, Lee JS, Park SH, Shin SA, Kim K. Cohort profile: The National Health Insurance Service-National Sample Cohort (NHIS-NSC), South Korea. Int J Epidemiol. (2017) 46:e15. doi: 10.1093/ije/dyv319
25. Lee YH Han K Ko SH Ko KS Lee KU Taskforce Taskforce Team of Diabetes Fact Sheet of the Korean Diabetes Association. Data Analytic Process of a Nationwide Population-Based Study Using National Health Information Database Established by National Health Insurance Service. Diabetes Metab J. (2016) 40:79–82. doi: 10.4093/dmj.2016.40.1.79
26. Kim MK, Han K, Kim HS, Park YM, Kwon HS, Yoon KH, et al. Effects of variability in blood pressure, glucose, and cholesterol concentrations, and body mass index on end-stage renal disease in the general population of Korea. J Clin Med. (2019) 8:755. doi: 10.3390/jcm8050755
27. Kwon S, Lee SR, Choi EK, Lee SH, Han KD, Lee SY, et al. Visit-to-visit variability of metabolic parameters and risk of heart failure: a nationwide population-based study. Int J Cardiol. (2019) 293:153–8. doi: 10.1016/j.ijcard.2019.06.035
28. Lee JE, Han K, Yoo J, Yeo Y, Cho IY, Cho B, et al. Association of metabolic parameter variability with esophageal cancer risk: a nationwide population-based study. J Pers Med. (2022) 12:375. doi: 10.3390/jpm12030375
29. Roy T, Lloyd CE. Epidemiology of depression and diabetes: a systematic review. J Affect Disord. (2012) 142(Suppl.):S8–21. doi: 10.1016/S0165-0327(12)70004-6
30. McIntyre RS, Soczynska JK, Konarski JZ, Woldeyohannes HO, Law CW, Miranda A, et al. Should depressive syndromes be reclassified as “metabolic syndrome type II”? Ann Clin Psychiatry. (2007) 19:257–64. doi: 10.1080/10401230701653377
31. Champaneri S, Wand GS, Malhotra SS, Casagrande SS, Golden SH. Biological basis of depression in adults with diabetes. Curr Diab Rep. (2010) 10:396–405. doi: 10.1007/s11892-010-0148-9
32. Joseph JJ, Golden SH. Cortisol dysregulation: the bidirectional link between stress, depression, and type 2 diabetes mellitus. Ann N Y Acad Sci. (2017) 1391:20–34. doi: 10.1111/nyas.13217
33. Moulton CD, Pickup JC, Ismail K. The link between depression and diabetes: the search for shared mechanisms. Lancet Diabetes Endocrinol. (2015) 3:461–71. doi: 10.1016/S2213-8587(15)00134-5
34. Kiecolt-Glaser JK, Derry HM, Fagundes CP. Inflammation: depression fans the flames and feasts on the heat. Am J Psychiatry. (2015) 172:1075–91. doi: 10.1176/appi.ajp.2015.15020152
35. Kumar A, Gupta R, Thomas A, Ajilore O, Hellemann G. Focal subcortical biophysical abnormalities in patients diagnosed with type 2 diabetes and depression. Arch Gen Psychiatry. (2009) 66:324–30. doi: 10.1001/archgenpsychiatry.2008.548
36. McEwen BS, Magarinos AM, Reagan LP. Studies of hormone action in the hippocampal formation: possible relevance to depression and diabetes. J Psychosom Res. (2002) 53:883–90. doi: 10.1016/S0022-3999(02)00307-0
37. van Sloten TT, Sedaghat S, Carnethon MR, Launer LJ, Stehouwer CDA. Cerebral microvascular complications of type 2 diabetes: stroke, cognitive dysfunction, and depression. Lancet Diabetes Endocrinol. (2020) 8:325–36. doi: 10.1016/S2213-8587(19)30405-X
38. Dunbar JA, Reddy P, Davis-Lameloise N, Philpot B, Laatikainen T, Kilkkinen A, et al. Depression: an important comorbidity with metabolic syndrome in a general population. Diabetes Care. (2008) 31:2368–73. doi: 10.2337/dc08-0175
39. Kahl KG, Schweiger U, Correll C, Muller C, Busch ML, Bauer M, et al. Depression, anxiety disorders, and metabolic syndrome in a population at risk for type 2 diabetes mellitus. Brain Behav. (2015) 5:e00306. doi: 10.1002/brb3.306
40. Koponen H, Jokelainen J, Keinanen-Kiukaanniemi S, Kumpusalo E, Vanhala M. Metabolic syndrome predisposes to depressive symptoms: a population-based 7-year follow-up study. J Clin Psychiatry. (2008) 69:178–82. doi: 10.4088/JCP.v69n0202
41. Lee S, Zhou J, Wong WT, Liu T, Wu WKK, Wong ICK, et al. Glycemic and lipid variability for predicting complications and mortality in diabetes mellitus using machine learning. BMC Endocr Disord. (2021) 21:94. doi: 10.1186/s12902-021-00751-4
42. Nalysnyk L, Hernandez-Medina M, Krishnarajah G. Glycaemic variability and complications in patients with diabetes mellitus: evidence from a systematic review of the literature. Diabetes Obes Metab. (2010) 12:288–98. doi: 10.1111/j.1463-1326.2009.01160.x
43. Costantino S, Paneni F, Battista R, Castello L, Capretti G, Chiandotto S, et al. Impact of glycemic variability on chromatin remodeling, oxidative stress, and endothelial dysfunction in patients with type 2 diabetes and with target HbA(1c) levels. Diabetes. (2017) 66:2472–82. doi: 10.2337/db17-0294
44. Ceriello A, Monnier L, Owens D. Glycaemic variability in diabetes: clinical and therapeutic implications. Lancet Diabetes Endocrinol. (2019) 7:221–30. doi: 10.1016/S2213-8587(18)30136-0
45. Clark D III, Nicholls SJ, St John J, Elshazly MB, Kapadia SR, Tuzcu EM, et al. Visit-to-visit cholesterol variability correlates with coronary atheroma progression and clinical outcomes. Eur Heart J. (2018) 39:2551–8. doi: 10.1093/eurheartj/ehy209
46. Bergin JE, Neale MC, Eaves LJ, Martin NG, Heath AC, Maes HH. Genetic and environmental transmission of body mass index fluctuation. Behav Genet. (2012) 42:867–74. doi: 10.1007/s10519-012-9567-5
47. Papachristoforou E, Lambadiari V, Maratou E, Makrilakis K. Association of glycemic indices (hyperglycemia, glucose variability, and hypoglycemia) with oxidative stress and diabetic complications. J Diabetes Res. (2020) 2020:7489795. doi: 10.1155/2020/7489795
48. Saisho Y. Glycemic variability and oxidative stress: a link between diabetes and cardiovascular disease? Int J Mol Sci. (2014) 15:18381–406. doi: 10.3390/ijms151018381
49. Sible IJ, Jang JY, Sultzer DL, Nation DA, Alzheimer's Disease Neuroimaging Initiative. Visit-to-visit blood pressure variability and subthreshold depressive symptoms in older adults. Am J Geriatr Psychiatry. (2022) 30:1110–9. doi: 10.1016/j.jagp.2022.03.006
50. Schaakxs R, Comijs HC, Lamers F, Beekman AT, Penninx BW. Age-related variability in the presentation of symptoms of major depressive disorder. Psychol Med. (2017) 47:543–52. doi: 10.1017/S0033291716002579
51. Shade ED, Ulrich CM, Wener MH, Wood B, Yasui Y, Lacroix K, et al. Frequent intentional weight loss is associated with lower natural killer cell cytotoxicity in postmenopausal women: possible long-term immune effects. J Am Diet Assoc. (2004) 104:903–12. doi: 10.1016/j.jada.2004.03.018
52. Furuyashiki T, Akiyama S, Kitaoka S. Roles of multiple lipid mediators in stress and depression. Int Immunol. (2019) 31:579–87. doi: 10.1093/intimm/dxz023
53. van Agtmaal MJM, Houben A, Pouwer F, Stehouwer CDA, Schram MT. Association of microvascular dysfunction with late-life depression: a systematic review and meta-analysis. JAMA Psychiatry. (2017) 74:729–39. doi: 10.1001/jamapsychiatry.2017.0984
54. Claassen JA. The plateau phase is a slippery slope: raising blood pressure may lower brain perfusion. J Physiol. (2016) 594:2783. doi: 10.1113/JP272121
55. Subba R, Sandhir R, Singh SP, Mallick BN, Mondal AC. Pathophysiology linking depression and type 2 diabetes: psychotherapy, physical exercise, and fecal microbiome transplantation as damage control. Eur J Neurosci. (2021) 53:2870–900. doi: 10.1111/ejn.15136
56. Wondmkun YT. Obesity, insulin resistance, and type 2 diabetes: associations and therapeutic implications. Diabetes Metab Syndr Obes. (2020) 13:3611–6. doi: 10.2147/DMSO.S275898
57. Daryabor G, Atashzar MR, Kabelitz D, Meri S, Kalantar K. The effects of type 2 diabetes mellitus on organ metabolism and the immune system. Front Immunol. (2020) 11:1582. doi: 10.3389/fimmu.2020.01582
58. Chen S, Zhang Q, Dai G, Hu J, Zhu C, Su L, et al. Association of depression with pre-diabetes, undiagnosed diabetes, and previously diagnosed diabetes: a meta-analysis. Endocrine. (2016) 53:35–46. doi: 10.1007/s12020-016-0869-x
59. Deschenes SS, Burns RJ, Graham E, Schmitz N. Prediabetes, depressive and anxiety symptoms, and risk of type 2 diabetes: a community-based cohort study. J Psychosom Res. (2016) 89:85–90. doi: 10.1016/j.jpsychores.2016.08.011
60. Renn BN, Feliciano L, Segal DL. The bidirectional relationship of depression and diabetes: a systematic review. Clin Psychol Rev. (2011) 31:1239–46. doi: 10.1016/j.cpr.2011.08.001
61. Golden SH, Lazo M, Carnethon M, Bertoni AG, Schreiner PJ, Diez Roux AV, et al. Examining a bidirectional association between depressive symptoms and diabetes. JAMA. (2008) 299:2751–9. doi: 10.1001/jama.299.23.2751
62. Rochlani Y, Pothineni NV, Mehta JL. Metabolic syndrome: does it differ between women and men? Cardiovasc Drugs Ther. (2015) 29:329–38. doi: 10.1007/s10557-015-6593-6
63. Mauvais-Jarvis F. Epidemiology of gender differences in diabetes and obesity. Adv Exp Med Biol. (2017) 1043:3–8. doi: 10.1007/978-3-319-70178-3_1
64. Regitz-Zagrosek V, Lehmkuhl E, Weickert MO. Gender differences in the metabolic syndrome and their role for cardiovascular disease. Clin Res Cardiol. (2006) 95:136–47. doi: 10.1007/s00392-006-0351-5
65. Geer EB, Shen W. Gender differences in insulin resistance, body composition, and energy balance. Gend Med. (2009) 6 Suppl 1:60–75. doi: 10.1016/j.genm.2009.02.002
66. Blaak E. Gender differences in fat metabolism. Curr Opin Clin Nutr Metab Care. (2001) 4:499–502. doi: 10.1097/00075197-200111000-00006
67. Kautzky-Willer A, Harreiter J, Pacini G. Sex and gender differences in risk, pathophysiology and complications of type 2 diabetes mellitus. Endocr Rev. (2016) 37:278–316. doi: 10.1210/er.2015-1137
68. Gregg EW, Engelgau MM, Narayan V. Complications of diabetes in elderly people. BMJ. (2002) 325:916–7. doi: 10.1136/bmj.325.7370.916
69. Deshpande AD, Harris-Hayes M, Schootman M. Epidemiology of diabetes and diabetes-related complications. Phys Ther. (2008) 88:1254–64. doi: 10.2522/ptj.20080020
70. Park KY, Hwang HS, Cho KH, Han K, Nam GE, Kim YH, et al. Body weight fluctuation as a risk factor for type 2 diabetes: results from a nationwide cohort study. J Clin Med. (2019) 8:950. doi: 10.3390/jcm8070950
71. Muggeo M, Zoppini G, Bonora E, Brun E, Bonadonna RC, Moghetti P, et al. Fasting plasma glucose variability predicts 10-year survival of type 2 diabetic patients: the Verona Diabetes Study. Diabetes Care. (2000) 23:45–50. doi: 10.2337/diacare.23.1.45
72. Burns N, Finucane FM, Hatunic M, Gilman M, Murphy M, Gasparro D, et al. Early-onset type 2 diabetes in obese white subjects is characterised by a marked defect in beta cell insulin secretion, severe insulin resistance and a lack of response to aerobic exercise training. Diabetologia. (2007) 50:1500–8. doi: 10.1007/s00125-007-0655-7
Keywords: type 2 diabetes mellitus, metabolic variability, depressive disorder, nationwide, longitudinal cohort
Citation: An JH, Han K-d and Jeon HJ (2023) Higher metabolic variability increases the risk of depressive disorder in type 2 diabetes mellitus: a longitudinal nationwide cohort study. Front. Psychiatry 14:1217104. doi: 10.3389/fpsyt.2023.1217104
Received: 04 May 2023; Accepted: 05 July 2023;
Published: 24 July 2023.
Edited by:
Yuji Ozeki, Shiga University of Medical Science, JapanReviewed by:
Norio Sugawara, Dokkyo Medical University, JapanKirubel Dagnaw Tegegne, Wollo University, Ethiopia
Kumiko Fujii, Shiga University of Medical Science, Japan
Copyright © 2023 An, Han and Jeon. This is an open-access article distributed under the terms of the Creative Commons Attribution License (CC BY). The use, distribution or reproduction in other forums is permitted, provided the original author(s) and the copyright owner(s) are credited and that the original publication in this journal is cited, in accordance with accepted academic practice. No use, distribution or reproduction is permitted which does not comply with these terms.
*Correspondence: Kyung-do Han, aGtkOTE3QG5hdmVyLmNvbQ==; Hong Jin Jeon, amVvbmhqQHNra3UuZWR1