 Deok-Hee Kim-Dufor1*
 Michel Walter2Marie-Odile Krebs3Yannis Haralambous4Philippe Lenca5
 Christophe Lemey2,6
- 1Limics, Sorbonne Université, Université Sorbonne Paris-Nord, INSERM, Paris, France
- 2Unité de Recherche Clinique en Psychiatrie (URCP), Department of Psychiatry, Centre Hospitalier Universitaire (CHU) de Brest, Brest, France
- 3University of Paris, Groupe Hospitalier Universitaire de Paris (GHU)-Paris, Service Hospitalo-Universitaire, Sainte-Anne, Centre d'évaluation pour Jeunes Adultes et ADolescents (C’JAAD), Paris, France
- 4IMT Atlantique, Lab-STICC, UMR CNRS 6285, Brest, France
- 5Données, Modèles, Informations & Décisions (DECIDE), Department of LUSSI, Institut Mines-Télécom (IMT) Atlantique, Brest, France
- 6Consultation d’Evaluation de la VUlnérabilité Psychologique (CEVUP), Department of Psychiatry, CHU de Brest, Brest, France
Introduction: Peculiar use of language and even language deficits are one of the well-known signs of schizophrenia. Different language features analyzed using natural language processing and machine learning have been reported to differentiate patients at ultra-high risk for psychosis. However, it has not always been explained how, and to what extent, those linguistic markers allow the distinction of patients. This study aims to find relevant linguistic markers for classifying patients at ultra-high risk and explain how the detected markers contribute to the classification.
Methods: The first consultations with a psychiatrist of 68 patients (15 not-at-risk patients, 45 at-risk patients, and 8 patients with first episode psychosis) were recorded, transcribed verbatim, and annotated for analyses using natural language processing. A gradient-boosted decision tree algorithm was tested to evaluate its potential to correctly classify three categories of patients and find relevant linguistic markers at the level of lexical richness, semantic coherence, speech disfluency, and syntactic complexity. The Synthetic Minority Oversampling Technique was used to handle imbalanced data, and the SHapley Additive exPlanations (SHAP) values were computed to measure feature importance and each feature’s contributions to the classification.
Results: The model yielded good performance, that is, 0.82 accuracy, 0.82 F2-score, 0.85 precision, 0.82 recall, and 0.86 ROC–AUC score, with four linguistic variables that concern weak coherence, the use of “I,” and filled pauses.
Discussion: The findings in this study suggest that weak coherence play a key role in classification. No significant differences in the use of “I” and filled pauses were found between groups using a statistical test, but an explainability model showed its different contributions. The contribution of each linguistic feature to the classification by patient group provided deeper insight into linguistic manifestations of each patient group and their subtle differences, which could help better analyze and understand patients’ language behaviors.
1 Introduction
People with schizophrenia present with significant impairments stemming from disordered cognitive functioning (1). This mental illness manifests itself in characteristic symptoms such as delusions, hallucinations, disorganized thinking and behaviors, limited speech and expression of emotions, and social withdrawal. Early detection and treatment of schizophrenia have been proven to lead patients to favorable prognosis and better quality of life (2, 3). They could indeed reduce the risks and disorders associated with the first symptoms by engaging patients who present with prodromal symptoms in a care pathway (4) and limit the duration of untreated psychosis (DUP) by means of a treatment at the onset of the first episode of psychosis (FEP). The DUP is one of the key prognostic factors both in FEP (5) and in chronic schizophrenia (6). Different clinical assessments allow prodromal symptoms to be identified such as the Comprehensive Assessment of At-Risk Mental States (CAARMS), the Structured Interview of Psychosis-risk Syndromes (SIPS) from the “Ultra-High Risk (UHR)” criteria, and the Schizophrenia Proneness Instrument—Adult (SPI-A) from the basic symptom concept. Even though these tools show acceptable or fairly good performances, they still have a somewhat limited rate of prediction (7). Complementary elements for better predictions have therefore become a desideratum, and natural language processing (NLP) comes into play. Peculiar uses of language in schizophrenia (8–10) have been reported in the literature and are one of the well-known signs (11, 12). They are very easily noticeable and even qualified as “schizophrenic language” and “schizophrenese” by some authors in the last century (13–16). Peculiarities are observed at different language levels ranging from words to sentence structure, coherence, pragmatics (17–21) as itemized in the Scale for the Assessment of Thought, Language, and Communication by Andreasen like neologism, word approximation, poverty of speech, poverty of content, tangentiality, derailment, incoherence, and stilted speech (8). Based on the idea that self-disturbance is one of the core features of schizophrenia, a phenomenological approach to the sense of self in patients has developed (22–24) along with studies on the use of first-person pronouns (25–29). Language analysis of syntactic variables was already proposed in the 1980s as a potential diagnostic aid (30–32), since differences were observed between schizophrenics, maniacs, and controls (30, 31). Even though language analyses turned out to have great potential, they were highly time consuming and likely to be subjective because they had to be manually carried out. Automated language analyses are more objective methods and unlimited in data size. Many studies have therefore explored language in schizophrenia and searched for linguistic markers to be used as a diagnostic aid along with biomarkers such as brain imaging, genetic testing, and blood tests (33–35). With the development of artificial intelligence, analysis techniques, such as NLP and machine learning (ML) models, have become more sophisticated and yielded more propitious results. These techniques have been used on linguistic data in a growing number of studies on mental health (36, 37), namely, those on schizophrenia and FEP (38, 39): latent semantic analysis for quantifying speech coherence (40), semantic, lexical, and pragmatic features (41–44), speech graph connectivity for measuring thought disorder in schizophrenia and mania (45, 46) and for predicting transition (47, 48), longitudinal classification of FEP (49), clustering for constructing language profiles of heterogeneous linguistic behaviors of patients with schizophrenia for early intervention (50) and prognosis (51), and a combination of acoustic and semantic features for classifying schizophrenia-spectrum disorders (52), to name a few. The aims of this exploratory study were to detect relevant language features that could classify patients by their status at their first consultation with a psychiatrist and seek to explain classification results with respect to clinical observations. Among the linguistic markers found in these studies (40–51), the most frequent language feature is semantic coherence despite different types and lengths of corpus. It was therefore hypothesized that semantic coherence would be part of the relevant linguistic markers in conversational discourses of patients at ultra-high risk. With the disturbed sense of self observed in the clinic, it was also hypothesized that the use of first-person singular pronoun would vary depending on the UHR patient groups.
2 Methods
2.1 Participants
Sixty-eight patients (34 males, 34 females; mean age = 19.3 ± 2.86) participated in the present study. Out of the 68 patients, 15 were assessed as NAR (7 males, 8 females; mean age = 19.5 ± 2.24), 45 as AR (22 males, 23 females; mean age = 19.2 ± 2.83), and 8 as FEP (5 males, 3 females; mean age = 19.7 ± 3.78) using the CAARMS at T0. In total, 33 patients had antidepressants and/or anxiolytics, 5 were under neuroleptic treatment for less than 6 months, and 20 had no drug treatment. Healthy controls were not recruited separately to respect the same conditions of collecting data for each of the three groups, that is, a consultation with a psychiatrist. All were native speakers of French with an IQ superior to 70 and were informed of the study. Education levels were as follows: NAR [years of education (YoE) = 12.07 ± 1.34], AR (YoE = 11.58 ± 1.32), and FEP (YoE = 12 ± 1.73). A statement of non-opposition to the study was signed by their physician or the parents of underage patients.
2.2 Collection of patients’ speech and transcription
The recruited patients were recorded during their first consultations with a psychiatrist at the Center for Evaluation of Psychological Vulnerability (CEVUP) of the University Hospital of Brest, France. The first consultation with a psychiatrist is the starting point of the care pathway at the CEVUP. It is therefore labeled T0 (time zero), and a 2-year follow-up is indicated as T2. The interviews are semi-structured with some predetermined questions on the patient’s problems. The topics broached are the patient’s background, family, social relationships, socio-professional insertion, complaints about their symptoms, and any other topics based on what is said by the patient. Some additional questions are asked if more detailed information is needed for better understanding of the help seeker’s problems to assess their risk for psychosis. The transcripts have a conversational form between a psychiatrist and a patient. A nurse participated in the consultations, but she seldom spoke, and even when she did, it was only to provide the patient with supplementary information on the care pathway at the end of the consultations. The total duration of each recording is approximately 1 h. The mean total number of all words is 4,979.18 (SD = 2,448.70). The entire utterances including filled pauses, neologisms, and mispronunciations were transcribed verbatim using Microsoft Word by two trained assistants with clear instructions. Each speech turn starts on a new line and that of the healthcare provider is marked with an octothorpe (#) at the beginning and at the end. The present study has been approved by the IRB—Comité de Protection des Personnes EST-III (CPP:18.04.03, ID-RCB: 2017-A02702-51).
2.3 Preprocessing
An experienced linguist carried out preprocessing following predefined instructions. The spellings were manually double checked and corrected in all the transcripts without affecting their verbatim nature. Three different symbols, inspired by the method proposed by Foster and colleagues (53), were used to mark the elements required for analyses as follows:
● {} for speech disfluency such as filled pause, repetition, false start, auto-correction, and auto-interruption/abandonment
● | for clauses whose nucleus is a conjugated verb
● < > for minor utterances (no conjugated verbs).
The transcripts were segmented in three ways: each speech turn as a segment, each sentence as a segment, and each sentence without the healthcare provider’s speech as a segment. For the first segment, each new line was a segment; for the second, each punctuation; and for the last, the whole new lines starting and ending with octothorpes were removed using Python as well as the blank lines generated by this removal process.
2.4 Linguistic variables
The preprocessed transcripts were analyzed using NLP techniques with Python, which resulted in 33 features at the lexical, syntactic, and semantic levels and that of speech fluency (see Table in Supplementary Material).
2.4.1 Lexical level
Lexical richness was measured to explore the variety of words and the quality of vocabulary. For the former, lexical diversity was calculated using the type–token ratio (54). For the latter, the proportion of content words (nouns, verbs, adjectives, and adverbs) to the total number of words, called lexical density (55), was measured. Since function words are excluded, lexical density reflects how informative the discourse is. Disturbed self-experience and different patterns of use of the first-person singular pronoun in people with schizophrenia have been reported (26, 29, 56). The use of personal pronouns was explored through three different measures as follows: the proportion of “I” to the total number of subject personal pronouns, the proportion of “I” to the total number of words, and the ratio of the first-person singular subject pronoun to the first-person object pronoun. The analyses at the lexical level were carried out on the lemmatized corpus using treetaggerwrapper (57).
2.4.2 Syntactic level
Syntactic complexity and poverty of speech were measured. The analyses were based on lexicogrammatical constituency in functional grammar. Constituency is the hierarchical compositional structure of language, and this hierarchy of units is denominated as a rank scale, with each step in the hierarchy referred to as one rank (58). The ranks of lexicogrammatical constituency are clause > phrase/group > word > morpheme, wherein the clause is the highest unit and the central processing unit. In addition, this unit is one of the five levels in the grammatical system (59) and the primary unit in immediate speech processing (60). The clause has therefore been determined as the basic syntactic unit in this study. The utterances were segmented into clauses whose nucleus is a conjugated verb. When a group of words lacks a conjugated verb, it is considered a minor utterance. As for syntactic complexity, Szmerecsány compared syntax tree-based node counts, length-based word counts, and index of syntactic complexity calculated based on subordinators and embeddedness with regard to their accuracy and applicability (61). The results showed that all the three methods were almost perfect proxies, and therefore the most economical method, word counts, could be used. The average number of words per clause was therefore calculated as a measure of syntactic complexity. In turn-taking between a patient and a psychiatrist, the number of the patient’s turns was counted, and the proportion of the turns only with minor utterances (short answers) to the total number of their turns was calculated. A patient’s turn is considered minor utterance when the patient answers with simple words such as “yes,” “no,” “OK,” or a group of words without developing the reply. For example, to the question “How are you feeling today?”, the reply would be “so so/a little better/not really happy about all this.” This type of utterances is in line with “poverty of speech,” which is widely described in the literature (8, 10, 12). All the disfluency elements have been removed from the corpus prior to the syntactic analyses.
2.4.3 Semantic level
Latent semantic analysis (LSA) (62, 63) has been applied to measure incoherence in speech (40, 41) and turned out to be fairly efficient when combined with other linguistic features (41–43, 49). LSA is a widely used NLP technique that analyzes texts to explore the relationships between a set of documents and the terms inside those documents. The underlying idea of LSA is that semantically similar words occur in similar texts, and thereby the cooccurrences of terms in large corpora of texts are used for measuring the lexical proximity/semantic similarity of terms of a language. LSA was chosen over other techniques for the following assets: a) the technique is based on a psychological theory of meaning and has shown results similar to human evaluations in educational applications (63); b) early studies using this technique paved the way for the use of NLP in early detection of psychosis (40, 41, 64, 65); c) LSA can handle longer passages of words (66) and synonyms in case of word redundancy for the avoidance of repetition (63); and d) contrary to new transformer-based models, this technique is not sensitive to initialization parameters, which allows consistent results. In addition, an LSA-based text analysis tool called Coh-Metrix (67, 68) has been efficiently used in studies on formal thought disorder (FTD) (56, 69–71). In the present study, semantic coherence was measured in three different types: intersubjective, subjective, and subjective without doctor (abbreviated henceforth as wodr) coherence. In the first type, semantic coherence was measured based on turn-taking, which represents dialogue coherence, inter-turn comparison; in the second, based on punctuation marks, such as periods and question marks, which could be called sentence-to-sentence coherence; and in the third, only the patients’ speech was considered. For the semantic analyses, the transcripts were not lemmatized (72), stop words were removed, and the disfluency elements were kept for the sake of semantic integrity.
2.4.4 Speech fluency
Speech flow can vary in any individuals depending on their situation, state of mind, and/or fatigue. Disfluencies in speech comprise unfilled pauses (silent), filled pauses (“uh,” “um”), false starts, repetitions, autocorrection, parenthetical remarks (“well,” “yeah”) (73), and abandoned utterances (abandonment/auto-interruption). Various features of speech disfluency in patients with psychotic disorders, such as filled pauses, autocorrection, reparandum–interregnum repair structure, and unfilled pauses, have been studied in detail (74–76). All the disfluency elements, except unfilled pauses, were counted, and three disfluency-related subcategories were created as features in the present study as follows: filled pauses, abandonments/auto-interruptions, and auto-corrections/repetitions/false starts. The proportion of each of the three to the total number of words was calculated. A disfluency element with several words was counted as one. Among the abandoned utterances, clauses with a subject and an incomplete predicate have constituted a variable, that is, truncated clauses.
2.5 Statistics, XGBoost Classifier, SMOTE, SHAP values
Statistical analyses were carried out using Python scipy (77) and statsmodels (78). Data normality was tested using Kolmogorov–Smirnov test. For group comparisons in each of the 33 linguistic features and education levels, a Kruskal–Wallis test and a Dunn–Bonferroni test, as a post hoc analysis, were performed. Data homoscedasticity was verified using Levene’s test. A Kendall’s tau-b was calculated between the linguistic variables and the patients’ education levels as possible confounders.
A supervised machine learning model XGBoost, for eXtreme Gradient Boosting (79) was used for classification. The gradient boosting method provides higher predictive accuracy thanks to its functional characteristics, that is, it combines weak learners to give rise to a stronger learner and therefore forms a more robust model (80). In addition, multicollinearity does not affect the stability and robustness of the model’s performance thanks to the capability of the algorithm to choose the best of highly correlated features (81). Furthermore, XGBoost has shown better performance with small datasets (82, 83) than other classifiers. The dataset in the present study is imbalanced. This limitation was addressed through SMOTE (Synthetic Minority Oversampling Technique) (84), a statistical technique for upsampling the minority class for a better balanced dataset. This technique has already been used and proven its efficacity, for example, in diagnosis, classification, and prognosis of cancer, diabetes, and Parkinson’s disease (85–97) to name a few. Stratified K-fold cross validation (k = 3) was used to split the data into train and test sets, and SMOTE was subsequently conducted individually in each fold to avoid data leakage. Stratified K-fold cross validation was chosen over leave-one-out cross validation for the sake of computational time and power, and k = 3 was set considering our relatively small dataset and the number of patient groups. The test size was 0.3. Using Bayesian Optimization (98) to tune hyperparameters, an XGBoost Classifier was trained using the 33 features of the original data to compute the SHapley Additive exPlanation (SHAP) values (99), and the mean absolute SHAP values were calculated for feature selection (100, 101). Another XGBoostClassifier was then trained using the outcome of feature importance based on the mean absolute SHAP values and the upsampled data. Inspired by Shapely values (102) from cooperative game theory, the SHAP values allow interpreting the model output by measuring the contribution of each feature to predictions. Precisely, the SHAP values reveal how much (magnitude) and either positively or negatively (direction) each feature affected the classification (99). This method thereby allows explanations and better interpretation of the results. The process of speech data acquisition and analyses is depicted below in Figure 1.
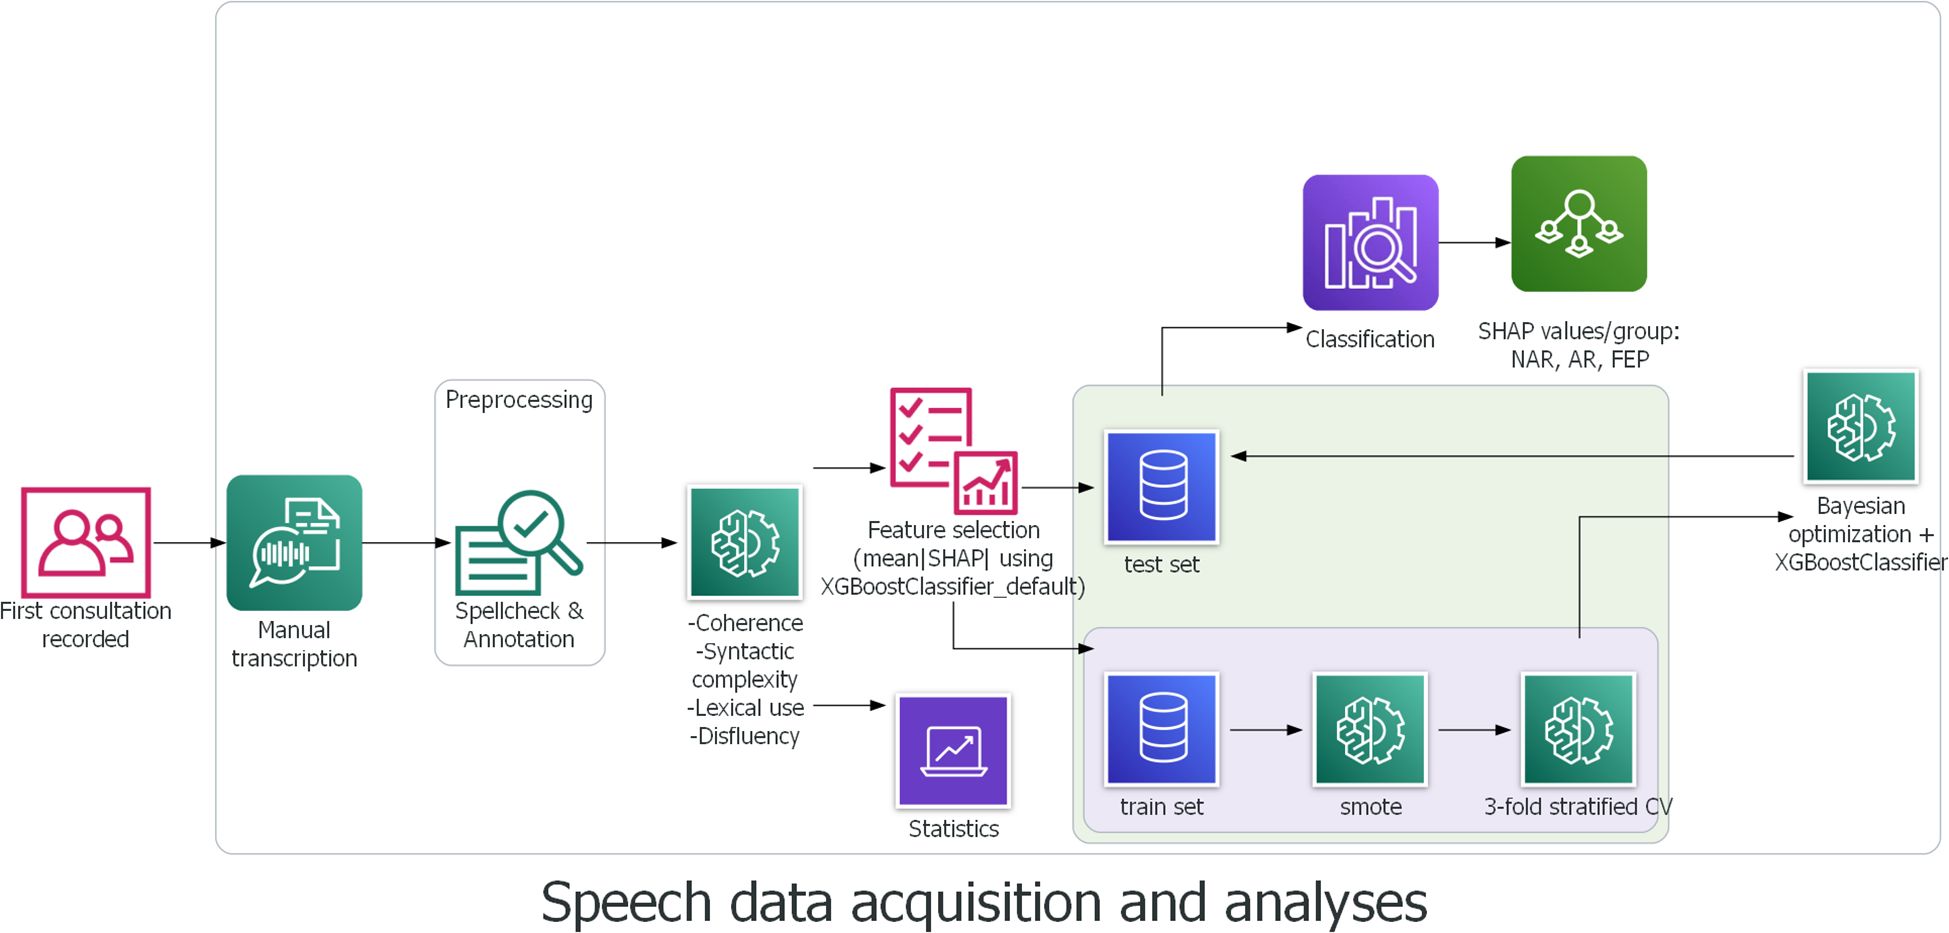
Figure 1. Pipeline for speech data acquisition and data analyses.
3 Results
3.1 Statistical results
A Kolmogorov–Smirnov test showed that no feature had a normal distribution (0.5 ≤ D ≤ 1 and p < 0.00 in all 33 features). The results of Levene’s test indicated homogeneity of variance in all features (p > 0.05). A Kendall’s tau-b test showed no evidence for a moderate or strong impact of years of education on the linguistic features (rτ = 0.24, p = 0.01 between average number of words per clause and education level; −0.14 ≤ rτ ≤ 0.16, 0.07 ≤ p ≤ 0.99 in all the other pairs). A Kruskal–Wallis test was performed on each of the 33 features of the three groups. The results revealed significant differences between the three groups in two features (intersubjective LSA minimum and subjective LSA minimum) as shown in Table 1a (for the full table, see Supplementary Material). A Dunn–Bonferroni test was then conducted to verify which groups were different. Its results indicated significant differences either between AR and FEP or between AR and FEP, but no differences were found between NAR and AR as shown in Table 1b.
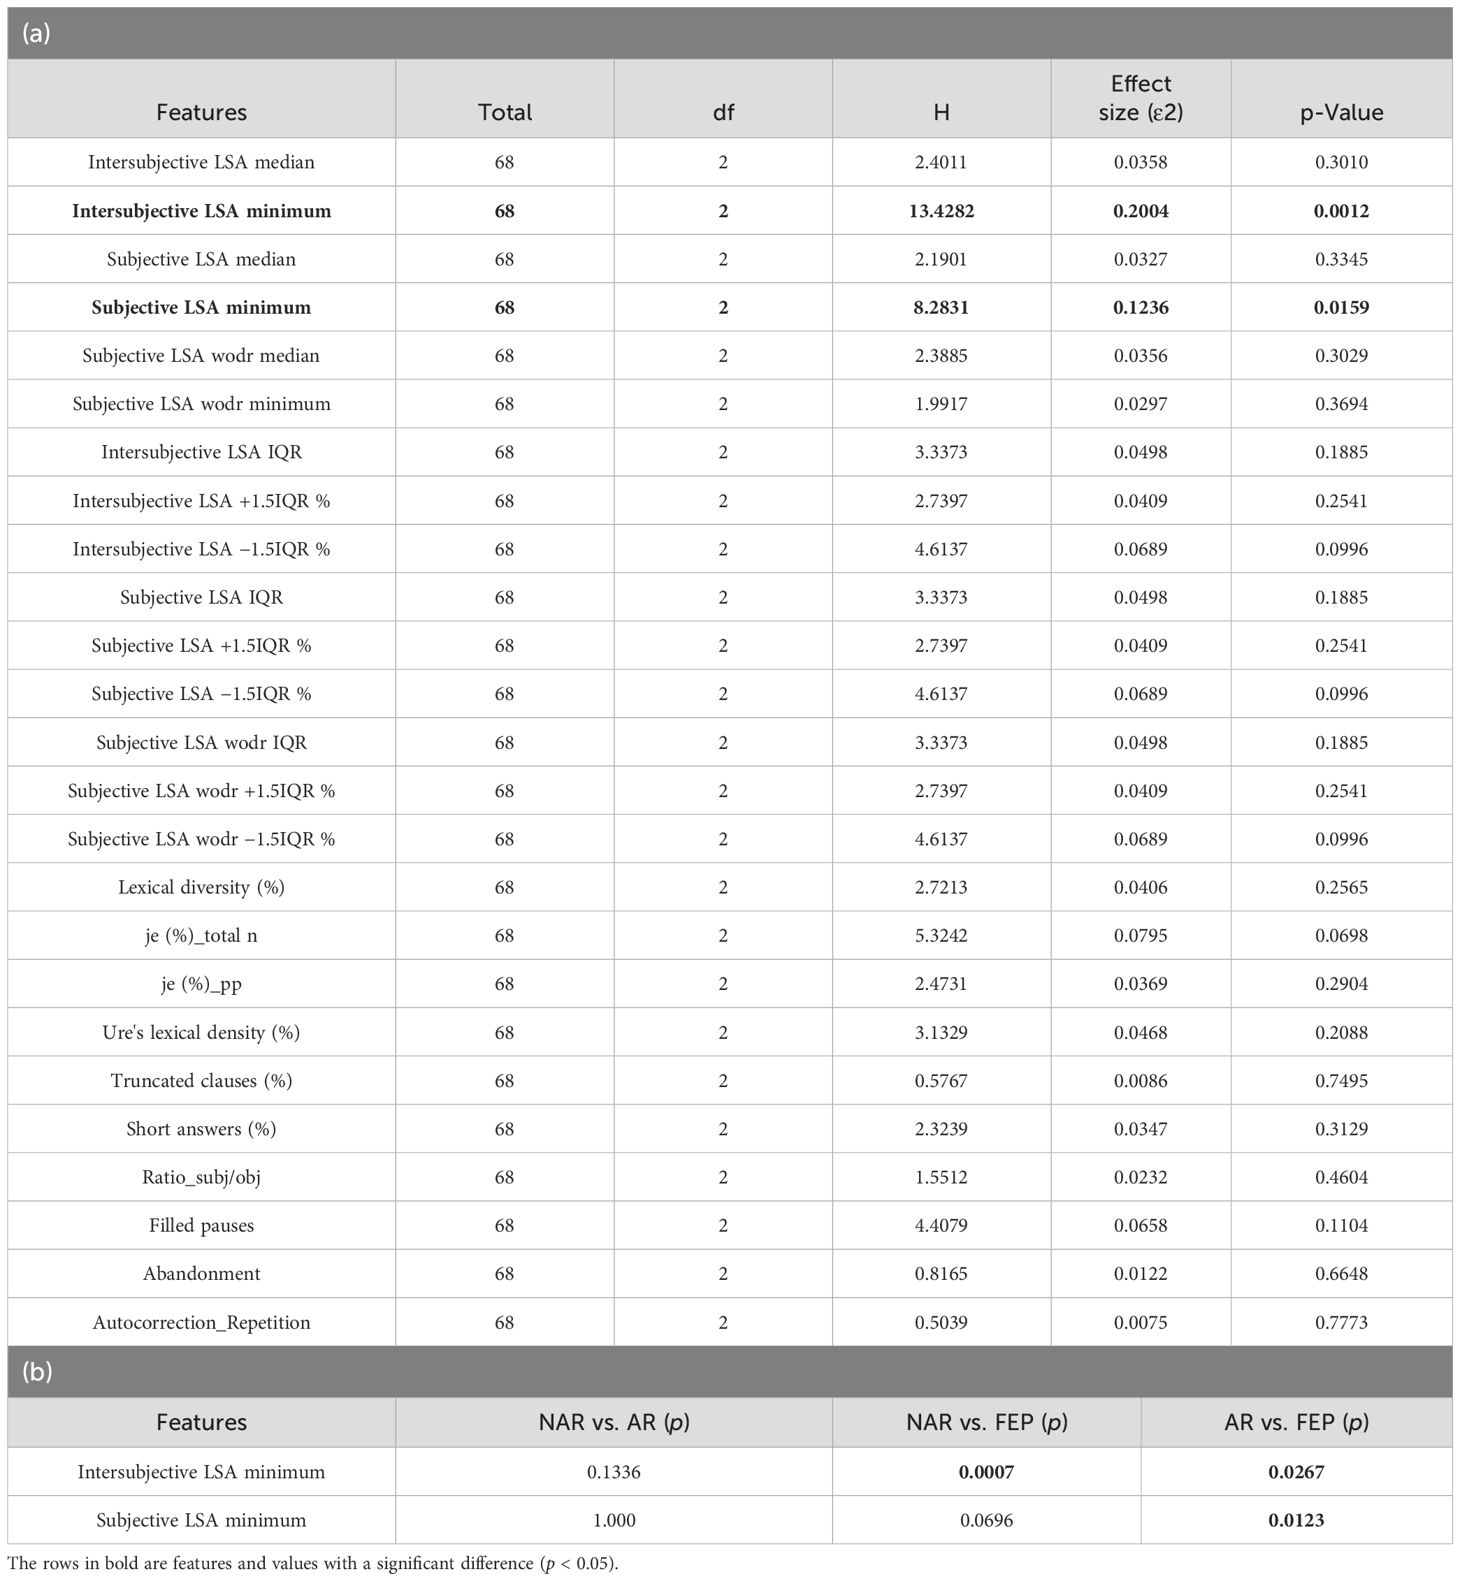
Table 1. Kruskal–Wallis test results of the main features (a) and Dunn–Bonferroni test results (b).
3.2 Classification and explainability results
The XGBoostClassifier trained on SMOTE data with all the features yielded 0.75 accuracy, 0.73 precision, 0.75 recall, 0.74 F2-score, and 0.70 ROC–AUC score. The most impactful features were selected based on the mean absolute values computed on the original data as shown in Figure 2. The first four features whose values are greater than 0.3 were selected (intersubjective LSA minimum, subjective LSA wodr minimum, the proportion of “I” to the total number of words, and filled pauses) for another classification using XGBoostClassifier. This cutoff selection was based on threshold tests on the first 10 features. The best result was obtained when the first four features were included; for example, with the first five features, the accuracy was slightly lower (0.79) than that with the first four features and higher than that with the whole features (0.75). The newly trained model reached 0.82 accuracy, 0.85 precision, 0.82 recall, 0.82 F2-score, and 0.86 ROC–AUC score (see Figure 3 for ROC–AUC curve), and as for 95% confidence intervals (CI) of accuracy, the lower CI was 0.68 and the upper CI, 0.95. The specificity and sensitivity of each group (group-specificity–sensitivity) were as follows: NAR-0.82–0.80, AR-0.86–0.80, and FEP-1.00–1.00. The results are shown in Table 2. Eight patients in the test set had their statuses at T2. Only one AR patient at T0 was misclassified into NAR by our model, but their status at T2 turned out to be NAR.
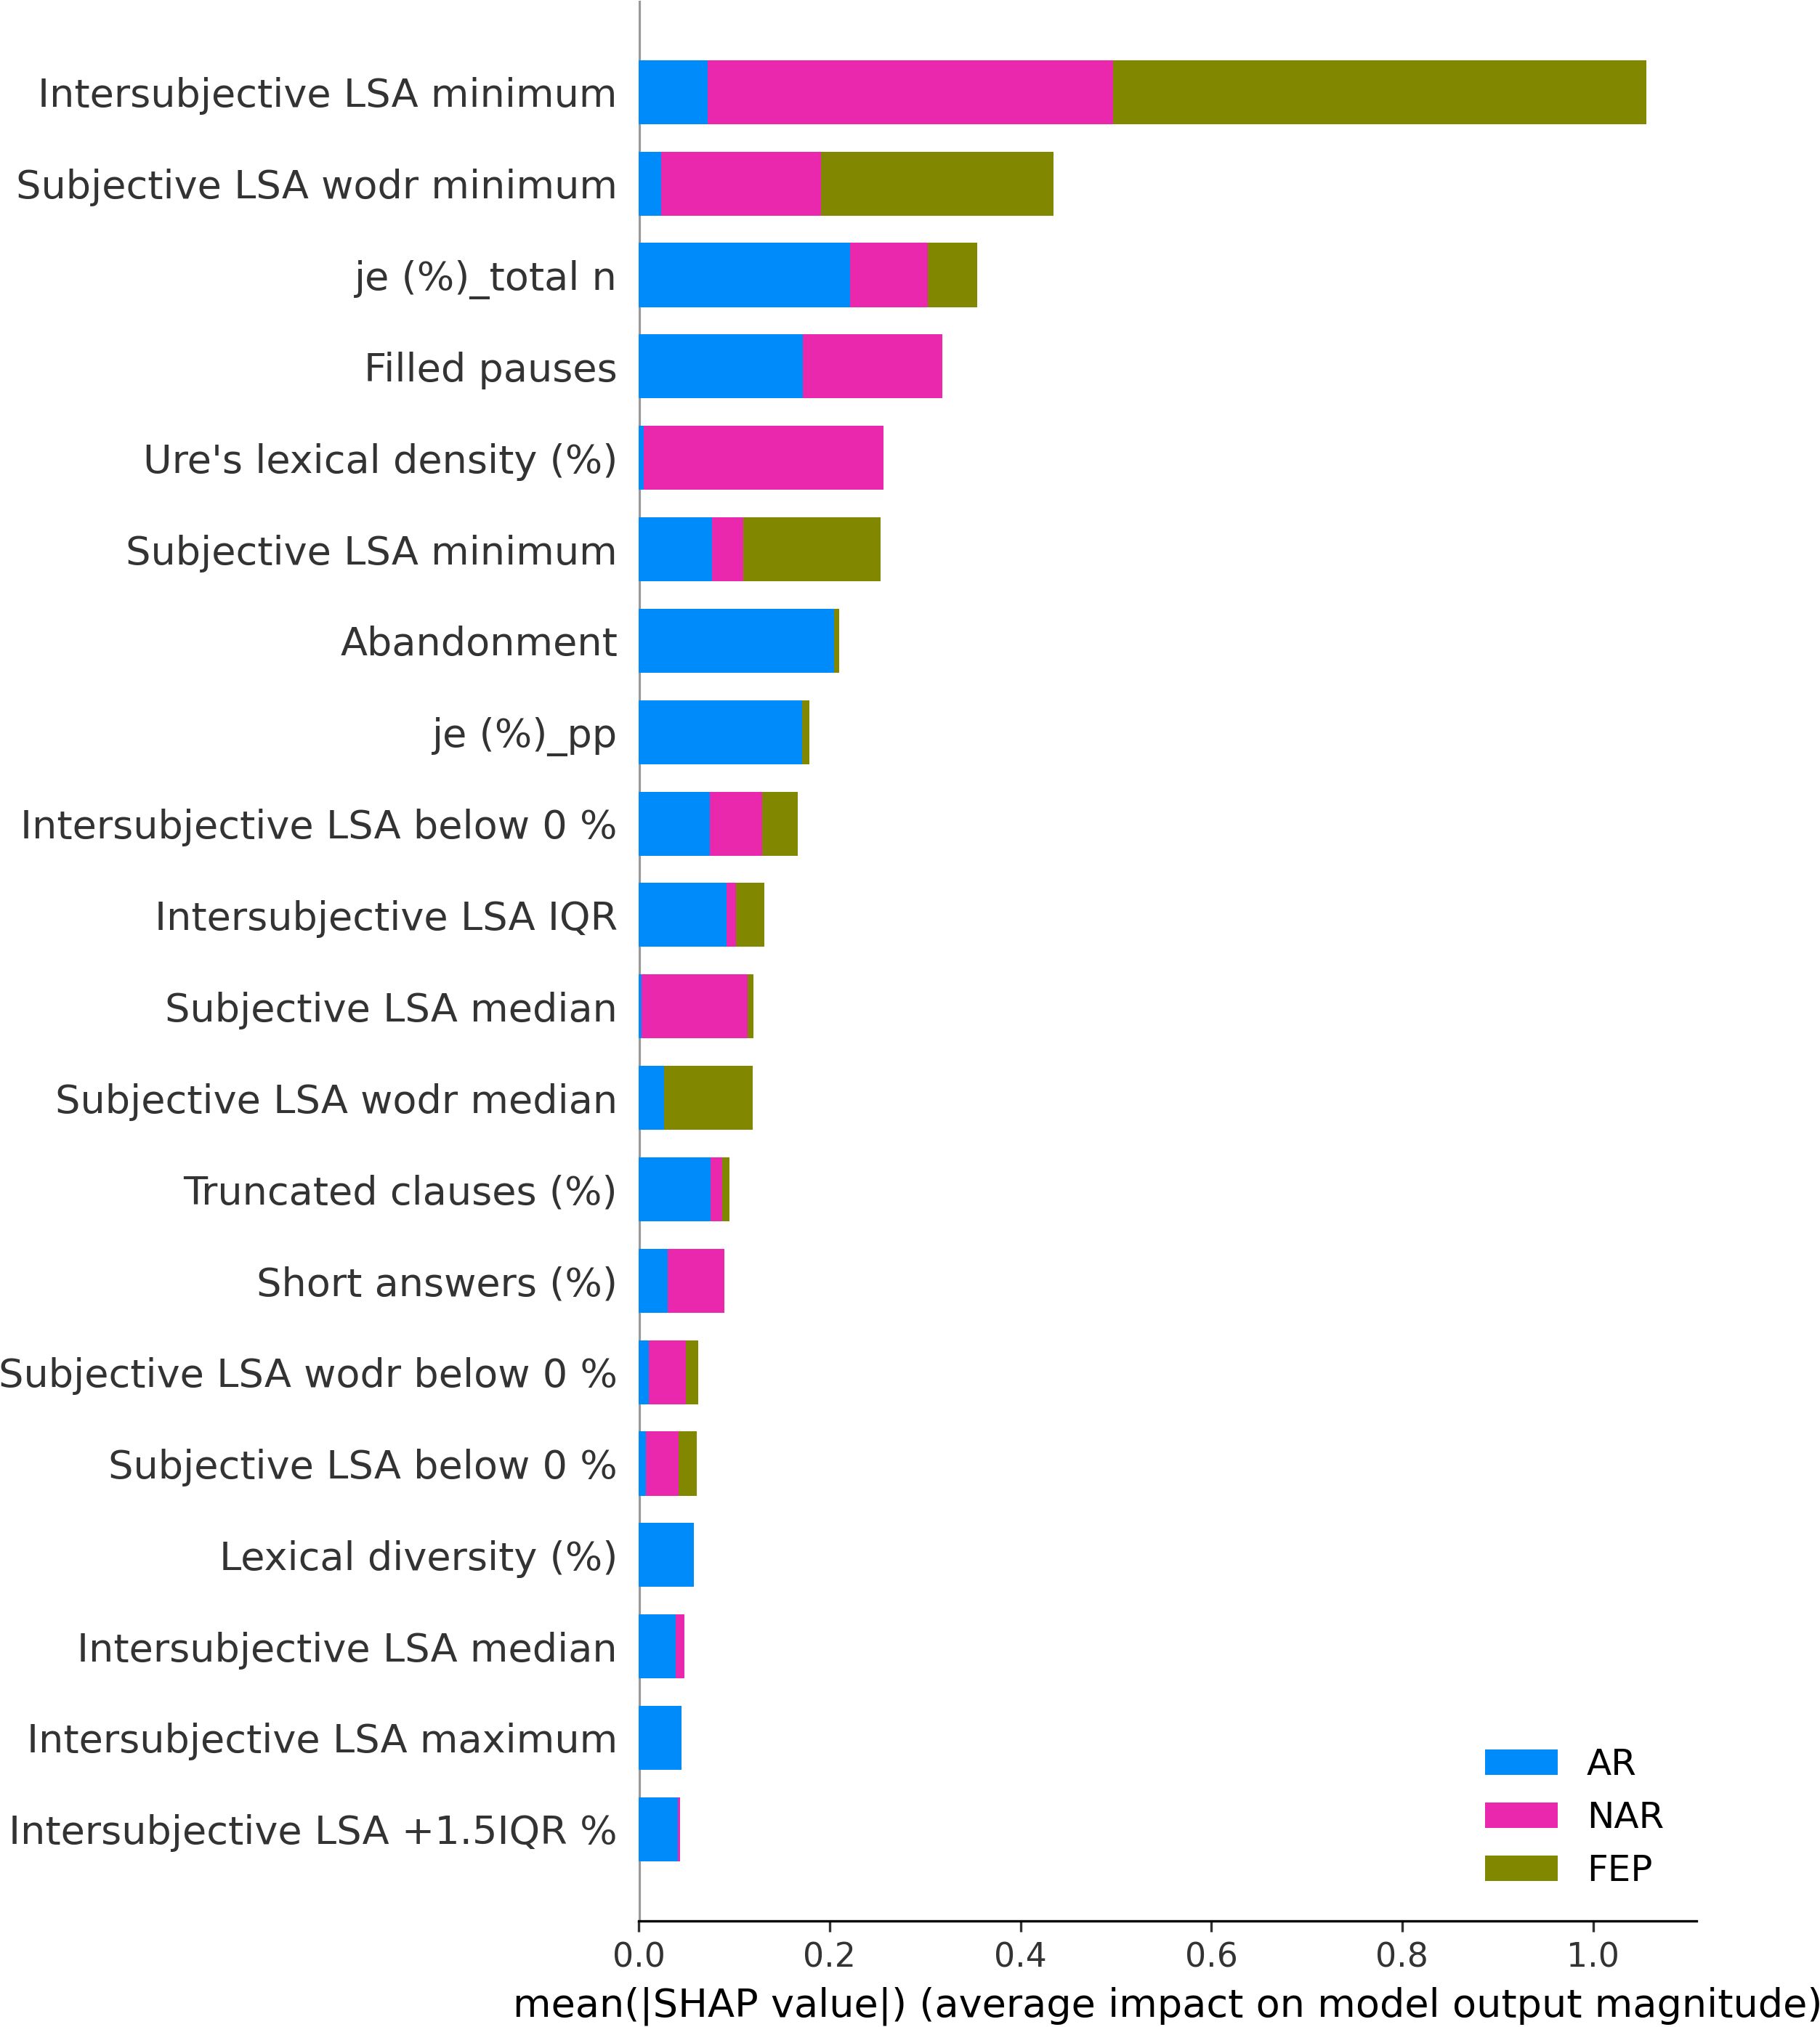
Figure 2. Mean absolute SHAP values.
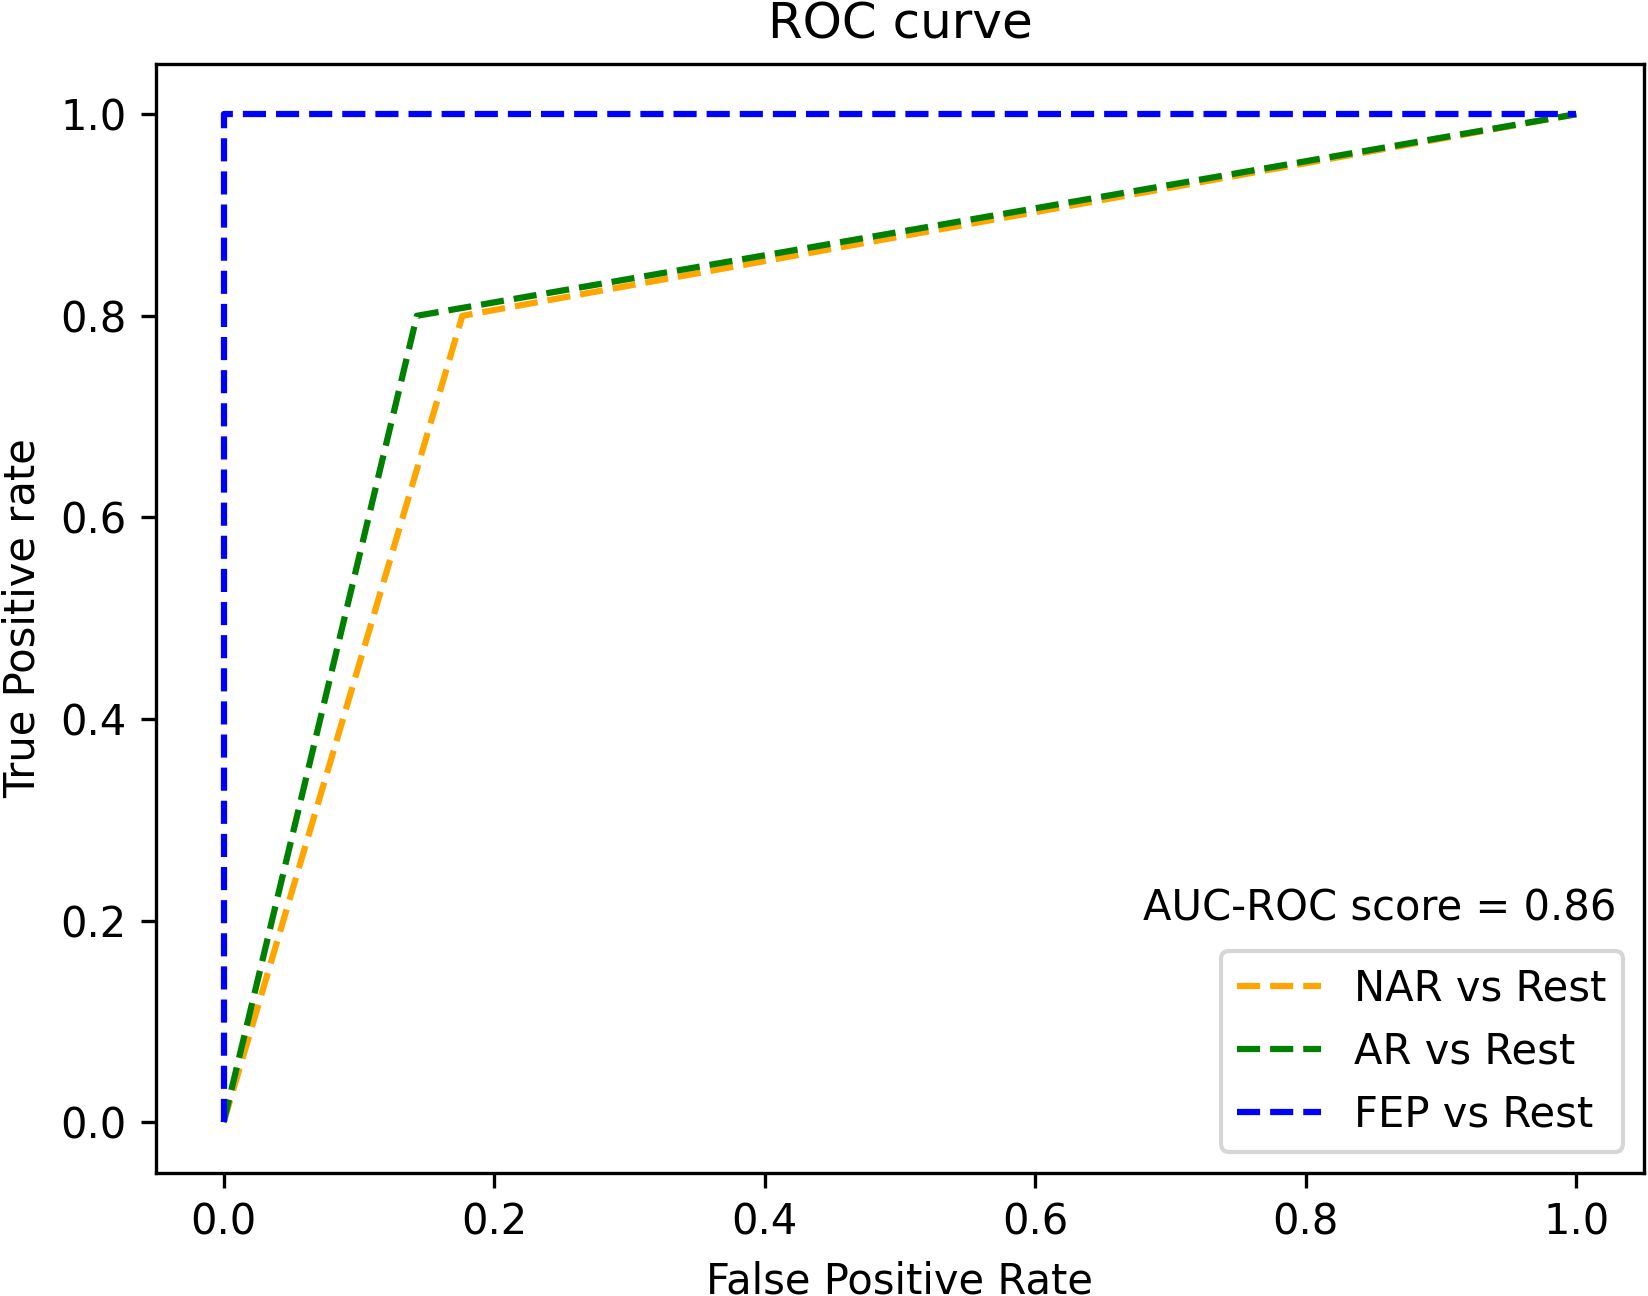
Figure 3. ROC curve of XGBoostClassifier model.
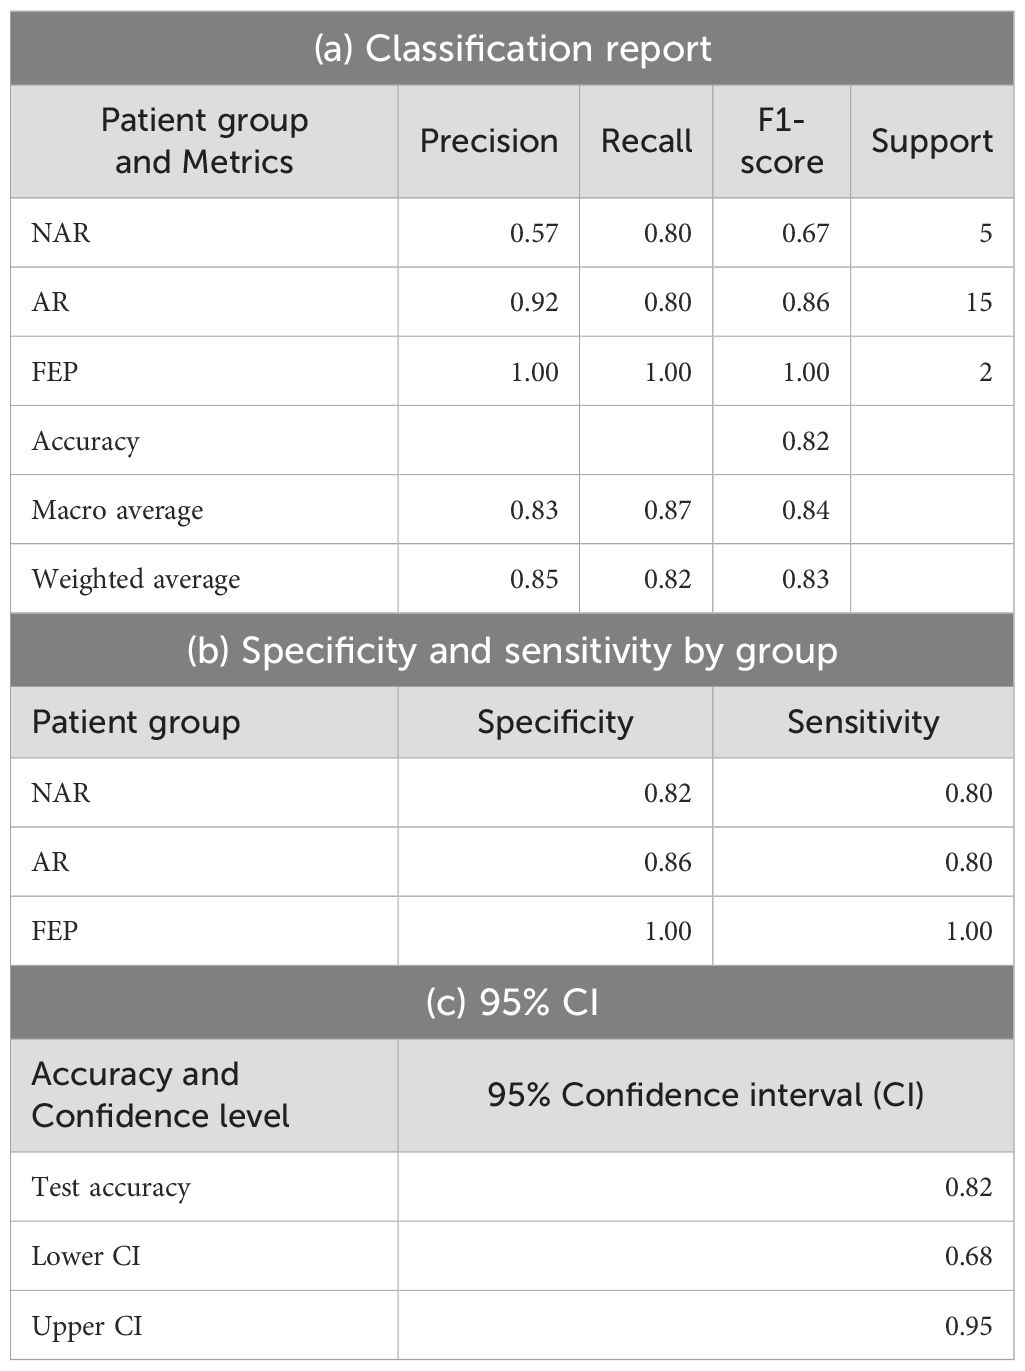
Table 2. Classification report (a), specificity and sensitivity (b), 95% confidence intervals (c).
The SHAP values of each individual in each class are visually represented in Figures 4 (NAR), 5 (AR), and 6 (FEP). The x-axis indicates the SHAP values, the y-axis shows the features, and the color of the point represents the original value of that sample, that is, higher in red and lower in blue. The farther a point is from the center vertical axis, the stronger its impact is on the classification. Figure 2 shows that lower scores in intersubjective LSA minimum, lexical density, and subjective LSA without doctor minimum have a negative impact on predictions. In other words, these lower values are indicative of the individuals’ lower chance of being classified as NAR. Conversely, higher scores, albeit to a lesser degree, in filled pauses and subjective LSA median contribute positively to NAR. The magnitude of the higher scores in the proportion of “I” to the total number of words suggests their relatively small negative impact on the NAR classification. In Figure 3, the lower proportion of “I” to the total number of words, and higher frequencies of abandonment/auto-interruption and filled pauses, have a negative impact on predictions in AR. When scores in the proportion of “I” to the personal pronouns and subjective LSA minimum are higher, the odds on individuals being classified as AR are higher. Figure 4 shows that lower minimum scores in all the three types of LSA contribute positively to FEP with the greatest magnitude of intersubjective LSA minimum. Higher values in subjective LSA wodr median negatively impact FEP. The contributions are summarized by patient group, direction, and magnitude in Table 3.
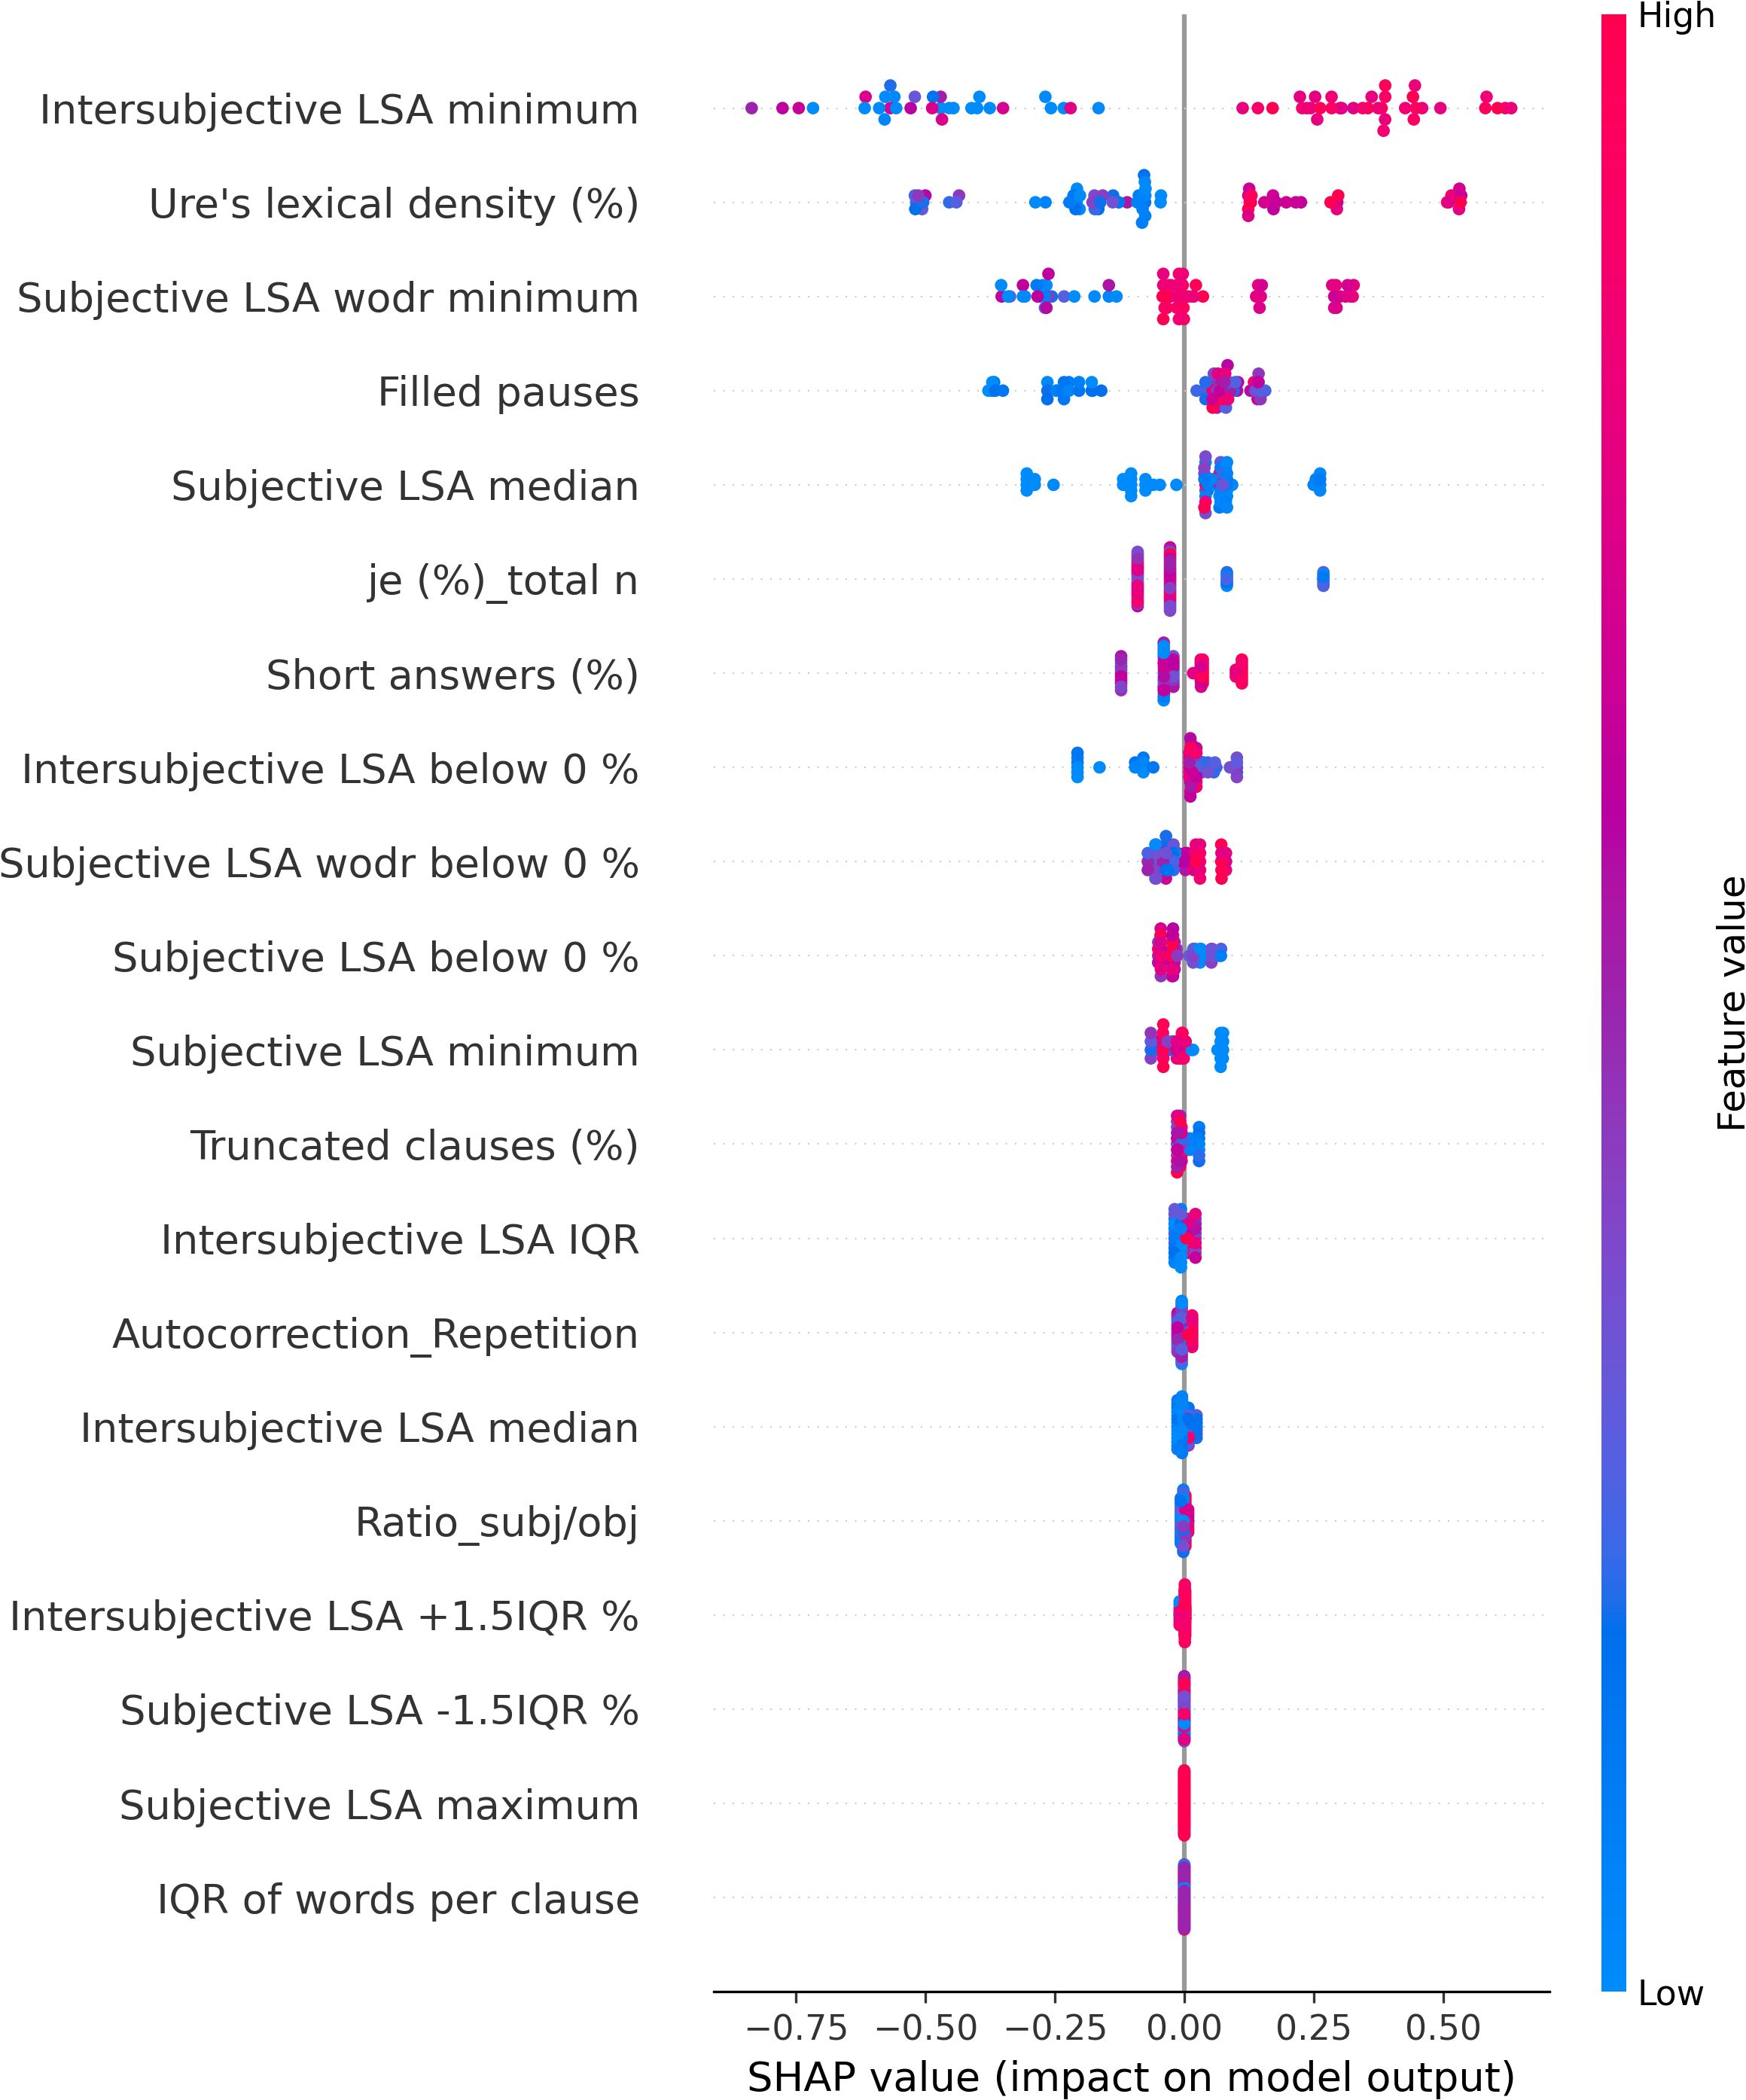
Figure 4. SHAP values of Not-At-Risk patients.
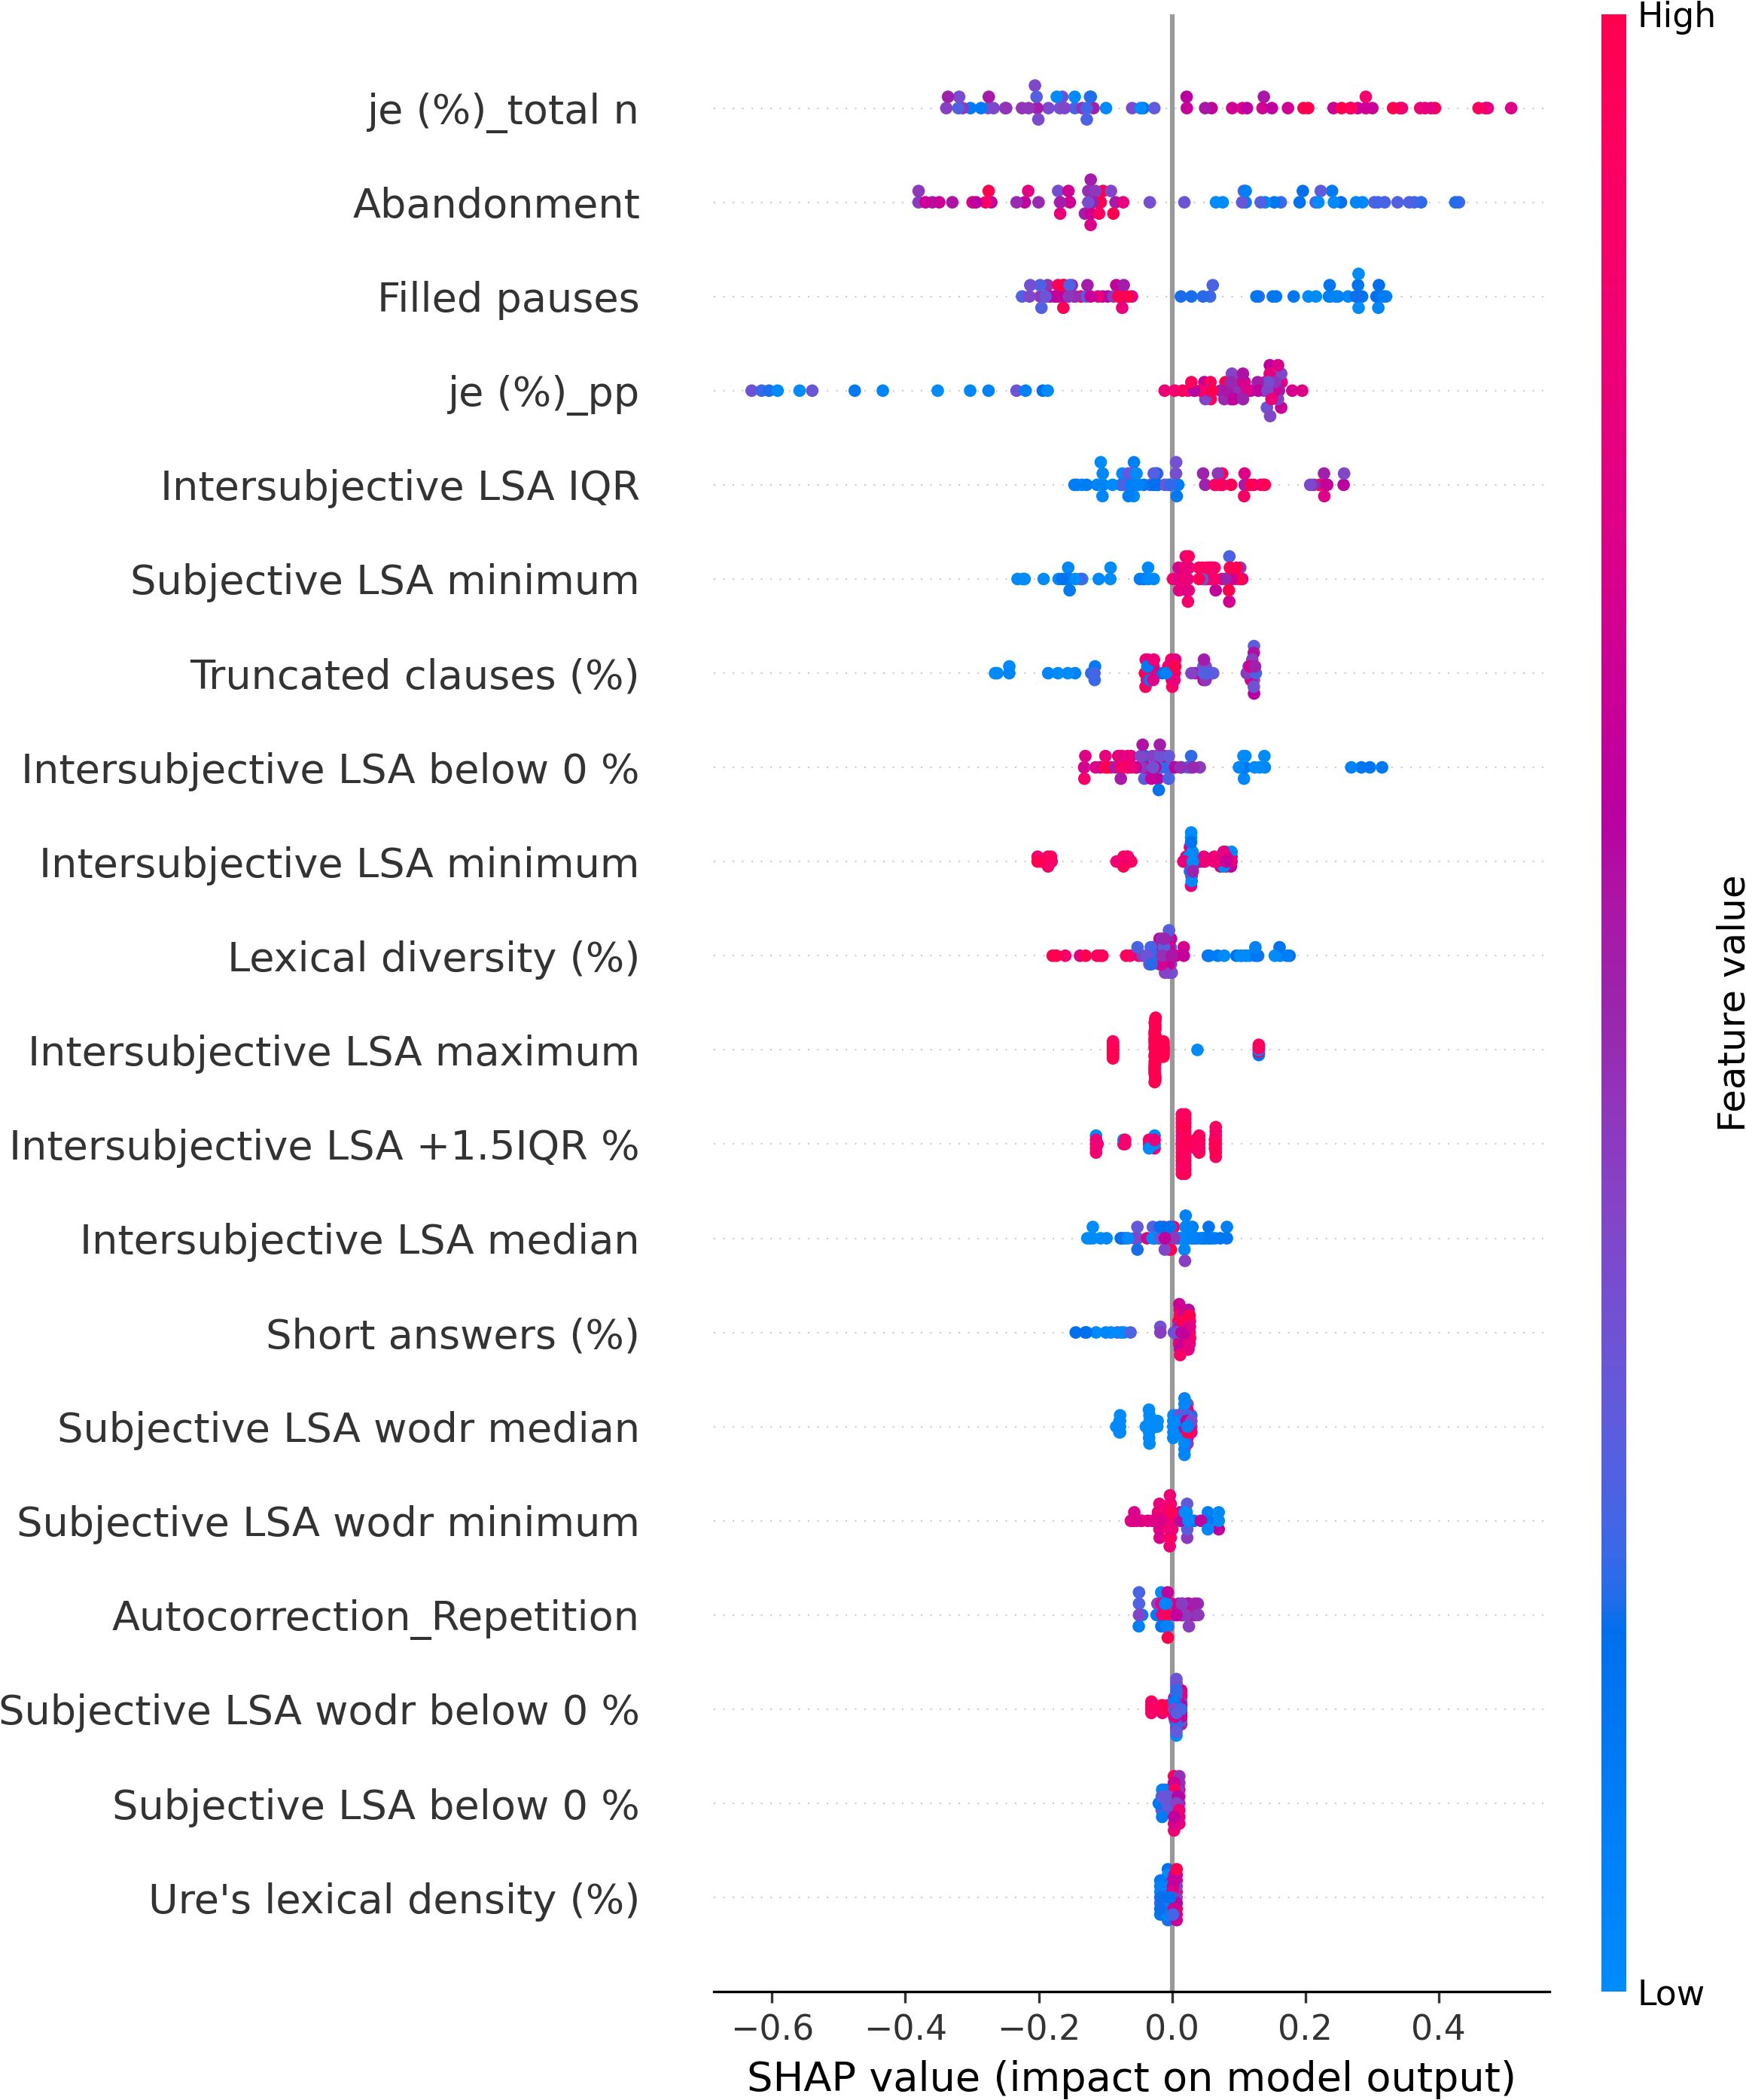
Figure 5. SHAP values of At-Risk patients.
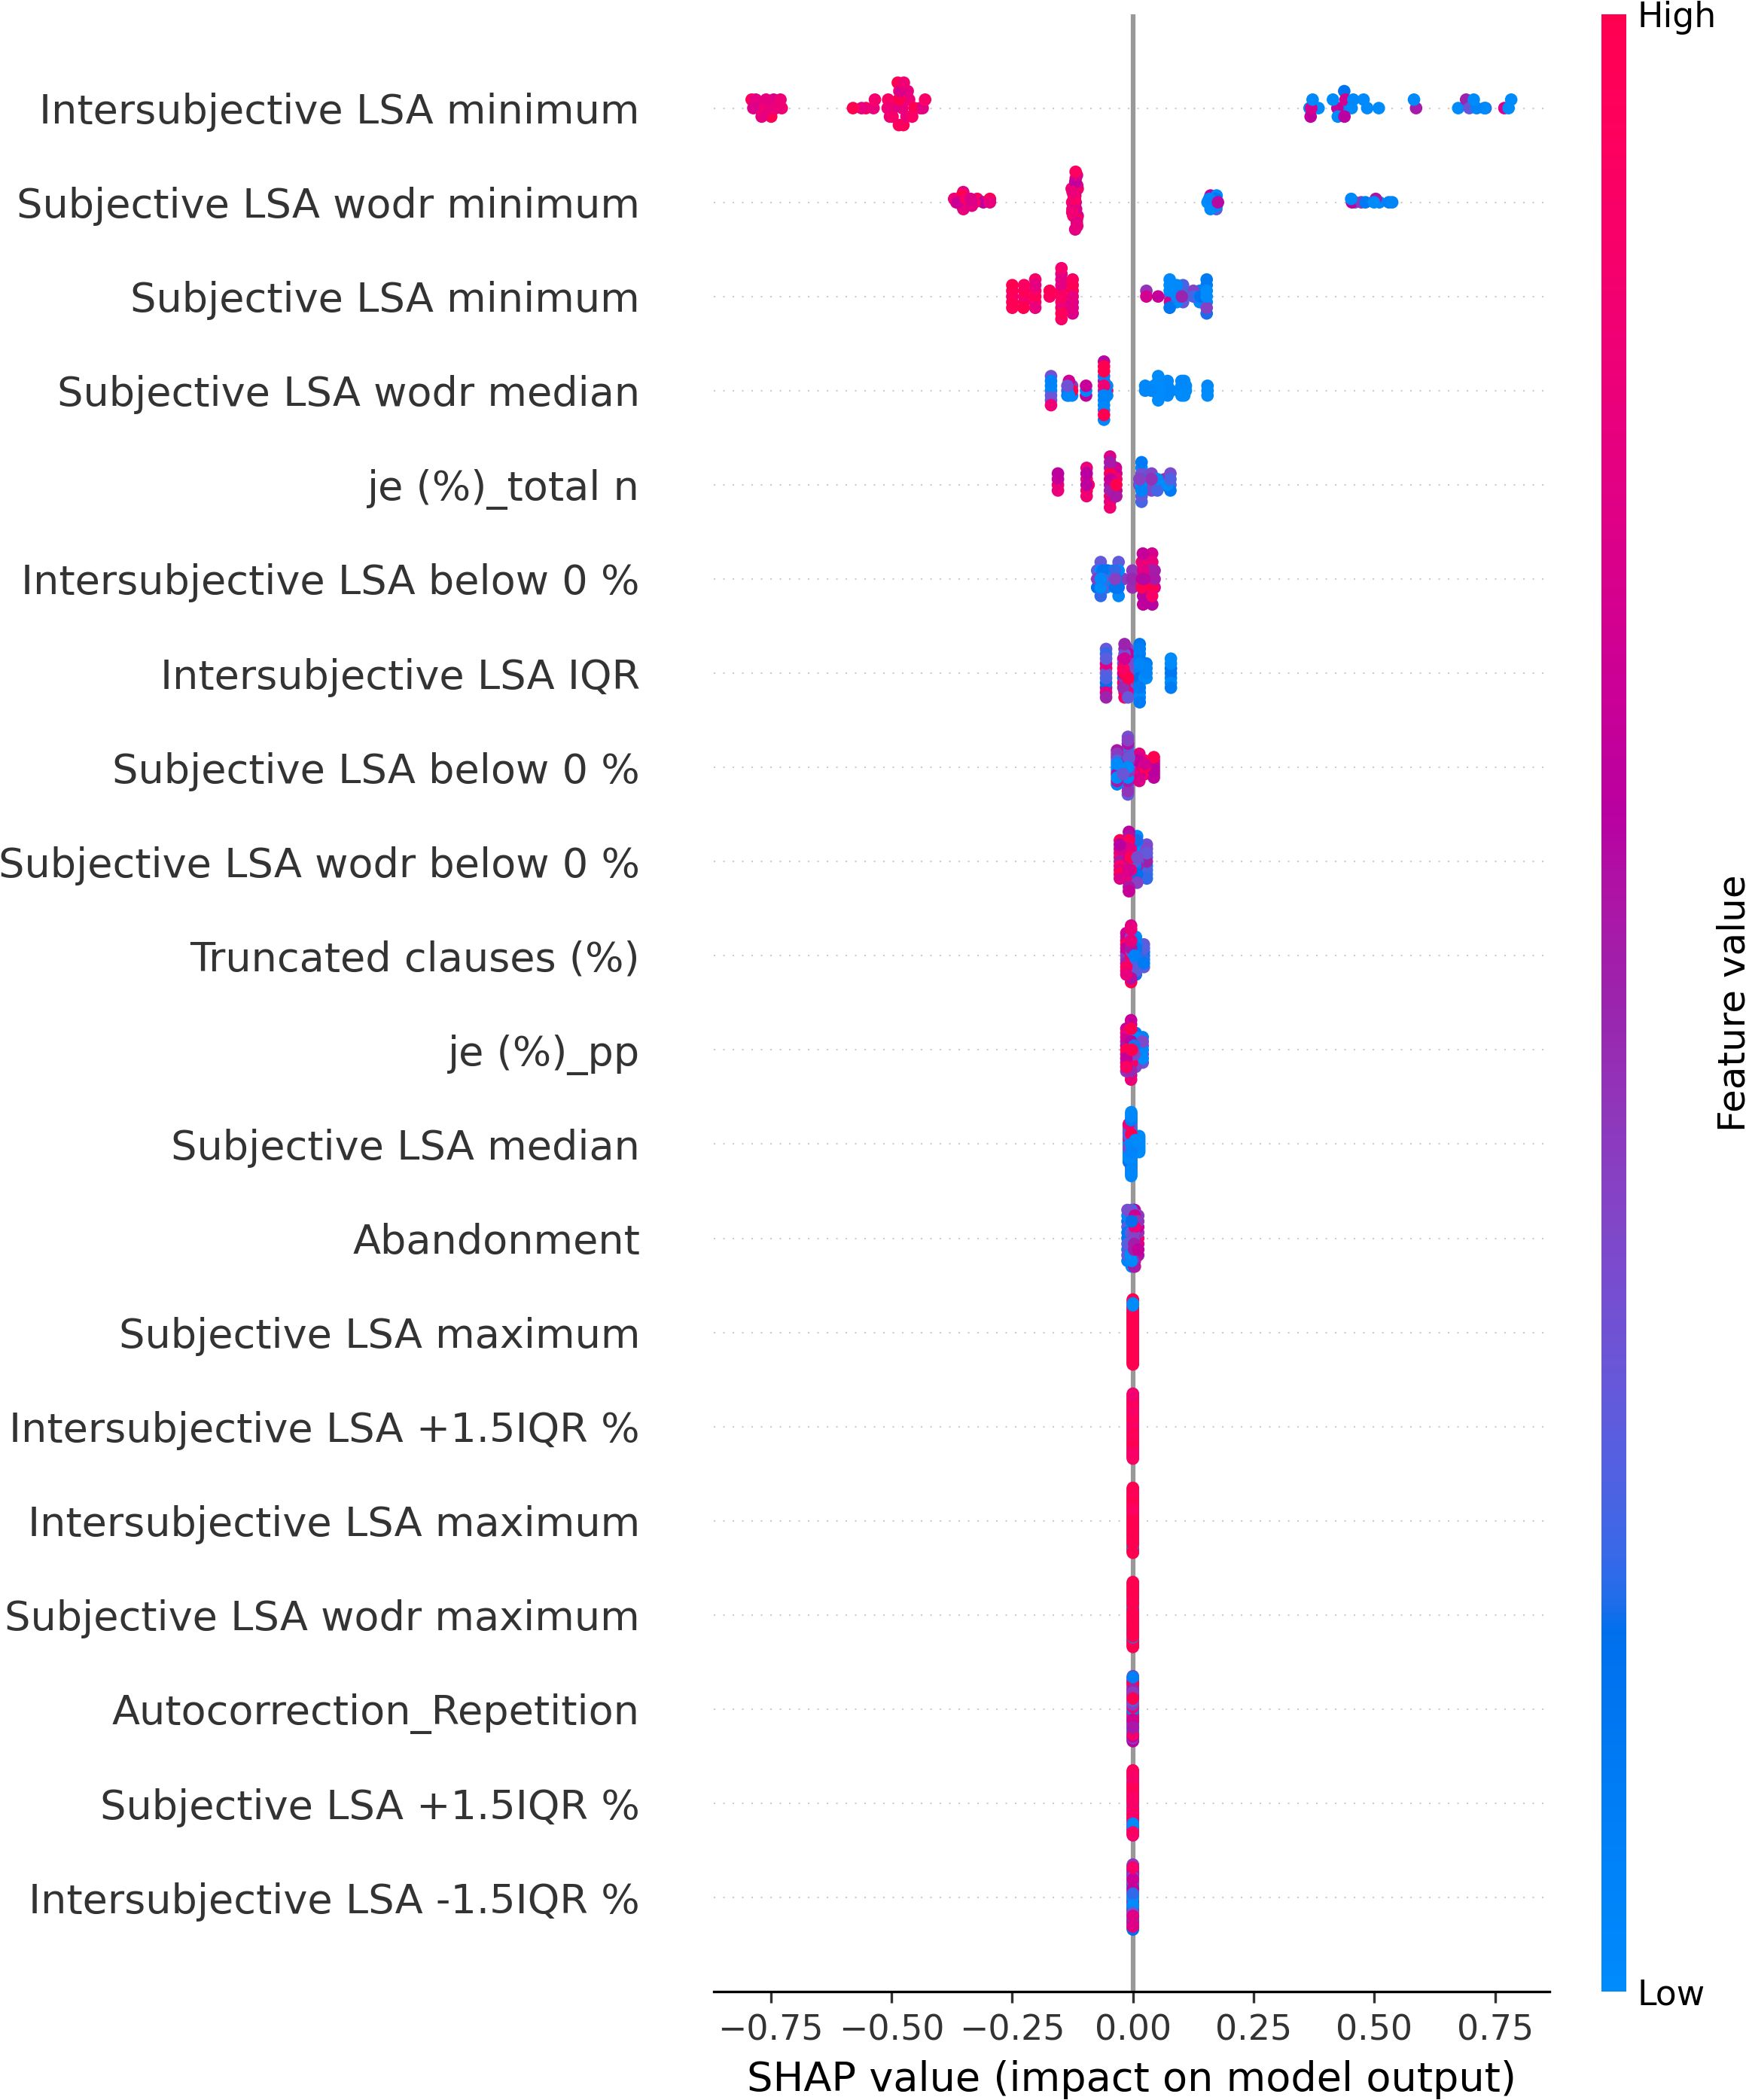
Figure 6. SHAP values of First Episode of Psychosis patients.
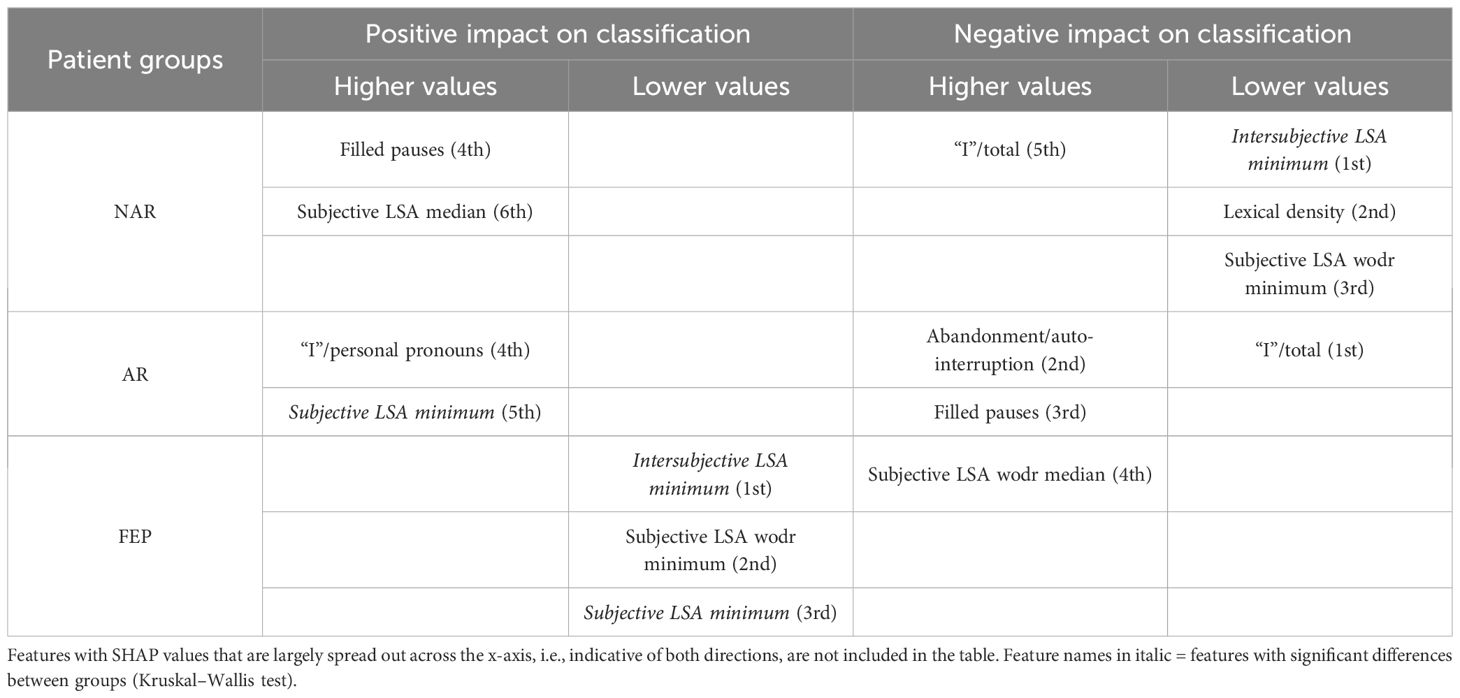
Table 3. Overview of the directions (positive and negative impacts on classification) and magnitudes (higher and lower values marked with ordinal numbers) of linguistic markers based on SHAP values.
4 Discussion
The present study aimed at detecting relevant linguistic markers that could classify French-speaking UHR patients by their status at T0 and seeking to explain the classification results with regard to linguistic manifestations observed in the clinic. The results showed that our model based on XGBoost, SMOTE, and the SHAP values could get good performance through the interplay of the four linguistic markers obtained from a feature importance method using the SHAP values on the original data. These mean absolute SHAP values as feature importance revealed that the two uppermost features pertained to semantic coherence, the third most important to the use of “I,” and the last important feature was one of the disfluency-related elements, filled pauses. The two hypotheses thereby turned out to be true—semantic coherence and the use of “I” played a key role in the classification. The four linguistic markers identified pertain to weak coherence (intersubjective LSA minimum and subjective LSA wodr minimum, i.e., the lowest LSA score in each patient), self-related subject pronoun (the proportion of “I” to the total number of words), and disfluency (filled pauses).
Semantic incoherence has been reported to be a linguistic characteristic in FEP or schizophrenia (8, 10, 20, 40–42, 45, 46, 56). It is noteworthy that lower minimum scores contribute positively to FEP and negatively to NAR regardless of the LSA type. Higher minimum scores in subjective LSA appear to have a positive impact on classifying AR. The feature intersubjective LSA minimum turned out to have significant differences in Kruskal–Wallis and Dunn’s tests and a much greater impact on predictions than the other markers. This type of coherence was calculated between consecutive pairs of speech turns. Studies on coherence have been focused on patients’ utterances (40–44, 49, 52) like subjective LSA wodr (only-patient LSA) in our study. A dialogue is constructed within the framework of turn-taking described as a type of social organization that is implicated in speech exchange systems (103). For a dialogue to be coherent, a response should be fluent, consistent, context related (104), and the respondent should understand conventional meaning and catch their interlocutor’s intention. Dialogue coherence is thereby grounded in Speech Act Theory (105, 106) as well as related theories on conversation analysis and discursive pragmatics (107–109), wherein semantics and pragmatics are entailed. This weak dialogue coherence could partly explain some occasional strange speech and social interaction impairment in patients. Higher median values in subjective LSA contribute positively to NAR classification, whereas higher subjective LSA wodr median scores have a negative impact on FEP. Taken together, these results suggest that weak coherence is a marker of FEP even though it is still somewhat premature to generalize this finding due to the small sample size of FEP in the current study.
The use of the first-person singular pronouns in schizophrenia has been explored in some studies whose results were opposite to one another. When compared to patients with mood disorder, schizophrenics used fewer first-person singular pronouns (26) whereas these pronouns were more frequent in individuals with schizophrenia than healthy controls (28, 29, 56). The present study focused on the first-person singular subject pronoun “I.” The results showed no significant difference between groups, and higher and lower scores of “I” in FEP do not provide unequivocal contribution types contrary to what has been reported in the literature. However, more frequent use of “I” has a positive impact on AR classification, whereas it contributes negatively to NAR. The difference between the findings in the aforementioned studies and ours could be due to the differences in the populations compared (mood disorder vs. schizophrenia, healthy individuals vs. people with schizophrenia, NAR vs. FEP, and AR vs. FEP) and the pronouns compared (first-person singular pronouns; first-person singular subjective pronoun). The frequency of “I” in this study allowed differentiating between NAR and AR. The more frequent use of “I” in AR might indicate their more intense emotional distress compared to the NAR group as the statuses are the outcome of the CAARMS that assesses “emotional disturbance” in one of the seven subscales. Rude and colleagues showed that depressed college students used “I” more frequently—not the other first-person singular pronouns such as “me” or “myself”—than non-depressed peers (110). The differentiation between NAR and AR by the frequency of “I” might be indicative of more self-centered speech of AR and explained by their considering the self to be a solitary actor/agent as proposed by Rude and colleagues in (110). The meaning of higher and lower values in the frequency of “I” found in both directions in FEP is unclear and intriguing to us, but it might be partly explained by current affective disorders that turned out to be significantly more common in at-risk mental state than FEP (111). This claim does not refute the interpretation of the aforementioned differentiation between NAR and AR.
A filled pause is an uttered sound that fills a momentary interruption in speech production. When considered a pragmatic function, it has several functions such as discourse planning and structuring, and turn-taking (112) by signaling delays when a speaker stalls for time to retrieve information and wishes to continue their utterance (113). When considered a speech disfluency element, filled pauses are symptomatic of production difficulties (114). In the present study, the feature filled pauses is another marker that allows differentiation between NAR and AR. Its higher values contribute positively to NAR and negatively to AR. No impact of this disfluency element is observed on FEP classification. Another disfluency element, abandonment/auto-interruption, plays a role in classifying AR. When its scores are higher, it has a negative impact on AR predictions. It has been reported that patients with schizophrenia use fewer filled pauses (74, 115, 116) and produce longer filled pauses than healthy controls (117). Interestingly, Costa and Silva found that filled pauses before personal pronouns produced by patients with schizophrenia were twice as long as others, and the pronouns are mostly first-person singular pronouns (117). It was argued by the authors that their result could be explained by patients’ possible difficulties with self-reference. Filled pauses have ambivalent roles as mentioned above—they not only help speech production but also indicate hesitations and difficulties. Lower values in filled pauses in AR in this study, and fewer thereof in FEP in the literature, could be interpreted as indicative of somewhat disturbed pragmatic functions rather than speech disfluency. No contribution of filled pauses to FEP predictions contrary to what has been reported in the literature may be due to different populations compared (schizophrenia vs. FEP) and the small number of FEP patients in the current study.
The present exploratory study used recordings of the first consultations, a non-invasive method that does not transcend the classic healthcare frames, while allowing data collection under the same conditions for all participants. Our results provided evidence that a small number of linguistic markers without demographic or clinical data could classify UHR patients even at T0, that is, when patients do probably not present with obvious abnormalities in language behaviors. Besides, even healthy controls can experience mild language abnormalities (118), which could make language analyses more subtle and complicated. It should be pointed out that even though the AR patient at T0 who was misclassified into NAR is a single case of the kind in the present study, this misclassification—along with the other seven patients with their statuses at T2 who were correctly classified—is encouraging. It should cautiously be noted that the small number of FEP along with possible linguistic and cultural differences could make it somewhat delicate to generalize the results. However, the possible linguistic and cultural factor may not intervene in FTD as a systemic review article suggests a three-factor FTD structure with two prominent dimensions (disorganization and negative dimensions) is likely consistent and robust across languages (119). As a number of studies in the literature have also shown disturbed semantic coherence in FEP and schizophrenia, it could be argued that at least semantic disturbances are a universal linguistic manifestation of patients with psychosis regardless of languages and cultures. The SHAP values provided a local interpretation or the contribution of each feature to the classification. Even some features, such as the frequency of “I,” filled pauses, subjective LSA wodr minimum, wherein no significant group difference was observed, showed distinctive differences in the directions of the SHAP values and/or the magnitude. These differences would more likely reflect very subtle differences between patient groups recorded at a very early stage of care in psychiatry than an overfitting issue, since the model went through a cross-validation phase, although it was with a small k value. The SHAP explainability method could thereby allow getting deeper insight into the linguistic characteristics and speech patterns of each category of patients, which could lead to improving diagnostic methods.
5 Limitation
The current study lacks FEP patients and the 2-year statuses of most patients. In addition, our dataset is relatively small and imbalanced, which led us to carrying out an exploratory study to test the feasibility and potential of a gradient boosting model using only linguistic data. With new transformer-based models, such as BERT and SBERT, as well as word-embedding models, like GloVe, LSA is considered by some to be outdated, despite its advantages, mainly because LSA does not consider word order and context. This weakness might be critical to clinical data. It would therefore be interesting to use a new model combining LSA and BERT (BERT-LSA) (120) or other models in a future study. The inclusion of more patients and their statuses at T2 would allow more robust models and more accurate model performance evaluations. It is therefore planned to continue to record UHR patients, include more FEP, and analyze their speech using more classifiers for performance comparisons in search of a good diagnostic aid tool.
Data availability statement
The datasets presented in this article are not readily available due to medical confidentiality. Requests to access the datasets should be directed to D-HK-D, ZGgua2ltZHVmb3JAZ21haWwuY29t.
Ethics statement
The studies involving humans were approved by Comité de Protection des Personnes EST-III (CPP:18.04.03, ID-RCB: 2017-A02702-51). The studies were conducted in accordance with the local legislation and institutional requirements. Written informed consent for participation in this study was provided by the participants’ legal guardians/next of kin.
Author contributions
DK: Writing – review & editing, Conceptualization, Investigation, Writing – original draft, Data curation, Formal Analysis, Methodology, Software, Visualization. MW: Conceptualization, Writing – original draft, Writing – review & editing, Funding acquisition, Project administration, Validation. M-OK: Writing – review & editing, Funding acquisition, Project administration, Validation. YH: Writing – review & editing. PL: Writing – original draft, Writing – review & editing. CL: Writing – original draft, Data curation, Validation, Methodology, Investigation, Writing – review & editing, Funding acquisition, Conceptualization.
Funding
The author(s) declare that financial support was received for the research and/or publication of this article. This work has been supported by the French government’s “Investissement d’Avenir” program, which is managed by the Agence Nationale de la Recherche (ANR), under the reference PsyCARE ANR-18–429 RHUS-0014.
Acknowledgments
We would like to thank the psychiatrists and research nurses at the CEVUP, CHU de Brest, for recording their consultations and helping us out with clinical data. We are also grateful to Catherine and Valentine for the transcription.
Conflict of interest
The authors declare that the research was conducted in the absence of any commercial or financial relationships that could be construed as a potential conflict of interest.
Generative AI statement
The author(s) declare that no Generative AI was used in the creation of this manuscript.
Publisher’s note
All claims expressed in this article are solely those of the authors and do not necessarily represent those of their affiliated organizations, or those of the publisher, the editors and the reviewers. Any product that may be evaluated in this article, or claim that may be made by its manufacturer, is not guaranteed or endorsed by the publisher.
Supplementary material
The Supplementary Material for this article can be found online at: https://www.frontiersin.org/articles/10.3389/fpsyt.2025.1595197/full#supplementary-material
References
1. Fatouros-Bergman H, Cervenka S, Flyckt L, Edman G, and Farde L. Meta-analysis of cognitive performance in drug-naïve patients with schizophrenia. Schizophr Res. (2014) 158:156–62. doi: 10.1016/j.schres.2014.06.034
2. Larsen TK, Melle I, Auestad B, Haahr U, Joa I, Johannessen JO, et al. Early detection of psychosis: positive effects on 5-year outcome. psychol Med. (2011) 41:1461–9. doi: 10.1017/S0033291710002023
3. Murru A and Carpiniello B. Duration of untreated illness as a key to early intervention in schizophrenia: a review. Neurosci Lett. (2018) 669:59–67. doi: 10.1016/j.neulet.2016.10.003
5. Howes OD, Whitehurst T, Shatalina E, Townsend L, Onwordi EC, Mak TLA, et al. The clinical significance of duration of untreated psychosis: an umbrella review and random-effects meta-analysis. World Psychiatry. (2021) 20:75–95. doi: 10.1002/wps.20822
6. Yu M, Tan Q, Wang Y, Xu Y, Wang T, Liu D, et al. Correlation between duration of untreated psychosis and long-term prognosis in chronic schizophrenia. Front Psychiatry. (2023) 14:1112657. doi: 10.3389/fpsyt.2023.1112657
7. Fusar-Poli P, Cappucciati M, Borgwardt S, Woods SW, Addington J, Nelson B, et al. Heterogeneity of psychosis risk within individuals at clinical high risk: a meta-analytical stratification. JAMA Psychiatry. (2016) 73:113–20. doi: 10.1001/jamapsychiatry.2015.2324
8. Andreasen NC. Scale for the assessment of thought, language, and communication (TLC). Schizophr Bull. (1986) 12:473. doi: 10.1093/schbul/12.3.473
9. Covington MA, He C, Brown C, Naçi L, McClain JT, Fjordbak BS, et al. Schizophrenia and the structure of language: the linguist’s view. Schizophr Res. (2005) 77:85–98. doi: 10.1016/j.schres.2005.01.016
10. Kuperberg GR. Language in schizophrenia part 1: an introduction. Lang Linguistics Compass. (2010) 4:576–89. doi: 10.1111/j.1749-818X.2010.00216.x
11. Hinzen W and Rosselló J. The linguistics of schizophrenia: thought disturbance as language pathology across positive symptoms. Front Psychol. (2015) 6:126923. doi: 10.3389/fpsyg.2015.00971
12. Ehlen F, Montag C, Leopold K, and Heinz A. Linguistic findings in persons with schizophrenia—a review of the current literature. Front Psychol. (2023) 14:1287706. doi: 10.3389/fpsyg.2023.1287706
13. Whitehorn JC and Zipf GK. Schizophrenic language. Arch Neurol Psychiatry. (1943) 49:831–51. doi: 10.1001/archneurpsyc.1943.02290180055006
14. Lorenz M. Problems posed by schizophrenic language. Arch Gen Psychiatry. (1961) 4:603–10. doi: 10.1001/archpsyc.1961.01710120073008
15. Wolcott RH. Schizophrenese: A private language. J Health Soc Behav. (1970) 11:126–34. doi: 10.2307/2948472
16. Chaika E. A linguist looks at “schizophrenic” language. Brain Language. (1974) 1:257–76. doi: 10.1016/0093-934X(74)90040-6
17. Baskak B, Ozel ET, Atbasoglu EC, and Baskak SC. Peculiar word use as a possible trait marker in schizophrenia. Schizophr Res. (2008) 103:311–7. doi: 10.1016/j.schres.2008.04.025
18. Champagne-Lavau M and Stip E. Pragmatic and executive dysfunction in schizophrenia. J Neurolinguistics. (2010) 23:285–96. doi: 10.1016/j.jneuroling.2009.08.009
19. Moro A, Bambini V, Bosia M, Anselmetti S, Riccaboni R, Cappa SF, et al. Detecting syntactic and semantic anomalies in schizophrenia. Neuropsychologia. (2015) 79:147–57. doi: 10.1016/j.neuropsychologia.2015.10.030
20. Allé MC, Potheegadoo J, Köber C, Schneider P, Coutelle R, Habermas T, et al. Impaired coherence of life narratives of patients with schizophrenia. Sci Rep. (2015) 5:12934. doi: 10.1038/srep12934
21. Haas MH, Chance SA, Cram DF, Crow TJ, Luc A, and Hage S. Evidence of pragmatic impairments in speech and proverb interpretation in schizophrenia. J Psycholinguist Res. (2015) 44:469–83. doi: 10.1007/s10936-014-9298-2
22. Sass LA and Parnas J. Schizophrenia, consciousness, and the self. Schizophr Bull. (2003) 29:427–44. doi: 10.1093/oxfordjournals.schbul.a007017
23. Nelson B, Fornito A, Harrison BJ, Yücel M, Sass LA, Yung AR, et al. A disturbed sense of self in the psychosis prodrome: Linking phenomenology and neurobiology. Neurosci Biobehav Rev. (2009) 33:807–17. doi: 10.1016/j.neubiorev.2009.01.002
24. Moe AM and Docherty NM. Schizophrenia and the sense of self. Schizophr Bull. (2014) 40:161–8. doi: 10.1093/schbul/sbt121
25. Buck B and Penn DL. Lexical characteristics of emotional narratives in schizophrenia: relationships with symptoms, functioning, and social cognition. J Nervous Ment Dis. (2015) 203:702–8. doi: 10.1097/NMD.0000000000000354
26. Fineberg SK, Deutsch-Link S, Ichinose M, McGuinness T, Bessette AJ, Chung CK, et al. Word use in first-person accounts of schizophrenia. Br J Psychiatry. (2015) 206:32–8. doi: 10.1192/bjp.bp.113.140046
27. Fineberg SK, Leavitt J, Deutsch-Link S, Dealy S, Landry CD, Pirruccio K, et al. Self-reference in psychosis and depression: a language marker of illness. Psychol Med. (2016) 46:2605–15. doi: 10.1017/S0033291716001215
28. Tang SX, Kriz R, Cho S, Park SJ, Harowitz J, Gur RE, et al. Natural language processing methods are sensitive to sub-clinical linguistic differences in schizophrenia spectrum disorders. NPJ Schizophr. (2021) 7:25. doi: 10.1038/s41537-021-00154-3
29. Chan CC, Norel R, Agurto C, Lysaker PH, Myers EJ, Hazlett EA, et al. Emergence of language related to self-experience and agency in autobiographical narratives of individuals with schizophrenia. Schizophr Bull. (2023) 49:444–53. doi: 10.1093/schbul/sbac126
30. Morice RD and Ingram JCL. Language analysis in schizophrenia: diagnostic implications. Aust N Z J Psychiatry. (1982) 16:11–21. doi: 10.3109/00048678209161186
31. Fraser WI, King KM, Thomas P, and Kendell RE. The diagnosis of schizophrenia by language analysis. Br J Psychiatry. (1986) 148:275–8. doi: 10.1192/bjp.148.3.275
32. Thomas P, King K, and Fraser WI. Positive and negative symptoms of schizophrenia and linguistic performance. Acta Psychiatr Scand. (1987) 76:144–51. doi: 10.1111/j.1600-0447.1987.tb02877.x
33. Lin E, Lin CH, and Lane HY. Prediction of functional outcomes of schizophrenia with genetic biomarkers using a bagging ensemble machine learning method with feature selection. Sci Rep. (2021) 11:10179. doi: 10.1038/s41598-021-89540-6
34. Kraguljac NV, McDonald WM, Widge AS, Rodriguez CI, Tohen M, and Nemeroff CB. Neuroimaging biomarkers in schizophrenia. Am J Psychiatry. (2021) 178:509–21. doi: 10.1176/appi.ajp.2020.20030340
35. Rodrigues-Amorim D, Rivera-Baltanás T, López M, Spuch C, Olivares JM, and Agís-Balboa RC. Schizophrenia: a review of potential biomarkers. J Psychiatr Res. (2017) 93:37–49. doi: 10.1016/j.jpsychires.2017.05.009
36. Corcoran CM and Cecchi GA. Using language processing and speech analysis for the identification of psychosis and other disorders. Biol Psychiatry: Cogn Neurosci Neuroimag. (2020) 5:770–9. doi: 10.1016/j.bpsc.2020.06.004
37. Le Glaz A, Haralambous Y, Kim-Dufor DH, Lenca P, Billot R, Ryan TC, et al. Machine learning and natural language processing in mental health: systematic review. J Med Internet Res. (2021) 23:e15708. doi: 10.2196/15708
38. Corcoran CM, Mittal VA, Bearden CE, Gur RE, Hitczenko K, Bilgrami Z, et al. Language as a biomarker for psychosis: a natural language processing approach. Schizophr Res. (2020) 226:158–66. doi: 10.1016/j.schres.2020.04.032
39. Hitczenko K, Mittal VA, and Goldrick M. Understanding language abnormalities and associated clinical markers in psychosis: the promise of computational methods. Schizophr Bull. (2021) 47:344–62. doi: 10.1093/schbul/sbaa141
40. Elvevåg B, Foltz PW, Weinberger DR, and Goldberg TE. Quantifying incoherence in speech: an automated methodology and novel application to schizophrenia. Schizophr Res. (2007) 93:304–16. doi: 10.1016/j.schres.2007.03.001
41. Bedi G, Carrillo F, Cecchi GA, Slezak DF, Sigman M, Mota NB, et al. Automated analysis of free speech predicts psychosis onset in high-risk youths. NPJ Schizophr. (2015) 1:1–7. doi: 10.1038/npjschz.2015.30
42. Corcoran CM, Carrillo F, Fernández-Slezak D, Bedi G, Klim C, Javitt DC, et al. Prediction of psychosis across protocols and risk cohorts using automated language analysis. World Psychiatry. (2018) 17:67–75. doi: 10.1002/wps.20491
43. Morgan SE, Diederen K, Vértes PE, Ip SHY, Wang B, Thompson B, et al. Natural Language Processing markers in first episode psychosis and people at clinical high-risk. Transl Psychiatry. (2021) 11:630. doi: 10.1038/s41398-021-01722-y
44. Gargano G, Caletti E, Perlini C, Turtulici N, Bellani M, Bonivento C, et al. Language production impairments in patients with a first episode of psychosis. PloS One. (2022) 17:e0272873. doi: 10.1371/journal.pone.0272873
45. Mota NB, Vasconcelos NAP, Lemos N, Pieretti AC, Kinouchi O, Cecchi GA, et al. Speech graphs provide a quantitative measure of thought disorder in psychosis. PloS One. (2012) 7:e34928. doi: 10.1371/journal.pone.0034928
46. Mota NB, Furtado R, Maia PP, Copelli M, and Ribeiro S. Graph analysis of dream reports is especially informative about psychosis. Sci Rep. (2014) 4:3691. doi: 10.1038/srep03691
47. Mota NB, Copelli M, and Ribeiro S. Thought disorder measured as random speech structure classifies negative symptoms and schizophrenia diagnosis 6 months in advance. NPJ Schizophr. (2017) 3:18. doi: 10.1038/s41537-017-0019-3
48. Spencer TJ, Thompson B, Oliver D, Diederen K, Demjaha A, Weinstein S, et al. Lower speech connectedness linked to incidence of psychosis in people at clinical high risk. Schizophr Res. (2021) 228:493–501. doi: 10.1016/j.schres.2020.09.002
49. Figueroa-Barra A, Del Aguila D, Cerda M, Gaspar PA, Terissi LD, Durán M, et al. Automatic language analysis identifies and predicts schizophrenia in first-episode of psychosis. Schizophrenia. (2022) 8:53. doi: 10.1038/s41537-022-00259-3
50. Oomen PP, De Boer JN, Brederoo SG, Voppel AE, Brand BA, Wijnen FNK, et al. Characterizing speech heterogeneity in schizophrenia-spectrum disorders. J Psychopathol Clin Sci. (2022) 131:172–81. doi: 10.1037/abn0000736
51. Bambini V, Frau F, Bischetti L, Cuoco F, Bechi M, Buonocore M, et al. Deconstructing heterogeneity in schizophrenia through language: a semi-automated linguistic analysis and data-driven clustering approach. Schizophr. (2022) 8:102. doi: 10.1038/s41537-022-00306-z
52. Voppel AE, De Boer JN, Brederoo SG, Schnack HG, and Sommer IEC. Semantic and acoustic markers in schizophrenia-spectrum disorders: A combinatory machine learning approach. Schizophr Bull. (2023) 49:S163–71. doi: 10.1093/schbul/sbac142
53. Foster P, Tonkyn A, and Wigglesworth G. Measuring spoken language: A unit for all reasons. Appl Linguist. (2000) 21:354–75. doi: 10.1093/applin/21.3.354
54. Templin M. Certain language skills in children: their development and interrelationships. Minneapolis: University of Minnesota Press (1957).
56. Lundin NB, Cowan HR, Singh DK, and Moe AM. Lower cohesion and altered first-person pronoun usage in the spoken life narratives of individuals with schizophrenia. Schizophr Res. (2023) 259:140–9. doi: 10.1016/j.schres.2023.04.001
57. Pointal L. TreeTaggerWrapper. Laboratoire d’Informatique pour la Mécanique et les Sciences de l’Ingénieur, Laboratoire Interdisciplinaire des Sciences du Numérique. Paris, France: CNRS (2016).
58. Halliday MAK and Matthiessen CM. Halliday’s introduction to functional grammar. Milton Park, Abingdon, UK: Routledge (2013).
59. Cook WA. Introduction to tagmemic analysis. Washington D.C., USA: Georgetown University Press (1969).
60. Bever TG, Lackner J, and Kirk R. The underlying structures of sentences are the primary units of immediate speech processing. Percept Psychophys. (1969) 5:225–34. doi: 10.3758/BF03210545
61. Szmrecsányi B. On operationalizing syntactic complexity. Le poids des mots. Proceedings of the 7th international conference on textual data statistical analysis. Louvain-la-Neuve. (2004). 2:1032–9.
62. Landauer TK, Foltz PW, and Laham D. An introduction to latent semantic analysis. Discourse Processes. (1998) 25:259–84. doi: 10.1080/01638539809545028
63. Landauer TK, McNamara DS, Dennis S, and Kintsch W. Handbook of latent semantic analysis. Milton Park, Abingdon, UK: Routledge (2011).
64. Elvevåg B, Foltz PW, Rosenstein M, and DeLisi LE. An automated method to analyze language use in patients with schizophrenia and their first-degree relatives. J Neurolinguistics. (2010) 23:270–84. doi: 10.1016/j.jneuroling.2009.05.002
65. Holshausen K, Harvey PD, Elvevåg B, Foltz PW, and Bowie CR. Latent semantic variables are associated with formal thought disorder and adaptive behavior in older inpatients with schizophrenia. Cortex. (2014) 55:88–96. doi: 10.1016/j.cortex.2013.02.006
66. Wiemer-Hastings P. How latent is latent semantic analysis? Proceedings of the 16th international joint conference on Artificial intelligence. San Francisco, CA (1999) p. 932–7.
67. Graesser AC, McNamara DS, Louwerse MM, and Cai Z. Coh-Metrix: Analysis of text on cohesion and language. Behav Res Methods Instrum Computers. (2004) 36:193–202. doi: 10.3758/BF03195564
68. McNamara DS, Graesser AC, McCarthy PM, and Cai Z. Automated Evaluation of Text and Discourse with Coh-Metrix. 1st ed. Cambridge, UK: Cambridge University Press (2014). Available at: https://www.cambridge.org/core/product/identifier/9780511894664/type/book (Accessed January 20, 2025).
69. Willits JA, Rubin T, Jones MN, Minor KS, and Lysaker PH. Evidence of disturbances of deep levels of semantic cohesion within personal narratives in schizophrenia. Schizophr Res. (2018) 197:365–9. doi: 10.1016/j.schres.2017.11.014
70. Gupta T, Hespos SJ, Horton WS, and Mittal VA. Automated analysis of written narratives reveals abnormalities in referential cohesion in youth at ultra high risk for psychosis. Schizophr Res. (2018) 192:82–8. doi: 10.1016/j.schres.2017.04.025
71. Mackinley M, Chan J, Ke H, Dempster K, and Palaniyappan L. Linguistic determinants of formal thought disorder in first episode psychosis. Early Intervent Psych. (2021) 15:344–51. doi: 10.1111/eip.12948
72. Lemaire B. Limites de la lemmatisation pour l’extraction de significations. In. (2008) p:725–32.
73. Harley TA. The psychology of language: From data to theory. London, UK: Psychology press (2013).
74. Howes C, Lavelle M, Healey PG, Hough J, and McCabe R. Disfluencies in dialogues with patients with schizophrenia. Proceedings of the Annual Meeting of the Cognitive Science Society (2017) 39.
75. Vail AK, Liebson E, Baker JT, and Morency LP. Toward objective, multifaceted characterization of psychotic disorders: Lexical, structural, and disfluency markers of spoken language. Proceedings of the 20th ACM International Conference on Multimodal Interaction (2018), 170–178. doi: 10.1145/3242969
76. Çokal D, Zimmerer V, Turkington D, Ferrier N, Varley R, Watson S, et al. Disturbing the rhythm of thought: Speech pausing patterns in schizophrenia, with and without formal thought disorder. PloS One. (2019) 14:e0217404. doi: 10.1371/journal.pone.0217404
77. Virtanen P, Gommers R, Oliphant TE, Haberland M, Reddy T, Cournapeau D, et al. SciPy 1.0: fundamental algorithms for scientific computing in Python. Nat Methods. (2020) 17:352–2. doi: 10.1038/s41592-020-0772-5
78. Seabold S and Perktold J. Statsmodels: Econometric and Statistical Modeling with Python. Austin, Texas: SciPy (2010) p. 92–6. doi: 10.25080/Majora-92bf1922-011
79. Chen T and Guestrin C. XGBoost: A scalable tree boosting system. In: Proceedings of the 22nd ACM SIGKDD International Conference on Knowledge Discovery and Data Mining. ACM, San Francisco California USA (2016). p. 785–94. doi: 10.1145/2939672.2939785
80. Friedman JH. Greedy function approximation: a gradient boosting machine. Ann Stat. (2001) 29:1189–232. doi: 10.1214/aos/1013203451
81. Chen T, He T, Benesty M, and Tang Y. Understand your dataset with XGBoost. Available online at: https://cran.r-project.org/web/packages/xgboost/vignettes/discoverYourData.html (Accessed March 11, 2024).
82. Zou M, Jiang WG, Qin QH, Liu YC, and Li ML. Optimized XGBoost model with small dataset for predicting relative density of Ti-6Al-4V parts manufactured by selective laser melting. Materials. (2022) 15:5298. doi: 10.3390/ma15155298
83. Xu P, Ji X, Li M, and Lu W. Small data machine learning in materials science. NPJ Comput Mater. (2023) 9:42. doi: 10.1038/s41524-023-01000-z
84. Chawla NV, Bowyer KW, Hall LO, and Kegelmeyer WP. SMOTE: synthetic minority over-sampling technique. jair. (2002) 16:321–57. doi: 10.1613/jair.953
85. Diz J, Marreiros G, and Freitas A. Applying data mining techniques to improve breast cancer diagnosis. J Med Syst. (2016) 40:1–7. doi: 10.1007/s10916-016-0561-y
86. Ramezankhani A, Pournik O, Shahrabi J, Azizi F, Hadaegh F, and Khalili D. The impact of oversampling with SMOTE on the performance of 3 classifiers in prediction of type 2 diabetes. Med Decis Making. (2016) 36:137–44. doi: 10.1177/0272989X14560647
87. Abdoh SF, Abo Rizka M, and Maghraby FA. Cervical cancer diagnosis using random forest classifier with SMOTE and feature reduction techniques. IEEE Access. (2018) 6:59475–85. doi: 10.1109/ACCESS.2018.2874063
88. Fotouhi S, Asadi S, and Kattan MW. A comprehensive data level analysis for cancer diagnosis on imbalanced data. J Biomed Inform. (2019) 90:103089. doi: 10.1016/j.jbi.2018.12.003
89. Polat K. A hybrid approach to Parkinson disease classification using speech signal: the combination of SMOTE and random forests. In: 2019 Scientific Meeting on Electrical-Electronics & Biomedical Engineering and Computer Science (EBBT). IEEE, Istanbul, Turkey (2019). p. 1–3. Available at: https://ieeexplore.ieee.org/document/8741725/ (Accessed July 21, 2024).
90. Shuja M, Mittal S, and Zaman M. Effective prediction of type II diabetes mellitus using data mining classifiers and SMOTE. In: Sharma H, Govindan K, Poonia RC, Kumar S, and El-Medany WM, editors. Advances in Computing and Intelligent Systems. Springer Singapore, Singapore (2020). p. 195–211. Algorithms for Intelligent Systems. doi: 10.1007/978-981-15-0222-4_17
91. Abdu-Aljabar RD and Awad OA. A comparative analysis study of lung cancer detection and relapse prediction using XGBoost classifier Vol. p. Bristol, UK: IOP Publishing (2021). p. 012048.
92. Shen J, Wu J, Xu M, Gan D, An B, and Liu F. A hybrid method to predict postoperative survival of lung cancer using improved SMOTE and adaptive SVM. In: Cesarelli M, editor. Computational and Mathematical Methods in Medicine, vol. 2021 (2021) USA: Wiley Online Library. p. 1–15.
93. Chang CC, Li YZ, Wu HC, and Tseng MH. Melanoma detection using XGB classifier combined with feature extraction and K-means SMOTE techniques. Diagnostics. (2022) 12:1747. doi: 10.3390/diagnostics12071747
94. Karamti H, Alharthi R, Anizi AA, Alhebshi RM, Eshmawi AA, Alsubai S, et al. Improving prediction of cervical cancer using KNN imputed SMOTE features and multi-model ensemble learning approach. Cancers. (2023) 15:4412. doi: 10.3390/cancers15174412
95. Bhavani CH and Govardhan A. Cervical cancer prediction using stacked ensemble algorithm with SMOTE and RFERF. Mater Today: Proc. (2023) 80:3451–7. doi: 10.1016/j.matpr.2021.07.269
96. Srinivasan S, Ramadass P, Mathivanan SK, Panneer Selvam K, Shivahare BD, and Shah MA. Detection of Parkinson disease using multiclass machine learning approach. Sci Rep. (2024) 14:13813. doi: 10.1038/s41598-024-64004-9
97. Herawati BC, Hairani H, and Guterres JX. SMOTE variants and random forest method: A comprehensive approach to breast cancer classification. IJEC. (2024) 3:12–23. doi: 10.58291/ijec.v3i1.147
98. Martinez-Cantin R. BayesOpt: A Bayesian optimization library for nonlinear optimization, experimental design and bandits. J Machine Learning Res. (2014) 15:3915–9. Available online at: https://arxiv.org/abs/1405.7430.
99. Lundberg SM and Lee SI. A unified approach to interpreting model predictions. Advances in neural information processing systems, Vol. 30. San Diego, USA: Neural Information Processing Systems Foundation, Inc. (2017).
100. Lundberg S. An introduction to explainable AI with Shapley values(2018). Available online at: https://shap.readthedocs.io/en/latest/example_notebooks/overviews/An%20introduction%20to%20explainable%20AI%20with%20Shapley%20values.html (Accessed April 23, 2024).
101. Wang H, Liang Q, Hancock JT, and Khoshgoftaar TM. Feature selection strategies: a comparative analysis of SHAP-value and importance-based methods. J Big Data. (2024) 11:44. doi: 10.1186/s40537-024-00905-w
102. Shapley LS. Notes on the N-Person Game — II: The Value of an N-Person Game. Santa Monica, USA: Rand Corporation (1951). Available at: https://www.rand.org/content/dam/rand/pubs/research_memoranda/2008/RM670.pdf (Accessed May 7, 2023).
103. Sacks H, Schegloff EA, and Jefferson G. A Simplest Systematics for the Organization of Turn Taking for Conversation**This chapter is a variant version of “A Simplest Systematics for the Organization of Turn-Taking for Conversation,” which was printed in Language, 50, 4. Available online at: https://linkinghub.elsevier.com/retrieve/pii/B9780126235500500082 (Accessed November 12, 2024).
104. Ye Z, Lu L, Huang L, Lin L, and Liang X. Towards quantifiable dialogue coherence evaluation. arXiv preprint arXiv:2106.00507. (2021). Available online at: http://arxiv.org/abs/2106.00507.
105. Austin JL. w to do things with words: the William James lectures delivered at Harvard University in 1955. Urmson JO, editor. London: Oxford Univ. Press (1971). 166 p. Oxford paperbacks.
106. Searle JR. Speech acts: an essay in the philosophy of language. Cambridge: Cambridge Univ. Press (1970). 203 p.
108. Kasper G. Speech acts in interaction: Towards discursive pragmatics. In: Pragmatics & language learning. Bardori-Harlig K, Félix-Brasdefer C, and Omar A. eds. National Foreign Language Resource Center, Honolulu, HI.
109. González-Lloret M. Conversation analysis and speech act performance. In: Martínez-Flor A and Usó-Juan E, editors. Speech Act Performance: Theoretical, empirical and methodological issues. John Benjamins Publishing Company, Amsterdam (2010). p. 57–74. Available at: https://benjamins.com/catalog/lllt.26.04gon (Accessed November 27, 2024).
110. Rude S, Gortner EM, and Pennebaker J. Language use of depressed and depression-vulnerable college students. Cogn Emotion. (2004) 18:1121–33. doi: 10.1080/02699930441000030
111. Heitz U, Cherbuin J, Menghini-Müller S, Egloff L, Ittig S, Beck K, et al. Comorbidities in patients with an at-risk mental state and first episode psychosis. Eur Psychiatr. (2017) 41:S198–8. doi: 10.1016/j.eurpsy.2017.01.2142
112. Kosmala L. Exploring the status of filled pauses as pragmatic markers: The role of gaze and gesture. P&C. (2022) 29:272–96. doi: 10.1075/pc.21020.kos
113. Clark H. Using uh and um in spontaneous speaking. Cognition. (2002) 84:73–111. doi: 10.1016/S0010-0277(02)00017-3
114. Levelt W. Monitoring and self-repair in speech. Cognition. (1983) 14:41–104. doi: 10.1016/0010-0277(83)90026-4
115. Matsumoto K, Kircher TTJ, Stokes PRA, Brammer MJ, Liddle PF, and McGuire PK. Frequency and neural correlates of pauses in patients with formal thought disorder. Front Psychiatry. (2013) 4:127/abstract. doi: 10.3389/fpsyt.2013.00127/abstract
116. DeVault D, Georgila K, Artstein R, Morbini F, Traum D, Scherer S, et al. (2013). Verbal indicators of psychological distress in interactive dialogue with a virtual human, in: Proceedings of the SIGDIAL 2013 Conference, Metz, France. pp. 193–202.
117. Costa JC and Silva LFLE. Parts of speech and filled pauses in schizophrenia. Alfa Rev linguíst (São José Rio Preto). (2023) 67:e16993. doi: 10.1590/1981-5794-e16993t
118. Andreasen NC and Grove WM. Thought, language, and communication in schizophrenia: diagnosis and prognosis. Schizophr Bull. (1986) 12:348–59. doi: 10.1093/schbul/12.3.348
119. Zamperoni G, Tan EJ, Rossell SL, Meyer D, and Sumner PJ. Evidence for the factor structure of formal thought disorder: A systematic review. Schizophr Res. (2024) 264:424–34. doi: 10.1016/j.schres.2024.01.006
Keywords: UHR patients, spoken language, natural language processing, XGBoost, SMOTE, SHAP values
Citation: Kim-Dufor D-H, Walter M, Krebs M-O, Haralambous Y, Lenca P and Lemey C (2025) Deeper insight into speech characteristics of patients at ultra-high risk using classification and explainability models. Front. Psychiatry 16:1595197. doi: 10.3389/fpsyt.2025.1595197
Received: 17 March 2025; Accepted: 23 May 2025;
Published: 16 June 2025.
Edited by:
Saturnino Luz, University of Edinburgh, United KingdomReviewed by:
Sofia De La Fuente Garcia, University of Edinburgh, United KingdomBahman Mirheidari, The University of Sheffield, United Kingdom
Copyright © 2025 Kim-Dufor, Walter, Krebs, Haralambous, Lenca and Lemey. This is an open-access article distributed under the terms of the Creative Commons Attribution License (CC BY). The use, distribution or reproduction in other forums is permitted, provided the original author(s) and the copyright owner(s) are credited and that the original publication in this journal is cited, in accordance with accepted academic practice. No use, distribution or reproduction is permitted which does not comply with these terms.
*Correspondence: Deok-Hee Kim-Dufor, ZGgua2ltZHVmb3JAZ21haWwuY29t