 Greg Chance
 Aleksandar Jevtić
 Praminda Caleb-Solly
 Sanja Dogramadzi
- 1Bristol Robotics Laboratory, University of the West of England, Bristol, UK
- 2Institut de Robòtica i Informàtica Industrial, CSIC-UPC, Parc Tecnològic de Barcelona, Barcelona, Spain
Assistive robots have a great potential to address issues related to an aging population and an increased demand for caregiving. Successful deployment of robots working in close proximity with people requires consideration of both safety and human–robot interaction (HRI). One of the established activities of daily living where robots could play an assistive role is dressing. Using the correct force profile for robot control will be essential in this application of HRI requiring careful exploration of factors related to the user’s pose and the type of garments involved. In this paper, a Baxter robot was used to dress a jacket onto a mannequin and human participants considering several combinations of user pose and clothing type (base layers), while recording dynamic data from the robot, a load cell, and an IMU. We also report on suitability of these sensors for identifying dressing errors, e.g., fabric snagging. Data were analyzed by comparing the overlap of confidence intervals to determine sensitivity to dressing. We expand the analysis to include classification techniques such as decision tree and support vector machines using k-fold cross-validation. The 6-axis load cell successfully discriminated between clothing types with predictive model accuracies between 72 and 97%. Used independently, the IMU and Baxter sensors were insufficient to discriminate garment types with the IMU showing 40–72% accuracy, but when used in combination this pair of sensors achieved an accuracy similar to the more expensive load cell (98%). When observing dressing errors (snagging), Baxter’s sensors and the IMU data demonstrated poor sensitivity but applying machine learning methods resulted in model with high predicative accuracy and low false negative rates (≤5%). The results show that the load cell could be used independently for this application with good accuracy but a combination of the lower cost sensors could also be used without a significant loss in precision, which will be a key element in the robot control architecture for safe HRI.
Introduction
Between 2000 and 2050, the proportion of the world’s population of over 60 years is expected to double from about 11 to 22%, and the absolute number of people aged 60 years and older is expected to increase from 605 million to 2 billion over the same period (WHO, 2016). With an aging population comes an increase in the incidence and prevalence of diseases and disabilities, which will have a profound societal and economic impact. To address growing health and social care needs, government agendas are promoting well-being and independence for older people and carers within communities to help people maintain their independence at home. The long-term care revolution (LTCR, 2016) is one such agenda about reshaping long-term care in terms of structural and economic changes to deliver quality of life and promote independence for older people (Tinker et al., 2013), which includes assistance with the activities of daily living (ADLs).
A cross-sectional study of 14,500 Medicare beneficiaries, nationally representative of the USA (Dudgeon et al., 2008), looked to quantify the difficulties people had with ADLs. Of those beneficiaries, 27.3% reported difficulties with walking, 14.4% with transfers (chair/bed), 12% bathing, 8.2% dressing, 6.1% toileting, and 2.9% eating. Of all the ADLs, dressing showed the highest burden on caregiving staff and the lowest use of assistive technologies, see Figure 1.
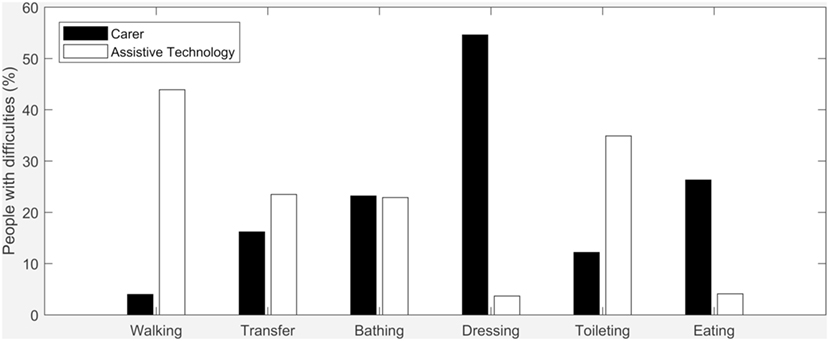
Figure 1. Percentage of people having difficulties with activities of daily living (ADLs) who have carer assistance (black) and those using assistive technology (white). Assistive technology for walking is relatively advanced and low cost hence little need for carers, where dressing is contrary to this situation [data from Dudgeon et al. (2008)].
There is also growing concern with the lack of carers and nurses who are available to cope with this increasing demand. A 2015 UK report (Christie and Co, 2015) shows the vacancy rates in the NHS and adult social care are 7 and 9%, respectively. Furthermore, in the 3 years up to 2015 the average spending on agency nursing is estimated to have increased 213%. Alongside formal nursing and caregiving there were approximately 2 million people in the UK receiving informal adult care in 2010, nearly half of which were aged 70 years or older (Foster et al., 2013). Informal care is usually given by a family member or relative and was valued at £61.7 billion in 2010 (4.2% of GDP), a value which has tripled since 1995.
With an aging population that will need assistance with ADLs, less workforce available to provide care and a lack of technology for assisted dressing the demand for research in this area is clear. Various robotic solutions have been proposed for assistance with ADLs, such as walking (Graf, 2001), sitting-to-standing (Shomin et al., 2015), bathing (Satoh et al., 2009), among others. Support with dressing, which is the focus of this research, has the potential to increase independent living for the older adult population and support active aging (Prescott et al., 2012).
Our overall project aims include the development of a fully autonomous system for robot-assisted dressing that could be personalized through implementation of a user profile and a specific control architecture. The robot control module should include parameters related to the user’s profile. This will enable personalization of the assisted task by adaptation depending on the user’s characteristics, e.g., height, handedness, dressing preference, and mobility.
Objectives and Approach
We report in this paper a subaspect of a larger project, I-DRESS,1 which tackles some of the aspects of robotic-assisted dressing for older adults and people with mobility issues. This work falls within the touch and force work package of the I-DRESS project. In this paper, we identify the sensors that are most suitable for this application and determine the level of accuracy expected using machine learning methods. The I-DRESS project will also consider inputs from other perception modules, see Figure 2, such as garment detection, user tracking, and speech interaction. These inputs will be processed by a multimodal interaction module and moderated by decision and safety management modules.
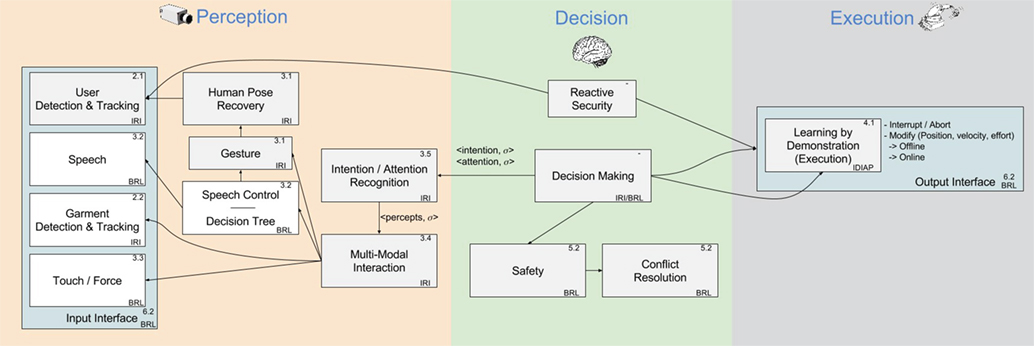
Figure 2. I-DRESS system architecture. User and garment parameters will influence the control of the robot via the multimodal interaction module and moderated by safety and decision-making processes.
This is a complex task due to the safety-critical nature of the close proximate human–robot interaction (HRI), where the human could behave in an unpredictable manner. To begin to understand this problem we aim to examine some of the key concepts in isolation, where the system operational parameters can be determined safely and in a controlled environment. Starting experiments directly with people, without an understanding of typical force profiles would contravene safety risk assessments. Therefore, as a precursor to working with people, we use a mannequin to give us a fixed frame of reference so that we can use repeated measurements to determine the accuracy of the sensors and force profiles. We then extend the experiment using a mannequin to human participants in order to qualify the results in a more natural setting.
An objective of these experiments is to differentiate between the different base layers onto which a garment is being worn so that the required force profiles can be determined to ensure smooth and safe dressing. This will enable safe control of the garment by the robot during the dressing task and allow distinction between normal dressing and errors. The parameters that are likely to influence this control module are based on the perception elements such as user and garments information, see Figure 2. User height and handedness are fixed values required for robot control and trajectory planning. The poses that the user can adopt during assisted dressing may depend on the current state of their mobility, whether they are sitting or standing and the type of garment to be dressed. There exists a functional relationship between the force required to complete the dressing task (safely moving the garment grasped by the end effectors onto the user’s arms and over the shoulders), the compliance of the user’s body, the resisting forces (friction, mass) based on the user’s pose (planned trajectory), garment type (mass of jacket, coefficient of friction), and base layer (coefficient of friction). We attempt to determine which of these aspects are most significant for determining the resisting force that the robot must overcome to move the garment, with the values found in our tests carried forward for HRI testing in the next phase of the research, particularly in determining safety limits for the forces applied. We are also interested in determining whether low-cost sensors can be used in place of more accurate and expensive ones for these force measurements.
Consider the situation where the robot experiences a large resistance during dressing. The question is what magnitude of force can be safely applied to compensate the resistance without reaching a safety critical limit that could create a hazardous situation or injure the user. If the system knows that a heavy coat is being dressed over a woolen jumper (high μ), then this situation may be preempted. If this resistance is greater than the anticipated value, then there could be an issue or dressing error (such as the garment snagging). In a real scenario, we envisage the system being able to identify and classify different garments and store basic information about them (weight, texture).
In this paper, we attempt to differentiate between different base layers by using specific sensors to measure force, torque, accelerator, and angular velocity on the robot arm and end effector during a particular dressing task. One of the objectives is to see whether low-cost sensors can be used in place of more accurate and expensive ones. In this paper, we also evaluate the sensitivity of the sensors required to detect dressing errors. Dressing errors are caused when the garment is not able to be moved freely to its intended location. For example, the hand gets physically caught in the lining of a jacket during dressing, this may be referred to as “snagging.” The measurements could establish if the values were the result of the high coefficient of friction between the garments or due to the garment snagging (dressing error). Ultimately, the robot control should take account of these aspects and adapt the error thresholding based on the pose, garment, and base layer.
Following this experiment, the authors will introduce the findings from this study into tests using human participants to observe if the results can be applied to more realistic settings (people moving, adopting different poses). In this case, the robot trajectories and force profiles will be more dynamic and will have to adapt to the user’s movements (Havoutis and Calinon, 2017).
Experimental Specifications
We undertake assisted dressing experiments using Baxter from Rethink Robotics (SDK 1.0.0) to assess the dynamics (force, torque, acceleration, and angular velocity) on its robotic end effector. The majority of the data gathering tests were performed on a wooden mannequin, and further testing was done on human participants. The FTSens 6-axis semiconductor-based force and torque sensor from IIT was installed at the Baxter end effector. This sensor has a range of ±2,000 N in the z-axis and ±1,500 N in the x and y axes with a resolution of 0.25 N. The torque has a range of ±25 Nm and resolution of 0.004 Nm in the z-axis and a range of ±35 Nm with 0.005 Nm resolution in the x and y axes. In addition, a low-cost wireless IMU, Texas Instruments CC2650, was attached to the end effector to collect acceleration and angular velocity data. The accelerometer chip (KXTJ9) has 12-bit sensitivity over a ±8 g range typically giving 0.004 g resolution. The gyroscope chip (IMU-3000) has a 16-bit sensitivity over ±250°/s giving 0.008°/s resolution but a noise floor limits this to around 0.2°/s. Data were collected at a workstation using a Linux operating system (Ubuntu 14.04) and ROS (Indigo).
Baxter was used to put one sleeve of a jacket onto the wooden mannequin through a prerecorded trajectory (by demonstration), and end point state data were recorded (force and torque). The mannequin was used to give a fixed frame of reference so that repeated measurements could be used to determine a statistical significance of the data. We record sensor data during the dressing task for different scenarios (the way the dressing is accomplished based on the user pose) exploring different base layers on the mannequin (the underlying clothing already being worn). The trajectory was recorded (via demonstration) for each scenario and repeated 10 times for each of 5 different base layers and three different poses. The playback function of Baxter was used to repeat various dressing scenarios. The aim was to record 10 sets of complete data for each pose and garment, if the dressing failed the associated data were discarded and rerun. These tests were repeated on human participants for two different base layers and three poses, capturing 10 dressing cycles for each.
One of the expected outcomes of the study is that different base layers can be discerned by the sensors by a statistically significant margin. This may prove that the frictional forces caused by dressing onto different base layers are affected by the underlying garment being worn.
Related Work
Previous studies on robot-assisted dressing focused on challenges in motion planning, perception, and manipulation of non-rigid garments. Kinesthetic teaching in combination with reinforcement learning is a widely used method for teaching the robot motions in assistive dressing (Tamei et al., 2011) as well as for autonomous robot dressing (Matsubara et al., 2013).
However, learning a motion is not always sufficient, and knowing the dynamics of the dressing task may help to improve robot performance. Some authors proposed tracking human and garment pose, in order to know their topological relationship and optimize the robot trajectory (Tamei et al., 2011; Koganti et al., 2013) or compensate for the user’s repositioning (Klee et al., 2015).
Visual information is commonly used to estimate garment (Yamazaki et al., 2014) and user pose (Gao et al., 2015). Force sensors have only been used so far to detect garment snagging and involve vision module in identifying the dressing error (Yamazaki et al., 2014). In our previous work, we focused on the trajectory planning for error handling in dressing (Chance et al., 2016).
Much of this work involves the single modality of vision to achieve estimations and updates on the user or garment position. Gao et al. (2016) have used RGB-D data to estimate user pose and initial robot trajectory, which was then updated based on force feedback information for dressing a sleeveless jacket using the Baxter robot. Another group have made predictive models for dressing a hospital gown based on just the force modality, removing the vision input altogether, in a simple single arm experiment (Kapusta et al., 2016).
In our current work, we use information from torque, force, and IMU sensors in order to describe the dynamics of a dressing task and to try and discriminate between different dressing base layers. We also attempt to show how to detect dressing errors based on using the same sensors.
Methodology
System Setup
The primary goal of this paper is to report whether the chosen sensors (Baxter, load cell, and IMU) can successfully differentiate between different base layers and detect dressing errors while also minimizing false negatives (not detecting the error). This information will contribute toward the control and error modules in the final control architecture of the robot-assisted dressing system. The garment used in the dressing experiments is a raincoat (100% polyester, medium size, unelasticated cuffs) in all cases of this work. The right arm of a wooden mannequin and participant was dressed up to the shoulder.
The pose of the mannequin was altered to give three dressing scenarios (Figure 3) to simulate varying levels of arm movement mobility of the user; pose 1: low mobility where the elbow cannot be bent and the arm is in a more relaxed position to the side, pose 2: limited mobility where the elbow can bend but the arm is raised to the front by 20°, and pose 3: normal mobility where the user has a full range of motion and can rotate the arm behind their back by 45° while bending the elbow. The dressing motion for each pose is shown in Figure 4.
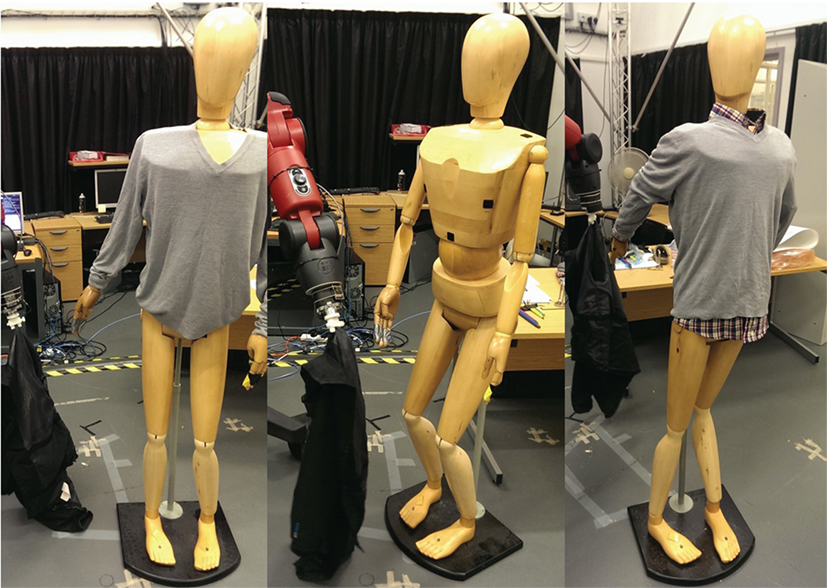
Figure 3. Mannequin poses used during this study (left to right): (pose 1) low mobility user with a straight arm at a slight angle to the side dressed with a jumper, (pose 2) limited mobility user with the arm out to the front for the bare mannequin, and (pose 3) normal mobility with the arm bent around the back and the elbow bent with all three layers (t-shirt, shirt, and jumper).
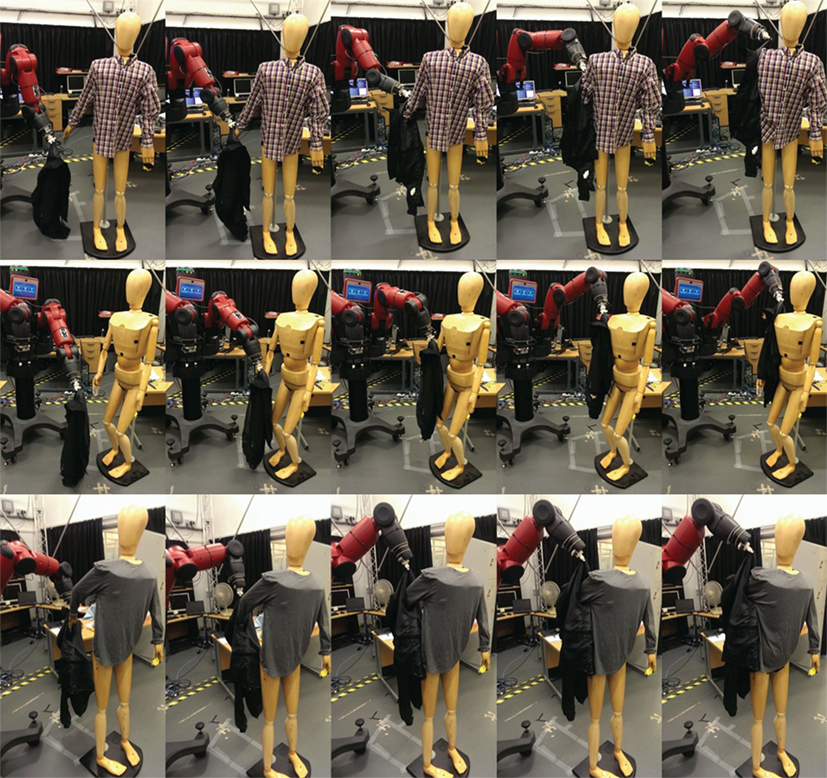
Figure 4. Dressing motion for each pose: pose 1 shown with the shirt, pose 2 shown for the bare mannequin, and pose 3 with the t-shirt (top to bottom).
For each of these dressing scenarios, we examine the associated forces and torques when dressing the mannequin with the jacket and whether the changes in frictional force can be detected when dressing onto different base layers. The base layers are categorized: (a) no base layer—bare wooden mannequin, (b) wooden mannequin with long sleeve thermal t-shirt (67% acrylic, 28% cotton, 5% elastane, 97–102 cm chest, and medium size), (c) wooden mannequin with long sleeve shirt (65% polyester, 33% cotton, medium size) fully buttoned except collar, (d) wooden mannequin with long sleeve V-neck jumper (100% acrylic, 98–104 cm chest, medium size), (e) wooden mannequin with all three layers (long sleeve t-shirt, shirt, and jumper, respectively). In all these cases, the end of the base layer was fixed to the mannequin to prevent rucking or gathering up the arm during dressing. This was achieved with an elastic band wrapped around the garment onto the wrist of the mannequin. It should be noted that the frictional coefficient between human skin and clothing [μ = 0.52 ± 0.08 skin/cotton sock (Zhang and Mak, 1999)] is higher than that of the varnished wooden mannequin [μ = 0.2 polyester/wood (Kothari and Ganga, 1994)]. Furthermore, the surface moisture of human skin may vary depending on many factors (temperature, humidity, perspiration, etc.) and will further magnify the differences reported here.
The height of the mannequin is 1.85 m with a chest size of 0.9 m and an arm length (shoulder to wrist) of 0.5 m. The construction is smooth sanded softwood with a varnished finish. The joints of the mannequin are articulated and fixed with tensioned internal springs. For each of the three poses, the mannequin was kept in a fixed position. Care was taken to maintain the mannequin’s pose, while putting on the base layers, only moving the left arm to enable dressing of the non-buttoned garments.
For the human dressing tests, data from two participants were collected in the three different poses explained above. For these tests, two base layers were used, a shirt and a jumper worn over the shirt. The shirts were 100% cotton, and the jumper was a wool blend. The participants dressing and their garments are shown in Figure 5.
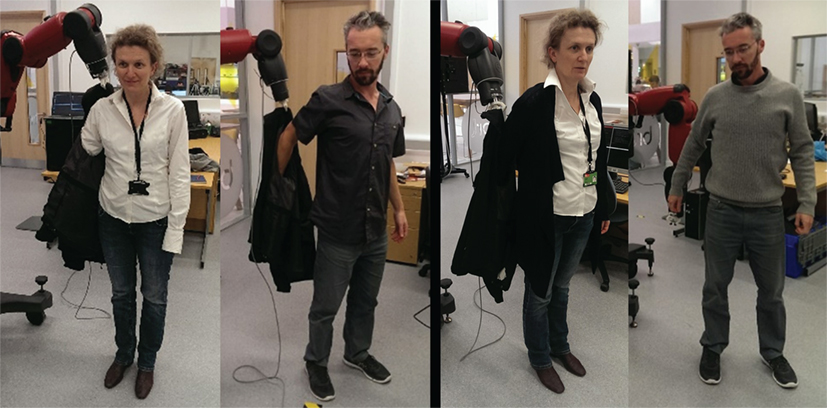
Figure 5. Showing participant testing for (left) shirt and (right) jumper worn over the top of the shirt.
Three sensors were used to record the data during the tests. The FTSens 6-axis force and torque load cell from IIT are limited to 2,000 N force (in x, y, and z) and 30 Nm torque in z-axis (normal to the surface) and 40 Nm in x/y-axis. This sensor communicates over a CAN interface at the sampling rate of 250 Hz, and these data were published into ROS. The second set of sensors, internal to the robot, reported end point effort in terms of force and torque at a rate of 100 Hz. Finally, a low-cost IMU was attached to the end effector to collect acceleration and angular velocity data (Texas Instruments CC2650), which were collected wirelessly via Bluetooth and also published as a topic in ROS. All sensor data were recorded within a rosbag to allow synchronized capture across different sensor types.
The Baxter robot used in this study was modified with the 6-axis load cell mounted at the end of the arm by means of a plastic interface plate, see Figure 6 (left). A thumb-turn clothing gripper was designed and fabricated to fit the external surface of the sensor Figure 6 (middle). The gripper was 3D printed in ABS material with soft plastic end pads for improved grip. In all tests, the jacket was held by the gripper at the same point, just above the opening to the sleeve. This gripper was designed to fit with the FTsens load cell and the Baxter robot suitable for our experiments. However, this is not unique to this situation and many COTS end effectors have integrated force and torque sensors, which could be used to the same effect.
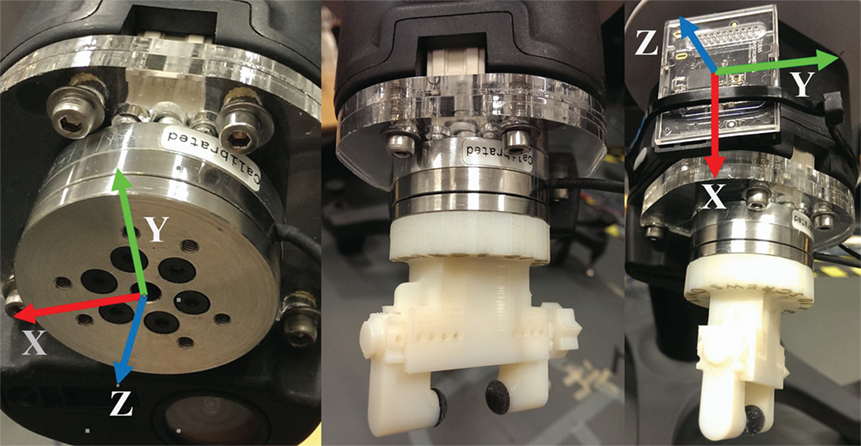
Figure 6. Showing (left) modified end effector of the Baxter robot with a plastic interface part allowing mounting of the 6-axis force/torque sensor with axes definition, (middle) 3D printed, thumb-turn operated clothing clamp mounted to the sensor, and (right) location of wireless IMU with axes.
Data Gathering and Analysis
For each scenario, the mannequin was put into the desired pose and a trajectory was manually recorded using the joint recorder script. When a suitable trajectory was recorded, the file was played back and the sensor data captured on a workstation. For the human dressing tests, the trajectory was replayed, and the data were captured in the same manner. The data analysis was undertaken using Matlab, and the Robotics System Toolbox was used to parse the binary data contained within the rosbag files. The data could then be interpolated to a regular time axis for simpler analysis. There were no trigger systems used in the experiment so data from repeated tests were aligned from features in the data.
Three poses were measured, with five different base layers for the mannequin and two base layers for the human dressing tests. For each base layer, the dressing trajectory was repeated 10 times and the measurements taken which included 18 channels of sensor data. Each measurement sample was on average 40 s, which included dressing to the shoulder and then undressing back down to the hand resulting in a total of 38.2 M samples. The IMU data were upsampled from 4–5 Hz to 10 Hz, and the other sensors were downsampled to 10 Hz resulting in a final data set of 1.08 × 10⁶ samples (the robot motion was slow so 10 samples per second were sufficient).
Recording the robot trajectory by demonstration is done by manually maneuvering the arm through a path to complete the dressing task, which involves moving the jacket toward the hand and then up the arm and onto the shoulder. Compliance is inherent in the design of the robot, which has Series Elastic Actuators (SEA), where the limbs will flex instead of pushing. This compliance affects the results as the Baxter robot does not have high positional accuracy. This is why these tests were repeated several times on a fixed mannequin, to reduce (average out) these positional errors.
The lowest coefficient of friction was expected between the jacket and the bare mannequin, which is estimated at μ = 0.2 based on data between polyester and a flat polished surface of aluminum (Kothari and Ganga, 1994). The highest coefficient was expected between the base layers of woven fabrics that have a prominent surface texture. Woven cotton, for example, has a “hairy” surface and small loops of fabric caused by the texturing process undertaken during manufacturing. The coefficient of friction between two samples of cotton with a textured weft has μ = 0.823 compared to untextured μ = 0.548 (Kothari and Ganga, 1994). A visual inspection of the garments would categorize the jumper, shirt, and t-shirt in descending order of prominent surface texture. With the data resampled and aligned, the mean and SE of each sensor were determined as a function of time (n = 10). This statistical information was then compared between the base layers, where no overlap of confidence intervals (CIs) signifies a significant result for the associated sensor. We aim to determine which sensor types can differentiate between base layers for this type of dressing task and if this relation holds for different user poses.
Base Layer Prediction
We then extend this analysis to use a range of machine learning tools to classify the data by garment type and report the accuracy of various classification methods. The pose of the mannequin is also considered, and accuracy across different poses is calculated. In order to use these methods effectively, the features within the data should be extracted for optimal accuracy. We use a third order Savitzky and Golay (1964) filtering technique, with a 1.3 s frame length to smooth out the signals and reduce noise content. The filter parameters chosen were found to achieve the highest accuracy. Exploring these parameters found that shorter frame windows did not remove enough noise and longer windows removed too many features of the data. We also calculate the first and second order differential of the sensor data, which should provide information about the changes in sensor data with respect to time.
Human Participants
Human participant data were used to show generalization to a real world scenario. In these tests, two participants were dressed to the shoulder with a jacket. The participant was dressed 10 times in each of three poses wearing two different base layers, a shirt and a shirt and jumper. Classification accuracy for discriminating between the base layers is given.
Dressing Error Prediction
For the dressing error analysis, we use a multiple of the CI of the data to determine if the associated sensor can detect the dressing error within the noise of the signal. This was particularly pertinent for the low-cost IMU sensor whose noise level was high compared to the other sensors. Machine learning methods were used to extend this analysis, using the same techniques as in the garment detection, and predictive models were built for detecting errors. Models’ accuracy for predicting dressing errors is reported based on a fivefold cross-validation technique. The issue of false negative rate (FNR) is also discussed.
Results and Discussion
In order to compare the effect associated with the different base layers, the 95% CIs for each sensor data channel were calculated. The criterion for successfully discriminating between base layers is when there is no overlap of CI, e.g., the lower CI for a sensor exceeds the upper CI for the same sensor during a different base layer measurement. Although examination of CIs is not regarded as the optimal method for significance testing (Schenker and Gentleman, 2001) and must be used cautiously when assigning a lack of statistical significance due to overlapping (Knol et al., 2009), for a comparative data analysis study such as this, it has proved to be an excellent tool. Figure 7 shows the CI for the load cell torque data for all five base layers during measurements of pose 2. Between the elbow and the shoulder there is a clear divergence of the CIs indicating that the difference between the torque for various base layers is statistically significant.
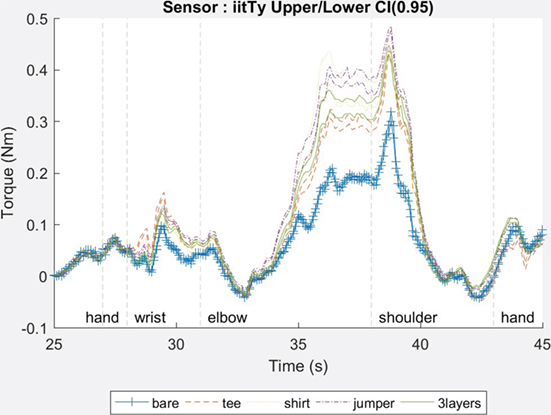
Figure 7. Example of IIT torque (y-axis) upper and lower confidence interval for each base layer (pose = 2).
In Figure 7, there is also evidence of a linear relationship between torque and base layer. Torque values increase as the base layer changes from bare to t-shirt, shirt, and jumper. We hypothesize that this could be attributed to the change in the coefficient of friction of between the base layer and the jacket. The relation between the frictional resistance, F, and normal force, N, is well established and given by
where μ is the coefficient of friction. However, some authors claim that this relation does not hold for dynamic situations for polymeric (woven) textiles (Ramkumar et al., 2004) and that
should be used where A is the apparent area of contact, C is the friction parameter, and n is the non-dimensional friction index (usually less than 1). The appearance of area in this relation has implications for this application, namely that the resistive force due to friction may change as the contact area of the garment changes.
To evaluate these data further, a cross-comparison matrix was formed for each sensor and base layer combination. We define the total dressing time (Tt) from when the hand enters the jacket to when the jacket reaches the shoulder and identify the time during which there is no overlap of CIs between base layers (Ts). The result is quoted as a sensitivity ratio of these values (Rs = Ts/Tt) given as a percentage. The example in Figure 8 for the load cell torque (y-axis) indicates the sensor can discriminate not just between the bare mannequin and when the mannequin has any base layer but also between the different types of base layers. The results show that the sensor is able to discern between base layers better when the surface properties are dissimilar. For example, between bare wood and jumper results in some of the highest Rs values for this sensor. When the surface properties of the materials are more similar, the Rs values tend to be lower as seen between jumper and shirt. This may be due to the material weave and surface loops (as mentioned in Section “Data Gathering and Analysis”), resulting in a similar coefficient of friction with the jacket.
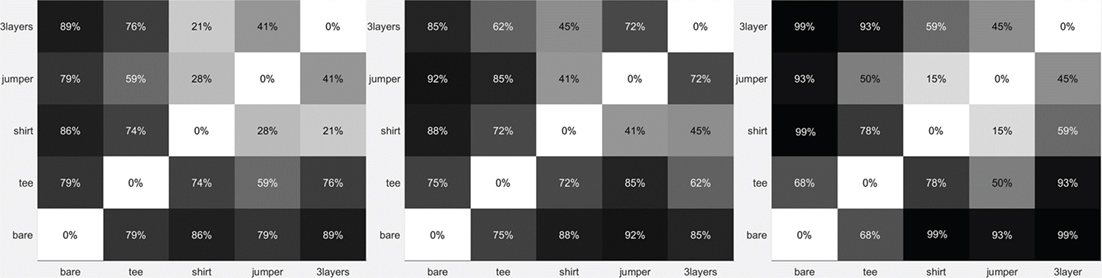
Figure 8. Example of cross-comparison matrix for the IIT load cell torque (y-axis) for poses 1–3 (left to right) showing the percentage of dressing time without overlap of confidence intervals (Rs).
To determine the sensitivity of all sensors with respect to all combinations of garments, the minimum, maximum, and average of the cross-comparison matrix were calculated for each sensor. This analysis identifies which sensor/axis combination can discern between different base layers during the dressing from the hand to the shoulder. The sensitivity chart for each sensor and pose is shown in Figure 9. It can be seen that the load cell is able to discern between the base layers 40–75% of the time (Rs) on average. The Baxter sensors cover a similar range but are much less sensitive only detecting the different garments 10–40% of the time. The IMU data show a very low sensitivity, not exceeding 15% which would not be suitable for this application.

Figure 9. Sensitivity chart showing the minimum, maximum, and average percentage of dressing time without overlap of the confidence intervals between base layers for poses 1–3 (left to right).
Inspection of these charts shows no significant change in sensitivity for different poses. This is encouraging as it indicates that these sensors would be equally sensitive for most dressing poses and more generally to other dressing scenarios.
To collate the sensitivity over all poses we take the average Rs value for each sensor type (force, torque, acceleration, and angular velocity). This is tabulated for each pose in Table 1, along with the average Rs across all poses. It can be seen that the load cell can discriminate between the base layers 60–70% of the time, thus proving suitable for this task. The Baxter data were only successful 20–35% of the time and the IMU less than 10% on average.
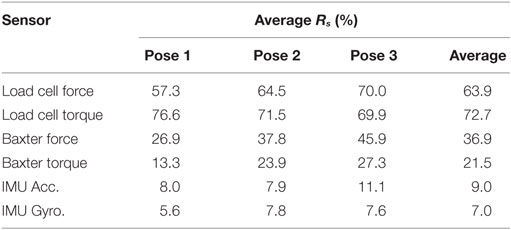
Table 1. Sensitivity analysis table.
Machine Learning Analysis
With a better understanding of which sensors can observe the events, we wish to monitor during dressing, machine learning can be used to classify the data using various machine learning techniques.
Decision tree is a simple classification technique that splits the training data based on parameter values that give the highest purity or gain for a single class. This happens recursively until the tree terminates in one of many leaf nodes where the outcome should be the value of the class. Many algorithms exist for splitting the data and here we use the CART method (Breiman et al., 1984). Discriminant analysis involves finding boundaries between data classes using linear or quadratic lines. These models are not computationally intensive, and they are implemented in this work using quadratic boundaries.
Other classification methods considered are non-parametric where no assumptions about the probability distribution of the data are made. The k-nearest neighbors (k-NN) approach categorizes the data points based on their distance from each other forming local groups within a training data set. Another non-parametric approach to classification problems implements support vector machines (SVMs), which are particularly tolerant to overfitting (Suykens and Vandewalle, 1998). The SVM method involves searching for an optimal hyperplane that separates the data by class and is optimized by finding the largest margin at the boundaries.
The classification analysis was done using Matlab (R2017a) using prebuilt classification models. The analysis involves using a fivefold cross-validation technique. This involves splitting the data randomly into five subsets, four of which are used for training and the fifth for validation. The process is repeated five times using each subset once for validation. The typical variance in the accuracy values quoted using this process is around 0.1.
It should be noted that in the following analysis, the fifth base layer (three-layer) was removed from the data due to the similarity to the jumper. These base layers have the same external surface, and it is just the thickness of the clothing that differentiates them. As we want to look for patterns related to the coefficient of friction we believe this is acceptable.
Data Features and Classification Method
The accuracy of discriminating between garment types for the mannequin data is shown in Table 2. Accuracy is given for each classification technique using different characteristics of all sensor data, which also includes the raw data for a reference. Filtering the data using the Savitzsky–Golay method improves the accuracy for all classification techniques indicating noise in the data, with some models improving by nearly 20%. Using the first-order differential data shows a marked drop in classification accuracy indicating that there is information loss during differentiation necessary for accurate models. However, when the first-order differential data is used in combination with the filtered data as predictor values for the classification, we note a 5% improvement in the discriminator method compared to using the filtered data independently. For all other models any change in accuracy is the same as the filtered data to within ~1%.
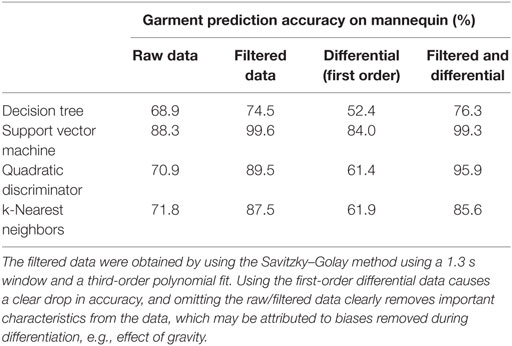
Table 2. Prediction of base layer accuracy (no garment, shirt, t-shirt, and jumper) based on mannequin dressing tests (pose 1) using all sensor data (18 channels).
The use of second-order differential data (results not shown) resulted in poor accuracy used independently or in combination with other data. This may be because the robot was moving slowly during the tests so prominent features in this data are infrequently observed. Also, the data rate of the sensors is downsampled to 10 Hz (and the IMU is upsampled from 5 to 10 Hz) so higher frequency content is not captured that would be resolved with higher order differentials.
The SVM models look particularly promising, out-performing other techniques and showing high accuracies (>80%) regardless of the predictor data. This agrees with other research findings on this matter (Lee and To, 2010; Shao and Lunetta, 2012).
Sensor Analysis
The analysis was broken down to use data from each individual sensor group; load cell, Baxter, and IMU, see Table 3. Here, we use the filtered data and first-order differential for each physical sensor as defined in Section “Data Gathering and Analysis.” The load cell accuracy is similar to that shown in Table 2, indicating that there is no penalty in model accuracy from removing the Baxter and IMU sensor channels from the training set.
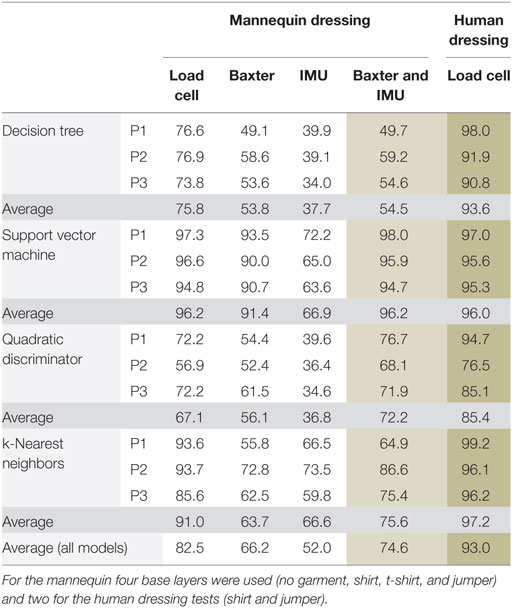
Table 3. Garment prediction accuracy (%) for mannequin and human dressing tests using filtered and first-order differential data as predictors for poses 1–3 (P1–P3).
There is a marked drop in accuracy when using just the Baxter end point data, with the average accuracy across all models and poses being 16% lower than the load cell data. This may be attributed to the sensitivity and the fact that this is an inferred measurement from all sensors in the robot arm calculated to give a force measurement at the end effector.
Using the IMU data independently the accuracy averages to around 50%. This is unsurprising as the data are polled at 5–6 Hz and upsampled for the analysis. Furthermore, this is a low-cost device and has a significant noise floor meaning small changes in acceleration are rarely observed above the noise especially significant when the robot is slow moving (as it was here). We note that even the SVM method fails to produce a model accuracy above around 70%, whereas for the other sensor groups the average was 94%.
Broadly speaking, these results fall in line with the previous sensitivity analysis. The IMU data showing the lowest sensitivity to dressing of all three, the load cell the highest and the Baxter sensors somewhere between the two.
Also shown in Table 3 are the results from the human participant study. The accuracies for these models are predicted to be higher than the mannequin study as only two base layers were used, which reduces the complexity of the task. However, these models show good accuracy for distinguishing between a shirt or jumper on a non-static human participant. Furthermore, the shirt and jumper used in each case were not identical suggesting that this method can be applied to general categories of clothing.
Ideally, we would like to be able to use multiple low-cost sensors to achieve an acceptable accuracy as opposed to a single expensive sensor. To explore this possibility, we combined the data from Baxter and the IMU and compare this to the load cell (fourth data column of Table 3). The decision tree classifiers fail to improve beyond the best accuracy of either sensor independently giving 55.4% combined to 53.8% for Baxter on average. The SVM shows a slight improvement when using the combined data with 96.2% accuracy on average, which is equal to the accuracy of the load cell. This is a good outcome, that is, when used independently the IMU data are of poor quality, but when used in combination with the Baxter sensor the accuracy rivals that of the high-end load cell. The discrimination classifier also shows improved accuracy, from 56.1 and 36.8% for Baxter and IMU data sets, respectively to 72.2% in combination on average across all poses.
Sensor Analysis Summary
Given that this task is based on detecting differences, primarily in the coefficient of friction (μ) the force sensors are naturally suitable given that F ∝ μ. The IMU detects acceleration which is proportional to the force experienced per unit mass. This is the mass of the jacket and the robot arm and therefore may be more sensitive in this task with a lower mass robot arm. Furthermore, the velocity of the arm is low, so the potential to experience large changes in acceleration is unlikely.
Interaction between the robot and the user should be designed to be very dynamic in a real use application. The robot arms must be compliant to be safe, garments are usually flexible and tolerant to slight stretching during dressing, and the user may also move around while being dressed, i.e., not act like a wooden mannequin (although this is dependent on their level of mobility). This results in a hard to define parameter space for trajectory planning and execution. This means that very little of the robot’s movement can be fixed or predefined as has been used here. Therefore, in a real use case the robot must be adaptable to the current situation by detecting the user’s pose and end effector force and use this information to make dynamic adjustments. However, even when the user is moving (non-rigid) many factors of this situation remain unchanged; the jacket mass, the base layer, and their material properties (μ) are all static properties.
Dressing Error
An additional set of data was collected during these tests to simulate a snagging effect of the jacket during dressing. This simulates when the fingers or thumb become caught on the internal structure of the cuff, while the jacket is being pulled up the arm. This was simulated by momentarily restraining the jacket during the dressing motion as the end effector passed the elbow. The jacket was restrained for approximately 1.0–2.0 s after which it was released and the trajectory continued to the shoulder. This is a good analog to how a garment would snag during dressing. It would be very difficult to make repeatable measurements of snagging errors based on a specific trajectory as the limbs of the mannequin may move (changing the pose).
The aim of these experiments was to identify which of the sensors were capable of detecting the error. The identification of error was conducted with respect to statistical variance of the “reference” data set (the data measured without errors). We define Ψ(t) as the absolute distance of the error signal E(t) from the mean of the reference data, r, such that
The error period (te) is defined as terror_stop − terror_start, which is equivalent to the period over which the garment is restrained. All other times outside of te are defined as tn. Figure 10 shows Ψ(t) for Baxter force data (z-axis). Also plotted is 9.5 times the value of the 95% CI of the reference data (9.5CI) as an indication of a potential control threshold. During te the signal extends beyond the 9.5CI threshold level providing a useful error detection method for this sensor. During tn the error signal E(t) does not extend beyond the 9.5 CI threshold and therefore no false positives are detected for this threshold. However, in some cases the signal during tn may be equivalent or greater than the signal during te, which may result in false positives.
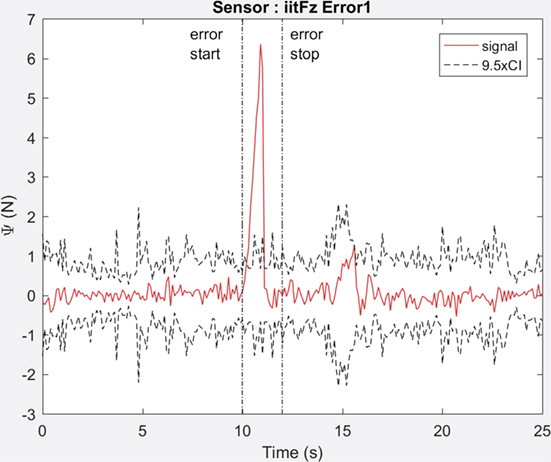
Figure 10. Load cell sensor measurement in z-axis while dressing the bare mannequin showing a single sample of error data (solid) shown with respect to 9.5 times the confidence interval (n = 10) of the reference data (dashed). Vertical lines (dot dash) show approximate start and stop of the error period.
To quantitatively identify which of the sensors can be used for error detection we must (a) set a threshold during tn to prevent false positives and then (b) assess if the Ψ signal is detectable above the same threshold level. This is expressed in (2) and (3), where nCI(t) is the variable threshold level. For each sensor, the appropriate threshold value was found according to (2) and the equality in (3) is reported in Table 4. If the equality is satisfied the cell is shaded and the value is greater than 1, which indicates that the sensor can successfully detect the dressing error without false positives. The magnitude of the value indicates the level of E(t) above the threshold.
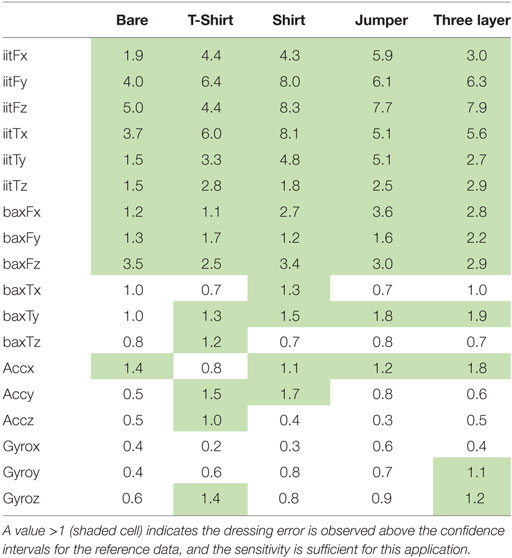
Table 4. Error analysis results for each sensor and axis combination.
Predictive Models for Error Detection
We used machine learning again to analyze the data and determine if machine learning can be used to predict dressing errors from the sensor data. The data were classified 0 for normal dressing and 1 for the period of time that the garment was “snagging” on the mannequin. This resulted in an uneven class distribution, as each dressing error event was only 1–2 s, totaling 20 s per pose but there were tens of minutes of “normal” dressing data with an overall ratio of 30:1.
The second column of Table 5 shows the dressing error model accuracy. These models use the filtered data for all sensor channels as explained above and show high accuracy across all classification techniques. However, the accuracy is calculated across all observations and since the data of interest only account for 3% of all observations, a 97% accurate model could in fact never predict this type of dressing error. This would result in the model accurately determining there was no dressing error but not noticing when there was, which is not good for this application.
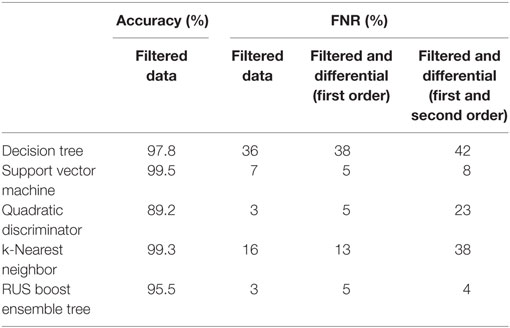
Table 5. Model accuracy and false negative rates (FNRs) for classifiers and data feature type.
To explore this uneven distribution, we investigate the FNR for each model, which was found to be high in many cases. This is shown in columns 3–5 of Table 5 and we examine the FNR with different data features; filtered data and filtered data with the first- and second-order differentials. As a consequence of this we impose a requirement that the mode should have a low FNR in order to correctly detect dressing errors.
For the decision tree classifier, the FNR is consistently high and would be a poor choice for this application. The k-NN classifier shows some improvement over the decision tree but the addition of the extra features to the data does not improve accuracy. The addition of extra predictors to a training set that do not assist in resolving the outcome may just add irrelevant noise to the data and hence reduce accuracy.
The SVM and quadratic discriminator methods both give reasonable results, 7% and 3%, respectively, but this fails to improve with the additional features. The discriminator model FNR rises to 23% with the addition of the differential data.
We now introduce a new classification technique to the analysis, the RUSBoost ensemble tree (Seiffert et al., 2010). This technique is especially adapted to training data that have vastly different n values for each class, as we have in this situation. The RUSBoost method gives low FNR values and is equivalent to the best performance for the filtered data and first-order differential, which was achieved with the discriminator technique. The RUSBoost method also gives good FNR when the second-order differential is added.
In future work, this analysis could be extended to include neural networks, it may also benefit from implementing a modified cost function to account for class imbalance to optimize for the false negative requirement.
Conclusion
We have shown that during a robot-assisted dressing scenario different clothing can be discriminated by monitoring data from strategically placed sensors. The FTSens load cell was the most sensitive, discerning the difference between clothing type for approximately 60 and 70% of the dressing time for force and torque data, respectively. Using the Baxter’s sensors was successful approximately 20–35% of the time and the IMU for less than 10% of the time. We have used machine learning methods to train models based on features of the experimental data such as Savitzky–Golay filtering and multiple-order differentials. The machine learning outcomes align with the sensitivity analysis and suggest that the SVM method as a strong candidate for discriminating between garments, resulting in over 90% accuracy for mannequin and human dressing tests. By combining Baxter and IMU data, we were able to achieve an accuracy as high as using the more expensive load cell, which means this may be a route to a commercially viable solution. When monitoring for dressing errors, the load cell was able to discern the error regardless of the base layer garment. The Baxter and IMU data were partially sensitive to detecting dressing errors. Classification techniques indicated high model accuracies but with potentially high FNRs. Using RUSBoost to compensate for class imbalance appears to be an effective technique giving a false error rate of 5% or lower. This study will be extended by incorporation of the sensor data into an assisted-dressing control system to enable autonomous modification of the robot arm trajectory and force profiles. This will support the development of a robot control architecture that is responsive to different dressing scenarios and contexts.
Ethics Statement
The study was approved by University of the West of England Ethics committee (researchethics@uwe.ac.uk). All procedures can be found at: http://www1.uwe.ac.uk/research/researchethics/policyandprocedures.aspx. Pertinent Safety considerations: participants will be in close working proximity to a robot and their safety will be guarded and monitored in the following ways: (1) The robot, Baxter from Rethink Robotics, is a collaborative robot with SEA that are inherently safer than standard servo-driven robots. In the unlikely event that the robot will collide with the user the elastic nature of the robot allows the limbs to flex instead of pushing the user. (2) The robot will be programmed to move slowly so that any collision has minimal inertia. (3) The robot workspace will be limited to the area of the user’s arms and will be prevented from moving to the height of the user’s head. (4) The robot complies with international ISO and ANSI safety standards, please see link for more information from the manufacturer (http://www.rethinkrobotics.com/safety-compliance/). (5) The researcher and an assistant will monitor the task, one of which will be in possession of the emergency stop button for the robot and this will be used at any time the user or researcher feels it is necessary. (6) The robot will be programmed with force detection. The limbs have integrated force monitoring sensors that can be used to program the robot to stop when the limbs experience soft obstructions. Using this the robot will be programmed to stop on anything more than a gentle touch. (7) Baxter has a programmable face that can be used to display a pair of eyes. These help the user give reference to where and how the robot is moving, further improving the safety of the interaction.
Author Contributions
Substantial contributions to the conception or design of the work; or the acquisition, analysis, or interpretation of data for the work: GC, PC-S, and SD. Drafting the work or revising it critically for important intellectual content; final approval of the version: GC, AJ, SD, and PC-S.
Conflict of Interest Statement
The authors declare that the research was conducted in the absence of any commercial or financial relationships that could be construed as a potential conflict of interest.
Funding
This research was supported by EPSRC and EU CHIST-ERA, UK EPSRC funding Project Reference: EP/N021703/1. This work was partially funded by the programme “Acciones de Programación Conjunta Internacional 2015” by the Spanish Ministry of Economy, Industry and Competitiveness (project reference num. PCIN-2015-147).
Footnote
- ^I-DRESS project: www.i-dress-project.eu
References
Breiman, L., Friedman, J. H., Olshen, R. A., and Stone, C. J. (1984). Classification and regression trees. Wadsworth & Brooks, 1st Edn, Boca Raton: Chapman & Hall/CRC.
Chance, G., Camilleri, A., Winstone, B., Caleb-solly, P., and Dogramadzi, S. (2016). “An assistive robot to support dressing – strategies for planning and error handling,” in 6th IEEE RAS/EMBS International Conference on Biomedical Robotics and Biomechatronics (BioRob), 774–780.
Christie and Co. (2015). The UK Nursing Workforce. Available at: https://www.christie.com/ (accessed August 26, 2016).
Dudgeon, B. J., Hoffman, J. M., Ciol, M. A., Shumway-Cook, A., Yorkston, K. M., and Chan, L. (2008). Managing activity difficulties at home: a survey of medicare beneficiaries. Arch. Phys. Med. Rehabil. 89, 1256–1261. doi: 10.1016/j.apmr.2007.11.038
Foster, R., Fender, V., Office for National Statistics. (2013). Valuing Informal Adultcare in the UK, 1–23. Available at: http://www.ons.gov.uk/ons/dcp171766_315820.pdf
Gao, Y., Chang, H. J., and Demiris, Y. (2015). “User modelling for personalised dressing assistance by humanoid robots,” in IEEE International Conference on Intelligent Robots and Systems, 1840–1845. doi:10.1109/IROS.2015.7353617
Gao, Y., Chang, H. J., and Demiris, Y. (2016). “Iterative path optimisation for personalised dressing assistance using vision and force information,” in 2016 IEEE/RSJ International Conference on Intelligent Robots and Systems (IROS) (IEEE), 4398–4403. doi:10.1109/IROS.2016.7759647
Graf, B. (2001). “Reactive navigation of an intelligent robotic walking aid,” in Proceedings 10th IEEE International Workshop on Robot and Human Interactive Communication. ROMAN 2001 (Cat. No.01TH8591) (IEEE), 353–358. doi:10.1109/ROMAN.2001.981929
Havoutis, I., and Calinon, S. (2017). “Supervisory teleoperation with online learning and optimal control,” in Proceedings of IEEE International Conference on Robotics and Automation ICRA.
Kapusta, A., Yu, W., Bhattacharjee, T., Liu, C. K., Turk, G., and Kemp, C. C. (2016). “Data-driven haptic perception for robot-assisted dressing,” in 2016 25th IEEE International Symposium on Robot and Human Interactive Communication (RO-MAN) (IEEE), 451–458. doi:10.1109/ROMAN.2016.7745158
Klee, S. D., Ferreira, B. Q., Silva, R., Costeira, P., Melo, F. S., and Veloso, M. (2015). “Personalized assistance for dressing users,” in International Conference on Social Robotics (ICSR 2015), 359–369. doi:10.1007/978-3-642-25504-5
Knol, M. J., Egger, M., Scott, P., Geerlings, M. I., and Vandenbroucke, J. P. (2009). When one depends on the other. Epidemiology 20, 161–166. doi:10.1097/EDE.0b013e31818f6651
Koganti, N., Tamei, T., Matsubara, T., and Shibata, T. (2013). “Estimation of human cloth topological relationship using depth sensor for robotic clothing assistance,” in Proceedings of Conference on Advances in Robotics (New York, NY: ACM Press), 36:1–36:6. doi:10.1145/2506095.2506146
Kothari, V. K., and Ganga, M. K. (1994). Assessment of frictional properties of some woven fabrics. Indian J. Fibre Text. Res. 19, 151–155.
Lee, M.-C., and To, C. (2010). Comparison of Support Vector Machine and Back Propagation Neural Network in Evaluating the Enterprise Financial Distress. doi:10.5121/ijaia.2010.1303
LTCR. (2016). Long Term Care Revolution. Available at: http://www.ltcr.org/index.html (accessed September 9, 2016).
Matsubara, T., Shinohara, D., and Kidode, M. (2013). Reinforcement learning of motor skills with non-rigid materials using topology coordinates. Adv. Robot. 27, 513–524. doi:10.1080/01691864.2013.777012
Prescott, T. J., Epton, T., Evers, V., Mckee, K., Webb, T., Benyon, D., et al. (2012). “Robot companions for citizens: roadmapping the potential for future robots in empowering older people,” in Proceedings of the Conference on Bridging Research in Ageing and ICT Development (BRAID). Available at: http://www.iidi.napier.ac.uk/c/publications/publicationid/13371986
Ramkumar, S. S., Rajanala, R., Parameswaran, S., Paige, R., Shaw, A., Shelly, D. C., et al. (2004). Experimental verification of failure of Amontons’ law in polymeric textiles. J. Appl. Polym. Sci. 91, 3879–3885. doi:10.1002/app.13566
Satoh, H., Kawabata, T., and Sankai, Y. (2009). “Bathing care assistance with robot suit HAL,” in 2009 IEEE International Conference on Robotics and Biomimetics, ROBIO 2009, 498–503. doi:10.1109/ROBIO.2009.5420697
Savitzky, A., and Golay, M. (1964). Smoothing and differentiation of data by simplified least squares procedures. Anal. Chem. 36, 1627–1639.
Schenker, N., and Gentleman, J. F. (2001). On judging the significance of differences by examining the overlap between confidence intervals. Am. Stat. 55, 182–186. doi:10.1198/000313001317097960
Seiffert, C., Khoshgoftaar, T. M., Van Hulse, J., and Napolitano, A. (2010). RUSBoost: a hybrid approach to alleviating class imbalance. Syst. Hum, 40, 185–197. doi:10.1109/TSMCA.2009.2029559
Shao, Y., and Lunetta, R. S. (2012). Comparison of support vector machine, neural network, and CART algorithms for the land-cover classification using limited training data points. ISPRS J. Photogramm. Remote Sens. 70, 78–87. doi:10.1016/j.isprsjprs.2012.04.001
Shomin, M., Forlizzi, J., and Hollis, R. (2015). “Sit-to-stand assistance with a balancing mobile robot,” in Robotics and Automation (ICRA), 2015 IEEE International Conference on, 3795–3800. doi:10.1109/ICRA.2015.7139727
Suykens, J. A. K., and Vandewalle, J. (1998). Least squares support vector machine classifiers. Neural Process. Lett. 9, 293–300. doi:10.1023/A:1018628609742
Tamei, T., Matsubara, T., Rai, A., and Shibata, T. (2011). “Reinforcement learning of clothing assistance with a dual-arm robot,” in International Conference on Humanoid Robots, 733–738. doi:10.1109/Humanoids.2011.6100915
Tinker, A., Kellaher, L., Ginn, J., and Ribe, E. (2013). “Assisted living platform - the long term care revolution,” in Housing Learning & Improvement Network. Available at: https://www.ifa-fiv.org/wp-content/uploads/2013/11/HLIN-Report-LTC-Revolution.pdf
WHO. (2016). Facts about Ageing. Available at: http://www.who.int/ageing/about/facts/en/ (accessed September 9, 2016).
Yamazaki, K., Oya, R., Nagahama, K., Okada, K., and Inaba, M. (2014). “Bottom dressing by a life-sized humanoid robot provided failure detection and recovery functions,” in 2014 IEEE/SICE International Symposium on System Integration, SII 2014, 564–570. doi:10.1109/SII.2014.7028101
Zhang, M., and Mak, A. (1999). “In vivo friction properties of human skin,” in Prosthetics and Orthotics International. Available at: http://www.tandfonline.com/doi/abs/10.3109/03093649909071625 (accessed September 9, 2016).
Keywords: robotics, dressing, human–robot interaction, safety, sensors
Citation: Chance G, Jevtić A, Caleb-Solly P and Dogramadzi S (2017) A Quantitative Analysis of Dressing Dynamics for Robotic Dressing Assistance. Front. Robot. AI 4:13. doi: 10.3389/frobt.2017.00013
Received: 03 February 2017; Accepted: 13 April 2017;
Published: 16 May 2017
Edited by:
Alessio Merola, Magna Græcia University, ItalyReviewed by:
Yixing Gao, Imperial College London, UKKimitoshi Yamazaki, Shinshu University, Japan
Beatriz Quintino Ferreira, Instituto Superior Técnico – Universidade de Lisboa, Portugal
Copyright: © 2017 Chance, Jevtić, Caleb-Solly and Dogramadzi. This is an open-access article distributed under the terms of the Creative Commons Attribution License (CC BY). The use, distribution or reproduction in other forums is permitted, provided the original author(s) or licensor are credited and that the original publication in this journal is cited, in accordance with accepted academic practice. No use, distribution or reproduction is permitted which does not comply with these terms.
*Correspondence: Greg Chance, Z3JlZy5jaGFuY2VAdXdlLmFjLnVr