 Violet Mwaffo
 Sachit Butail
 Maurizio Porfiri
- 1Department of Mechanical and Aerospace Engineering, New York University Tandon School of Engineering, Brooklyn, NY, United States
- 2Department of Mechanical Engineering, Northern Illinois University, DeKalb, IL, United States
Collective motion in animal groups manifests itself in the form of highly coordinated maneuvers determined by local interactions among individuals. A particularly critical question in understanding the mechanisms behind such interactions is to detect and classify leader–follower relationships within the group. In the technical literature of coupled dynamical systems, several methods have been proposed to reconstruct interaction networks, including linear correlation analysis, transfer entropy, and event synchronization. While these analyses have been helpful in reconstructing network models from neuroscience to public health, rules on the most appropriate method to use for a specific dataset are lacking. Here, we demonstrate the possibility of detecting leaders in a group from raw positional data in a model-free approach that combines multiple methods in a maximum likelihood sense. We test our framework on synthetic data of groups of self-propelled Vicsek particles, where a single agent acts as a leader and both the size of the interaction region and the level of inherent noise are systematically varied. To assess the feasibility of detecting leaders in real-world applications, we study a synthetic dataset of fish shoaling, generated by using a recent data-driven model for social behavior, and an experimental dataset of pharmacologically treated zebrafish. Not only does our approach offer a robust strategy to detect leaders in synthetic data but it also allows for exploring the role of psychoactive compounds on leader–follower relationships.
1. Introduction
It is generally hypothesized that the movement of animal groups is steered by influential individuals called leaders, which benefit the collective by locating food sources (Giardina, 2008) and protecting against predatory attacks (Partridge, 1982; Ballerini et al., 2008). Further, it is believed that these individuals accomplish these tasks by relying on environmental information available to them rather than social feedback (Dyer et al., 2009; King et al., 2009). Past studies in collective animal behavior have explained the emergence of leadership through several mechanisms, including the availability of extra group knowledge (Krause and Ruxton, 2002; Ioannou et al., 2011), hunger (Krause et al., 1992; Krause, 1993), personality traits (Leblond and Reebs, 2006; Nakayama et al., 2012), and morphophysiological variations (Reebs, 2001).
We work with the definition of leadership by Krause et al. (2000) “as the initiation of new directions of locomotion by one or more individuals which are then readily followed by other group members.” Under the assumption that leadership roles within an animal group are consistent through time and space within the duration of an experimental observation, we seek to identify leaders on the basis of the strength and direction of pairwise interactions among individuals. A leader will be recognized as an individual that exerts a strong one-directional interaction on other group members, while being marginally responsive to their behavior. The interaction between pairs of individuals can be quantified through correlation or information-theoretic measures that capture the directional relationship between the time series of motion data of the individuals. These include cross-correlation (Engel et al., 1990), event synchronization (Quiroga et al., 2002), and information-theoretic measures, such as transfer entropy (Schreiber, 2000), conditional transfer entropy (Sun et al., 2014), maximum entropy (Cavagna et al., 2014), causation entropy (Sun and Bollt, 2014), and union transfer entropy (Anderson et al., 2016).
Each of these measures has its advantages and limitations. Cross-correlation has been successfully used to identify leader–follower relationships from movement data of fish shoals (Krause et al., 2000; Ladu et al., 2014), but it assumes a linear relationship between the time series and is therefore less likely to dissect complex dependencies that consist of varying time delays and non-linear relationships (Ianniello, 1982; Peterson et al., 1998). Event synchronization measures synchronicity between extreme events in the time series (Quiroga et al., 2002) and has been used to identify connectivity structures in atmospheric processes (Malik et al., 2012) and legal policy data (Grabow et al., 2016), under the premise of occurrence of so called extreme events within the time series. Information-theoretic measures, like transfer entropy, have the advantage of being model-free (Steuer et al., 2002; Hlaváčková-Schindler et al., 2007; Vicente et al., 2011), and thereby enable the analysis of time series with varying delays and non-linear relationships. However, since the estimation of these measures requires computing probability distributions, information-theoretic quantities are data hungry (Ito et al., 2011). The duration of observations required to reliably identify relationships between time series increases exponentially with the dimensionality of the dataset (Ito et al., 2011), such that the treatment of multidimensional time series is considerably more challenging than scalar ones.
Animals are likely to communicate within a group through both linear and non-linear dependencies, mediated by unknown delays, making it difficult to pinpoint the specific measure that will perform best for a given dataset of group behavior. Accordingly, all of the above mentioned measures may be useful in identifying leaders at one time or another, and a combined approach that integrates these individual measures could offer a viable approach to study leadership. We detect leader–follower relationships by setting thresholds on average values of pairwise interactions obtained from three different methods: cross-correlation (Engel et al., 1990), event synchronization (Quiroga et al., 2002), and transfer entropy (Schreiber, 2000). To further improve the performance of leader detection beyond any of these methods, we combine them in a maximum likelihood sense to build a single classifier for detecting leaders (Barreno et al., 2008).
Validating this approach would be difficult on real behavioral data, where one may have limited knowledge of, and control on, leadership. Unlike self-propelled particle computer simulations, where leadership roles can be assigned artificially, identifying leaders within animal groups is hampered by the lack of a ground truth. In this context, we turn to self-propelled particle models to evaluate methods that can identify leaders in group motion. Self-propelled particle models can range from the simplest, where the individuals orient themselves in the general direction of their neighbors (Vicsek et al., 1995; Vicsek and Zafeiris, 2012), to more complex models where interactions include collision avoidance, attraction, and alignment (Aoki, 1982; Couzin et al., 2002, 2005). Data-driven models that incorporate detailed individual dynamics along with species-specific interactions (Gautrais et al., 2009, 2012; Kolpas et al., 2013; Borzí and Wongkaew, 2015; Mwaffo et al., 2015a, 2017; Zienkiewicz et al., 2015a,b; Collignon et al., 2016) provide an even more realistic setup to create such roles and test methods for identifying leaders.
We test our approach on a synthetic dataset comprising simulations of self-propelled particles interacting according to the Vicsek model (Vicsek et al., 1995). A single particle that is not responsive to the rest of the group is assigned the role of a leader. We compare the performance of each classifier as well as the combined classifier in terms of their ability to detect the leader particle. We systematically vary the level of inherent uncertainty and the size of the region of interaction, thereby modulating the degree of coordination within the group (Vicsek et al., 1995). Upon demonstrating the validity of the approach, we investigate its use in the study of realistic data on gregarious fish shoaling. First, we apply the method to detect leaders in an established data-driven model of fish social behavior (Gautrais et al., 2012). Then, we consider experimental data from our group on social behavior of pharmacologically treated zebrafish, in which one fish is exposed to moderate caffeine level to elicit a psychostimulant effect (Fisone et al., 2004; Ferré, 2008). Such a psychostimulant effect could be hypothesized to promote leadership, by potentially reducing social responsiveness and increasing the level of activity of the treated subject, which could be then recognized as a leader by untreated fish (Ladu et al., 2014; Shams and Gerlai, 2016).
The paper is organized as follows. In Section 2, we describe the three classification methods used for studying pairwise interactions in networks of dynamical systems. In Section 3, we explain our approach to detect leadership from raw time series of positional data. We evaluate the performance of all classifiers—individual and combined—on datasets consisting of particles interacting according to the Vicsek model in Section 4. In Section 5, we demonstrate the use of our approach on realistic simulation data and experimental observations on fish collective behavior. We conclude the manuscript with a discussion of the results and performance of the approach.
2. Quantifying Pairwise Interactions in Networks of Dynamical Systems
The process of detecting leaders in a group begins with the measurement of the time series of the individual motion, from which we seek to uncover social interactions. These time series can be obtained from simulated or experimental data. Specifically, for each individual i, i = 1, …, N, where N is the group size, we register a scalar time series , where T is the duration of the time series and t is the time step. This time series, for example, would represent a salient observable of swimming activity, such as, turn rate, orientation, or positional preference with respect to a target stimulus.
To infer leader–follower relationships between a pair of individuals i and j, we examine three methods, namely, cross-correlation (CC), transfer entropy (TE), and event synchronization (ES). Different from our previous work (Butail et al., 2016), which focused on fish pairs and considered each classification method separately, here we address the more general problem of leader detection in groups in a maximum likelihood sense that integrates the three classifiers. For a pair of individuals and a given method, we construct a one-directional relationship between the individuals, whose magnitude measures the strength of the interaction and whose direction is always from the leader to the follower. In case none of the individuals in the pair is identified as a leader, the strength is set to zero. In general, each method could reveal a different leader–follower relationship for a given pair, and even if methods might agree on who is the leader and who is the follower, the strength of the interaction may vary. We label the strength of the interaction between i and j as , where the dot specifies the selected method, CC, TE, ES, and CL abbreviates “classifier.”
An intuitive representation of leader–follower relationships within the group could be garnered by considering a directed network, where nodes correspond to individuals and weighted directed edges identify the role of each node in the pair (leader versus follower) and the strength of the interaction. As a result, we define the weighted adjacency matrix W, such that if the method detects i as the follower and j as the leader, and if instead i is the leader for the pair ij. The ith row of W has non-zero elements where the pairwise interactions have i as a leader, and the entry corresponds to the value of the classifier. The ith column of W has non-zero elements for the pairwise interactions where i instead is recognized as a follower, and the corresponding entry is the value of the classifier. While it is not possible that both Wij and Wji are non-zero simultaneously, they can both be equal to zero, when the method does not identify a leader in the pair. The weighted adjacency matrix contains all the information that is acquired through the analysis of pairwise interactions, by bookkeeping the role of each node in every possible pairwise interaction and the corresponding strength. Figure 1 illustrates a network of interaction for a group of five individuals, along with the corresponding weighted adjacency matrix, concisely depicting pairwise leader-follower interactions in the group.
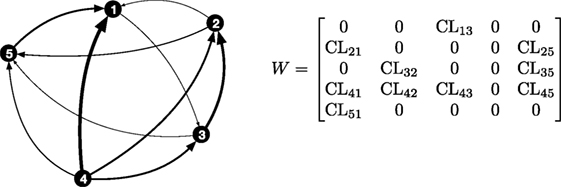
Figure 1. Illustration of pairwise directed interactions between five agents. In a pairwise interaction between two nodes, the edges start from the leader and terminate at the follower, and the weight of the edge, shown as lines of different thickness, is measured by the value of the classifier. The corresponding directed adjacency matrix W is also shown. In a pairwise interaction between two nodes, the edges start from the leader and terminate at the follower, and the weight of the edge, shown as lines of different thickness, is measured by the value of the classifier. Based on this, in the network shown above, node 4 acts as leader for the entire group.
2.1. Cross-Correlation
Cross-correlation measures the similarity between the processes as a function of time delay τ between them (Knapp and Carter, 1976), that is,
where and denote the time averages of and ; the value of t spans the range of overlap between the two time series. The value of delay, τ, that maximizes the cross-correlation rij(τ) in equation (1), over a range of values between −(T − 1) and T − 1, is called the time lag between the two time series, that is, .
When , we say that anticipates , and we identify i as the leader and j as the follower. The numerical value of the corresponding cross-correlation quantifies the strength of the inferred leader–follower interaction, such that, .
2.2. Transfer Entropy
The computation of transfer entropy requires a probabilistic treatment of the time series. Specifically, we represent each time series as a stochastic stationary process taking values in a finite set 𝒳. The cardinality of 𝒳 is related to the length of the time series, such that longer time series will allow for a high resolution description of the stochastic process, and therefore, a large cardinality. Transfer entropy (Schreiber, 2000) measures the reduction in the uncertainty in predicting one process given the knowledge of another. Transfer entropy from individual j to i is defined as
Here, denotes the joint probability of the future and current state of individual i and the current state of individual j; denotes the conditional probability of the future state of individual i given the current states of both individuals i and j; and denotes the probability of the future state of individual i conditioned on its current state. The probability distributions can be estimated using histograms (Vejmelka and Palus, 2008) or kernel density estimators (Schreiber, 2000). Transfer entropy is a non-negative quantity, which is equal to zero if individual j has no influence on individual i. In this case, .
We say that i is the leader and j the follower if TEi→j > TEj→i. The value of the, positive, net transfer entropy from the leader to the follower measures the strength of the interaction, that is, .
2.3. Extreme-Event Synchronization
Extreme-event synchronization was proposed in Quiroga et al. (2002) to measure synchronicity between signals by comparing the occurrence of extreme events. Briefly, the times when extreme events occur in the two time series for individuals i and j are indexed by and , where mi and mj are the number of extreme events in the times series of i and j, respectively. These sequences identify the time steps at which the processes exceed a predefined threshold in magnitude; we call such instances extreme events. The number of extreme events for i that occur within a window of duration ξ from those for j are
where
From the quantity above, we compute event synchronicity and event delay (Quiroga et al., 2002) as follows:
Event synchronicity is symmetric and measures the coupling between individuals i and j; event delay is asymmetric and measures the time lag between extremes events for i and j. By construction, , such that when , the occurrence of extreme events for i systematically precede those for j. We use the sign of event delay to determine leadership, whereby i is the leader if . The strength of the interaction is determined by event synchronicity, that is, . By construction, , with identifying completely synchronous events.
3. Detecting Leaders in Groups
We define group leaders as individuals that on average lead within pairwise interactions with other group members. Using the network representation in Figure 1, we identify a group leader as the node with the largest weighted degree, measured as the difference between the weighted out-degree and the weighted in-degree. For node i, the weighted out-degree is the sum of all the pairwise interactions in which the individuals acts as a leader, that is, . The weighted in-degree is the sum of all the pairwise interactions in which the individual acts as a follower, that is, .
As a result, a group leader may not be a leader in every single pairwise interaction, but will have the strongest average effect on the overall group. Specifically, we define the average pairwise interaction for an individual i as
and we seek to identify which individual maximizes this quantity. Leaders are classified by setting a threshold T(⋅) on the value obtained from equation (7). This combination of average pairwise interaction and the associated threshold constitutes a single classifier.
3.1. Classifier Performance
The performance of a classifier is evaluated in terms of the number of true and false positives and is dependent on the value of the threshold. A visual aid used in comparing different thresholds is the receiver operating characteristic (ROC) curve which plots the number of true positives against false positives for a range of thresholds (Fukunaga, 2013), see, for example, Figure 2.
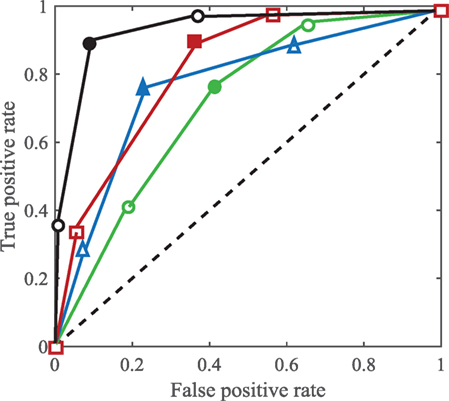
Figure 2. Pictorial illustration of ROC analysis for assessing classifier performance. ROC curves for three hypothetical classifiers are plotted with their respective cutoff points in green, blue, and red. A combined ROC in black is plotted by selecting only three points over the 29 produced by the maximum likelihood method. For each curve, the solid marker identifies the operating point, and the empty markers label other cutoff points.
In this respect, a good classifier has few false positives and a large number of true positives for a range of thresholds. Classifier performance can be quantified from the ROC curve by calculating the area under the curve (AUC). A perfect classifier will have 100% true positive rate (TPR) for all values of false positive rate (FPR), and therefore the AUC will be 1. In contrast, a classifier that performs at chance level will have the same number of true and false positives at all combinations and its ROC curve will lie on the diagonal line resulting in an AUC of 0.5.
The optimal threshold value that gives the best performance for a classifier can be estimated from the ROC curve based on several different measures, including distance from the top left corner and the Youden index which maximizes the difference between TPR and FPR (Youden, 1950). The corresponding operating point on the ROC curve, which selects the optimal threshold, lies at the maximum vertical distance from the 45° line.
3.2. Combining Classifiers Using Likelihood Ratio
Multiple classifiers can be combined to yield an optimal performance, as illustrated in Figure 2, where the black curve is closer to an ideal classifier at the top left corner. Specifically, we combine classifiers in the Neyman–Pearson sense in that the resulting optimal classifier maximizes TPR for a given FPR (Barreno et al., 2008).
The output of a classifier, , and the associated threshold T(⋅) corresponding to the operating point, can be mapped into the binary choice set {0, 1} such that the detection of an individual as a leader corresponds to and as a follower to . For clarity, we suppress the implicit dependence on the threshold, and denote a classifier simply as . The likelihood ratio for a combination of classifiers is defined as ℓ(C) = P(C|H1)/P(C|H0), where H1 and H0 correspond to the hypotheses that the individual being evaluated is a leader or a follower, respectively. In this sense, corresponds to TPR, and to FPR. The Neyman–Pearson lemma states that for some value of κ ∈ (0, ∞) and γ ∈ [0, 1], the likelihood ratio test
has the highest detection rate, P(𝒟(C) = 1|H1), for a bound on FPR.
The optimal values κ* and γ* in the likelihood ratio test are obtained by interpolating between select points on the ROC curve including the operating point, and the (1,1) and (0,0) points on the extreme. These two extreme points identify the cases in which we always classify an individual as a leader, (1,1), or as a follower, (0,0). By interpolating and moving along this new curve, we can tune the false alarm rate. The new ROC curve constructed in this way is called the likelihood-ratio ROC (LR-ROC) (Barreno et al., 2008). Each region of the LR-ROC corresponds to a different decision rule, such that the analyst could locate and use different combinations of classifiers that provide the best performance.
Assuming that the classifiers are conditionally independent, that is , c ∈ {0, 1}, we use the true and false positive rates of each to construct the LR-ROC. Specifically, each classifier has two possible outcomes for an individual, that is, an individual can be classified as a follower, when outcome is 0, or leader, when outcome is 1. This results in a total of 23 = 8 possible outcomes for three classifiers. Using the notation to denote the likelihood of classifying an individual as a leader, and to denote the likelihood of classifying an individual as a follower, we arrange the likelihood ratios in increasing order for eight possible outcomes for three classifiers. From this ordering, for a given value of the false positive rate, we determine the combined true positive rate as the probability maximizing the likelihood ratio, and as such, we construct the combined ROC. The outcomes can be represented with Boolean operators (AND, OR, NOT) to make a combined classifier, where the space of Boolean combinations has cardinality .
In practice, we combine the three classification methods by using three points on their respective ROC. The selection of a small subset of points on the ROC curves is primarily to contain the intensive computational cost associated with searching for the optimal classifier among all possible Boolean combinations (Barreno et al., 2008). Accordingly, we select three points per classifier, close to 25% quartile, 50% quartile and at the operating point of the ROC. Further, in the event that the combined classifier performance measured by the AUC is less than the one of any individual classifier, due to the selection of only three points for the combination, we force the combined method to match the convex hull of the tree classifiers.
Even with three points on each ROC curve, finding the Boolean rule that corresponds to a location on the combined ROC, built using three points per individual classifier,1 involves searching through a space of Boolean combinations of outcomes, which is practically difficult. This does not mean that the combined ROC has no value, since it provides an upper reference bound on which we could test simple Boolean rules that can be easily implemented on a dataset. Such a comparison could be performed by computing the distance between the operating point on the combined ROC and the point that corresponds to a candidate Boolean rule (Khreich et al., 2010).
The maximum likelihood combination of classifiers is a general approach that can accommodate more classifiers, beyond the three considered in this work. However, as the space of Boolean combinations of classifier outcomes rises exponentially (Barreno et al., 2008), the capability of finding the optimal combination becomes practically unfeasible. The combined ROC curve provides an upper bound on which to evaluate candidate Boolean combinations for use in real datasets.
4. Classifying Leaders in Vicsek Self-Propelled Particles
4.1. Modeling Leadership
We adapt the self-propelled particle model proposed by Vicsek (VM) to include leaders, as individuals that do not adjust their heading in response to the rest of the group. Leaders will only change their heading as a function of inherent uncertainty; this behavior could be associated with some prior knowledge of the environment that would manifest into a preference for a given direction. Followers, instead, update their heading based on the response of the group, under the effect of inherent uncertainty. In particular, the model consists of N particles moving in a square of side length L with periodic boundary conditions.
In the complex plane, the position xi ∈ 𝒞 and orientation θi of the ith particle changes in time as
where Arg[⋅] is the phase of a vector; I is the imaginary unit; v is the constant, common speed; η ≥ 0 is the noise intensity; and ζ is uniform random noise in [−π, π). The vector Ui(t) defines the desired heading of the ith particle, such that
where θ0 is the preferred heading of the leader. Here, is the set of individuals within a circle of radius r > 0 from the ith particle. From r and L, one may estimate the average number of neighbors with which a given particle interacts at any time step as (see, for example, Aldana et al., 2007).
Using the VM, we simulate 30 realizations of a group of N = 5 self-propelled particles. The simulations are initialized by drawing the particle positions uniformly in a square of length L = 1 with their orientations uniformly sampled from [−π, π). Simulations are performed for 20,000 time steps. Particle turn rate is computed from its heading angle, as θi(t + 1) − θi(t) for the ith particle, and utilized to evaluate pairwise interaction using cross-correlation, transfer entropy, and event synchronization. Turn rate is selected as the key variable for measuring pairwise interactions based on the structure of the VM, in which the only interaction rule is alignment and each particle consistently utilizes its previous heading in the computation of the current heading. As a result, pairwise interactions are likely to manifest in changes of the turn rates.
4.2. Classification
Cross-correlation is computed over the entire length of the time series using the Matlab function xcorr. Transfer entropy is computed using PROCESS_NETWORK_v.1.4 software (Ruddell and Kumar, 2009) by estimating the joint probability densities in equation (2) through histograms. The software is run with a total of 18 bins to differentiate the net transfer entropy between group leaders and followers in the VM (see Figure S1 in Supplementary Material). Event synchronization is computed using the MATLAB function Event_sync developed by Quiroga et al. (2002). To evaluate extreme-event synchronization, similar to Quiroga et al. (2002), the time series of extreme events are extracted from the absolute turn rate, by finding a local maximum over a window of 30 data points. Events between the two time series are considered synchronous if the time lag between them is smaller than half the minimum time lag between successive extreme events in each series (Quiroga et al., 2002). The ROC curves are plotted using the function perfcurve available in MATLAB.
Figure 3 illustrates the numerical values of the classification indices in equation (7) for a group of N = 5 particles without a leader, with one leader, and with two leaders. For this example, cross-correlation is affected by large standard deviations that may mask the success of the detection. Transfer entropy and event synchronization, instead, consistently identify leaders in the group based on the direction and strength of pairwise interactions. To offer some statistical ground for comparing the methods and help assessing the role of model parameters, we next analyze AUC values, focusing on the case of a single leader in the group.
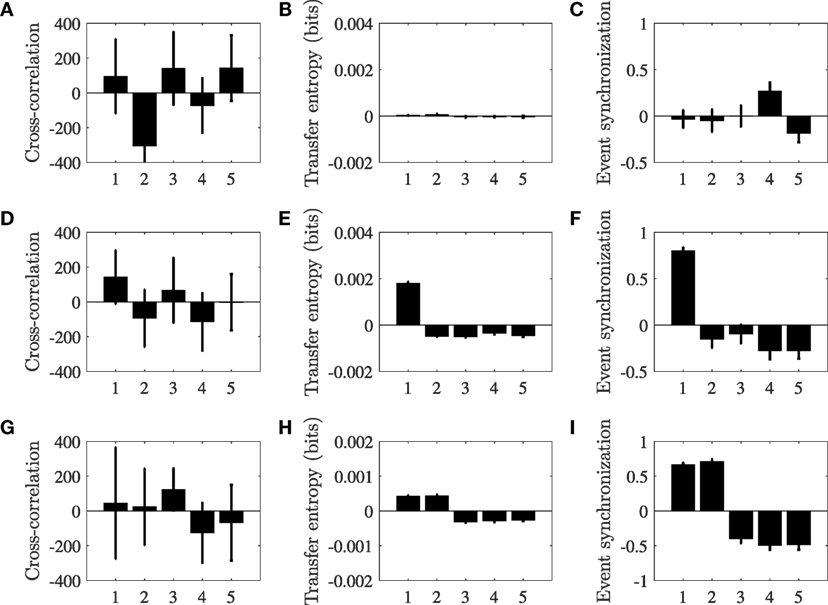
Figure 3. Classification index , for particles i = 1, …, N computed for cross-correlation (A,D,G), transfer entropy (B,E,F), event synchronization (C,F,I), without leader (A–C), with one leader (D–F), and with two leaders (G–I). Each simulated group includes five identical particles (i = 1, …, 5), and the Vicsek model parameters are set to v = 0.01, r = 0.23, and η = 0.21. Each bar refers to the mean value of the classifier across 30 simulations, and the error bar is one standard deviation. The numbering of particles that are not leaders is arbitrary, such that in panels (D–F) particle 1 is the leader and in panels (G–I) particles 1 and 2 are leaders.
Using ROC, we analyze the performance of the three classification methods in identifying leadership by varying the interaction radius r and the noise intensity η, while keeping the rest of model parameters constant. Figures 4A–C present the AUC of the three classifiers as the noise intensity and the radius of interaction are varied. In agreement with our expectations based on the representative case considered in Figure 3A cross-correlation is seldom able to correctly identify the leader in the group. For reference, the case displayed in Figure 3A has an AUC of 0.51. A likely reason for the limited performance of cross-correlation in detecting leaders in the VM is due to the presence of high-frequency noise in the turn rate, associated with the numerical differentiation of the noise which mediates the orientation update in the model. This noise is likely to suppress linear leader–follower relationships that might be successfully detected using cross-correlation.
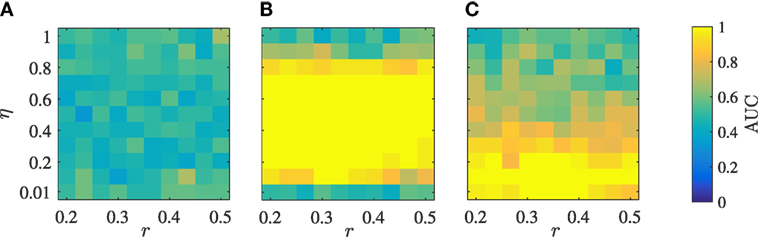
Figure 4. Performance of the three classification methods in detecting the single leader measured by their AUC as a function of the radius of interaction r and the noise intensity η for cross-correlation (A), transfer entropy (B), and event synchronization (C), with N = 5 and v = 0.01.
Transfer entropy shows excellent performance for every selection of the radius of interaction and a noise intensity between 0.1 and 0.8; for reference the case displayed in Figure 3B has an AUC of 1.00. Excessively low noise results into all the particles aligning with the leader’s direction in a crystallized formation that does not promote information transfer. In this case, all the particles travel along the constant leader’s direction, such that the entropy of each group member is zero. For intensities above 0.8, the particles are nearly independent, such that their orientation update is entirely controlled by noise. In this case, although each particle has a large entropy, the interactions between the particles are masked by individual noise and transfer entropy between any pair of particles vanishes. Increasing the length of the time series could increase the range of noise intensities for which the method can be successful, although dealing with large time series is only realistic for synthetic data. Even if transfer entropy is based on the premise of pairwise interactions, the classification method is successful in isolating the leader for large values of the radius of interaction, which lead to the occurrence of higher-order interactions. This success could be attributed to the use of the average value net transfer entropy across all pairs to construct the classifier, which mitigates the possibility of biases associated with follower-to-follower interactions. Systems composed of a very large number of particles or the presence of strong heterogeneities could limit the success of the classifier.
Event synchronization demonstrates very good performance for every selection of the radius of interaction and a noise intensity less than 0.4; for reference the case displayed in Figure 3C has an AUC of 0.97. For low intensities, noise could manifest in the form of local extreme events in the turn rate which are readily captured by event synchronization. The superior performance of event synchronization with respect to cross-correlation should be attributed to its ability to pick up pairwise leader–follower relationships through varying time delays between extreme events. As noise increases, the frequency of such extreme events becomes too high for establishing faithful relationships between the time series.
The different noise intensity levels at which transfer entropy and event synchronization perform best motivate the need for combining the methods toward a better and more consistent approach to detect leaders in the Vicsek model over more wide range of noise intensities. Figure 5 demonstrates the performance of the combined method, which yields exact classification for any noise intensity below 0.9.
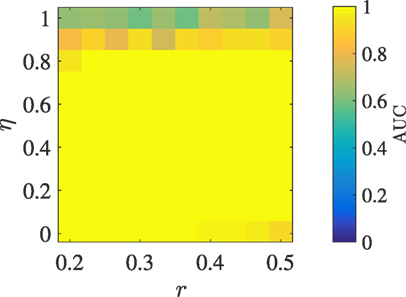
Figure 5. AUC obtained by combining the three classification methods shown in Figure 4 to detect the single leader, as a function of the radius of interaction r and the noise intensity η, with N = 5 and v = 0.01.
5. Applications to Fish Collective Behavior
To investigate the applicability of the leader detection approach on fish collective behavior we select two datasets. First, we generate fish-like trajectories from a random walker type model (Gautrais et al., 2012) that is able to successfully predict group alignment and average distance in barred flagtails (Kuhlia mugil). The data-driven model has five parameters to encapsulate individual swimming, social interactions, and wall interaction. Model parameters are based on selected based on simulations by Gautrais et al. (2012). A single fish is treated as a leader, such that it would not respond to the rest of the group. Second, we utilize trajectories from a group of zebrafish in an experiment where a single fish has been treated with caffeine. In contrast to the trajectories generated using the data-driven model where leadership is systematically controlled, there we explore whether caffeine treatment induces leadership in zebrafish.
5.1. Data-Driven Simulations
The model proposed by Gautrais et al. (2012) offers an authentic data-driven framework to describe the motion of a group of fish. In this model, the turn rate dynamics of a fish is described as a stochastic process modulated by interactions with the environment, which includes members of the group and the tank walls. From the knowledge of the turn rate of fish i = 1, …, N, one determines the position r(i) and orientation with respect to a Cartesian coordinate system in ℛ2 as follows:
where v is the common, constant speed.
The instantaneous turn rate at time t is modeled by the mean reverting stochastic differential process (Gautrais et al., 2012; Calovi et al., 2014)
where α(i) (s−1) is the rate at which the process returns to its steady state and defines the time scale of the response of a fish to any perturbation; is the infinitesimal increment of a standard Wiener process resulting in white noise; and is a scaling factor of the Wiener process that measures the level of uncertainty in the motion of a fish. The interaction with the environment is captured by the response function
In equation (13), the first term is used to model wall avoidance, and consists of the parameter , controlling the intensity of the wall avoidance, , the time to collision, and , the angle of incidence with the wall. Both the time to collision and the angle of incidence depend on the instantaneous position and orientation of the fish. The second term in equation (13) measures the interaction with the rest of the group. Therein, is a parameter controlling the strength of fish attraction toward the group; and are the fish interindividual distance and relative angle within the group, respectively; is a parameter controlling the strength of fish alignment with the rest of the group; and .
We simulate 100 realizations of a group of N = 5 fish with a leader. The model is simulated for 120 s using an Euler–Maruyama discretization with time step duration 0.01 s in a circular tank of diameter of 4 m. Orientation is initialized randomly between [−π, π) and positions are initialized uniformly in the circular domain. The model parameters of the individual turn rate dynamics are taken from Gautrais et al. (2012), that is, α(i) = 1/0.024 s−1, σ(i) = 28.9 m−1 s−1/2, and v = 0.564 m s−1. These values are based on experimental observations on a group of five subjects. We set the first fish as a leader and assign its coupling parameters to zero, that is, , similar to Butail et al. (2016). For the followers, we use , , for i ≠ j = 2, …, 5, to favor coordinated motion, based on results in Zienkiewicz et al. (2015b) and Butail et al. (2016). For all fish, the wall avoidance parameters is set to , which is larger than the value reported in Gautrais et al. (2012) to reflect the coupling values from Butail et al. (2016). Figure 6 shows a segment of the trajectories of the simulated group along with the time evolution of their turn rate, which is used for the leader detection process. The computation of the classifiers is analogous to the analysis of the VM, including the number of bins for the computation of transfer entropy that is chosen as 18 (see Figure S2 in Supplementary Material).
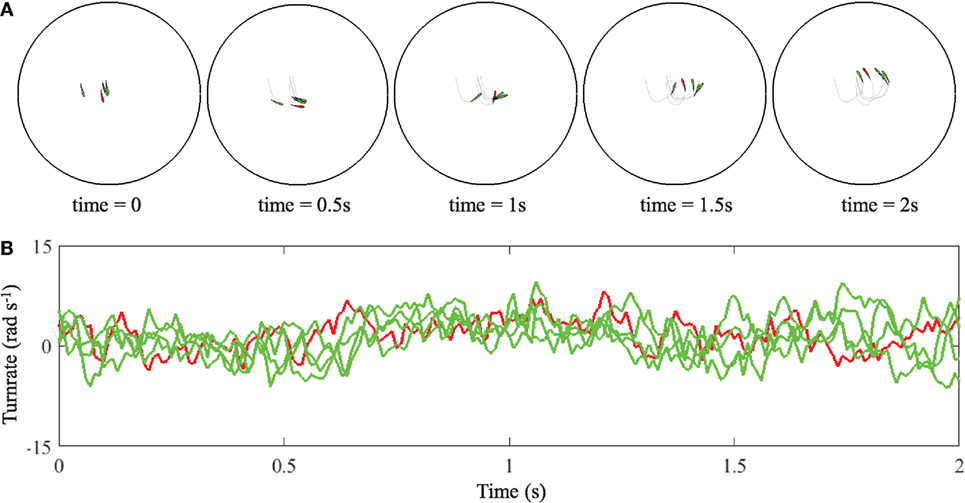
Figure 6. Two seconds of trajectory traces (A) and turn rate evolution (B) of a group of simulated fish with a leader in red and four followers in green. In the graph, time equal to zero does not correspond to the beginning of the simulation, when fish are uniformly distributed in the circular domain.
In Figure 7A, we illustrate the performance of the three classifiers in detecting leadership in the dataset generated using the data-driven model. All the classifiers are successful in detecting a leader beyond chance level, but, as expected from the analysis of the VM, their performance varies. Net transfer entropy and event synchronization, with AUC values at 0.90 and 0.85, respectively, perform better than cross-correlation, with an AUC value of 0.67. Figure 7B demonstrates the performance of the combined classifier, generated by selecting three points, indicated in the figure caption, on their respective ROC curve as operating points. Each point on the combined ROC corresponds to a potential combination which can be utilized as a classifier for leadership detection. The combined classifier has an AUC value of 0.99, which is superior than any of the individual classifiers.
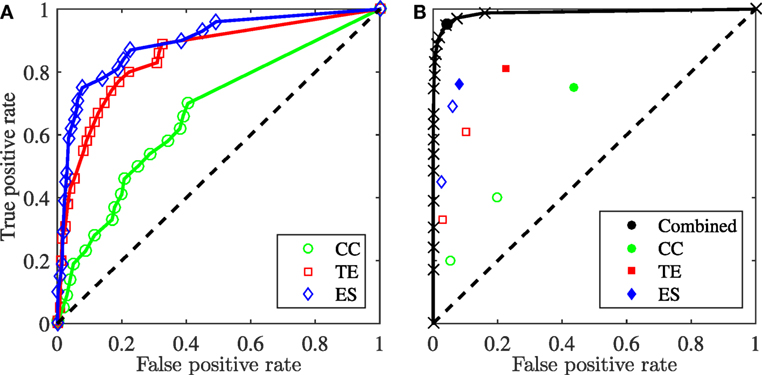
Figure 7. ROC curve for the data-driven model of fish behavior with a single leader generated using each of the three classification methods (A) and a combined approach (B), which integrates the ROCs from the three methods plotted using only 20 sampled points over a total of 512. The combined ROC is obtained by sampling three points on the ROC for each method. In panel (A), the AUC for CC, TE, and ES is estimated at 0.67, 0.85, and 0.90, respectively. In panel (B), the selected cutoff points are chosen such that the first point is just above the 25% quartile, the second is just above the 50% quartile, and the third one is the operating point. The operating point for each individual method is identified as a solid marker, and the other two as open markers. The operating point of the combination of the three classifiers is shown as a solid marker and has ROC coordinates (0.04, 0.95). The AUC from the combined method is 0.99.
In Table 1, we show the performance of the best twenty simple Boolean rules with at most three classifiers, ranked based on the distance from the operating point of the combined ROC. For completeness, we display their FPR and TPR. The first five simple Boolean rules have an equivalent performance on this synthetic dataset with an FPR of only 0.08 and a TPR of 0.76.
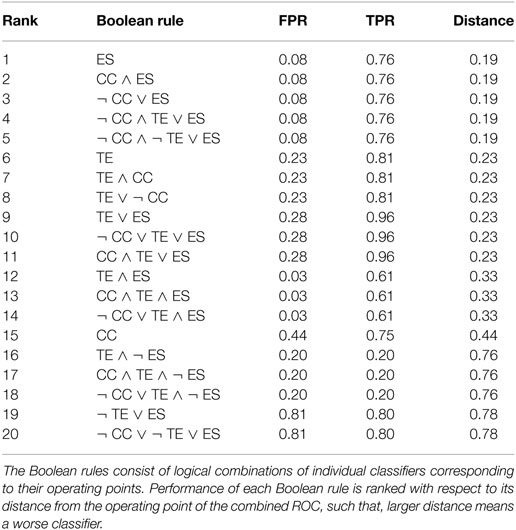
Table 1. Performance of 20 select Boolean rules on the synthetic dataset of data-driven model of fish social behavior.
5.2. Experiments on Pharmacologically Treated Zebrafish
To demonstrate the use of our approach in the study of experimental data on animal behavior, we investigate the possibility that the administration of a psychostimulant compound could elicit leadership in a group of fish. Specifically, we consider experimental data by our group (submitted work—data available upon request) on the collective behavior of caffeine-treated zebrafish swimming in a shallow water circular tank. The experimental procedure was carried out under protocol number 13-1424, approved by the University Animal Welfare Committee (UAWC) of New York University. In the literature, a number of studies have explored the effects of this psychoactive compound on the individual behavior of this popular animal model, but the effect of caffeine on zebrafish social behavior has yet to be fully understood (García-Pardo et al., 2015).
In our experiment, we test 10 groups of five fish, in which only one of the subjects is treated with caffeine at 25 mg/l concentration level. Fish motion is recorded from an overhead view at 40 frames per second for 5 min of experiments. A Daubechies wavelet filter is first applied to the fish centroid positions, and the turn rate of each fish, with i = 1, …, 5, is consequently estimated from the curvature of the trajectory (Mwaffo et al., 2015b). Following (Butail et al., 2016), data are down-sampled to a sampling period of 0.2 s to minimize the effect of measurement noise on the interactions. The number of bin is set at 18 to ensure consistency with respect to the simulation results presented earlier.
To implement our method on experimental data of fish treated with caffeine, we select the Boolean rule ¬ CC ∧ TE ∨ ES in Table 1. This selection is based on the following reasons: (i) this Boolean rule shows the best performance on the synthetic data generated by the data-driven model of fish social behavior, as shown in Table 1 and (ii) it combines TE and ES, which are found to complement each other in the classification of leaders and followers in the VM for the entire parameter space, as shown in Figure 4. Although the other four best rules in Table 1 have the same performance on the simulated dataset, they do not use TE, which is important for detecting leaders in instances of the VM characterized by limited coordination between the particles. The thresholds of CC, TE, and ES used to implement the Boolean rule on experimental data are obtained from the ROCs for the synthetic data generated by the data-driven model of fish social behavior. Specifically, we scale the operating points on those ROCs by the maximum values of CC, TE, and ES in the simulation and apply these thresholds to experimental data, which is also scaled by their corresponding maximum values.
In Table S1 in Supplementary Material, we summarize the results of the combined detection rule. For 10 out of the 10 experiments, we find that the Boolean rule ¬ CC ∧ TE ∨ ES identifies the caffeine-treated fish as a leader for the group. By comparing the fraction of experiments in which the treated fish is identified as a leader (10/10) with chance (1/5) using a t-test, we cannot dismiss the hypothesis that caffeine treatment is a determinant of leadership (t(9) = 1, p < 0.01). This result could be explained by the psychostimulant effects of caffeine, which, similar to other psychoactive compounds, like lysergic acid diethylamide and 3,4-methylenedioxymethamphetamine, might modulate social responsiveness (Shams and Gerlai, 2016). Also, we may propose that caffeine could enhance fish activity and produce an increase in the frequency of fast and sudden turning maneuvers (Wong et al., 2010; Gupta et al., 2014). It is possible that the hyperactivity of the treated fish could be perceived by untreated fish as an indicator of fitness, boldness, or high social status, thereby favoring its appraisal as a group leader (Ladu et al., 2014).
6. Conclusion
Here, we investigate the possibility of detecting leaders in animal groups from raw position data of each individual. Our approach to leadership detection builds on the measurement of pairwise interactions between each pair of individuals to isolate individuals that exert maximum net influence over the rest of the group based on a receiving operating curve. Pairwise interactions are quantified using three independent methods—cross-correlation, transfer entropy, and event synchronization—that are cogently integrated to maximize our success to identify leaders from raw data. In the technical literature, each of these methods has been found to have differential success in the study of connectivity patterns: we hypothesize that their combination in a maximum likelihood sense would help bring to light their specific advantages and mitigate their limitations.
We demonstrate our approach through the systematic study of self-propelled particles described using the classical Vicsek model (Vicsek et al., 1995), in which particles update their orientation as a function of their neighbors and additive noise. The leader is modeled as a particle that has additional knowledge about a specific direction to take, thereby maintaining its orientation, irrespective of the rest of the group. We systematically elucidate the role of the radius of interaction and the noise intensity on the success of each of the three methods to detect the leader. While cross-correlation typically fails to accurately identify the leader, the combination of transfer entropy and event synchronization demonstrates excellent performance for any parameter selection. From raw time series, we show the possibility of exactly detecting a leader from small to large noise intensities, encapsulating disordered and ordered patterns, and form small to large radii of interactions, describing sparse to fully connected networks of followers. The possibility of successfully detecting a single leader is not masked by introducing mild heterogeneities in the groups.2
Based on the success of our combined approach, we tackle two realistic datasets of fish social behavior. First, we demonstrate the ability to detect a leader in a synthetic dataset generated using a data-driven model (Gautrais et al., 2012; Calovi et al., 2014), in which the turn rate of each fish is described as a mean reverting diffusion process. Through our combined approach, we are successful in precisely isolating the leader from the rest of the group. Next, we study an experimental dataset on pharmacologically treated fish, in which one of the subjects is administered caffeine to elicit a psychostimulant effect that could enhance activity and trigger leadership. In agreement with the premise of the experiment, through the application of our combined approach, we find that caffeine-treated subjects are more likely to emerge as leaders of the group.
Our approach of identifying leaders via the strength of interactions over experimental time assumes that the leaders are consistent throughout the entire observation, in time and in space, which may not be always the case (Nakayama et al., 2012). When these conditions lose validity, one may seek to partition the observation into contiguous measurements and implement the approach separately, on each measurement. If data are available at high resolution, the analysis should reveal how leadership varies in the group during the observation.
Another important assumption of our approach is that a group member can either be a leader or a follower, which may not always be the case (Rosenthal et al., 2015). Although it is possible to mark an interaction as leaderless based on the value of the interaction strength, computing the baseline for such values may require experiments that tie leadership with other personality based traits. Understanding the number of leaders that the method can detect is also an area that requires further research. While our method is able to identify single leaders in small and large groups,3 its applicability to the study of groups with multiple leaders may pose some technical challenges due to the possibility of large correlation lengths and groups splits (DeLellis et al., 2013).
Further, leaders in our simulated datasets assume a singular role in the group, whereby they are not influenced by the rest of the individuals. A scenario may exist where leaders could act on information provided by a subset of neighbors, designated as informed followers, in the absence of consensus (Cucker and Huepe, 2008). It is likely that in such scenarios, the interaction strength will be lowered as compared to the directed relationships simulated here, thereby challenging the process of inference based on ROC curves.
This study significantly strengthens our methodological toolbox to study leadership in animal groups, by empowering analysts with a model-free framework to investigate the basis and determinants of leadership. This effort significantly expands on our previous work (Butail et al., 2016), which is limited to pairs and does not offer a methodology to inform the selection of a classifier. Here, we address both these issues through a novel method to aggregate pairwise interactions underlying social behavior in groups and combine different classifiers toward an improved success of discovering leaders. Although our definition of leadership is based on turn rate, it could, in principle, be extended to other observables such as linear acceleration, which is a salient control variable for other fish species (Fish et al., 1991) that exhibit burst and coast motion.
Ethics Statement
The experimental procedure was carried out under protocol number 13-1424, approved by the University Animal Welfare Committee (UAWC) of New York University.
Author Contributions
All the authors designed the study, performed the analysis of the data, and wrote the manuscript.
Conflict of Interest Statement
The authors declare that the research was conducted in the absence of any commercial or financial relationships that could be construed as a potential conflict of interest.
Funding
This work was supported by the National Science Foundation under Grant numbers # CMMI-1433670 and # CMMI-1505832, the Mitsui USA Foundation, and the Army Research Office under Grant number # W911NF-15-1-0267, with Drs. Samuel C. Stanton and Alfredo Garcia as the program managers.
Supplementary Material
The Supplementary Material for this article can be found online at http://journal.frontiersin.org/article/10.3389/frobt.2017.00035/full#supplementary-material.
Footnotes
- ^Selecting three points per ROC results in 9 binary classifiers to combine, for a total of 29 points on the combined ROC.
- ^We tested our approach with a group of 5 simulated fish whose parameters were chosen within ±10% of their nominal values used to generate Figure 7. Our results show similar performance for each classifier as well as the improvement in performance from the combined classifier—see Figure S3 in Supplementary Material.
- ^We evaluated our approach with a group of 20 simulated fish, which shows similar performance for each classifier as well as the improvement in performance from the combined classifier—see Figure S4 in Supplementary Material.
References
Aldana, M., Dossetti, V., Huepe, C., Kenkre, V., and Larralde, H. (2007). Phase transitions in systems of self-propelled agents and related network models. Phys. Rev. Lett. 98, 095702. doi: 10.1103/PhysRevLett.98.095702
Anderson, R. P., Jimenez, G., Bae, J. Y., Silver, D., Macinko, J., and Porfiri, M. (2016). Understanding policy diffusion in the US: an information- theoretical approach to unveil connectivity structures in slowly evolving complex systems. SIAM J. Appl. Dyn. Syst. 15, 1384–1409. doi:10.1137/15M1041584
Aoki, I. (1982). A simulation study on the schooling mechanism in fish. Bull. Jpn. Soc. Sci. Fish. 48, 1081–1088. doi:10.2331/suisan.48.1081
Ballerini, M., Cabibbo, N., Candelier, R., Cavagna, A., Cisbani, E., Giardina, I., et al. (2008). Interaction ruling animal collective behavior depends on topological rather than metric distance: evidence from a field study. Proc. Natl. Acad. Sci. U.S.A. 105, 1232–1237. doi:10.1073/pnas.0711437105
Barreno, M., Cardenas, A., and Tygar, J. D. (2008). “Optimal ROC curve for a combination of classifiers,” in Proceedings of the 22nd Annual Conference on Neural Information Processing Systems, December 2008, Vancouver, British Columbia, Canada, 57–64.
Borzí, A., and Wongkaew, S. (2015). Modeling and control through leadership of a refined flocking system. Math. Models Methods Appl. Sci., 25, 255–282.
Butail, S., Mwaffo, V., and Porfiri, M. (2016). Model-free information-theoretic approach to infer leadership in pairs of zebrafish. Phys. Rev. E 93, 042411. doi:10.1103/PhysRevE.93.042411
Calovi, D. S., Lopez, U., Ngo, S., Sire, C., Chaté, H., and Theraulaz, G. (2014). Swarming, schooling, milling: phase diagram of a data-driven fish school model. New J. Phys. 16, 015026. doi:10.1088/1367-2630/16/1/015026
Cavagna, A., Giardina, I., Ginelli, F., Mora, T., Piovani, D., Tavarone, R., et al. (2014). Dynamical maximum entropy approach to flocking. Phys. Rev. E 89, 042707. doi:10.1103/PhysRevE.89.042707
Collignon, B., Séguret, A., and Halloy, J. (2016). A stochastic vision-based model inspired by zebrafish collective behaviour in heterogeneous environments. R. Soc. Open Sci. 3, 150473. doi:10.1098/rsos.150473
Couzin, I. D., Krause, J., Franks, N. R., and Levin, S. A. (2005). Effective leadership and decision-making in animal groups on the move. Nature 433, 513–516. doi:10.1038/nature03236
Couzin, I. D., Krause, J., James, R., Ruxton, G. D., and Franks, N. R. (2002). Collective memory and spatial sorting in animal groups. J. Theor. Biol. 218, 1–11. doi:10.1006/jtbi.2002.3065
Cucker, F., and Huepe, C. (2008). Flocking with informed agents. Math. Action 218, 1–25. doi:10.5802/msia.1
DeLellis, P., Porfiri, M., and Bollt, E. M. (2013). Topological analysis of group fragmentation in multiagent systems. Phys. Rev. E 87, 022818. doi:10.1103/PhysRevE.87.022818
Dyer, J. R., Johansson, A., Helbing, D., Couzin, I. D., and Krause, J. (2009). Leadership, consensus decision making and collective behaviour in humans. Anim. Behav. 364, 781–789. doi:10.1098/rstb.2008.0233
Engel, A. K., König, P., Gray, C. M., and Singer, W. (1990). Stimulus-dependent neuronal oscillations in cat visual cortex: inter-columnar interaction as determined by cross-correlation analysis. Eur. J. Neurosci. 2, 588–606. doi:10.1111/j.1460-9568.1990.tb00449.x
Ferré, S. (2008). An update on the mechanisms of the psychostimulant effects of caffeine. J. Neurochem. 105, 1067–1079. doi:10.1111/j.1471-4159.2007.05196.x
Fish, F. E., Fegely, J. F., and Xanthopoulos, C. J. (1991). Burst-and-coast swimming in schooling fish (Notemigonus crysoleucas) with implications for energy economy. Comp. Biochem. Physiol. A Physiol. 100, 633–637. doi:10.1016/0300-9629(91)90382-M
Fisone, G., Borgkvist, A., and Usiello, A. (2004). Caffeine as a psychomotor stimulant: mechanism of action. Cell. Mol. Life Sci. 61, 857–872. doi:10.1007/s00018-003-3269-3
García-Pardo, M. P., Blanco-Gandía, M. C., Valiente-Lluch, M., Rodríguez-Arias, M., Miñarro, J., and Aguilar, M. A. (2015). Long-term effects of repeated social stress on the conditioned place preference induced by MDMA in mice. Prog. Neuropsychopharmacol. Biol. Psychiatry 63, 98–109. doi:10.1016/j.pnpbp.2015.06.006
Gautrais, J., Ginelli, F., Fournier, R., Blanco, S., Soria, M., Chaté, H., et al. (2012). Deciphering interactions in moving animal groups. PLoS Comput. Biol. 8:e1002678. doi:10.1371/journal.pcbi.1002678
Gautrais, J., Jost, C., Soria, M., Campo, A., Motsch, S., Fournier, R., et al. (2009). Analyzing fish movement as a persistent turning walker. J. Math. Biol. 58, 429–445. doi:10.1007/s00285-008-0198-7
Giardina, I. (2008). Collective behavior in animal groups: theoretical models and empirical studies. HFSP J. 2, 205–219. doi:10.2976/1.2961038
Grabow, C., Macinko, J., Silver, D., and Porfiri, M. (2016). Detecting causality in policy diffusion processes. Chaos 26, 083113. doi:10.1063/1.4961067
Gupta, P., Khobragade, S. B., Shingatgeri, V. M., Rajaram, S. M. (2014). Assessment of locomotion behavior in adult zebrafish after acute exposure to different pharmacological reference compounds. Drug Dev. Ther. 5, 127–133. doi:10.4103/2394-2002.139626
Hlaváčková-Schindler, K., Paluš, M., Vejmelka, M., and Bhattacharya, J. (2007). Causality detection based on information-theoretic approaches in time series analysis. Phys. Rep. 441, 1–46. doi:10.1016/j.physrep.2006.12.004
Ianniello, J. (1982). Time delay estimation via cross-correlation in the presence of large estimation errors. IEEE Trans. Acoust. 30, 998–1003. doi:10.1109/TASSP.1982.1163992
Ioannou, C. C., Couzin, I. D., James, R., Croft, D. P., and Krause, J. (2011). Social organisation and information transfer in schooling fish. Fish Cogn. Behav. 217–239. doi:10.1002/9781444342536.ch10
Ito, S., Hansen, M. E., Heiland, R., Lumsdaine, A. M., Litke, A., and Beggs, J. M. (2011). Extending transfer entropy improves identification of effective connectivity in a spiking cortical network model. PLoS ONE 6:e27431. doi:10.1371/journal.pone.0027431
Khreich, W., Granger, E., Miri, A., and Sabourin, R. (2010). Iterative Boolean combination of classifiers in the ROC space: an application to anomaly detection with HMMs. Pattern Recognit. 43, 2732–2752. doi:10.1016/j.patcog.2010.03.006
King, A. J., Johnson, D. D. P., and Van Vugt, M. (2009). The origins and evolution of leadership. Curr. Biol. 19, R911–R916. doi:10.1016/j.cub.2009.07.027
Knapp, C., and Carter, G. (1976). The generalized correlation method for estimation of time delay. IEEE Trans. Acoust. 24, 320–327. doi:10.1109/TASSP.1976.1162830
Kolpas, A., Busch, M., Li, H., Couzin, I. D., Petzold, L., and Moehlis, J. (2013). How the spatial position of individuals affects their influence on swarms: a numerical comparison of two popular swarm dynamics models. PLoS ONE 8:e58525. doi:10.1371/journal.pone.0058525
Krause, J. (1993). The influence of hunger on shoal size choice by three-spined sticklebacks, Gasterosteus aculeatus. J. Fish Biol. 43, 775–780. doi:10.1111/j.1095-8649.1993.tb01154.x
Krause, J., Bumann, D., and Todt, D. (1992). Relationship between the position preference and nutritional state of individuals in schools of juvenile roach (Rutilus rutilus). Behav. Ecol. Sociobiol. 30, 177–180. doi:10.1007/BF00166700
Krause, J., Hoare, D., Krause, S., Hemelrijk, C. K., and Rubenstein, D. I. (2000). Leadership in fish shoals. Fish Fish. 1, 82–89. doi:10.1111/j.1467-2979.2000.tb00001.x
Ladu, F., Butail, S., Macrí, S., and Porfiri, M. (2014). Sociality modulates the effects of ethanol in zebra fish. Alcohol. Clin. Exp. Res. 38, 1–9. doi:10.1111/acer.12432
Leblond, C., and Reebs, S. G. (2006). Individual leadership and boldness in shoals of golden shiners (Notemigonus crysoleucas). Behaviour 143, 1263–1280. doi:10.1163/156853906778691603
Malik, N., Bookhagen, B., Marwan, N., and Kurths, J. (2012). Analysis of spatial and temporal extreme monsoonal rainfall over South Asia using complex networks. Clim. Dyn. 39, 971–987. doi:10.1007/s00382-011-1156-4
Mwaffo, V., Anderson, R. P., Butail, S., and Porfiri, M. (2015a). A jump persistent turning walker to model zebrafish locomotion. J. R. Soc. Interface 12, 20140884. doi:10.1098/rsif.2014.0884
Mwaffo, V., Butail, S., Di Bernardo, M., and Porfiri, M. (2015b). Measuring zebrafish turning rate. Zebrafish 12, 250–254. doi:10.1089/zeb.2015.1081
Mwaffo, V., Butail, S., and Porfiri, M. (2017). In-silico experiments of zebrafish behaviour: modeling swimming in three dimensions. Sci. Rep. 7, 39877. doi:10.1038/srep39877
Nakayama, S., Harcourt, J. L., Johnstone, R. A., and Manica, A. (2012). Initiative, personality and leadership in pairs of foraging fish. PLoS ONE 7:e36606. doi:10.1371/journal.pone.0036606
Partridge, B. L. (1982). The structure and function of fish schools. Sci. Am. 246, 114–123. doi:10.1038/scientificamerican0682-114
Peterson, B. M., Wanders, I., Horne, K., Collier, S., Alexander, T., Kaspi, S., et al. (1998). On uncertainties in cross-correlation lags and the reality of wavelength-dependent continuum lags in active galactic nuclei. Publ. Astron. Soc. Pac. 110, 660. doi:10.1086/316177
Quiroga, R. Q., Kreuz, T., and Grassberger, P. (2002). Event synchronization: a simple and fast method to measure synchronicity and time delay patterns. Phys. Rev. E 66, 041904. doi:10.1103/PhysRevE.66.041904
Reebs, S. G. (2001). Influence of body size on leadership in shoals of golden shiners, Notemigonus crysoleucas. Behaviour 138, 797–809. doi:10.1163/156853901753172656
Rosenthal, S. B., Twomey, C. R., Hartnett, A. T., Wu, H. S., and Couzin, I. D. (2015). Revealing the hidden networks of interaction in mobile animal groups allows prediction of complex behavioral contagion. Proc. Natl. Acad. Sci. U.S.A. 112, 4690–4695. doi:10.1073/pnas.1420068112
Ruddell, B. L., and Kumar, P. (2009). Ecohydrologic process networks: 1. Identification. Water Resour. Res. 45, W03419. doi:10.1029/2008WR007279
Schreiber, T. (2000). Measuring information transfer. Phys. Rev. Lett. 85, 461. doi:10.1103/PhysRevLett.85.461
Shams, S., and Gerlai, R. (2016). Pharmacological manipulation of shoaling behavior in zebrafish. Curr. Psychopharmacol. 5, 180–193. doi:10.2174/2211556005666160607094906
Steuer, R., Kurths, J., Daub, C. O., Weise, J., and Selbig, J. (2002). The mutual information: detecting and evaluating dependencies between variables. Bioinformatics 18, S231–S240. doi:10.1093/bioinformatics/18.suppl_2.S231
Sun, J., and Bollt, E. M. (2014). Causation entropy identifies indirect influences, dominance of neighbors and anticipatory couplings. Physica D 267, 49–57. doi:10.1016/j.physd.2013.07.001
Sun, Y., Rossi, L. F., Shen, C. C., Miller, J., Wang, X. R., Lizier, J. T., et al. (2014). Information Transfer in Swarms with Leaders. arXiv Preprint arXiv:1407. 0007.
Vejmelka, M., and Palus, M. (2008). Inferring the directionality of coupling with conditional mutual information. Phys. Rev. E 77, 026214. doi:10.1103/PhysRevE.77.026214
Vicente, R., Wibral, M., Lindner, M., and Pipa, G. (2011). Transfer entropy—a model-free measure of effective connectivity for the neurosciences. J. Comput. Neurosci. 30, 45–67. doi:10.1007/s10827-010-0262-3
Vicsek, T., Czirók, A., Ben-Jacob, E., Cohen, I., and Shochet, O. (1995). Novel type of phase transition in a system of self-driven particles. Phys. Rev. Lett. 75, 1226–1229. doi:10.1103/PhysRevLett.75.1226
Vicsek, T., and Zafeiris, A. (2012). Collective motion. Phys. Rep. 517, 71–140. doi:10.1016/j.physrep.2012.03.004
Wong, K., Elegante, M., Bartels, B., Elkhayat, S., Tien, D., Roy, S., et al. (2010). Analyzing habituation responses to novelty in zebrafish (Danio rerio). Behav. Brain Res. 208, 450–457. doi:10.1016/j.bbr.2009.12.023
Youden, W. J. (1950). Index for rating diagnostic tests. Cancer 3, 32–35. doi:10.1002/1097-0142(1950)3:1<32::AID-CNCR2820030106>3.0.CO;2-3
Zienkiewicz, A., Barton, D. A. W., Porfiri, M., and di Bernardo, M. (2015a). Data-driven stochastic modelling of zebrafish locomotion. J. Math. Biol. 71, 1081–1105. doi:10.1007/s00285-014-0843-2
Keywords: classification, event synchronization, network, ROC, self-propelled particles, transfer entropy, zebrafish
Citation: Mwaffo V, Butail S and Porfiri M (2017) Analysis of Pairwise Interactions in a Maximum Likelihood Sense to Identify Leaders in a Group. Front. Robot. AI 4:35. doi: 10.3389/frobt.2017.00035
Received: 30 April 2017; Accepted: 30 June 2017;
Published: 31 July 2017
Edited by:
Vito Trianni, Institute of Cognitive Sciences and Technologies (CNR), ItalyReviewed by:
Maksym Romenskyy, Uppsala University, SwedenBertrand Collignon, École Polytechnique Fédérale de Lausanne, Switzerland
Eliseo Ferrante, KU Leuven, Belgium
Copyright: © 2017 Mwaffo, Butail and Porfiri. This is an open-access article distributed under the terms of the Creative Commons Attribution License (CC BY). The use, distribution or reproduction in other forums is permitted, provided the original author(s) or licensor are credited and that the original publication in this journal is cited, in accordance with accepted academic practice. No use, distribution or reproduction is permitted which does not comply with these terms.
*Correspondence: Maurizio Porfiri, bXBvcmZpcmlAbnl1LmVkdQ==