 Sugeeth Gopinathan
 Sonja K. Ötting
 Jochen J. Steil
- 1CoR-Lab, Bielefeld University, Bielefeld, Germany
- 2Institut für Robotik und Prozessinformatik, Technische Universität Braunschweig, Braunschweig, Germany
- 3Work and Organizational Psychology, Department of Psychology, Bielefeld University, Bielefeld, Germany
An ideal physical human–robot interaction (pHRI) should offer the users robotic systems that are easy to handle, intuitive to use, ergonomic and adaptive to human habits and preferences. But the variance in the user behavior is often high and rather unpredictable, which hinders the development of such systems. This article introduces a Personalized Adaptive Stiffness controller for pHRI that is calibrated for the user’s force profile and validates its performance in an extensive user study with 49 participants on two different tasks. The user study compares the new scheme to conventional fixed stiffness or gravitation compensation controllers on the 7-DOF KUKA LWR IVb by employing two typical joint-manipulation tasks. The results clearly point out the importance of considering task specific parameters and human specific parameters while designing control modes for pHRI. The analysis shows that for simpler tasks a standard fixed controller may perform sufficiently well and that respective task dependency strongly prevails over individual differences. In the more complex task, quantitative and qualitative results reveal differences between the respective control modes, where the Personalized Adaptive Stiffness controller excels in terms of both performance gain and user preference. Further analysis shows that human and task parameters can be combined and quantified by considering the manipulability of a simplified human arm model. The analysis of user’s interaction force profiles confirms this finding.
1. Introduction
As opposed to conventional industrial robotics where the robots are programmed to accomplish a fixed and repetitive task, interactive scenarios demand flexible robotic systems where the robot assists the human worker by collaborating with them, increasingly often through physical human–robot interaction (pHRI). Lightweight robots are replacing the traditional industrial robots in such tasks due to their obvious advantages: they are less dangerous, and the added compliance allows the users to work in close proximity and thus collaborate with the robot. This collaboration is a major step forward in achieving flexibility in industrial tasks, because the implicit technical knowledge that the human workers possess about the task can be incorporated directly by collaboration, without added effort of modeling or programming.
Although it is widely assumed that pHRI will improve flexibility and productivity by taking advantage of the human’s cognitive and perceptual skills, it is unclear how this interaction in detail may be made more ergonomical and pleasant for the user. For this aim, a few number of novel platforms are commercially available that allow the adaptation of the robot controller to make the human–robot interaction smoother. The online adaptation of impedance characteristics is possible, and such manipulators behave like a spring damper system that reacts to external forces (Buchli et al., 2011). However, substantial variation in human interaction forces coupled with unpredictable human behavior make it difficult to design a suitable pHRI system. Another factor, which will substantially affect pHRIs is the task itself. Unique task characteristics, such as geometry, difficulty level, and requirement of precision, have a sizable effect on how a human worker interacts with the robot during task completion. Each task is unique, and each individual approaches a task with a unique strategy, which might be substantially different among users. This variance in interaction is strongly connected to their physical limitations as well as to their personal preferences. Hence, not only user interaction forces but also the physical characteristics of the users such as differences in height, body proportions, left or right handedness, the distance the user keeps with the robot, or varying cognitive skills can introduce substantial variance. This demands personalization of the robots to be capable of accommodating user-specific dynamics.
In summary, task specific characteristics and human parameters play an important role in user interaction and the resulting variance in user behavior. They therefore should be investigated further. Most of the current literature—except a few such as Medina et al. (2011) and Rozo et al. (2015)—ignores these aspect and focuses entirely on adapting robot controllers to the user interaction forces. Rozo et al. (2015) use Gaussian mixture model to learn cooperative robot skills in the context of human–robot object transportation. This method allows the robot to automatically encode the human demonstrations and its relation to the task parameters. Medina et al. (2011) proposed a method for gaining knowledge as well as acquiring semantic labels for interaction experience on joint manipulation without supervision, aiming at improving the robots joint-manipulation skills. Various schemes based on variable admittance or impedance control have been proposed to improve the interaction quality, where the user interaction is mapped into robot stiffness, hence trying to reduce the effort in pHRI. Dimeas and Aspragathos (2014) implemented a variable admittance controller that is based on a Fuzzy inference system and an adaptation algorithm to vary the admittance parameters. Here, the Fuzzy inference system relies on the measured velocity and the human force and proposes suitable controller gains. In Lecours et al. (2012), a variable admittance control is discussed to improve intuitiveness in interaction by adjusting the admittance parameters based on the acceleration and velocity of the end effector. The parameters are then tuned online by certain heuristics. In Khan et al. (2015), a muscle circumference sensor is used to estimate the human interactive force, and a Radial Basis Function Neural Network is used to predict the desired human motion. Li et al. (2015) use game theory and policy iteration to analyze the pHRI and subsequently try to estimate the control objective of the user. This prediction is thereafter used to adapt the robot’s objective to user objective to coordinate the interaction. Ranatunga et al. (2015) try to account for the variability in human dynamics and propose a controller that can incorporate human intent, nominal task models, as well as variations in the robot dynamics. The proposed scheme consists of an outer-loop model tuned using an inverse control technique and an inner-loop that uses a neuroadaptive controller to linearize the robot dynamics.
These often rather complicated adaptation schemes have neither been evaluated nor tested with naive users, that is, with non-experts who have no prior knowledge about the robots and their programming. In addition, the implicit assumption that such adaptations are beneficial for task performance or user satisfaction has not yet been validated on any reasonable tasks. Also the importance of task specific parameters and the variance this introduces in human–robot interaction has not been discussed. We hypothesize that determining these highly variable human characteristics and task parameters and analyzing their effects on the smoothness and efficiency of the pHRI is a crucial factor toward practical applications of pHRI and deserves more attention. Despite these clear indications, apparently no commercially available and practically used control scheme embodies such adaptivity or personalization and experimental experience is shallow.
In Gopinathan et al. (2017), a user study was conducted, and a novel personalized adaptation control was discussed. The personalized adaptive control mode used is parametrized based on interaction force limits of each individual user. Hence, each user will have a unique interaction experience based on their corresponding limitations. The Personalized Adaptive Stiffness control mode is evaluated with non-expert users, comparing its performance and interaction quality to standard constant stiffness or gravity compensation modes that are widely used for pHRI. In this article, we elaborate the results of the user study and investigate additional characteristics, which may have significant effects on pHRI. While in principle it would be desirable to comparatively evaluate this approach additionally with all the methods discussed earlier and add more human factors, this is clearly beyond the scope of a single user study. The current contribution starts at the even more basic question of whether adaptive schemes can actually perform better for non-expert users than simple fixed standard control techniques that are widely applied in practice. The evaluation of data from the study will shed more light on the significance of considering task specificity and importance of human specific parameters while designing control strategies for pHRI.
In Section 2, the robotic system, the control scheme, and the interaction control modes are described in detail. Section 3 describes the study design, the tasks users performed in the experiment, the questionnaire users had to answer during the experiment, and the dependent variables that are considered while designing the evaluation regime. Section 4 tabulates the detailed results of the conducted experiments and provides a statistical comparison of the results from the experiments. In Section 5, task specificity is discussed along with the results of force analysis and manipulability analysis. Finally, in Section 6, we discuss the lessons learned and how future research could unfold.
2. The Robotic System
The robotic system is designed to emulate common industrial applications (e.g., welding or gluing) where the robotic arm is used as a tool and the user moves it kinesthetically by physically touching the robot’s end effector. The control modes are implemented within the Compliant Control Architecture (Nordmann et al., 2012), and the program flow of the experiment is implemented using a Domain-Specific Language (Nordmann and Wrede, 2015). This section describes the robotic system used and elaborates on the implementation of the interaction control schemes. Figure 1 shows the experiment setup.
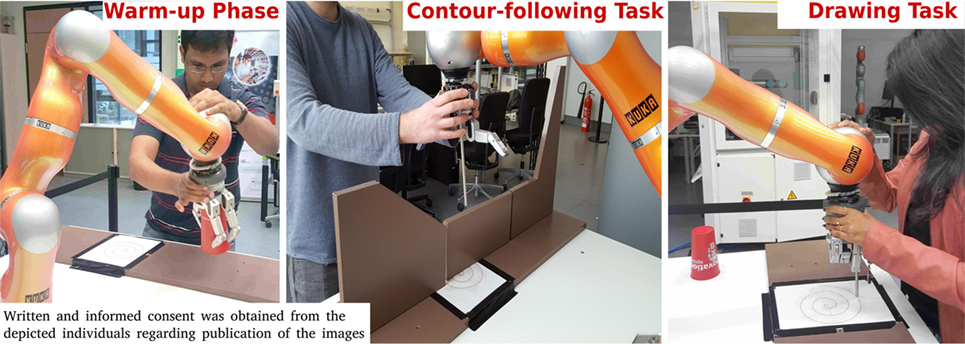
Figure 1. The robotic system: study participants interacting with the robot and performing the tasks.
2.1. Compliant Robot Platform
The platform for our user study consists of a KUKA Light Weight Robot (LWR IV) (Bischoff et al., 2010) equipped with a BarrettHand (BH8) (Townsend, 2000). The LWR IV is a redundant robot with seven joints equipped with torque sensors in each joint. The LWR IV is an actively compliant robot and has an impedance based control scheme (Albu-Schäffer et al., 2007). The BarrettHand that is attached to the LWR IV is a multi-fingered programmable grasper, equipped with fingertip torque sensors and tactile sensors at the palm of the grasper. This grasper is used in the experiment to achieve certain interaction tasks as explained in Section 3. In addition, a detachable rod is attached to the BarrettHand for accomplishing the tasks in the experiment.
2.2. Interaction Control Scheme
The compliant platform allows the users to move the end effector kinesthetically within the robot’s workspace. The user interaction at the end effector will produce a Cartesian displacement Δx from the current end-effector position x, the new desired Cartesian equilibrium is as follows:
The analytical controller named CBF controller, proposed in Emmerich et al. (2013) is based on Grupen and Huber (2005) and is used here for converting the user input in task space x* into joint space q*. A redundancy resolution qc is selected to get the best inverse kinematic solution that satisfies the desired task criteria. The controller generates nullspace motion to maintain the preferred redundancy resolution configuration qc, while achieving as primary task the Cartesian target displacement as follows:
Here J† constitutes the Moore–Penrose Pseudoinverse of the task Jacobian. This implementation allows the user to interact seamlessly with the robot and move the end effector. A smoothing component was used to prevent the robot arm from drifting away after the interaction, the smoothing factor α adapts the Cartesian displacement and was chosen to be 0.5. Both Δx′ and qc are fed simultaneously into the hierarchical controller. The hierarchical controller prioritizes the tasks, treating the smoothed displacement as the primary task and the redundancy resolution as the secondary task. The controller then sends Δq to the robot which corresponds to the user given Cartesian displacement Δx. Figure 2 shows the control scheme architecture. During the experiment, the built-in Joint Impedance mode of KUKA LWR is used, the stiffness and damping values are chosen to suit the different control modes under consideration, the values for the stiffness were selected from a pre-study conducted with 8 participants. The joint stiffness mode was selected for the tasks for allowing the users more freedom in the interaction and give them the possibility to reconfigure the robot if necessary.
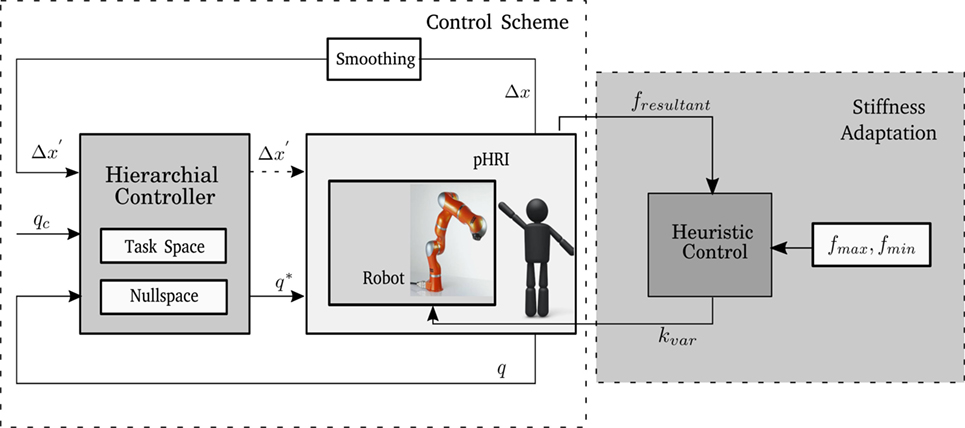
Figure 2. Block diagram showing how the Personalized Adaptive Stiffness mode is implemented. An outer control loop is used to vary the stiffness of the Joint Impedance Controller.
2.3. Interaction Control Modes
In this study, four control modes are compared, see Table 1. The implementation of the controllers is based on the architecture described in Section 2.2. The damping is kept constant during the interaction for all control modes, whereas the stiffness values are varied accordingly in each mode to attain desired interaction strategy. The stiffness values of high and medium stiffness modes were set to constant values based on the results from the pre-study.
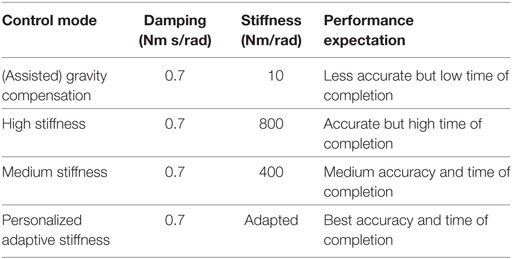
Table 1. Overview of four control modes that are compared in the study.
The current position of the robot is continuously tracked by the control loop and forms the reference for the Joint Impedance Controller. The robot can be moved freely by the user but will hold its position even when no external force is applied. As described in Steil et al. (2014), the native gravity compensation mode is reimplemented using the above specified control scheme. Hence, switching of control modes in LWR IV controller during the experiment was avoided.
In the assisted Gravity Compensation mode, forces applied by the users are not resisted by the robot. In this mode, the robot is compliant and the user can move the robot through physical interaction. The High Stiffness mode offers higher resistance to the user when interaction occurs. This might not be ergonomically good for the user, since throughout the interaction a high force at the end effector needs to be applied. In Medium Stiffness mode, the robot offers a slight resistance to user interaction.
The fourth mode is the Personalized Adaptive Stiffness mode. This is a personalized mode where a linear heuristic is used to adapt the stiffness of the robot online. A similar approach was used in Dimeas and Aspragathos (2014) where a heuristic was used to vary the impedance parameters based on the change in velocity of the robot. In our case, we keep the damping at a constant value and vary the stiffness based on the instantaneous interaction force. The stiffness is linearly proportional to the applied force. The individual fmax and fmin are calculated for each user during the initial warm-up phase of the experiment (see Section 3.2.1) and are used to set the limits of control mode. The stiffness varies between a maximum and minimum value, kmax and kmin as follows:
From experimental trials conducted in the pre-study, kmax is set to 1,000 Nm/rad and kmin is set to 10 Nm/rad. The instantaneous resultant force applied at the end effector is measured as fresultant. Based on equation (3), a stiffness is calculated (kvar). This stiffness is then filtered using a second order low-pass filter and forwarded to the controller. This control mode adapts to the forces which the user applies and is personalized to work within the user’s force range. The integration of the adaptation into the interaction control scheme is shown in Figure 2.
3. Study Design
To compare the four interaction control modes, we designed a user study as within-subjects study, where each participant experiences all four control modes. This design has been chosen because it is economic and eliminates possible influences from individual-related confounding variables (Field, 2013). The interaction control modes were activated in random order to prevent the occurrence of sequencing effects.
3.1. Ethic Statement
Before starting the user study, we consulted Bielefeld University’s ethics committee, which approved of the study as being ethically innocuous. In addition, the study setup was inspected and approved by the official safety officer. Each of the participants was given a short briefing prior to the experiment containing information about the study process and data that would be assessed. The subjects had also the possibility to ask questions before the experiment and were insured that it was possible to quit participating at every point in time and that in this case the incomplete data would be deleted and not enter the analysis. All participants gave their oral informed consent in accordance with Declaration of Helsinki. For data protection reasons, no written statements were obtained not to store any personal data. This was in agreement with usual practice in such studies and in accordance with Bielefeld University’s ethic committee guidelines. After finishing the experiment, the participants were debriefed and given additional information regarding the study.
3.2. Study Setup
This section describes the experiment phases and procedures that employ a two-stage model similar to Wrede et al. (2013). The first phase is a warm-up where the user interacts with the robot and an individual force profile is recorded for subsequent calibration of the Personalized Adaptive Stiffness mode. In the second phase, the user is asked to complete certain tasks, e.g., moving a tool point attached to the robot along a predefined trajectory, using different control modes. In addition, each participant has to fill in a questionnaire. The flow of the study is shown in Figure 3.
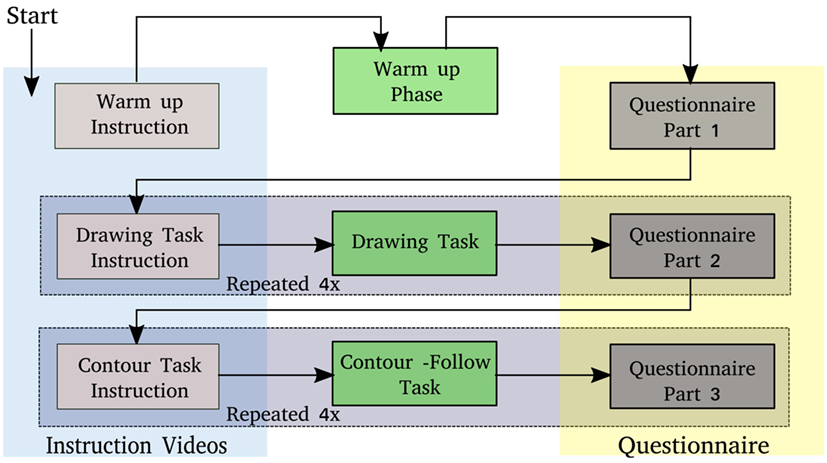
Figure 3. The experiment flow, users have to finish the listed tasks to successfully complete the study, the drawing task and contour-following task are repeated four times with different control modes.
3.2.1. Warm-up Phase
In this first phase, the user plays a pick and place game and interacts with the robot by physically moving its end effector. Five objects are randomly placed in the workspace and the user moves the BarrettHand above the object and presses the palm onto the object. This action is sensed by the palm sensor and the fingers of the BarrettHand close, and the object is grasped. Then the user is asked to move the robot end effector to the target location marked in the robot workspace, place the object on target location and press it downwards causing the BarrettHand fingers open and release the object. After finishing this task, the user proceeds to the next object and repeats the game. The robot’s stiffness is set to a medium value at this phase. This allows us to record the normal working force limits of the user. Figure 1 shows one of the participants interacting with the robot in this phase.
Besides providing an opportunity for the users to get used to the robot, this warm-up phase serves a secondary purpose: while the user participates in the pick and place game, a force observer program continuously monitors the forces applied by the user at the end effector. During each interaction, the maximum and minimum forces are stored and finally averaged. The underlying assumption is that each user has different physical capabilities (some users may be stronger than others) and hence the force applied by each user will vary. If we calibrate a Personalized Adaptive stiffness controller to work between these force limits, each user gets his/her own personalized adaptive controller respecting their physical capabilities. Hence, from this phase fmax, the maximum interaction force and fmin, the minimum interaction force from each user are calculated.
3.2.2. Task Phase
In the second phase, the users perform two tasks of varying complexity with different control modes. The tasks are designed to emulate common industrial tasks like welding or gluing where the user has to move a tool in a predetermined trajectory for completing each task. From experimental pre-trials, it was determined that these tasks should be neither too easy nor too complex. The users have to move the tip of the tool/end effector along a predetermined trajectory (e.g., a spiral) from a start to end position to complete the task. The users have to perform each task with four control modes. The control modes are activated in random order to eliminate possible sequencing effects, whereas the users have no information on the control mode they are using in each trial.
3.2.2.1. Drawing Task
The two tasks vary in difficulty. In the first task, the user is asked to draw a predefined figure on the flat surface of a table. During this task, the user has to care for task accuracy while maintaining contact with the flat surface. As experienced in the pre-study, moving the robot tool around curves leads to errors. It is also not easy to maintain contact to the surface while following a non-straight contour. For the purpose of standardization of the experiment, a spiral image is placed on the workspace, and the user has to follow this spiral trajectory starting from the outside of the curve and ending at the center point. In Figure 1, a study participant can be seen following a spiral with the tool attached to the end effector.
3.2.2.2. Contour-Following Task
The second task is simpler than the first task. It is easy but not trivial as it involves moving the tool in 3D space. An adapted version of the wire-loop game is constructed in the robot workspace. The user has to move the tool along the edge from one end to the other to finish the task. This task resembles gluing or welding along the edge of a workpiece. In Figure 1, a study participant can be seen moving the tool along the edge of the adapted wire-loop game.
3.2.3. Questionnaire
The data for the qualitative analysis were collected by means of questionnaire. Before the first task, the participants answered several questions on control variables (e.g., previous experience with robots). After each task, the participants rated how they perceived the interaction with the robotic arm. After the completion of all tasks, the participants answered additional questions on demographic variables.
The questionnaire was adapted to the task and the robotic arm used in the experiment. The items concerning the interaction quality asked for the rating of how easy it was to use the robotic arm (ease of use), how controllable (control) and reliable (reliability) the robot was, how enjoyable the interaction was (enjoyment), and how satisfied the participants were with the robot (user satisfaction). The items used for this were selected items from the sub-scales perceived ease of use, perceived enjoyment, and perception of external control from the Technology Acceptance Model (Venkatesh, 2000), supplemented with items from the sub-scales reliability and system satisfaction from the Integrated Model of user satisfaction and technology acceptance (Wixom and Todd, 2005). Sample items are as follows: “Interacting with the system did not require a lot of my mental effort” for ease of use, “I had control over using the system” for control, “The operation of the robot was dependable” for reliability, “I found using the system to be enjoyable” for enjoyment, and “All things considered, I was very satisfied with the interaction with the robot” for user satisfaction. The participants rated their agreement with the presented statements on a 5-point answer scale (5 = I agree/1 = I do not agree).
3.3. Dependent Variables
This section describes the criteria used to compare the interaction control modes based on their performance.
3.3.1. Variables for Quantitative Analysis
The following variables are used to analyze the performance of the users.
Time of completion: the time required to move the end effector from the starting point to the target point.
Procrustes analysis: a rigid shape analysis that uses isomorphic scaling, translation, and rotation to find the best fit between two or more landmarked shapes (Ross, 2004). Procrustes analysis quantifies the similarity between the task trajectory generated by the user and the target trajectory. This criterion refers to the quality and the effectiveness of each control mode. The goodness-of-fit criterion used in this analysis is the sum of squared errors. It returns a measure of dissimilarity d, the similarity measure is calculated as s = (1 − d).
Smoothness: a movement is considered smooth when it happens without interruptions. Smoothness is generally used to determine the controllability of a system (Balasubramanian et al., 2015). Hence, a trajectory with maximum smoothness will result in maximal movement efficiency (Burdet et al., 2013). Also a smooth interaction ensures a reduced interaction effort from the user side, hence improving the human–robot interface (Olsen and Goodrich, 2012). One of the most commonly used smoothness measures is the number of peaks (NP). The peaks are identified as the number of maxima in a given trajectory, see equation (4). This quantifies the smoothness to a measurable quantity (Montes et al., 2014). The total number of peaks in each dimension X, Y, and Z is calculated from the recorded data and the sum of the peaks in X and Y is counted.
Another method of quantifying smoothness is representing it as a function of jerk equation (5), which is the time derivative of acceleration (Hogan, 1984). The jerk cost is a scalar, which could be used for judging the smoothness of the trajectory (Shadmehr and Wise, 2005). The jerk cost of the individual axis is calculated for each trajectory, and the sum is then represented as the total jerk cost for each user generated trajectory.
Arc length: the total length traversed while moving along the given trajectory. It is related to the accuracy in task completion. Larger arc length means more deviation the user had from the intended path. The arc length can be calculated as equation (6).
3.3.2. Variables for Qualitative Analysis
To analyze the interaction quality, the participants rated their perception of the interaction quality after each task. Each criterion of interaction quality (ease of use, reliability, external control, enjoyment, and user satisfaction) is briefly described below. Perceived ease of use is one of the main determinants of system use. It is the degree to which a user believes that using a system will be free of effort (Davis, 1989). Reliability and control are system characteristics, influencing how users experience the use of the system. Reliability refers to the degree to which a user believes he or she can depend on the system’s operations to be reliable and predictable (Wixom and Todd, 2005). The perceived control is the degree to which a user believes that he or she has control over using the system (Venkatesh and Bala, 2008). Enjoyment and user satisfaction capture affective perceptions of using the system in question. Enjoyment is the extent to which “the activity of using a specific system is perceived to be enjoyable in its own right, aside from any performance consequences resulting from system use” (Venkatesh et al., 2003, p. 351). User satisfaction represents the degree of favorableness the user shows with respect to the system (Wixom and Todd, 2005).
4. Experiment Results
In this section, the criteria for performance and interaction quality are analyzed to evaluate the four control modes for both tasks. A second order low-pass filter was used to eliminate noise in the data. To analyze whether there are differences between the controllers, we applied the repeated measures analysis of variance (ANOVA). This procedure is recommended to compare the mean values of experimental groups, where the same participants experience all experimental conditions (in this case, the four control modes). The results in this section will be reported with the full test statistics (e.g., F(3) = 7.19, p < 0.001). Here, the p-value indicates the significant difference between the compared groups (level of significance: 0.05). Subsequently, pairwise comparisons (post hoc test: Bonferroni) determine which groups differ significantly from each other (level of significance: 0.05). The execution of repeated measures ANOVA has several requirements: The most important is the absence of sphericity. If sphericity is detected, the usage of Greenhouse–Geisser corrected tests is recommended (Field, 2013). The corresponding results are reported and interpreted in the same way as mentioned earlier. Figure 4 shows the performance of participant 23 while using different control modes for completing both mentioned tasks.
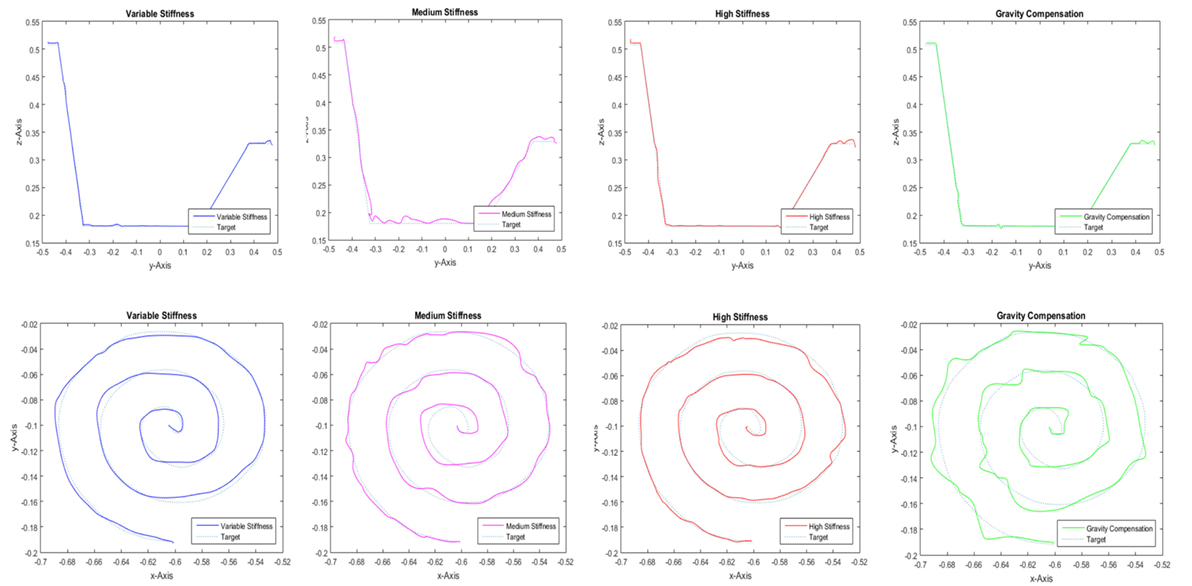
Figure 4. Performance of participant 23, while using different control modes to finish the contour-following and drawing tasks.
4.1. Participants
N = 49 users participated in the experiment, where 74.5% were male, M age = 31.67, SD age = 10.46, and 78.7% right-handed. The data from two participants were removed because of inconsistencies in the data, primarily caused by not following the given instructions. The participants were mainly full-time working 44.7%, 31.9% were students, 10.6% part-time working, and 4.3% not working. The educational level was high, with 53.2% having a university degree, 25.5% having a higher vocational education. The participants were recruited through snowball sampling, following an initial advertisement. The user study titled “Human–Robot Interaction User Study” has been approved by Ethics Commission of Bielefeld University.
4.2. Hypothesis
Based on the characteristics of the four control modes described earlier, we had the following hypotheses on the outcomes of this comparison: H1: The gravity compensation mode will be faster but less accurate than medium stiffness or high stiffness. H2: The high stiffness mode will be slower but more accurate than medium stiffness or gravity compensation. H3: The medium stiffness mode will be in between gravity compensation and high stiffness mode in terms of time and accuracy. H4: The adaptive stiffness mode excels the other modes in terms of time and accuracy.
4.3. Drawing Task
4.3.1. Quantitative Analysis
Repeated measures ANOVA showed significant differences between the controllers for all performance criteria. The detailed ANOVA test statistics can be found in Table 2. The means and standard deviation of each criteria for the four control modes for both the tasks are shown in Figure 5. The post hoc pairwise comparisons showed the following results: For time, there is a significant difference between Adaptive Stiffness and High Stiffness (p < 0.001), while Adaptive Stiffness did not differ significantly from Gravity Compensation (p = 1.000) and Medium Stiffness (p = 1.000), even though the mean time for Gravity Compensation is slightly lower than that of Adaptive Stiffness and that of Medium Stiffness. This indicates similar performance using Adaptive Stiffness or Gravity Compensation modes.
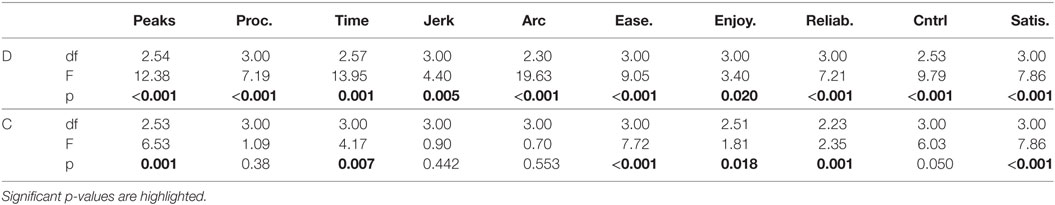
Table 2. ANOVA results for contour-following task (C) and drawing task (D), df, F, and p are the ANOVA parameters.
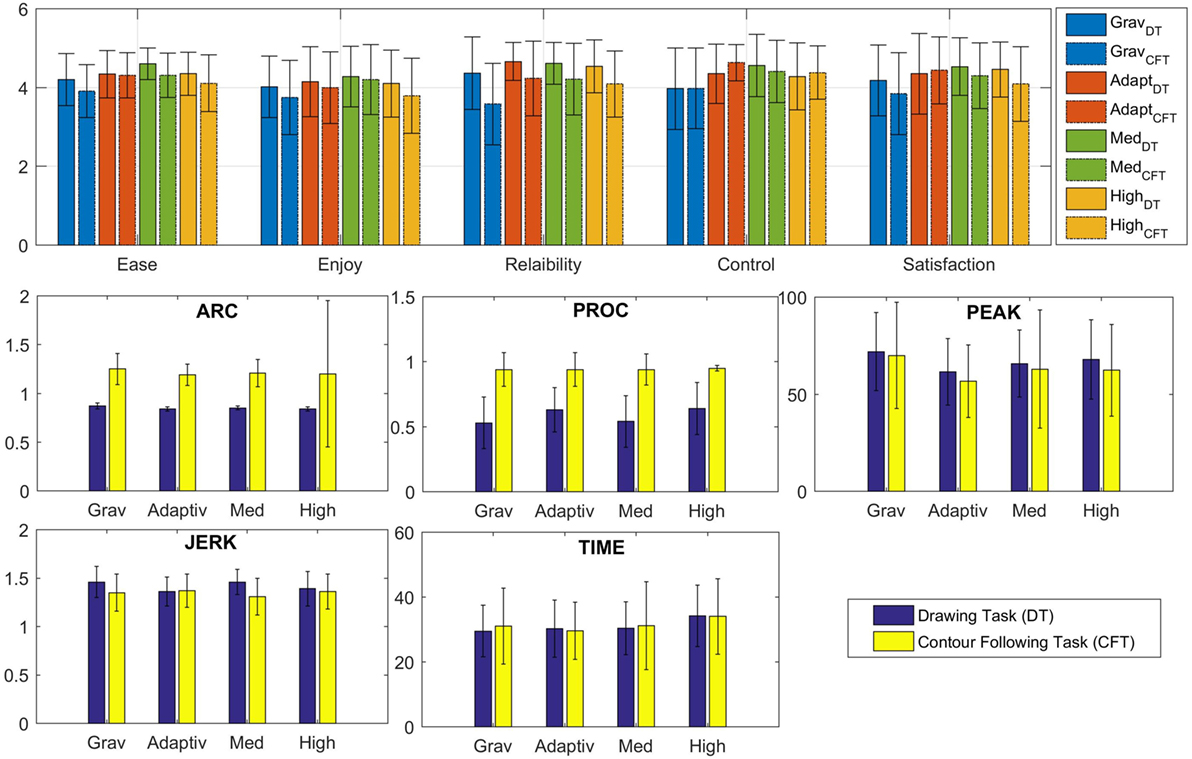
Figure 5. Error graphs showing means and SDs of each criteria for the four control modes for contour-following task (C.F.T.) and drawing task (D.T.). The top figure shows the results of the qualitative analysis, and the bottom figures shows the results of the quantitative analysis.
For procrustes, there is a significant difference between Adaptive Stiffness and Medium Stiffness (p = 0.040) as well as between Adaptive Stiffness and Gravity Compensation (p = 0.009). High Stiffness and Adaptive Stiffness do not differ significantly (p = 1.000), even though the value for High Stiffness is slightly better than that of Adaptive Stiffness. This indicates similar performance using Adaptive Stiffness or High Stiffness modes, both showing better performance than the other modes.
For the number of peaks, there is a significant difference between Adaptive Stiffness and High Stiffness (p = 0.007), Adaptive Stiffness and Medium Stiffness (p = 0.008), and Adaptive Stiffness and Gravity Compensation (p < 0.001). The mean number of peaks for Adaptive Stiffness is lower than other three control modes. This confirms superior performance of Adaptive Stiffness mode compared with the other three modes.
For jerk cost, there is a significant difference between the performance of Adaptive Stiffness and Medium Stiffness (p = 0.008). The data hint at a difference between Adaptive Stiffness and Gravity Compensation (p = 0.131). The performance of High Stiffness and Adaptive Stiffness does not differ significantly (p = 1.000), even though the mean jerk for Adaptive Stiffness is better than that of High Stiffness.
For arc length, Gravity Compensation differs significantly from all other controllers (p < 0.001). Adaptive Stiffness is similar to Medium (p = 0.410) and High Stiffness (p = 1.000).
4.3.2. Qualitative Analysis
Repeated measures ANOVA showed significant differences between the controllers for all criteria of interaction quality. For ease of use, Adaptive Stiffness differs significantly from Gravity Compensation (p < 0.001) and marginally significant from High Stiffness (p = 0.086). Adaptive Stiffness and Medium Stiffness do not differ significantly. Adaptive Stiffness and Medium Stiffness have therefore the best mean ratings for ease of use.
For enjoyment, Gravity Compensation differs marginally significant from Medium Stiffness (p = 0.082), with a lower mean value for Gravity Compensation. The other controllers do not differ significantly from each other.
For reliability, Gravity Compensation differs significantly from Adaptive Stiffness (p = 0.005), High (p = 0.014), and Medium Stiffness (p = 0.009). The results for control are similar: Gravity Compensation differs significantly from Adaptive Stiffness (p = 0.001), High (p = 0.011), and Medium Stiffness (p = 0.012). For both, Gravity Compensation has the lowest mean rating, while Adaptive Stiffness and the other controllers do not differ.
For user satisfaction, Adaptive Stiffness differs significantly from Gravity Compensation (p = 0.001) and High Stiffness (p = 0.017). Gravity Compensation differs significantly from Medium Stiffness (p = 0.021). The means show that Adaptive Stiffness and Medium Stiffness have the best mean ratings, followed by High Stiffness and Gravity Compensation.
4.4. Contour-Following Task
4.4.1. Quantitative Analysis
Repeated measures ANOVA showed significant differences between the controllers for two of the four analyzed performance criteria (time and number of peaks). For time, Adaptive Stiffness is significantly different from High Stiffness (p = 0.003). Although not significantly, the mean time for Adaptive Stiffness is lower than all other modes. The results show that with the Adaptive Stiffness mode the users are slightly faster.
For number of peaks, there is a significant difference between the performance of Adaptive Stiffness and Gravity Compensation (p < 0.001). Adaptive Stiffness and High Stiffness (p = 0.07), and Adaptive Stiffness and Medium Stiffness (p = 0.087) are also different. The mean number of peaks for Adaptive Stiffness is lower than other three control modes.
Even though there are no significant differences for procrustes and jerk cost, there are some points worth mentioning: For procrustes, the mean accuracy of High Stiffness is better than other modes. The results are interesting since in a simple task the performance in accuracy is not much different. In fact, as expected, High Stiffness is slightly better. This is another hint into needs of task dependent control modes since the results of procrustes in the drawing task data show a vast difference. For jerk cost, there is a difference between the performance of the controllers, the Medium Stiffness being slightly better than the other modes.
4.4.2. Qualitative Analysis
Repeated measures ANOVA showed significant differences between the controllers for all criteria of interaction quality. For ease of use, Adaptive Stiffness is similar to Gravity Compensation and High Stiffness. Medium Stiffness differs significantly from High Stiffness (p = 0.004), Adaptive Stiffness (p = 0.025), and Gravity Compensation (p = 0.001). Here, Medium Stiffness clearly excels over the other controllers. Analysis of the dataset perceived enjoyment shows significant difference between the controllers. Medium stiffness is slightly better than Gravity Compensation and High Stiffness.
For the dataset reliability, there is a significant difference between the controllers. Medium Stiffness is slightly better than High Stiffness and Gravity Compensation. The dataset external control showed a significant difference between the controllers. Medium Stiffness differs significantly from Gravity Compensation, and High Stiffness is slightly better than Adaptive Stiffness.
For user satisfaction, Adaptive Stiffness differs significantly from Gravity Compensation (p = 0.001) and High Stiffness (p = 0.017). Gravity Compensation differs significantly from Medium Stiffness (p = 0.021). Here, High and Medium Stiffness have the best ratings, closely followed by Adaptive Stiffness and with the lowest mean ratings for Gravity Compensation.
4.5. Statistical Comparison of Results
We conducted factorial repeated measures ANOVAs to find differences between the tasks, the controllers and their interaction. For this analysis factors, namely, task (contour-following/drawing) and controller (Gravity Compensation/Adaptive Stiffness/Medium Stiffness/High Stiffness) and their interaction term are included as independent variables. A statistical interaction occurs when the effect of one independent variable on the dependent variable changes depending on the level of another independent variable. A main effect is the effect of one of the independent variables on the dependent variable, ignoring the effects of all other independent variables.
The results of the analysis show if the criteria of performance and interaction quality differ significantly in these cases, (a) between the tasks, when the controllers are not considered, (b) between the controllers, when the tasks are not considered, and (c) between the controllers, dependent on the task that is fulfilled. Here, (a) displays the difference in difficulty between the tasks, (b) confirms the results from section 4.3 and 4.4, and (c) shows whether the controllers might be able to compensate for effects of task difficulty. The full ANOVA test statistics and the differences of the means (MDiff = Mcontour − Mdrawing) are displayed in Table 3.
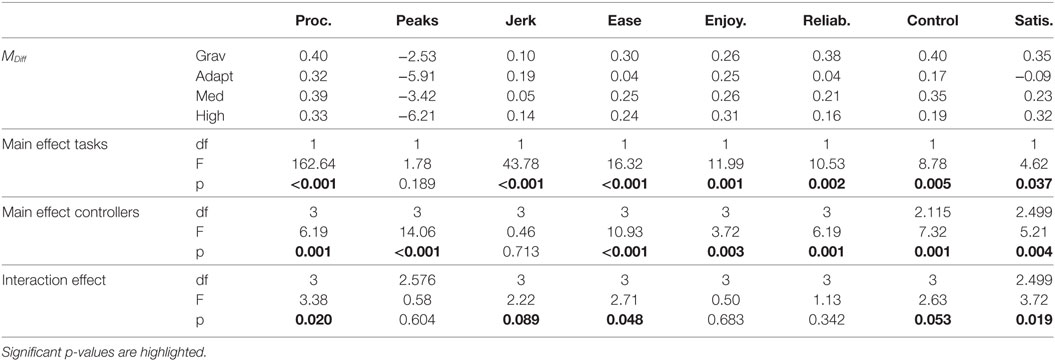
Table 3. Differences of means between the tasks for each control mode.
We did not run this analysis for the criterion time of completion, because the time of completion is highly task specific and its analysis will not give any information about differences in performance caused by task difficulty.
4.5.1. Analysis of Quantitative Performance
The results for data of procrustes analysis show significant main effects for tasks (Mcontour = 0.94; Mdrawing = 0.58) and for controllers. In addition, there is a significant interaction effect. Here, the difference between the tasks is smaller when the Adaptive Stiffness or High Stiffness controllers are used, compared with Gravity Compensation and Medium Stiffness. For number of peaks, there is only a significant main effect for controllers, but neither a main effect for task nor an interaction effect. For jerk cost, there is a main effect for task (Mcontour = 1.35; Mdrawing = 1.23), but no main effect for controllers. There is a marginally significant interaction effect. The difference between the tasks is the smallest with Medium Stiffness and the largest with Adaptive Stiffness.
4.5.2. Analysis of Qualitative Performance
For ease of use, there is a significant main effect for task (Mcontour = 4.38; Mdrawing = 4.16) and for controllers. The interaction effect is significant as well. The difference between the tasks is smaller when the Adaptive Stiffness controller is used, compared with the other controllers. For enjoyment and reliability, there is a main effect for task (enjoyment: Mcontour = 4.14; Mdrawing = 3.89; reliability: Mcontour = 4.29; Mdrawing = 4.03) and for controllers, but there is no significant interaction effect. For control, there is a main effect for task (Mcontour = 4.55; Mdrawing = 4.35) and for controllers. There is a marginally significant interaction effect. The difference between the tasks is the smallest when the Adaptive Stiffness controller is used, compared with the other controllers. For user satisfaction, there is a main effect (Mcontour = 4.38; Mdrawing = 4.17) for task and for controllers as well as a significant interaction effect. The difference between the tasks is smaller and opposed when the Adaptive Stiffness is used, compared with the other controllers.
5. Task Specificity
To learn about the effects of task parameters on the task execution and the individual interaction, the forces that users exerted on the end effector are analyzed in this section. In addition to the forces, the manipulability and human specific parameters like arm lengths are analyzed for the drawing task. For the latter part, four distinct users are selected with different body proportions, and their data are analyzed for observing the effects of user-specific parameters on task execution. The Figure 6 shows the human model used for the analysis. For this particular task, human arm is modeled as a 3 DOF articulate arm with two links. The human interaction model can be defined as shown in Figure 6, here h is the height of the user’s shoulder, d is the distance to the task l1 and l2 are the arm parameters. This simplified human arm model is used for further analysis.
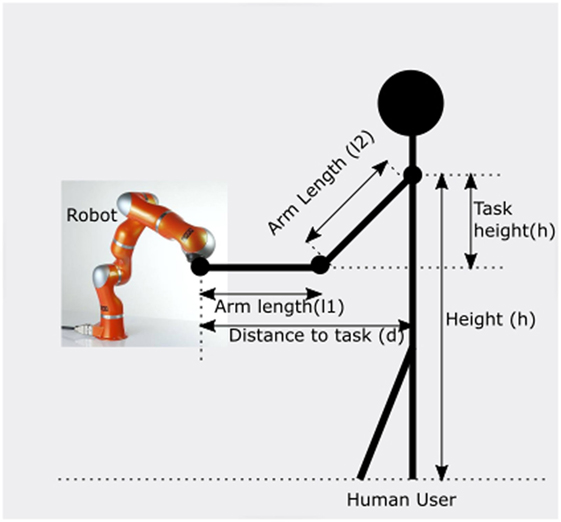
Figure 6. The interaction model of the user while interacting with the robot for task execution, the parameters height of the user, distance to the task, and arm lengths are used for later analysis.
The distance to the task is known from the experiment setup, the other human parameters were measured manually. Table 4 shows the arm parameters of the selected users, the user1 was the shortest, the user4 was the tallest, user2 and user3 had medium body proportions.
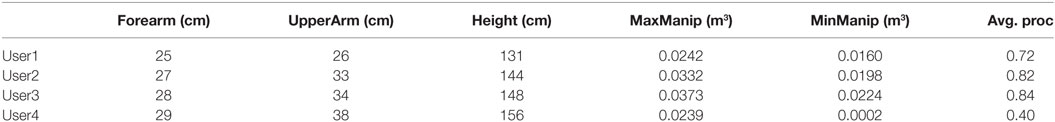
Table 4. Variation of the arm parameters of four selected users, the predicted manipulability and task accuracy.
5.1. Force Analysis
The forces of one of the study participants while performing the drawing task are shown in Figure 7. The green sections in the plot correspond to the region of increasing force, and the red sections of the plots correspond to the decreasing interaction force. A clear pattern is visible: each peak in the force plot corresponds to a particular section in the task. This strongly points at the correlation between task characteristics and variation of the user interaction forces. Further inspection of the data showed that the observed pattern is apparent for each user who performed the drawing task.
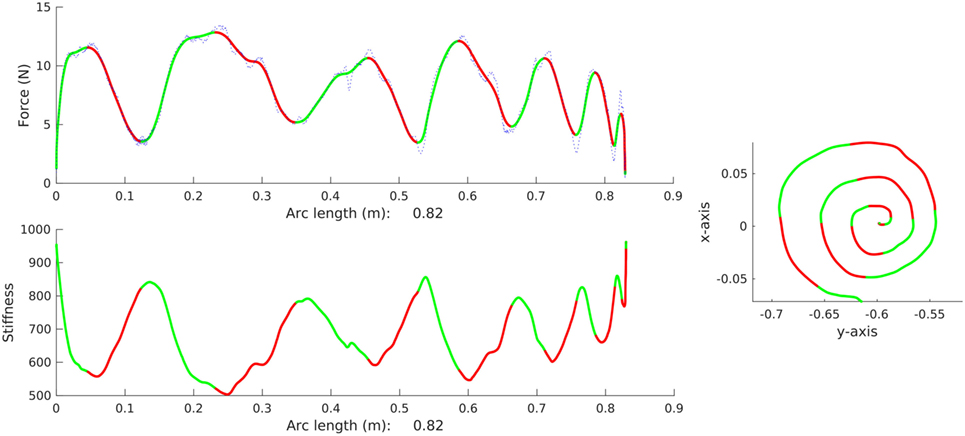
Figure 7. The plot shows one of the participants performing the drawing task. The tracked path, the force variation along the task, and the stiffness variation along the task trajectory are shown in the plot.
5.2. Manipulability
The concept of manipulability was proposed by Yoshikawa (1985) as a quantitative measure of the ability in positioning and orienting of robotic arms. It is useful for conducting a task space analysis of robotic manipulators in terms of their ability to generate the velocity, acceleration, and the exerted forces (Chiacchio, 2000). This information can be used to determine the best configuration for task execution and also for designing experimental setups, which are suited for certain tasks (Vahrenkamp et al., 2012). Petrič et al. (2016) studied the manipulability related to human arm and proposed a method that allows the user to perform tasks in arms configurations which are otherwise unsuitable due to lack of manipulability.
The manipulability is given by the following equation:
where Jt is the translational Jacobian.
Based on the discussed human model, the variation of manipulability for the drawing task for each human parameter is calculated. Figure 8 shows the variation of manipulability when each parameter changes. The maximum and minimum manipulability for the task is calculated for each parameter variation and is plotted. It is noticeable that the manipulability increases initially as the parameters vary and suddenly drops after a particular threshold. This points out to a possible singularity and hints at the fact that for a particular task there exists a single configuration of human model that gives optimal performance, or more realistically: for each user, there exists a particular task configuration where the manipulability is maximized.
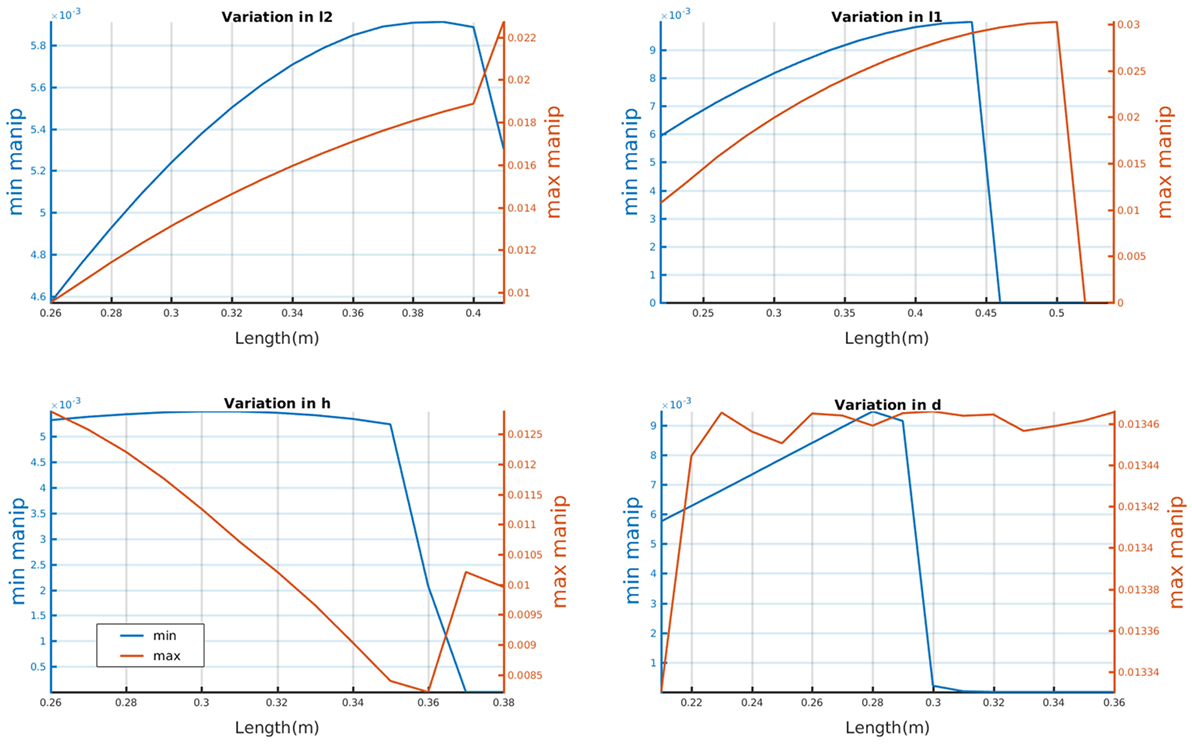
Figure 8. Variation of the manipulability for the considered task when the parameters of the simplified human model are varied, the parameters are varied one at a time keeping others constant. The maximum and minimum manipulability are shown in the right and the left vertical axis.
The manipulability variation for the different users while performing the drawing task was calculated. Figure 9 shows the results from the analysis of the considered users, it is noticeable that there is a clear pattern in the manipulability variation for user1, user2, and user3. For these users, the pattern of manipulability variation along the task is similar and is a clear repetition, while for user4 the manipulability variation is different from other users. Another noticeable result is the value of the manipulability and its relation to task accuracy. From Table 4, it can be seen that the accuracy of the task that is represented as the mean procrustes of each user over four task repetition is strongly related to the manipulability. Thus, the human parameters, distance to task, and height to the task are important factors to be considered while designing tasks involving human–robot interaction. The scalar manipulability measure we explored here does not give the full picture as our aim was to introduce the useful concept of human-arm manipulability and discuss the importance of considering the human parameters. Hence, consideration of more extensive facets of manipulability like manipulability ellipsoids discussed in Rozo et al. (2017) will definitely improve the current existing systems as it will make it possible to develop control strategies, which can take into consideration the intricate task characteristics like directional changes that are otherwise hard to model.
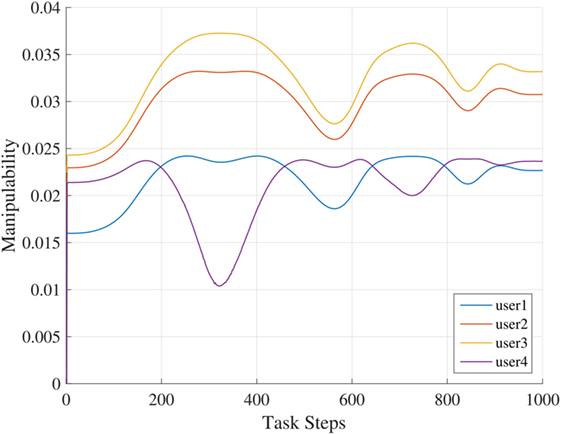
Figure 9. Manipulability variation within selected users while performing the drawing task.
5.3. Transmission Ratio
The concept of velocity and force transmission ratio is mentioned in Faroni et al. (2016), where the maximization of manipulability in a certain direction was discussed.
For an n-DOF manipulator and m-dimensional task space, Cartesian velocity is given by the following equation:
where is the task velocity, is the joint velocity vector, and J is m × n Jacobian matrix. The force transmission ratio α and velocity transmission ratio β can be represented as follows:
These quantities can be used to maximize the manipulability of a robot along a desired direction (Faroni et al., 2016). Thus, by analyzing these ratios, we can observe the change in direction of the task and its effect in interaction forces. A higher force transmission ratio results in larger forces applied and lower error transmission rate. The same effect will result from low velocity transmission ratio due to Kineto-static duality. Knowing this information beforehand will facilitate designing of kinesthetic teaching and other interaction modes keeping in mind the workspace of human and configurations, which permits maximum precision. This will also sets benchmarks for training users in industry to accomplish interaction tasks efficiently.
Using the simplified human arm model discussed earlier, the transmission ratio for the human arm while executing the task is calculated. Figure 10 shows the correlation between the force transmission ratio and the interaction forces for the four users while performing the same task using the same control modes under same condition. It is clearly noticeable that the transmission factor and the interaction forces are strongly correlated.
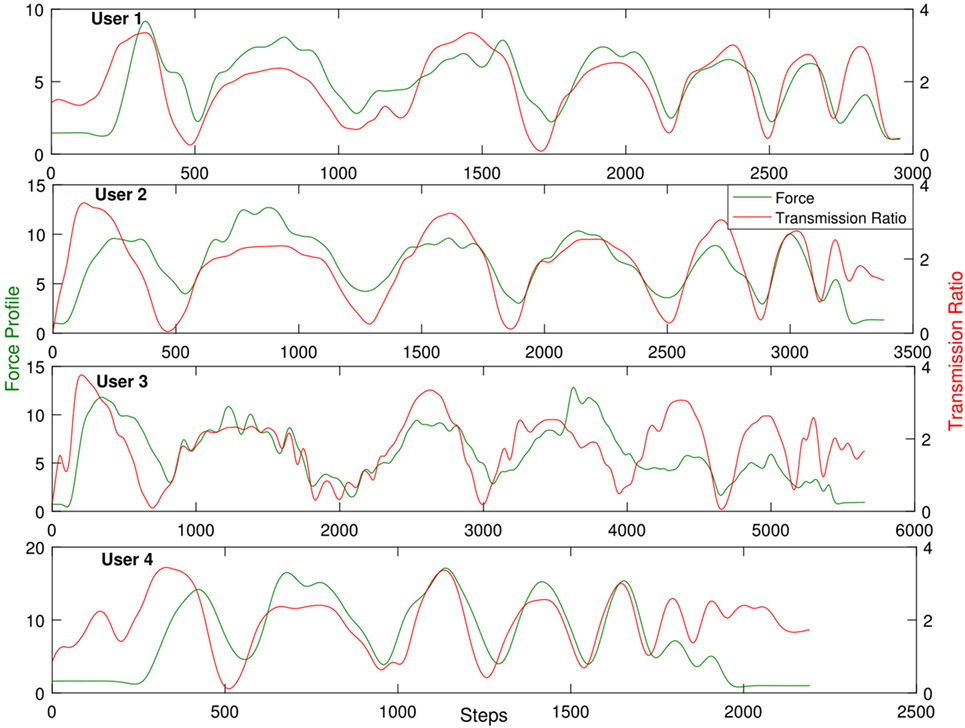
Figure 10. Graph showing predicted transmission ratio along the trajectory and its correlation with user’s interaction forces.
6. Discussion
From the results discussed in the previous Section 4.3.2 and by comparing the mean values from Figure 5, clearly the users complete the drawing task faster with the (assisted) Gravity Compensation mode, the down side being bad performance in terms of both quantitative performance and interaction quality. Meanwhile, the High Stiffness mode is accurate but slower and the interaction quality is bad. These results verify the hypotheses H1 and H2 mentioned in Section 4.2. The Personalized Adaptive Stiffness mode has no significant difference in time of completion when compared with Gravity Compensation mode and at the same time the smoothness of Adaptive Stiffness mode is even superior to High Stiffness, having lower number of peaks. The procrustes in the task completion shows no significant difference between Adaptive Stiffness and High Stiffness. These both results together verify the hypothesis H4.
Looking at the criteria for interaction quality, see 4.3.1, the Adaptive Stiffness control is clearly preferred over the Gravity Compensation mode concerning ease of use, reliability, control, and overall user satisfaction. While compared with the High Stiffness mode, the Adaptive Stiffness mode is preferred in terms of ease of use, experience of control, and overall user satisfaction.
Figure 11 shows that the Adaptive Stiffness mode ranks high in every comparison criterion we have used for the drawing task. It has a net rating of 9/10, where it got 9 top ranks in 10 compared criteria. Medium Stiffness with 6/10 is the second best mode, and Gravity Compensation comes last, although commonly used in practice. Hence, the online adaptation of stiffness that is personalized for each user receives the best outcome in terms of interaction quality and performance, although our adaptation scheme is rather simple and directly proportional to the measured force. Given that the level of accuracy of maximum stiffness is almost reached, we hypothesize that a more advanced adaption scheme may not achieve much better performance. However, it could possibly reduce effort for the user and could be investigated in future research.
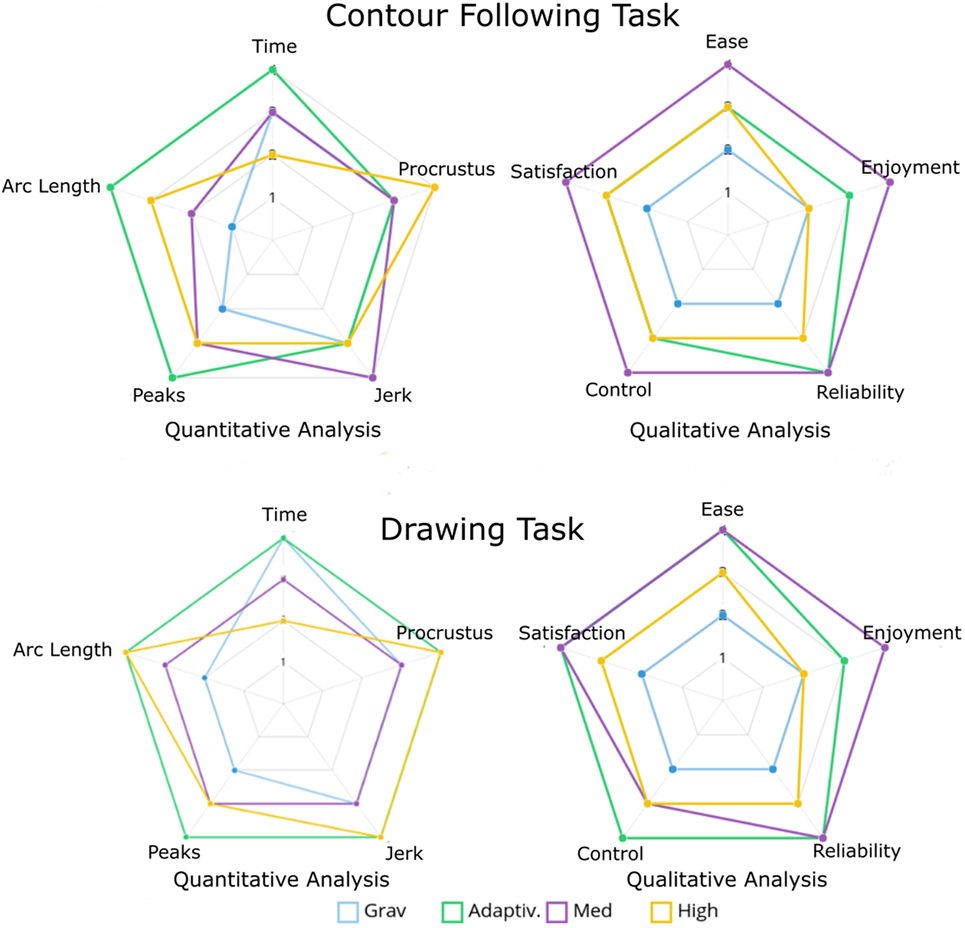
Figure 11. Radar charts showing the ranking of the control modes for each performance criterion for both tasks depending on their statistical significance.
Interestingly, the analysis of the contour-following task in Section 4.3.1 and Section 4.3.2 shows that the users prefer the Medium Stiffness mode for completing the contour-following task. It has high user ratings in all the interaction quality criteria. The accuracy of all the modes is similar for this task, and time of completion for Medium Stiffness and Gravity Compensation is not significantly different, see Figure 5.
From Figure 11, we can see that the Medium Stiffness mode has the best ranks in criteria of interaction quality, it has an overall rank of 6/10. We can conclude that the more complex the task, the higher the need of adaptation of the robot parameters. It is clear that for the simple task a medium stiffness mode is sufficient and will result in good interaction quality. This strong difference in the results between the two tasks indicates that task specificity is highly relevant when designing interaction strategies for pHRI.
The results from Section 4.5 show that the Adaptive Stiffness controller is in most cases able to (at least some degree) compensate for the differences of performance and interaction quality between tasks of different difficulty. The results are clearer for the criteria of interaction quality than for the performance criteria. Hence, the Personalized Adaptive Stiffness mode is still performing better. The performance could be augmented by combining both these factors, i.e., having personalization and inclusion of task specific parameters.
The variation of interaction forces of one participant while performing the drawing task is shown in Figure 7, by visual inspection it is clear that the pattern observed extends to each user who performed the drawing task and this pattern is task dependent. This variation of force is a clear task specific parameter, and this information could be used constructively to improve the user interaction by incorporating this information while designing the task. By observing the results discussed in Section 5.3, we can infer that this correlation is not only a result of the task specificity but also the user kinematics. The manipulability measure discussed in Section 5.2 and the transmission ratio results discussed in 5.3 clearly point out the effects of task dependency and in addition to this strongly points out the fact that estimation and inclusion of human specific parameters are also important for better task design. By including these parameters, the systems can be designed in such a way that the users never run into singularities of their arm configurations and at the same time the task could be pre-optimized from an ergonomic perspective.
In addition, from the presented results, we can hypothesize that by using the kinematics of the human arm and in turn calculating its manipulability over a given task it is possible to quantify and predict the performance of a user for a given task and task configuration. Hence, considering the human manipulability will help improving the pHRI further, since it is possible to adapt the task configuration or the robot parameters to compensate for the changes in human manipulability. Hence, if we try to optimize the human manipulability online, this will lead to an adaptation scheme that will maximize the user performance and user comfort. Such an adaptation can be used in parallel with a personalized adaptation mode, which adapts not only to the varying user forces. This combination can be used quite conveniently by the users to overcome difficulties arising from task configuration and physical constraint, since it adapts to both task and physical characteristics.
7. Conclusion
The analysis of the data collected from 49 users from the user study clearly supports the hypothesis that Personalized Adaptive control takes pHRI to the next level, if the task is sufficiently complex. Although the personalization scheme tested here is relatively simple and calibrated only for the force limits of the users, the experiments clearly show that the Personalized Adaptive control was suited for collaborative task execution and will result in good performance. In addition, a medium stiffness mode will give satisfactory results for a simple task and complex adaptations may not guarantee better results in such scenarios. The inferences drawn from the second experiment along with the inference drawn form the analysis of task specificity support that consideration of more human factors could not only further improve the system as a whole but also enhance the user’s experience and satisfaction.
Further results show that deploying a human model coupled with task parameters may result in efficient physical human–robot interaction. The human manipulability that we discussed combines both the task characteristics and human kinematics in a meaningful way and gives us a relative performance measure, which can be used for improving the HRI. While we acknowledge that these results need further investigations, the observed strong correlations suggest promising research ideas for our future works. In particular, we would like to perform more comprehensive user studies with both expert and inexperienced users. Furthermore, the idea of incorporating these results in industrial HRI scenarios where humans’ ease and comfort is used to reconfigure the task and robot configuration will be investigated.
Ethics Statement
This study was carried out in accordance with the recommendations of “Ethics Committee, Bielefeld University”. All subjects gave oral informed consent in accordance with the Declaration of Helsinki. The protocol was approved by the “Ethics Committee, Bielefeld University.” The title of the permitted study is “Human–Robot Interaction User Study.”
Author Contributions
SG contributed to programming of the robot and the experiment setup, conducting the user study, and analysis of the data. SÖ contributed to the study design involving human users and analysis of the data. JS contributed to the experiment design, development of the conceptual idea, data analysis and evaluation. All authors contributed to writing the paper.
Conflict of Interest Statement
The authors declare that the research was conducted in the absence of any commercial or financial relationships that could be construed as a potential conflict of interest.
The reviewer, LR, and handling Editor declared their shared affiliation.
Acknowledgments
This work is done as a part of “Human Centered Cyber-Physical Systems in Industry 4.0” project in NRW Fortschrittskolleg: Gestaltung von flexiblen Arbeitswelten—Menschenzentrierte Nutzung von Cyber-Physical Systems in Industrie 4.0.
References
Albu-Schäffer, A., Ott, C., and Hirzinger, G. (2007). A unified passivity-based control framework for position, torque and impedance control of flexible joint robots. Int. J. Robot. Res. 26, 23–39. doi:10.1177/0278364907073776
Balasubramanian, S., Melendez-Calderon, A., Roby-Brami, A., and Burdet, E. (2015). On the analysis of movement smoothness. J. Neuroeng. Rehabil. 12, 1. doi:10.1186/s12984-015-0090-9
Bischoff, R., Kurth, J., Schreiber, G., Koeppe, R., Albu-Schäffer, A., Beyer, A., et al. (2010). “The KUKA-DLR lightweight robot arm-a new reference platform for robotics research and manufacturing,” in Robotics (ISR), 2010 41st International Symposium (Munich: VDE), 1–8.
Buchli, J., Theodorou, E., Stulp, F., and Schaal, S. (2011). “Variable impedance control a reinforcement learning approach,” in Robotics: Science and Systems VI, eds Y. Matsuoka, H. Durrant-Whyte, and J. Neira (Cambridge, MA: MIT Press), 153–160.
Burdet, E., Franklin, D. W., and Milner, T. E. (2013). Human Robotics: Neuromechanics and Motor Control (Cambridge, MA: MIT Press).
Chiacchio, P. (2000). A new dynamic manipulability ellipsoid for redundant manipulators. Robotica 18, 381–387. doi:10.1017/S0263574799002106
Davis, F. D. (1989). Perceived usefulness, perceived ease of use, and user acceptance of information technology. MIS Q. 13, 319–340. doi:10.2307/249008
Dimeas, F., and Aspragathos, N. (2014). “Fuzzy learning variable admittance control for human-robot cooperation,” in Intelligent Robots and Systems (IROS 2014), Chicago, IL, 4770–4775.
Emmerich, C., Nordmann, A., Swadzba, A., Steil, J. J., and Wrede, S. (2013). “Assisted gravity compensation to cope with the complexity of kinesthetic teaching on redundant robots,” in ICRA, 2013, Karlsruhe, Germany, 4322–4328.
Faroni, M., Beschi, M., Visioli, A., and Tosatti, L. M. (2016). “A global approach to manipulability optimisation for a dual-arm manipulator,” in Emerging Technologies and Factory Automation (ETFA) (Berlin: IEEE), 1–6.
Gopinathan, S., Ötting, S., and Steil, J. (2017). “A user study on personalized adaptive stiffness control modes for human-robot interaction,” in The 26th IEEE International Symposium on Robot and Human Interactive Communication (Lisbon: RO-MAN), 831–837.
Grupen, R. A., and Huber, M. (2005). A Framework for the Development of Robot Behavior. Technical Report, DTIC Document.
Hogan, N. (1984). Adaptive control of mechanical impedance by coactivation of antagonist muscles. IEEE Trans. Automat. Contr. 29, 681–690. doi:10.1109/TAC.1984.1103644
Khan, A. M., Yun, D.-W., Ali, M. A., Han, J., Shin, K., and Han, C. (2015). “Adaptive impedance control for upper limb assist exoskeleton,” in IEEE International Conference Robotics and Automation (ICRA) (Seattle, WA: IEEE), 4359–4366.
Lecours, A., Mayer-St-Onge, B., and Gosselin, C. (2012). “Variable admittance control of a four-degree-of-freedom intelligent assist device,” in IEEE International Conference Robotics and Automation (ICRA) (Saint Paul, MN: IEEE), 3903–3908.
Li, Y., Tee, K. P., Yan, R., Chan, W. L., Wu, Y., and Limbu, D. K. (2015). “Adaptive optimal control for coordination in physical human-robot interaction,” in IROS, 2015, Hamburg, Germany, 20–25.
Medina, J. R., Lawitzky, M., Mörtl, A., Lee, D., and Hirche, S. (2011). “An experience-driven robotic assistant acquiring human knowledge to improve haptic cooperation,” in International Conference on Intelligent Robots and Systems (IROS), San Francisco, CA, 2416–2422.
Montes, V. R., Quijano, Y., Quero, J. C., Ayala, D. V., and Moreno, J. P. (2014). “Comparison of 4 different smoothness metrics for the quantitative assessment of movement’s quality in the upper limb of subjects with cerebral palsy,” in Health Care Exchanges (PAHCE), 2014 Pan American, Brasilia, Brazil, 1–6.
Nordmann, A., Rolf, M., and Wrede, S. (2012). “Software abstractions for simulation and control of a continuum robot,” in SIMPAR, 2012, Tsukuba, Japan, 113–124.
Nordmann, A., and Wrede, S. (2012). A domain-specific language for rich motor skill architectures,” in 3rd International Workshop on Domain Specific Languages and Models for Robotic Systems (DSLRob), Tsukuba, Japan, 2012.
Olsen, D. R., and Goodrich, M. A. (2012). “Metrics for evaluating human-robot interactions,” in Proceedings of PERMIS Vol. 2003, Gaithersburg, MD, 4.
Petrič, T., Goljat, R., and Babič, J. (2016). “Augmentation of human arm motor control by isotropic force manipulability,” in IEEE/RSJ International Conference on Intelligent Robots and Systems (IROS), Daejeon, South Korea, 696–701.
Ranatunga, I., Cremer, S., Popa, D. O., and Lewis, F. L. (2015). “Intent aware adaptive admittance control for physical human-robot interaction,” in IEEE International Conference Robotics and Automation (ICRA), Seattle, WA, 5635–5640.
Ross, A. (2004). Procrustes Analysis. Course Report. Department of Computer Science and Engineering, University of South Carolina.
Rozo, L., Bruno, D., Calinon, S., and Caldwell, D. G. (2015). “Learning optimal controllers in human-robot cooperative transportation tasks with position and force constraints,” in IEEE/RSJ International Conference on Intelligent Robots and Systems (IROS) (Hamburg: IEEE), 1024–1030.
Rozo, L., Jaquier, N., Calinon, S., and Caldwell, D. G. (2017). “Learning manipulability ellipsoids for task compatibility in robot manipulation,” in Proc. IEEE/RSJ Intl Conf. on Intelligent Robots and Systems (IROS) (Vancouver, Canada).
Shadmehr, R., and Wise, S. P. (2005). The Computational Neurobiology of Reaching and Pointing: A Foundation for Motor Learning. Cambridge, MA: MIT Press.
Steil, J. J., Emmerich, C., Swadzba, A., Grünberg, R., Nordmann, A., and Wrede, S. (2014). “Kinesthetic teaching using assisted gravity compensation for model-free trajectory generation in confined spaces,” in Gearing Up and Accelerating Cross-fertilization between Academic and Industrial Robotics Research in Europe, Vol. 94, eds F. Röhrbein, G. Veiga, and C. Natale (Cham: Springer Tracts in Advanced Robotics), 107–127.
Townsend, W. (2000). The BarrettHand grasper—programmably flexible part handling and assembly. Indus. Robot. Int. J. 27, 181–188. doi:10.1108/01439910010371597
Vahrenkamp, N., Asfour, T., Metta, G., Sandini, G., and Dillmann, R. (2012). “Manipulability analysis,” in Humanoid Robots (Humanoids), 2012 12th IEEE-RAS International Conference (Osaka), 568–573.
Venkatesh, V. (2000). Determinants of perceived ease of use: integrating control, intrinsic motivation, and emotion into the technology acceptance model. Inform. Syst. Res. 11, 342–365. doi:10.1287/isre.11.4.342.11872
Venkatesh, V., and Bala, H. (2008). Technology acceptance model 3 and a research agenda on interventions. Decis. Sci. 39, 273–315. doi:10.1111/j.1540-5915.2008.00192.x
Venkatesh, V., Morris, M. G., Davis, G. B., and Davis, F. D. (2003). User acceptance of information technology: toward a unified view. MIS Q. 27, 425–478.
Wixom, B. H., and Todd, P. A. (2005). A theoretical integration of user satisfaction and technology acceptance. Inform. Syst. Res. 16, 85–102. doi:10.1287/isre.1050.0042
Wrede, S., Emmerich, C., Grünberg, R., Nordmann, A., Swadzba, A., and Steil, J. (2013). A user study on kinesthetic teaching of redundant robots in task and configuration space. J. Hum. Robot. Interact. 2, 56–81. doi:10.5898/JHRI.2.1.Wrede
Keywords: assistance systems, personalized controllers, adaptive stiffness mode, physical human–robot interaction (pHRI), manipulability in HRI
Citation: Gopinathan S, Ötting SK and Steil JJ (2017) A User Study on Personalized Stiffness Control and Task Specificity in Physical Human–Robot Interaction. Front. Robot. AI 4:58. doi: 10.3389/frobt.2017.00058
Received: 30 June 2017; Accepted: 24 October 2017;
Published: 24 November 2017
Edited by:
Luka Peternel, Fondazione Istituto Italiano di Tecnologia, ItalyReviewed by:
Tadej Petric, Jožef Stefan Institute, SloveniaLeonel Rozo, Fondazione Istituto Italiano di Tecnologia, Italy
Copyright: © 2017 Gopinathan, Ötting and Steil. This is an open-access article distributed under the terms of the Creative Commons Attribution License (CC BY). The use, distribution or reproduction in other forums is permitted, provided the original author(s) or licensor are credited and that the original publication in this journal is cited, in accordance with accepted academic practice. No use, distribution or reproduction is permitted which does not comply with these terms.
*Correspondence: Sugeeth Gopinathan, c2dvcGluYXRoYW5AdGVjaGZhay51bmktYmllbGVmZWxkLmRl