 Fan Ye
 Arsen Abdulali
 Fumiya Iida
- Bio-Inspired Robotics Lab, Department of Engineering, University of Cambridge, Cambridge, United Kingdom
Collective behavior observed in nature has been actively employed in swarm robotics. In order to better respond to external cues, the agents in such systems organize themselves in an ordered structure based on simple local rules. The central assumption, in swarm robotics, is that all agents in the system collaborate to fulfill a common goal. In nature, however, many multi-agent systems exhibit a more complex collective behavior involving a certain level of competition. One representative example of complex collective behavior is a multi-ball Bernoulli-ball system. In this paper, by extracting local force among the Bernoulli balls, we approximated the state-transfer model mapping interaction forces to observed behaviors. The results show that the collective Bernoulli-ball system spent 41% of its time on competitive behaviors, in which up to 84% of the interaction state is unorganized. The rest 59% of the time is spent on collaborative behavior. We believe that the novel proposed model opens new avenues in swarm robotics research.
1 Introduction
In the animal kingdom, collective behaviors arise from the local exchange of information between individuals (Couzin, 2009; Ramdya et al., 2015). This circumvents the cognitive limitation of individuals and helps a group of animals like a flock of birds, a school of fish, and a society of ants to respond to environmental cues (Schaerf et al., 2017), and align in an ordered and complex structure (Hooker, 2011). This ability to form a complex shape through a local information exchange is considered to be a primary source of inspiration in robotics self-organization research (Willshaw, 2006; O’Sullivan, 2009; Camazine et al., 2020).
With the growing demand for robot functionalities, scientists strive to develop a large group of robots that cooperate to accomplish complicated tasks (Dorigo et al., 2021). Inspired by self-organization in nature, swarm robots are designed to exhibit robust, scalable, and flexible behaviors through local interactions (Brambilla et al., 2013). Scientists first try to simulate the local information exchange of a flock of birds (Reynolds, 1987; Vicsek et al., 1995), and mathematically proved the emergence of the self-organization process in this system (Jadbabaie et al., 2003). Then, a variety of swarm robots are designed to imitate social animals, e.g., collective bristle robots (Giomi et al., 2013), ant-like cooperating robots (Krieger et al., 2000), particle swarm robots (Li et al., 2019), and collective drones (Vasarhelyi et al., 2018). Some of them interact through physical contact, and others have additional information exchange with a decision-making algorithm to enable them to do locomotion and detection (Olfati-Saber, 2006; Ebert et al., 2020). Without a central leader to send commands to individuals, the interaction rules govern the swarm robots and limit their functionalities.
To enhance their functionalities, a more intelligent interaction rule should be applied to swarm robots. Usually, scientists in swarm robotics focus on the development of the interaction rules between robots. For example, ant-like swarm robots use radio communication to cooperatively search for objects and for navigation (Hoff et al., 2010). Bee-like swarm robots use a broadcast architecture to form the robot group and produce a specified distribution of pollination (Berman et al., 2011). Fish-like swarm robots communicate through lights to exhibit collective behaviors like synchrony, dispersion, dynamic circle formation, and search-capture (Berlinger et al., 2021). Morphologically communicated swarm robots deform their shape through physical interaction. These researches take the interactions between individuals as a method of communication (Rubenstein et al., 2014; Sharma et al., 2020). However, in nature, especially for birds (Lissaman and Shollenberger, 1970) and fish (Liao et al., 2003), the interactions in the swarm include information exchange and dynamic forces that grant them high coordination complexity. These methods, however, require an intelligent controller to help individual agents make simple decisions. To eliminate the uncertainty of the level of contribution of individuals’ intelligence, we propose to use a Bernoulli-ball system where interactions are governed solely by physical rules. Furthermore, we are interested in the emergence of collaboration and competition through the analysis of dynamic forces. As shown in Figure 1, in this system, a nozzle at the bottom emits vertical airflow, which allows the balls to float in the air (Nudehi et al., 2018; Howison et al., 2020a). When only one ball is put into the system, it gets vertically balanced by compensating the gravity force with the drag of the airflow (Taneda, 1956; Flemmer and Banks, 1986) and horizontally balanced by side forces pointing to the horizontal center governed by Bernoulli’s principle (Massey and Ward-Smith, 2018). When there are multiple balls in the same air stream, the interaction emerges among balloons by influencing the airflow surrounding them (Magarvey and Bishop, 1961; Lee, 1979; Ormières and Provansal, 1999; Tyagi et al., 2006). This interaction leads to competition, where one balloon pushes away the other one from the air stream, and collaboration, when one balloon influences the flow preventing the other one from the fall. Even though it is difficult to observe interaction forces in a physical Bernoulli ball system, they can be approximated in simulation as in our previous work (Ye et al., 2022). However, based on force observations, it is still not trivial to find the relation between force patterns and consequent collective behavior.
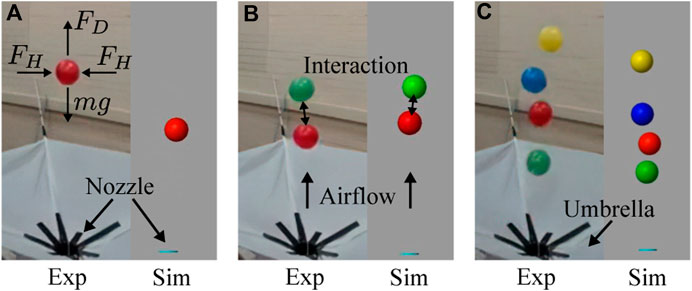
FIGURE 1. The collective Bernoulli-ball system with 1 (A), 2 (B), and 4 (C) balls in experiments and simulation. The vertical airflow comes out of the nozzle to provide drag forces (FD) and horizontal forces (FH) to the balls. Interactions emerge between multiple balls. The umbrella is used to collect falling balls and put them back into the airflow.
In this paper, by clustering interaction forces (interaction states) using Self-organizing Maps, we developed a state transition model that considers basic scenarios of the system, i.e., the win-win situation, the kick-out effect, and the lose-lose competition (see Figure 2). In a four-ball system, a win-win situation indicates that all four balls stay in the vertical airflow; a kick-out effect means that one of the four balls falls out of the flow; a lose-lose competition refers to a situation where more than one ball falls out of the flow. Since the perturbation from the outside environment is negligible, all the collective behaviors result from the interactions among these balls through airflow or mechanical contact. We classified different collective behaviors observed in the experiment and simulator and figured out several probable causes of typical behaviors. Finally, the interaction state transfers during typical behaviors were investigated in the form of Markov chains, which revealed that certain time series of interaction states probably lead to typical collective behaviors.
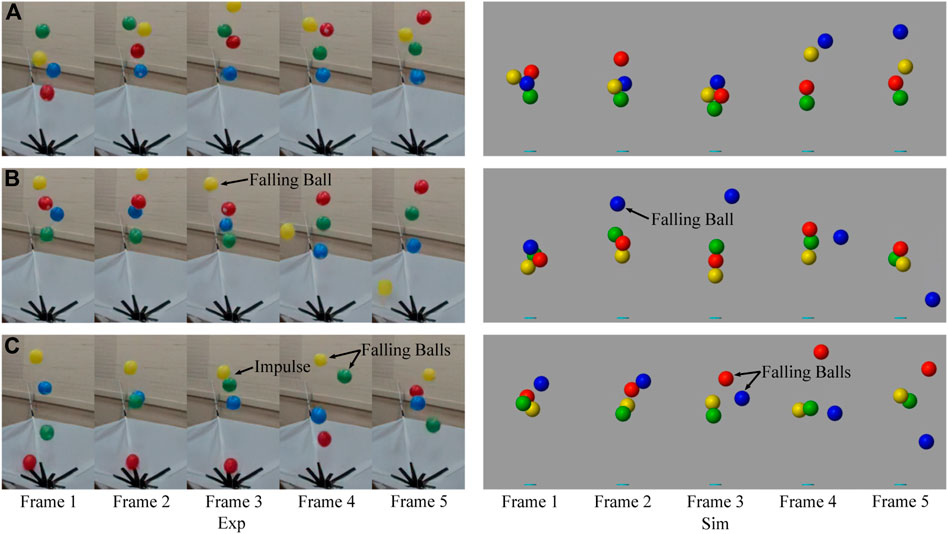
FIGURE 2. Frame arrays of several typical collective behaviors showing collaboration and competition in both experiment and simulation, like win-win situation (A), kick-out effect (B), and lose-lose situation (C). Especially, the lose-lose situation (C) in the experiment is caused by the impulse between the green ball and the yellow ball.
2 Materials and methods
2.1 Collective Bernoulli-ball simulator
The collective Bernoulli-ball simulator consists of three parts. The first part focus on the forces that the flow field applies to the balls. The upward airflow provides a drag force that counters the weight of the ball. Horizontally the airflow is fast at the center and slows down with the distance from it. According to Bernoulli’s principle, a low-pressure area develops in the center and produces horizontal forces attracting the balls to the center. The second part takes the flow turbulence into account. The turbulence results in uncertain forces in the collective Bernoulli-ball system and was modeled as a Gaussian random process. The third part considers the interactions among the Bernoulli-balls, including the mechanical contact forces and the interaction forces through the airflow, shown in Figure 3. We investigate the collective behavior of four balls in the collective Bernoulli-ball system, and the error of the simulator could be minimized to 2.00% in position trajectory compared to the real-world experiment. After 10 simulations with different random seeds, 90,000 frames of ball trajectories and the dataset interaction forces were collected. The simulator is implemented in the MATLAB SIMULINK environment. Example code, data and experiment video are available at https://github.com/Kyushudy/collective_bernoulli_ball_behavior_analysis.
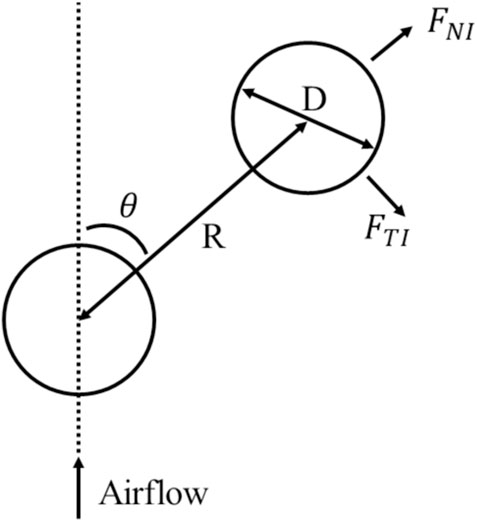
FIGURE 3. The interaction model of the collective Bernoulli-ball system in simulation. FNI is the normal interaction force, and FTI is the tangential interaction force between two balls. θ is the angle of attack of two balls, D is the diameter of the ball and R is the distance between two balls. The interaction forces depend on θ and R/D.
2.2 Force cluster
Since all four balls share the same characteristics like diameters and weights, it is important to distinguish these balls by a dynamic property except their colors. For example, the behavior of the red ball falling means the same as the green ball falling, the blue ball falling, etc. By introducing the interaction forces, we can tell the magnitude of pushing (positive normal interaction forces FNI) or pulling (negative normal interaction forces) forces between every two balls. If one ball pulls all the other balls, it tries to bond with others, so we manually define it as a strong ball. In contrast, if one ball is pushed by all other balls, it gets repulsed by others, so we define it as a weak ball. Therefore, the strength of a ball is defined as follows:
where Kbi is the strength of ball i, variable j indicates all other balls except ball i, and Fbij is the normal interaction force between ball i and j projected onto the line of their center of mass. For example, for ball 2, Kb2 is the summation of Fb21, Fb23, and Fb24. A smaller Kbi indicates that ball i is stronger. By ranking Kbi at every frame, we can sort the balls from the strongest ball to the weakest ball, labeled as the first (the strongest), second, third, and fourth (the weakest) ball. The sort of balls represents the dynamic property of every ball at every frame and may change as interaction forces change in different frames. After sorting, the strength of the ith ball is rewritten as follows:
where Ki is the strength of the ith ball, variable j indicates all other balls except ball i, and Fij is the normal interaction force between the ith and jth ball projected onto the line of their center of mass.
As we have the sorted interaction forces Fij at every frame, a self-organizing map (SOM) method is used to distinguish different frames based on their different combination of sorted interaction forces. After 200 iterations, the SOM clustered 90,000 frames into six states, and every state represents a typical combination of interaction forces, labeled from S1 to S6.
2.3 Behavior modality
The collective behaviors of the collective Bernoulli-ball system are generally classified into the win-win situation, the kick-out effect, and the lose-lose competition through the observation of the experiment and simulation. Through simulation, we found that these behaviors mainly result from two kinds of forces: the interaction forces between every two balls through airflow, and the impulse between two balls through mechanical contact. In this case, seven typical behaviors are defined as follows:
1. The win-win situation: All the four balls float in the airflow in dynamic stability and no one falls, labeled as B1.
2. The kick-out effect: One ball falls out of the airflow and all the other three balls are inside the airflow.
a. There is no obvious cause for this kick-out effect, labeled as B2.
b. The kick-out effect is caused by interaction forces: from 0.5 s before this behavior to the end of this behavior, there is at least one frame that the falling ball is pushed by all the other three balls, labeled as B3.
c. The kick-out effect is caused by impulses: from 0.5 s before this behavior to the end of this behavior, there is at least one frame that the falling ball has mechanical contact with any other balls, labeled as B4.
3. The lose-lose competition: More than one ball falls out of the airflow.
a. There is no obvious cause for this lose-lose competition, labeled as B5.
b. The lose-lose competition is caused by interaction forces: From 0.5 s before this behavior to the end of this behavior, there is at least one frame that at least one falling ball is pushed by all the other three balls, labeled as B6.
c. The lose-lose competition is caused by impulses: From 0.5 s before this behavior to the end of this behavior, there is at least one frame that at least one falling ball has mechanical contact with any other balls, labeled as B7.
3 Results
3.1 States of interaction forces
The SOM clustered six states of combination of interaction forces F12, … , F34, labeled from S1 to S6. As shown in Figure 4A, S1 consists almost all the outliers of F12, F13, F14, and F24, indicating that S1 is the outlier of all the states. S6 consists of all the interaction forces near 0, indicating that there are few interactions between balls in S6. Figure 4B zooms in and shows details of S2 to S5. S2 consists of a low region of F12 while other forces are relatively near 0, indicating that the first ball and the second ball strongly bond together in S2. S3 consists of all interaction forces smaller than those of S2, indicating that S3 is a weaker version of S2, and the bond between balls in S3 is not strong. S4 consists of similarly low F12, F13, and F14, while other forces are near 0, which means that the first ball tries to catch all the other balls in S4. S5 consists of high F34, indicating that the third ball tries to move away from the fourth ball.
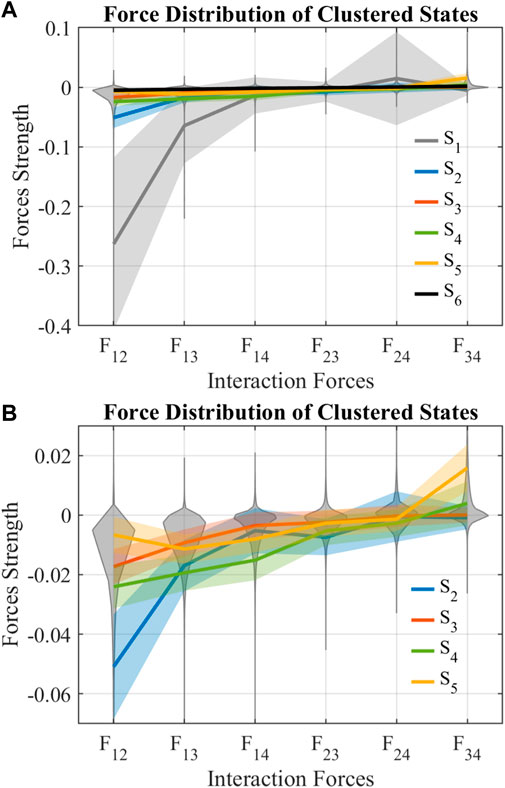
FIGURE 4. Force distribution of clustered states. The gray violin plot shows the distribution of interaction forces. The lines show the mean of interaction forces in respective states, and the shadings around the mean show its standard deviations.
The characteristics of states can be shown more clearly in a position-based plot. Although states were clustered through interaction forces, they show typical ball position distribution in Figure 5. Since the density of dots represents the number of occurrences of a state, we found that S1 rarely happens in the collective Bernoulli-ball system, while S6 happens most frequently. S2 and S4 happen in medium frequencies while S3 and S5 happen in relatively higher frequencies. In S1, balls are distributed in a vertical line. In S2 and S3, there are clear layer distributions of balls: the first, second, third, and fourth ball are distributed in a vertical sequence from the bottom to the top, and the balls in S3 distribute wider than those in S2. In S4, the first ball is at the bottom, the second and third ball share the middle region, and the fourth ball is above them. In S5, the first ball, the third ball, and the fourth ball share the bottom, while the second ball is at the top. In S6, all balls distribute widely in similar distribution. The first ball is not likely to fall in any state. The second ball is most likely to fall in S5 and S6. The third ball and the fourth ball mostly fall in S2, S3, and S6.
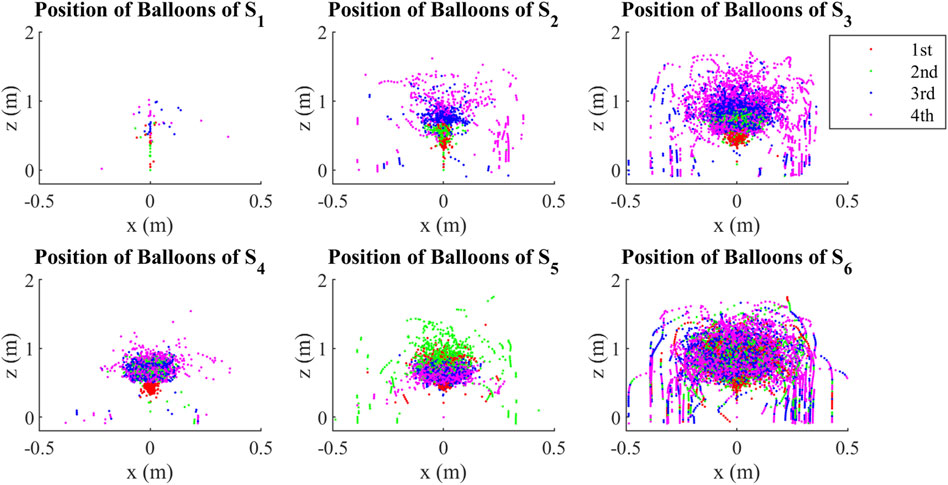
FIGURE 5. Position distribution of clustered states. Every dot shows the position of a ball at a frame. The density of dots shows the frequencies of clustered interaction states, and the distribution of dots in different colors shows the distribution of all the four balls from the strongest (first) to the weakest (fourth).
3.2 Typical behaviors
Although we classified seven behaviors of the collective Bernoulli-ball system, some of them are stochastic and unexceptional. Therefore, we selected four typical behaviors to discuss their ball trajectories, interaction forces, and state transfer. These typical behaviors are the kick-out effect through interaction forces B3, the kick-out effect through impulses B4, the lose-lose competition through interaction forces B6, and the lose-lose competition through impulses B7. Notice that in this section we used unsorted forces Fbij and label the red, green, blue, and yellow ball as the ball 1, 2, 3, 4, respectively. This helps us to correlate the ball trajectories with the interaction forces based on consistent ball labels.
3.2.1 The kick-out effect through interaction forces
Figure 6 shows a kick-out effect happening at t = 137.2 ∼ 138.4 s. During this period, the blue ball (ball 3) was kicked out of the airflow, while other balls were staying inside. There were frames at around t = 137.83 s showing that the interaction forces of ball 3 (Fb13, Fb23, Fb34) were all positive, indicating that ball 3 was rejected by other three balls by the interaction forces through the airflow. At t = 137.3 s, all four balls were stable in the airflow. At t = 137.5 s, the blue ball was kicked out of the airflow due to positive Fb13 and Fb23. The blue ball tried to go back to the center because of the centering force based on Bernoulli’s principle, but Fb13, Fb23, Fb34 were increasingly positive that resisted the return of the blue ball at t = 137.5 ∼ 138.1 s. Afterward, the blue ball was completely outside the airflow and falled to the ground.
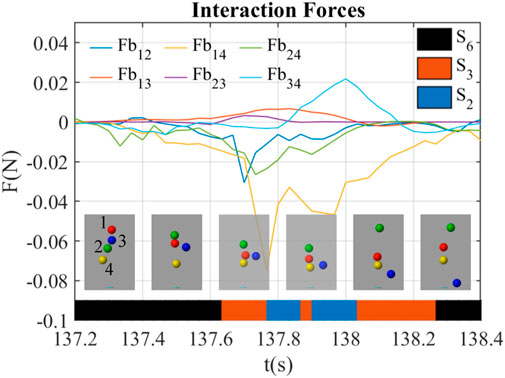
FIGURE 6. Interaction forces between balloons during kick-out behavior led by interaction forces (B3). The balls are labeled as red (1), green (2), blue (3), and yellow (4). The line chart shows the magnitude of interaction forces between balls. The frames show the exact positions of the balls at that time. The color bar shows the interaction states and their transfers in this period of time.
The interaction state shifted from S6 to S3 when entered this behavior in Figure 6, and from S3 to S6 when it exited. During t = 137.6 ∼ 138.2 s, the interaction state generally shifted from S3 to S2 and then back to S3.
3.2.2 The kick-out effect through impulses
Figure 7 shows a kick-out effect happening at t = 33.0 ∼ 34.2 s. During this period, the green ball (ball 2) was kicked out of the airflow, while other balls were staying inside. At t = 33.5 s, the blue ball hit the green ball, which resulted in the fall of the green ball. The interaction forces were almost near 0 in this behavior except that Fb13 was negative during t = 33.0 ∼ 33.6 s, which indicated the red ball (ball 1) and the blue ball (ball 3) bond together in this period of time.
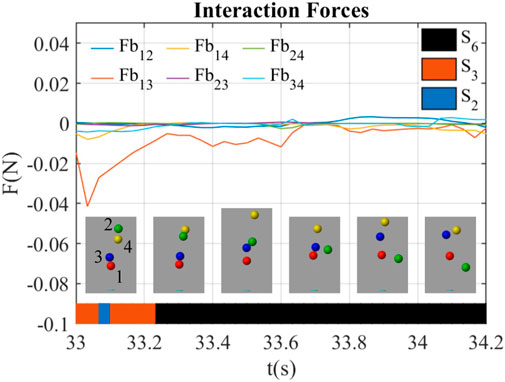
FIGURE 7. Interaction forces between balloons during kick-out behavior led by impulses (B4).
The interaction state in Figure 7 was always S6 before the impulse at t = 33.5 s till the end of the green ball’s fall at t = 34.2 s. This indicates that the impulse dominates this behavior while the interaction forces did not make remarkable changes to the system.
3.2.3 The lose-lose competition through interaction forces
Figure 8 shows a lose-lose competition happening at t = 160.4 ∼ 161.6 s. During this period, the blue ball (ball 3) and the yellow ball (ball 4) were out of the airflow, while other balls were staying inside. There were frames at around t = 160.6 s showing that the interaction forces of ball 4 (Fb14, Fb24, Fb34) were all positive, indicating that ball 4 was rejected by other three balls by the interaction forces through the airflow. At t = 160.5 s, the red ball, the blue ball, and the yellow ball were all out of the airflow, and the forces were all near 0. During t = 160.6 ∼ 161.3 s, Fb12 was negative and attracted the red ball (ball 1) back to the airflow, while all other interaction forces were slightly positive near 0, which kept the blue ball (ball 3) and the yellow ball (ball 4) outside of the airflow. At t = 161.3 s, Fb34 was clearly positive, which continuously kept the blue ball (ball 3) and the yellow ball (ball 4) outside. Afterward, the blue ball (ball 3) and the yellow ball (ball 4) went back to the airflow due to the centering forces.
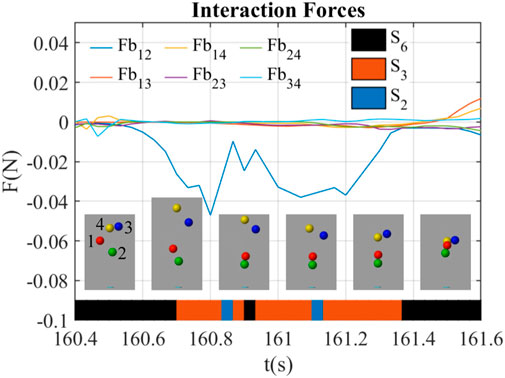
FIGURE 8. Interaction forces between balloons during lose-lose behavior led by interaction forces (B6).
The interaction state shifted from S6 to S3 when entered this behavior in Figure 8, and from S3 to S6 when it exited. During t = 160.7 ∼ 161.3 s, the interaction state was generally S3, but sometimes shifted to S2 and S6, and immediately back to S3.
3.2.4 The lose-lose competition through impulses
Figure 9 shows a lose-lose competition happening at t = 165.6 ∼ 166.8 s. During this period, the red ball (ball 1), the blue ball (ball 3), and the yellow ball (ball 4) were out of the airflow, while the green ball (ball 2) was staying inside. At t = 166.1 s, the blue ball hit the yellow ball, which results in the fall of them both. At t = 166.2 s, the green ball hit the red ball, which kicked the red ball out of the airflow. The interaction forces were almost near 0 in this behavior except that Fb23 was positive during t = 165.9 ∼ 166.7 s, which indicated the green ball (ball 2) keeps the blue ball (ball 3) outside.
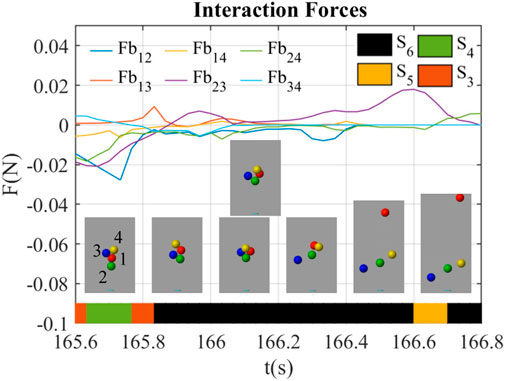
FIGURE 9. Interaction forces between balloons during lose-lose behavior led by impulses (B7).
The interaction state in Figure 9 was generally S6 before the first impulse at t = 166.1 s till the end of the balls’ fall at t = 166.8 s. This indicates that the impulses dominate this behavior while the interaction forces did not make remarkable changes to the system.
3.3 State transfer in behaviors
Figure 10 shows the state transfer model (Markov chains) of interaction forces leading to certain behavior (from B1 to B7). Some shared patterns between behaviors are discovered: state 1 mostly shifts to other states while other states rarely shift to state 1. The probability of staying in state 6 is always higher than 0.8, the probabilities of staying in state 3,4,5 are around 0.6, and the probability of staying in state 2 is about 0.4. The transfer rates from state 2 or state 4 to state 3 are around 0.3. The transfer rates from state 3 or state 5 to state 6 are around 0.2, while the transfer rates from state 6 to state 3 or state 5 are around 0.1. The transfer rates between state 2 and state 4 are about 0.1, and similarly, the transfer rates between state 3 and state 5 are about 0.1. Other transfer rates are mostly below 0.1.
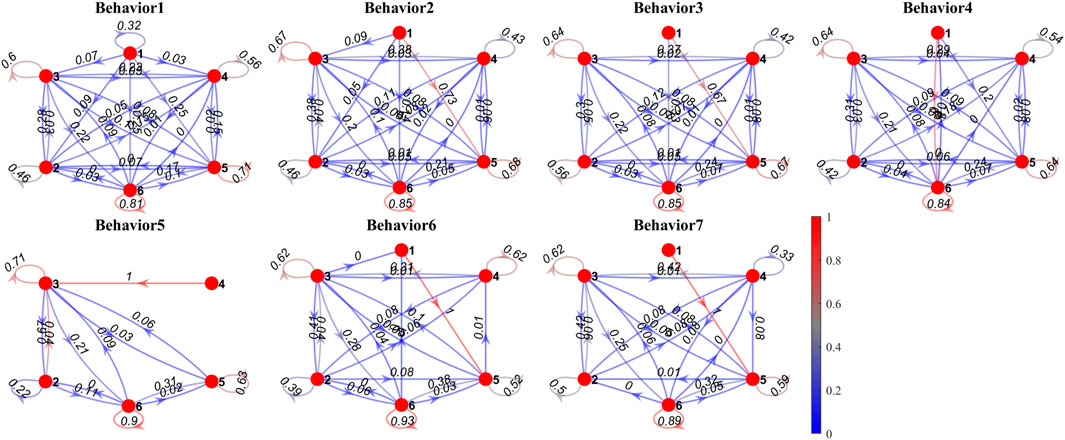
FIGURE 10. Markov chains of interaction state transfer in typical behaviors. The red dots indicate interaction states from S1 to S6. The color of the arrows indicates the probabilities of state transfer.
In particular, the probability of staying in state 6 increases from B1 (0.81) to B7 (0.89), indicating that the more balls fall, the more probably the system stay in state 6. Similarly, the transfer rate from state 5 to state 6 increases from B1 (0.17) to B7 (0.32), the transfer rate from state 2 to state 3 increases from B1 (0.28) to B7 (0.42), the transfer rate from state 4 to state 3 in B2 (0.38) to B7 (0.42) is higher than that in B1 (0.23), and the transfer rates from state 3 or state 5 to state 6 increase from B1 to B7, while the transfer rates from state 6 to state 3 or state 5 decrease from B1 to B7.
Figure 11 shows the proportions of time spent in behaviors and states. B1 (59%) takes up half of the time. B2 (8%), B3 (13%), B4 (9%), and B6 (8%) take about 10% of the time, while B5 (1%) and B7 (3%) rarely happen in the collective Bernoulli-ball system. Among all the frames, S6 (53%) takes up half of the time. S5 (21%) and S3 (20%) take about 20% of the time, while S4 (4%), S2 (2%) and
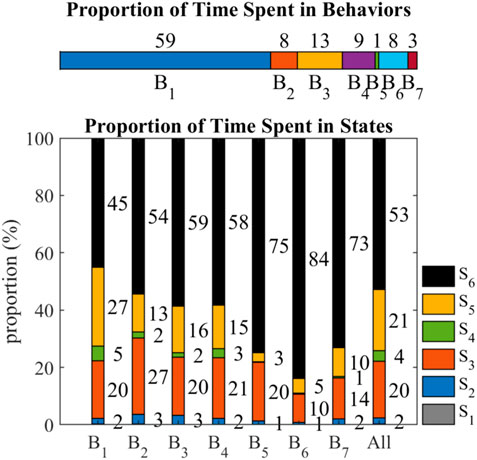
FIGURE 11. The proportion of time spent in behaviors and states. The values near the stacked bars indicate the proportion of time in percentage, and values less than 1% are hidden in this graph.
Compared with the overall proportion, B1 has less proportion of S6 (45%) and more proportion of S5 (27%). The proportion of S6 increases from B1 (45%) to B7 (73%), and the proportion of S5 decreases from B1 (27%) to B7 (10%). The proportion of S4 is 5% in B1, around 2% in B2, B3, and B4, and less than 1% in B5, B6, and B7. The proportion of S3 is always around 20% among behaviors except B2 (27%), B6 (10%), and B7 (14%). The proportions of S2 (2%) and
4 Discussion
The results show that the interaction of balls depends on their relative positions, and the sequence of interaction states reflects collective behaviors. Although we clustered the interaction states through the properties of interaction forces, the position distribution from the strongest ball to the weakest ball in the interaction states seems to have a clear layer as shown in Figure 5. This suggests that although the balls with different colors are equal, their strength, defined by the interaction forces that they provide to other balls, distinguishes them. Thus the interaction state in the case with various strength balls can be represented by their positions. In addition, Figure 5 shows that balls are symmetrically distributed around the vertical axis. Therefore, the position of the ball can be represented by a reduced vector of the ball’s altitude and horizontal distance from the center of the flow. Consequently, collective behavior can be determined by relating interaction forces and relative strengths among balls to the reduced vector of position. For example, Figure 6 shows a kick-out behavior where the red, green, and yellow balls are pushing the blue ball out of the air stream. During this typical behavior from t = 137.5 s to t = 138.1 s, the position of the green, red, and yellow balls were distributed horizontally in the canter of the flow for various heights, while the position of the blue ball was far from the flow center. The force trajectories show that when the blue ball was vertically close to the green and red balls from t = 137.5 s to t = 137.8 s, the interaction forces (Fb13, Fb23) between them became positive and increased to repulse the blue ball. When the blue ball was vertically far from the green and red balls but close to the yellow ball from t = 137.8 s to t = 137.9 s, Fb13, Fb23 decreased to around 0, while Fb34 became positive and increased to repulse the blue ball. This effect made the green ball the weakest ball since the interaction forces (Fb13, Fb23, Fb34) related to it were all higher than other forces. Therefore, as the weakest blue ball fell, the interaction state switched in a chain (S6 − S3 − S2 − S3 − S6) and consequently led to a kick-out behavior.
Behaviors spent minor time on S1 and it has high possibilities to switch to other states, indicating that S1 is an outlier of the states, and it always immediately switches to other states. Mostly, behaviors spent the time on S6, and the probability of staying at S6 is also pretty high, indicating S6 is a base state of all behaviors, and the state transfer from S6 to other states determines its behavior. As shown in Figures 10, 11, if S6 is more likely to shift to S5 or S3, the behavior will more likely be B1, a win-win situation. If S6 is slightly less likely to shift to S5, and the proportion of S4 decreases, the behavior will more likely be B2, B3, and B4, a kick-out effect. If S6 is more likely to keep unchanged, and the proportion of all other states decreases, the behavior will more likely be B4, B5, and B6, a lose-lose competition.
If we simplify the interaction forces to pushing (positive forces) and pulling (negative forces), and regard these pushing and pulling forces as kinds of competition and collaboration among these balls, a more interesting discovery is: a certain time sequence of competition and collaboration patterns leads to certain behaviors of the collective Bernoulli-ball system. Additionally, the Bernoulli-ball system can be considered to be autonomous, as the collective behavior is determined by the set of local rules (physics principles) related to a flow field with no leader or external controller. Since the interaction happens through the medium of the airflow, the noise from the environment (e.g., turbulence) introduces the stochastic effect to the system. Therefore, the environment of our system in a way affects the behavior of the balls and can be potentially used for control, which makes the Bernoulli-ball system applicable to swarm robotics.
The collective Bernoulli-ball system can be also used to analyze other multi-agent systems like the Brownian motion (Kramers, 1940) or complex systems like the falling paper (Howison et al., 2020b). These systems exhibit similar behaviors to the Bernoulli-ball system since they are autonomous, rely on the body-environment interaction (the fluid in the Brownian motion and the airflow in the falling paper experiment), depend on local interaction rules, and have a certain level of randomness. Furthermore, the control of airflow in the collective Bernoulli system makes it more appealing for practical use in swarm robotics.
5 Conclusion
In this paper, we developed a state-transfer model that describes the collective behavior of the multi-ball Bernoulli system. To convert interaction forces into behavior states, we employed self-organizing maps to find distinct clusters of interaction forces. We defined seven various behaviors that consider both cooperation and competition and applied the Markov chain model, with six interaction force states, to find the correlation between the interaction states and collective behaviors in this system. In general, the more time this system spends on organized interaction states (S6, S5, and S4), the more probable this system will be performing a self-organized behavior (B1).
In the future, we will focus on the development of control methods to keep this collective Bernoulli-ball system in defined interaction states. Additionally, it is interesting to see how this system reacts to external cues, e.g., the fluid speed, the perturbation of the surrounding airflow, and the external object that obstruct the fluid. By finding the efficient input method for control of the Bernoulli-ball system, we can try to apply it for physical computing (Fresco, 2014; Piccinini, 2015) and as a reservoir computer like the liquid state machine (Maass et al., 2002).
Data availability statement
The datasets presented in this study can be found in online repositories. The names of the repository/repositories and accession number(s) can be found below: https://github.com/Kyushudy/collective_bernoulli_ball_behavior_analysis.
Author contributions
FY contributed to the conception and performed simulations and analysis. FY, AA, and FI contributed to writing the manuscript and concept generation. FI was the PI supervising FY’s work.
Funding
This work was supported by a Huawei HiSilicon Scholarship.
Acknowledgments
The authors appreciate for the contributions of Ryman Hashem, Thomas George Thuruthel, and David Hardman by discussing the method of analyzing the collective behaviors of Bernoulli-balls presented in this paper.
Conflict of interest
The authors declare that the research was conducted in the absence of any commercial or financial relationships that could be construed as a potential conflict of interest.
Publisher’s note
All claims expressed in this article are solely those of the authors and do not necessarily represent those of their affiliated organizations, or those of the publisher, the editors and the reviewers. Any product that may be evaluated in this article, or claim that may be made by its manufacturer, is not guaranteed or endorsed by the publisher.
References
Berlinger, F., Gauci, M., and Nagpal, R. (2021). Implicit coordination for 3d underwater collective behaviors in a fish-inspired robot swarm. Sci. Robot. 6, eabd8668. doi:10.1126/scirobotics.abd8668
Berman, S., Nagpal, R., and Halász, A. (2011). “Optimization of stochastic strategies for spatially inhomogeneous robot swarms: A case study in commercial pollination,” in 2011 IEEE/RSJ international conference on intelligent robots and systems, San Francisco, CA, USA, 25-30 September 2011 (IEEE), 3923–3930.
Brambilla, M., Ferrante, E., Birattari, M., and Dorigo, M. (2013). Swarm robotics: A review from the swarm engineering perspective. Swarm Intell. 7, 1–41. doi:10.1007/s11721-012-0075-2
Camazine, S., Deneubourg, J.-L., Franks, N. R., Sneyd, J., Theraula, G., and Bonabeau, E. (2020). Self-organization in biological systems. New Jersey, United States: Princeton university press.
Couzin, I. D. (2009). Collective cognition in animal groups. Trends Cognitive Sci. 13, 36–43. doi:10.1016/j.tics.2008.10.002
Dorigo, M., Theraulaz, G., and Trianni, V. (2021). Swarm robotics: Past, present, and future [point of view]. Proc. IEEE 109, 1152–1165. doi:10.1109/jproc.2021.3072740
Ebert, J. T., Gauci, M., Mallmann-Trenn, F., and Nagpal, R. (2020). “Bayes bots: Collective bayesian decision-making in decentralized robot swarms,” in 2020 IEEE International Conference on Robotics and Automation (ICRA), Paris, France, 31 May 2020 - 31 August 2020 (IEEE), 7186–7192.
Flemmer, R. L., and Banks, C. (1986). On the drag coefficient of a sphere. Powder Technol. 48, 217–221. doi:10.1016/0032-5910(86)80044-4
Giomi, L., Hawley-Weld, N., and Mahadevan, L. (2013). Swarming, swirling and stasis in sequestered bristle-bots. Proc. R. Soc. A 469, 20120637. doi:10.1098/rspa.2012.0637
Hoff, N. R., Sagoff, A., Wood, R. J., and Nagpal, R. (2010). “Two foraging algorithms for robot swarms using only local communication,” in 2010 IEEE International Conference on Robotics and Biomimetics, Tianjin, China, 14-18 December 2010 (IEEE), 123–130.
Hooker, C. (2011). Introduction to philosophy of complex systems: A: Part A: Towards a framework for complex systems. Amsterdam, Netherlands: Elsevier, 3–90.
Howison, T., Giardina, F., and Iida, F., (2020a). “Augmenting self-stability: Height control of a Bernoulli ball via bang-bang control,” in IEEE International Conference on Robotics and Automation (ICRA), Paris, France, 31 May 2020 - 31 August 2020, 3974–3980.
Howison, T., Hughes, J., and Iida, F. (2020b). Large-scale automated investigation of free-falling paper shapes via iterative physical experimentation. Nat. Mach. Intell. 2, 68–75. doi:10.1038/s42256-019-0135-z
Jadbabaie, A., Lin, J., and Morse, A. S. (2003). Coordination of groups of mobile autonomous agents using nearest neighbor rules. IEEE Trans. Autom. Contr. 48, 988–1001. doi:10.1109/tac.2003.812781
Kramers, H. A. (1940). Brownian motion in a field of force and the diffusion model of chemical reactions. Physica 7, 284–304. Kramers, HA. doi:10.1016/s0031-8914(40)90098-2
Krieger, M. J. B., Billeter, J. B., and Keller, L. (2000). Ant-like task allocation and recruitment in cooperative robots. Nature 406, 992–995. doi:10.1038/35023164
Lee, K. (1979). Aerodynamic interaction between two spheres at Reynolds numbers around 104. Aeronaut. Q. 30, 371–385. doi:10.1017/s000192590000857x
Li, S., Batra, R., Brown, D., Chang, H. D., Ranganathan, N., Hoberman, C., et al. (2019). Particle robotics based on statistical mechanics of loosely coupled components. Nature 567, 361–365. doi:10.1038/s41586-019-1022-9
Liao, J. C., Beal, D. N., Lauder, G. V., and Triantafyllou, M. S. (2003). Fish exploiting vortices decrease muscle activity. Science 302, 1566–1569. doi:10.1126/science.1088295
Lissaman, P. B., and Shollenberger, C. A. (1970). Formation flight of birds. Science 168, 1003–1005. doi:10.1126/science.168.3934.1003
Maass, W., Natschläger, T., and Markram, H. (2002). Real-time computing without stable states: A new framework for neural computation based on perturbations. Neural Comput. 14, 2531–2560. doi:10.1162/089976602760407955
Magarvey, R., and Bishop, R. L. (1961). Transition ranges for three-dimensional wakes. Can. J. Phys. 39, 1418–1422. doi:10.1139/p61-169
Nudehi, S. S., Dehmlow, S., and Clark, D. (2018). “Position control of a floating ball in a vertical air stream,” in ASME International Mechanical Engineering Congress and Exposition, Tampa, Florida, USA, November 3–9, 2017.
Olfati-Saber, R. (2006). Flocking for multi-agent dynamic systems: Algorithms and theory. IEEE Trans. Autom. Contr. 51, 401–420. doi:10.1109/tac.2005.864190
Ormières, D., and Provansal, M. (1999). Transition to turbulence in the wake of a sphere. Phys. Rev. Lett. 83, 80–83. doi:10.1103/physrevlett.83.80
Piccinini, G. (2015). Physical computation: A mechanistic account. Oxford, United Kingdom: OUP Oxford.
Ramdya, P., Lichocki, P., Cruchet, S., Frisch, L., Tse, W., Floreano, D., et al. (2015). Mechanosensory interactions drive collective behaviour in drosophila. Nature 519, 233–236. –+. doi:10.1038/nature14024
Reynolds, C. W. (1987). Flocks, herds and schools: A distributed behavioral model. SIGGRAPH Comput. Graph. 21, 25–34. doi:10.1145/37402.37406
Rubenstein, M., Cornejo, A., and Nagpal, R. (2014). Programmable self-assembly in a thousand-robot swarm. Science 345, 795–799. doi:10.1126/science.1254295
Schaerf, T. M., Dillingham, P. W., and Ward, A. J. W. (2017). The effects of external cues on individual and collective behavior of shoaling fish. Sci. Adv. 3, e1603201. doi:10.1126/sciadv.1603201
Sharma, A., Hauert, S., and Hauser, H. (2020). “Morphological communication for swarms,” in ALIFE 2020: The 2020 Conference on Artificial Life, July 13–18, 2020 (MIT Press), 549–557.
Taneda, S. (1956). Experimental investigation of the wake behind a sphere at low Reynolds numbers. J. Phys. Soc. Jpn. 11, 1104–1108. doi:10.1143/jpsj.11.1104
Tyagi, H., Liu, R., Ting, D. S.-K., and Johnston, C. R. (2006). Measurement of wake properties of a sphere in freestream turbulence. Exp. Therm. fluid Sci. 30, 587–604. doi:10.1016/j.expthermflusci.2005.12.004
Vasarhelyi, G., Viragh, C., Somorjai, G., Nepusz, T., Eiben, A. E., and Vicsek, T. (2018). Optimized flocking of autonomous drones in confined environments. Sci. Robot. 3, eaat3536. doi:10.1126/scirobotics.aat3536
Vicsek, T., Czirók, A., Ben-Jacob, E., Cohen, I., and Shochet, O. (1995). Novel type of phase transition in a system of self-driven particles. Phys. Rev. Lett. 75, 1226–1229. doi:10.1103/physrevlett.75.1226
Willshaw, D. (2006). Self-organization in the nervous system. Cognitive Syst. Inf. Process. meet Brain Sci. 5, 33. doi:10.3389/fnsys.2017.00069
Keywords: state-transfer, collective behavior, multi-agent system, Bernoulli-ball system, game theory, swarm robotics
Citation: Ye F, Abdulali A and Iida F (2022) State-transfer modeling collective behavior of multi-ball Bernoulli system based on local interaction forces. Front. Robot. AI 9:980586. doi: 10.3389/frobt.2022.980586
Received: 28 June 2022; Accepted: 28 October 2022;
Published: 10 November 2022.
Edited by:
Herbert Glenn Tanner, University of Delaware, United StatesReviewed by:
Bradly J. Alicea, Orthogonal Research and Education Laboratory, United StatesZain Anwar Ali, Sir Syed University of Engineering and Technology, Pakistan
Copyright © 2022 Ye, Abdulali and Iida. This is an open-access article distributed under the terms of the Creative Commons Attribution License (CC BY). The use, distribution or reproduction in other forums is permitted, provided the original author(s) and the copyright owner(s) are credited and that the original publication in this journal is cited, in accordance with accepted academic practice. No use, distribution or reproduction is permitted which does not comply with these terms.
*Correspondence: Arsen Abdulali, YWEyMzM1QGNhbS5hYy51aw==