 Orr Barnea*
 Jonas Drotleff
 Idan Hochner
 Ziv Meir
- Department of Physics of Complex Systems, Weizmann Institute of Science, Rehovot, Israel
Stray electric fields induce excess micromotion in ion traps, limiting experimental performance. We present a new micromotion-compensation technique that utilizes a dark ion in a multi-species bright-dark-bright linear ion crystal. Stray electric fields in the radial plane of the trap deform the crystal axially due to the different masses of dark and bright ions. We exploit the mode softening near the transition to the zig-zag configuration to enhance the crystal deformation and, as a result, increase the method’s sensitivity dramatically. We corroborate our results with a modified ion-displacement compensation method using a single bright ion. Our modification allows us to compensate stray fields on the 2D radial plane from a 1D measurement of the ion position on the camera by controlling the asymmetry of the two radial modes of the trap. Both methods require only a fixed imaging camera and continuous ion-fluorescence detection. As such, they can be readily implemented in most ion-trapping experiments without additional hardware modifications.
Introduction
Excess micromotion (EMM) is the residual motion of an ion in its equilibrium position driven by the radiofrequency (RF) oscillating fields, and it is present in any RF ion trap (Berkeland et al., 1998). While EMM could be used to one’s advantage in some exceptional cases (Navon et al., 2013), typically, compensating EMM below some threshold is a necessary condition for most ion-trapping experiments. A few prominent examples are experiments involving the interaction between ultracold neutral atoms and trapped ions where EMM can limit the energy scale of the interaction (Tomza et al., 2019), optical-atomic clocks where uncompensated EMM could limit the clock’s accuracy (Brewer et al., 2019), and optical trapping of ions where the optical dipole force is overwhelmed by uncompensated stray electric fields in the trap (Huber et al., 2014).
Many techniques for detecting and compensating EMM were developed in the last few decades. The most common (Berkeland et al., 1998) are the resolved-sideband, photon-correlation, and ion-displacement methods. Each technique has its advantages and disadvantages when compared to others (Keller et al., 2015). For example, the resolved-sideband method (Berkeland et al., 1998; Keller et al., 2015) and its recent extension (Arnold et al., 2024) only detect EMM parallel to the laser’s k-vector and require the implementation of coherent-control tools such as narrow linewidth lasers. Here, we focus on a technique for which advanced coherent-control tools are unnecessary.
The minimal requirement for imaging a trapped ion is continuous illumination with a laser to induce ion fluorescence and an imaging system to collect the emitted photons on a camera. With only these tools at hand, EMM compensation can be achieved by observing the position of the ion on the camera for different radio-frequency trapping strengths (Berkeland et al., 1998; Schneider et al., 2012; Gloger et al., 2015; Saito et al., 2021). While 2D information on the ion position is readily extracted from a fluorescence image of an ion, the information regarding the position along the imaging axis is less accessible (Schneider et al., 2012). It requires automated mechanical scanning of the focus (Gloger et al., 2015; Saito et al., 2021) or engineering of the imaging point-spread function (Zhou et al., 2024), which are not standard techniques in ion imaging.
Here, we use a “dark” ion (44
In a linear crystal of bright ions embedded with a dark ion of different mass, a stray radial electric field can be detected by observing the deformation of the crystal along its axis (axial axis), which can be sensitive to a displacement of the dark ion in both radial directions. Thus, by reading the position of the bright ions along the axial axis on the 2D imaging plane, we are sensitive to radial displacements of the dark ion that are both on and out of the imaging plane.
Axial deformation due to radial displacement is quadratic in nature. Hence, we need to enhance the sensitivity of our method further. We do so by working near the transition from a linear to a zig-zag configuration in a bright-dark-bright three-ion crystal (Kaufmann et al., 2012). Near the transition, the frequency of the radial bending mode approaches zero (mode softening) (Fishman et al., 2008), significantly enhancing crystal deformation for a given stray field.
Mixed-species ion crystals are becoming more common in novel ion-trapping quantum technologies such as mixed-species optical atomic clocks (Brewer et al., 2019; Hausser et al., 2025), quantum-logic control of molecular ions (Wolf et al., 2016; Lin et al., 2020; Sinhal et al., 2020; Holzapfel et al., 2024) and highly charged ions (King et al., 2022), and mixed-species quantum computation (Tan et al., 2015; Ballance et al., 2015; Pino et al., 2021; Bruzewicz et al., 2019; Hughes et al., 2020; Negnevitsky et al., 2018), to name a few. Therefore, techniques for compensating EMM in these mixed-species crystals are of high importance (Barrett et al., 2003).
To test the validity of our dark-ion EMM compensation method, we use the technique developed in Refs (Schneider et al., 2012; Gloger et al., 2015; Saito et al., 2021) with a small but useful modification. In these works, EMM compensation was performed by monitoring the position of a single bright ion in the two radial directions while changing the amplitude of the oscillating RF fields. The position of the ion along the imaging axis was retrieved by automated scanning of the imaging focus (Gloger et al., 2015; Saito et al., 2021) or by inferring it from the size of the de-focused point-spread function (Schneider et al., 2012). Here, we show that by changing the ratio between the frequencies of the two radial modes, we can compensate EMM in the two radial directions without the position information along the imaging axis. In our trap, which possesses a large asymmetry ratio at low RF amplitudes, we change the asymmetry by increasing the RF amplitude, which results in a non-linear ion trajectory (Gloger et al., 2015).
In this work, we consider only EMM generated by the ion’s radial displacement from the trap’s RF center. Typically, this is the leading EMM term to compensate, which can acquire the largest value. Other EMM origins exist, such as out-of-phase EMM and axial EMM (Meir et al., 2018), which are typically lower in magnitude. The presented method is insensitive to these EMM sources since they don’t induce a constant shift from the trap’s RF center.
Experiment - dark ion
We use a linear-segmented RF trap similar to the one described in Meir et al. (2018). We load ions to the trap from a heated oven loaded with pure calcium (Ca) grains. We use a 1 + 1′ resonance-enhanced-ionization scheme to load ions to the trap from the flux of neutral atoms emerging from the heated oven. By tuning the first ionization beam to a resonance in neutral Ca, we can selectively ionize different Ca isotopes (Lucas et al., 2004). We load a three-ion crystal made of two 40Ca+ ions (bright ions) and one 44Ca+ ion (dark ion) in the center. The cooling and fluorescence lasers are tuned to the resonance of the 40Ca+ ions, hence the “bright” and ’‘dark” nomenclatures. The RF drive frequency in our experiment is
The three-ion crystal transitions from a linear to a zig-zag configuration when the bright-ion radial frequency,
here,
using Equations 1, 2, we get
A static electric field
where
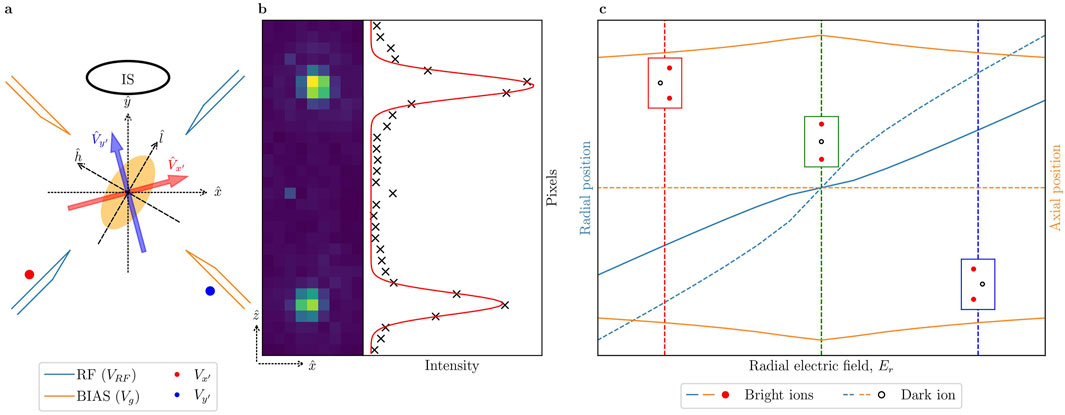
Figure 1. Deformation of a bright-dark-bright Coulomb crystal due to uncompensated EMM. (a) Sketch of a radial cross-section of the ion trap showing the RF (light blue) and BIAS (orange) trap blades, on which we apply RF
We control the static electric field amplitude and orientation in the radial plane of the trap by applying voltages (
The radial plane of the trap supports two orthogonal modes
We record the position of the bright ions on an EM-CCD camera (Figure 1b). The imaging system comprises an objective with a working distance of
Results - dark ion
The dependence of the distance between the bright ions on the EMM and the low radial-mode frequency is shown in Figure 2. We vary the compensation voltages,
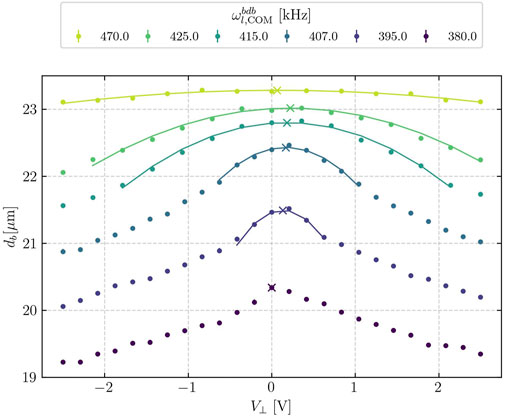
Figure 2. Bright ion separation,
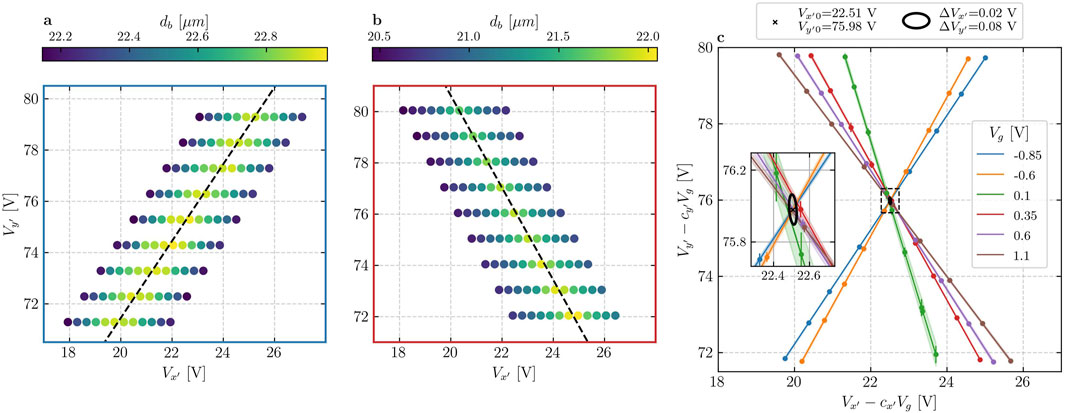
Figure 3. Dark ion EMM compensation. (a,b) Bright ion distance (color scale) as a function of the compensation voltages (
As
Below the transition frequency to zig-zag configuration, the dark ion no longer passes through the center of the crystal when
For traps with considerable ratio between the high and low radial frequency modes (Saito and Mukaiyama, 2024) as our own (
To overcome this obstacle, we exploit the ability to tune the orientation of the radial modes in our trap (Saito and Mukaiyama, 2024). By changing the bias voltage
where
However, by changing the bias voltage, we also create stray electric fields due to the misalignment of the bias and RF quadrupoles in the trap. This results in a linear dependence of the compensation point on the value of
Here, (
Using Equation 6 to “shift” all compensation lines (Equation 5) due to the effect of
This set of equations has four “free” parameters:
Experiment - single ion
To corroborate the EMM compensation results using a dark ion, we measure EMM by monitoring the position of a single bright ion on the camera for different amplitudes of the trapping RF fields (Berkeland et al., 1998; Schneider et al., 2012; Gloger et al., 2015; Saito et al., 2021). Here, we show that for 2D radial EMM compensation, only information on ion displacement along one radial direction is necessary. In our setup, this corresponds to the x-axis, which is perpendicular to the imaging axis. Our technique relies on two necessary conditions: 1) The ability to change the ratio of the trap’s radial modes. 2) The orientation of any of the radial modes should not align with the imaging optical axis. Both of these conditions can be met in a typical ion trap. In our trap, the first is fulfilled by adjusting the RF amplitude (see single-ion section in the Supplementray Material) as our trap possesses large inherent asymmetry between the radial modes (see Figure 5C legend), while the second condition is ensured through a simple adjustment of
As can be seen from Equation 4, the magnitude of the ion’s shift from the trap center due to a stray electric field depends on the radial trapping frequency. Changing the amplitude of the radial trapping fields from maximum to minimum values (denoted as “high” and “low” RF amplitudes) while monitoring the ion’s position shift is an efficient way to detect EMM (Berkeland et al., 1998; Schneider et al., 2012; Gloger et al., 2015; Saito et al., 2021).
In a symmetric trap, where the two radial modes are degenerate
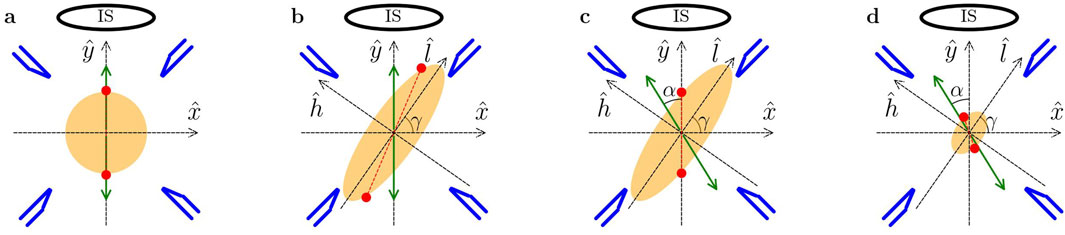
Figure 4. Single-ion radial displacement due to a radial stray electric field. The imaging system (IS) is oriented along the y-axis and can detect only shifts in ion position along the x-axis. The radial mode frequencies (
However, even for the non-symmetric trap case, an electric field oriented by an angle (see single-ion section in the Supplementary Material),
will lead to a non-detectable ion displacement along the imaging axis (Figure 4c). In Equation 8,
Results - single ion
The results of EMM compensation with a single bright ion are presented in Figure 5. We scan the compensation-electrodes voltages,
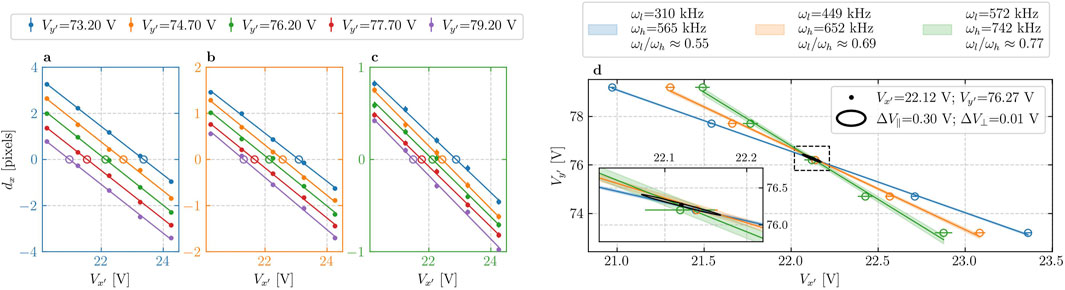
Figure 5. Single-ion EMM compensation. (a–c) Dots are ion relative displacements between high to low RF amplitudes as a function of the
We plot the zero-displacement compensation values in the (
Discussion
To compare our compensation scheme with other works, we relate the change in the compensation-electrodes voltage to the resulting electric field at the trap center. A typical uncertainty of
On the other hand, a quantitative and direct comparison between the two compensation methods presented in this paper is shown in Figure 6. While the two methods yield similar compensation uncertainties, there is a small discrepancy between them, which cannot be attributed to random error. As the results of the single-ion compensation are consistent before and after the dark-ion measurement, we can rule out drifts as the cause of the discrepancy.
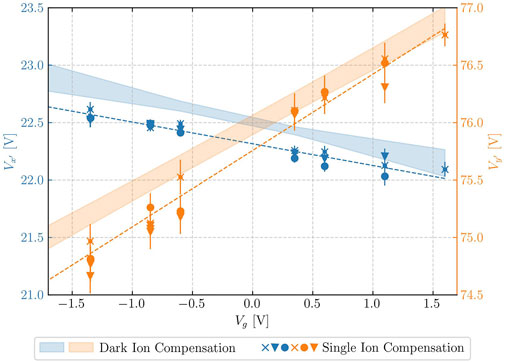
Figure 6. Comparison between the single ion (markers) and dark ion (shaded areas) compensation methods. Error bars of the markers and the width of the shaded area give the
One possible systematic effect that differentiates between the two schemes is the presence of the scattering force from the fluorescence laser during the measurements. The scattering force acts as an additional effective stray field in the single-ion scheme (on saturation, the maximal scattering field is
In the single-ion scheme, we perform EMM compensation independently for each bias voltage by exploiting the change in the low-to-high radial frequency ratio when increasing the RF amplitude (see legend in Figure 5d). In contrast, we need to perform several measurements for different bias voltages in the dark-ion scheme, resulting in a linear fit for the EMM compensation as a function of the bias voltage. This is because of the sensitivity scaling in the dark-ion scheme: Since we are detecting axial contraction due to a field that shifts the ions radially, the sensitivity of the dark-ion scheme scales as
Our trap has a large low-to-high radial-frequency ratio (
The dark-ion scheme exploits the phenomena where ions with different masses experience different effective radial trapping potentials when placed within the same trap. As such, we can further enhance the sensitivity of this method by working with dark and bright ions with a greater mass difference. E.g., moving from 44
Summary
To summarize, we presented two EMM compensation methods that require only a fixed imaging system and continuous fluorescence detection, which makes them compatible and accessible to most ion-trapping experiments as is. Both methods overcome the difficulty of measuring the EMM in the direction parallel to the imaging system. The dark-ion method detects axial deformation of a bright-dark-bright ion crystal due to the bright and dark ions mass difference, while the single-bright-ion method exploits the curved ion trajectory resulting from changes in trap asymmetry. Both methods enable effective EMM compensation, achieving stray electric field amplitudes well below
Data availability statement
The raw data supporting the conclusions of this article will be made available by the authors, without undue reservation.
Author contributions
OB: Conceptualization, Formal analysis, Investigation, Methodology, Software, Writing – original draft. DE: Methodology, Software, Writing – review and editing. JD: Methodology, Writing – review and editing. IH: Methodology, Software, Writing – review and editing. ZM: Conceptualization, Formal analysis, Funding acqusition, Supervision, Validation, Writing – original draft.
Funding
The author(s) declare that financial support was received for the research and/or publication of this article. We acknowledge the support of the Diane and Guilford Glazer Foundation Impact Grant for New Scientists, the research grant from the Donald Gordon Foundation and the Ike, Molly and Steven Elias Foundation, the research grant from the Laurie Kayden Foundation, the Center for New Scientists at the Weizmann Institute of Science, the Edith and Nathan Goldenberg Career Development Chair, the Israel Science Foundation (Grant No. 1010/22 and 1364/24), and the Minerva Stiftung with funding from the Federal German Ministry for Education and Research.
Acknowledgments
We thank Roee Ozeri for fruitful discussions and reading of this manuscript.
Conflict of interest
The authors declare that the research was conducted in the absence of any commercial or financial relationships that could be construed as a potential conflict of interest.
Generative AI statement
The authors declare that no Generative AI was used in the creation of this manuscript.
Publisher’s note
All claims expressed in this article are solely those of the authors and do not necessarily represent those of their affiliated organizations, or those of the publisher, the editors and the reviewers. Any product that may be evaluated in this article, or claim that may be made by its manufacturer, is not guaranteed or endorsed by the publisher.
Supplementary material
The Supplementary Material for this article can be found online at: https://www.frontiersin.org/articles/10.3389/frqst.2025.1596801/full#supplementary-material
References
Arnold, K., Jayjong, N., Kang, M., Qichen, Q., Zhang, Z., Zhao, Q., et al. (2024). Enhanced micromotion compensation using a phase-modulated light field. Phys. Rev. A 110, 033115. doi:10.1103/physreva.110.033115
Ballance, C. J., Schäfer, V. M., Home, J. P., Szwer, D. J., Webster, S. C., Allcock, D. T. C., et al. (2015). Hybrid quantum logic and a test of Bell’s inequality using two different atomic isotopes. Nature 528, 384. doi:10.1038/nature16184
Barakhshan, P., Marrs, A., Bhosale, A., Arora, B., Eigenmann, R., and Safronova, M. S. (2022). Portal for high-precision atomic data and computation (version 2.0). Newark, DE, USA: University of Delaware. Available online at: https://www.udel.edu/atom.
Barrett, M. D., DeMarco, B., Schaetz, T., Meyer, V., Leibfried, D., Britton, J., et al. (2003). Sympathetic cooling of 9Be+ and 24Mg+ for quantum logic. Phys. Rev. A 68, 042302. doi:10.1103/PhysRevA.68.042302
Berkeland, D. J., Miller, J. D., Bergquist, J. C., Itano, W. M., and Wineland, D. J. (1998). Minimization of ion micromotion in a Paul trap. J. Appl. Phys. 83, 5025–5033. doi:10.1063/1.367318
Brewer, S. M., Chen, J. S., Hankin, A. M., Clements, E. R., Chou, C. W., Wineland, D. J., et al. (2019). 27Al+ quantum-logic clock with a systematic uncertainty below 10−18. Phys. Rev. Lett. 123, 033201. doi:10.1103/PhysRevLett.123.033201
Bruzewicz, C., McConnell, R., Stuart, J., Sage, J., and Chiaverini, J. (2019). Dual-species, multi-qubit logic primitives for Ca+/Sr+ trapped-ion crystals. Npj Quantum Inf. 5, 102. doi:10.1038/s41534-019-0218-z
Drewsen, M., Mortensen, A., Martinussen, R., Staanum, P., and Sørensen, J. L. (2004). Nondestructive identification of cold and extremely localized single molecular ions. Phys. Rev. Lett. 93, 243201. doi:10.1103/physrevlett.93.243201
Fishman, S., De Chiara, G., Calarco, T., and Morigi, G. (2008). Structural phase transitions in low-dimensional ion crystals. Phys. Rev. B 77, 064111. doi:10.1103/physrevb.77.064111
Gloger, T. F., Kaufmann, P., Kaufmann, D., Baig, M. T., Collath, T., Johanning, M., et al. (2015). Ion-trajectory analysis for micromotion minimization and the measurement of small forces. Phys. Rev. A 92, 043421. doi:10.1103/physreva.92.043421
Hausser, H. N., Keller, J., Nordmann, T., Bhatt, N. M., Kiethe, J., Liu, H., et al. (2025). 115In+ − 172Yb+ Coulomb crystal clock with 2.5×10⁻¹⁸ systematic uncertainty. Phys. Rev. Lett. 134, 023201. doi:10.1103/PhysRevLett.134.023201
Holzapfel, D., Schmid, F., Schwegler, N., Stadler, O., Stadler, M., Ferk, A., et al. (2024). Quantum control of a single H2+ molecular ion. arXiv:2409.06495 [physics.atom-ph].
Huber, T., Lambrecht, A., Schmidt, J., Karpa, L., and Schaetz, T. (2014). A far-off-resonance optical trap for a Ba+ ion. Nat. Commun. 5, 5587. doi:10.1038/ncomms6587
Hughes, A. C., Schäfer, V. M., Thirumalai, K., Nadlinger, D. P., Woodrow, S. R., Lucas, D. M., et al. (2020). Benchmarking a high-fidelity mixed-species entangling gate. Phys. Rev. Lett. 125, 080504. doi:10.1103/PhysRevLett.125.080504
Kaufmann, H., Ulm, S., Jacob, G., Poschinger, U., Landa, H., Retzker, A., et al. (2012). Precise experimental investigation of eigenmodes in a planar ion crystal. Phys. Rev. Lett. 109, 263003. doi:10.1103/physrevlett.109.263003
Keller, J., Partner, H. L., Burgermeister, T., and Mehlstäubler, T. E. (2015). Precise determination of micromotion for trapped-ion optical clocks. J. Appl. Phys. 118, 104501. doi:10.1063/1.4930037
King, S. A., Spieß, L. J., Micke, P., Wilzewski, A., Leopold, T., Benkler, E., et al. (2022). An optical atomic clock base on a highly charged ion. Nature 611, 43. doi:10.1038/s41586-022-05245-4
Lin, Y., Leibrandt, D. R., Leibfried, D., and Chou, C. W. (2020). Quantum entanglement between an atom and a molecule. Nature 581, 273–277. doi:10.1038/s41586-020-2257-1
Lucas, D., Ramos, A., Home, J., McDonnell, M., Nakayama, S., Stacey, J.-P., et al. (2004). Isotope-selective photoionization for calcium ion trapping. Phys. Rev. A 69, 012711. doi:10.1103/physreva.69.012711
Meir, Z., Sikorsky, T., Ben-shlomi, R., Akerman, N., Pinkas, M., Dallal, Y., et al. (2018). Experimental apparatus for overlapping a ground-state cooled ion with ultracold atoms. J. Mod. Opt. 65, 387. doi:10.1080/09500340.2017.1397217
Mokhberi, A., and Willitsch, S. (2015). Structural and energetic properties of molecular Coulomb crystals in a surface-electrode ion trap. New J. Phys. 17, 045008. doi:10.1088/1367-2630/17/4/045008
Navon, N., Kotler, S., Akerman, N., Glickman, Y., Almog, I., and Ozeri, R. (2013). Addressing two-level systems variably coupled to an oscillating field. Phys. Rev. Lett. 111, 073001. doi:10.1103/physrevlett.111.073001
Negnevitsky, V., Marinelli, M., Mehta, K. K., Lo, H.-Y., Flühmann, C., and Home, J. P. (2018). Repeated multi-qubit readout and feedback with a mixed-species trapped-ion register. Nature 563, 527–531. doi:10.1038/s41586-018-0668-z
Pino, J. M., Dreiling, J. M., Figgatt, C., Gaebler, J. P., Moses, S. A., Allman, M., et al. (2021). Demonstration of the trapped-ion quantum CCD computer architecture. Nature 592, 209–213. doi:10.1038/s41586-021-03318-4
Saito, R., and Mukaiyama, T. (2024). Determination of principal axes orientation in an ion trap using matter-wave interference. Opt. Express 32, 42616. doi:10.1364/oe.534882
Saito, R., Saito, K., and Mukaiyama, T. (2021). Measurement of ion displacement via RF power variation for excess micromotion compensation. J. Appl. Phys. 129. doi:10.1063/5.0046121
Schneider, C., Enderlein, M., Huber, T., Dürr, S., and Schaetz, T. (2012). Influence of static electric fields on an optical ion trap. Phys. Rev. A 85, 013422. doi:10.1103/physreva.85.013422
Sinhal, M., Meir, Z., Najafian, K., Hegi, G., and Willitsch, S. (2020). Quantum-nondemolition state detection and spectroscopy of single trapped molecules. Science 367, 1213–1218. doi:10.1126/science.aaz9837
Tan, T. R., Gaebler, J. P., Lin, Y., Wan, Y., Bowler, R., Leibfried, D., et al. (2015). Multi-element logic gates for trapped-ion qubits. Nature 528, 380–383. doi:10.1038/nature16186
Tomza, M., Jachymski, K., Gerritsma, R., Negretti, A., Calarco, T., Idziaszek, Z., et al. (2019). Cold hybrid ion-atom systems. Rev. Mod. Phys. 91, 035001. doi:10.1103/revmodphys.91.035001
Wolf, F., Wan, Y., Heip, J. C., Gebert, F., Shi, C., and Schmidt, P. O. (2016). Non-destructive state detection for quantum logic spectroscopy of molecular ions. Nature 530, 457–460. doi:10.1038/nature16513
Keywords: ion trapping, micromotion compensation, multi-specie ions, dark ion specie, bright ion specie, micromotion
Citation: Barnea O, Einav D, Drotleff J, Hochner I and Meir Z (2025) Micromotion compensation using dark and bright ion species. Front. Quantum Sci. Technol. 4:1596801. doi: 10.3389/frqst.2025.1596801
Received: 20 March 2025; Accepted: 05 June 2025;
Published: 01 July 2025.
Edited by:
Gerard Higgins, Institute for Quantum Optics and Quantum Information (OAW), AustriaReviewed by:
Rianne S. Lous, Eindhoven University of Technology, NetherlandsDebopriyo Biswas, Duke University, United States
Copyright © 2025 Barnea, Einav, Drotleff, Hochner and Meir. This is an open-access article distributed under the terms of the Creative Commons Attribution License (CC BY). The use, distribution or reproduction in other forums is permitted, provided the original author(s) and the copyright owner(s) are credited and that the original publication in this journal is cited, in accordance with accepted academic practice. No use, distribution or reproduction is permitted which does not comply with these terms.
*Correspondence: Orr Barnea, b3JyLmJhcm5lYUB3ZWl6bWFubi5hYy5pbA==; Ziv Meir, eml2Lm1laXJAd2Vpem1hbm4uYWMuaWw=