 Nicholas Nunn
 Antonin Marek1,2
 Marco D. Torelli
 Olga A. Shenderova
- 1 Adámas Nanotechnologies, Inc., Raleigh, NC, United States
- 2 Department of Chemistry, North Carolina State University, Raleigh, NC, United States
Low pressure high temperature annealing is a means for driving nitrogen and defect diffusion in diamond to reduce internal lattice damage without the need for technically complicated high-pressure cells. Herein, we perform a systematic time (5, 15, and 30 min) and temperature (1200 °C–1800 °C) study of effects of low-pressure high temperature annealing on photoluminescence, spin concentrations, and spin relaxation properties of NV centers in ca. 3 μm synthetic type 1b diamond particles. Annealing in the temperature range of ca. 1400 °C–1700 °C for even 5 min leads to a higher optically detected magnetic resonance contrast as compared to standard annealing at 900 °C for 2 h. Particles annealed at 1700 °C for 5 min exhibit a contrast close to about 13% as compared to about 9% for those annealed at 900 °C for 2 h. A reduction in the zero-field splitting strain parameter from E ≈ 4.5 MHz to ≈2.5 MHz and spectral linewidth from
Introduction
The nitrogen-vacancy (NV−) center in diamond is a fluorescence based platform for quantum sensing and quantum information science (Rembold et al., 2020; Aslam et al., 2023) due to the high levels of optically induced electronic spin polarization and long spin coherence times that persist even at room temperature. The NV− center has a ground electronic triplet spin state (S = 1) with zero-field splitting (ZFS) of D ≈ 2.87 GHz. In the absence of an external magnetic field the spin states m S = ±1 are degenerate and the allowed transitions between the m S = 0 and m S = ±1 levels occur at a resonance frequency of ≈2.87 GHz. These transitions can be readily observed by conventional electron paramagnetic resonance (EPR) with inductive detection or optically as a drop in the fluorescence emission intensity when the sample is irradiated with microwave at the resonance frequency. Changes in the diamond lattice, such as those induced by pressure or temperature affect the electronic structure of NV− center and interactions between the spins responsible for ZFS, causing shifts in the resonance frequency. Degeneracy of the m S = ±1 states is lifted by static magnetic fields causing the resonance lines to split while alternating magnetic fields shorten the lifetime of the spin states. These changes in magnetic resonance parameters can be measured with high accuracy by optically detected magnetic resonance (ODMR), making NV− centers a promising platform for quantum sensing of pressure, temperature, and stochastic magnetic fields such as those induced by nearby nuclear or electronic spins. The latter external spins can be manipulated by external radiofrequency and/or microwave pulses, and such an approach was exploited for optically detected nanoscale nuclear magnetic resonance (NMR) (Bruckmaier et al., 2023; Bucher et al., 2020; Holzgrafe et al., 2020) or EPR (Qin et al., 2023; Hall et al., 2016).
As applications of NV− centers in quantum sensing continue to grow, so are the needs for fabrication of diamond quantum materials with spin properties of NV− centers tailored to specific applications. A common fabrication scheme of NV− centers in synthetic diamond consists of two steps: (1) irradiation with a high energy electron beam (e-beam) to create vacancies in the diamond lattice and, (2) subsequent annealing at ca. 800 °C or above to promote diffusion of the vacancies which combine with substitutional nitrogen atoms and form stable NV− centers. While the existence of many different ‘color centers’ in diamond has been documented, those arising from nitrogen in its substitutional form are predominant in synthetic type 1b diamond (Breeding and Shigley, 2009), which is widely used for producing fluorescent diamond particles (FDPs). In a neutral charge state (Ns 0), substitutional nitrogen centers are paramagnetic (S = ½) and are readily identified by their characteristic EPR spectrum. These defects known as P1 centers are typically found at 1-2 orders of magnitude higher concentration than NV− centers and, therefore, can diminish NV− quantum properties, such as spin coherence times, via dipolar interactions (Bauch et al., 2020). High nitrogen concentrations also degrade NV− fluorescence emission intensity due to enhanced non-radiative tunneling pathways for electronic relaxation (Capelli et al., 2022; Shames et al., 2017a).
Spin properties of NV− centers in diamond particles can also be affected by the processing methods. For example, additional paramagnetic defects (vacancies) can be created by electron irradiation, and such defects may not anneal out completely at typically utilized temperatures. Lattice deformation from crushing of larger diamond particles can also change electronic configuration of NV− centers that manifests in an increase in the rhombic (transverse) anisotropy of ZFS described by the parameter E. A distribution of lattice deformations is also expected to lead to a distribution of the ZFS parameters D and E causing an additional broadening of EPR and ODMR resonance lines. This is undesirable for quantum sensing applications such as temperature measurements, for which the width of the ODMR resonance lines must be as narrow as possible for higher sensitivity. An increase in magnetic anisotropy also provides an additional relaxation pathway for the electronic spin system. For quantum sensing applications, it is desirable to have NV− centers with long spin-lattice (T 1), spin coherence (T 2), and inhomogeneous dephasing/spin memory (T 2*) times. In addition, particles with sufficient brightness of NV− ensembles (i.e., photon count rates) are required to enable optical detection.
Some of the primary pathways to improving NV− spin properties are by reducing concentration of paramagnetic defect centers and the lattice strain. Control of the paramagnetic center concentration can be achieved by various means, including but not limited to: (i) adjustment of the nitrogen content during synthesis, (ii) optimization of the irradiation fluence and energy, and (iii) optimization of the annealing temperature and time. Previously, investigators focused on decreasing and optimizing nitrogen content in chemical vapor deposition (CVD) (Healey et al., 2020; Wood et al., 2022; Luo et al., 2022) and high pressure high temperature (HPHT) (Healey et al., 2020) grown diamond plates and particles (Nunn et al., 2025). Several studies of effects of e-beam fluence and energy can be also found in literature (Luo et al., 2022; Nunn et al., 2025; Shames et al., 2017b). While some studies investigated the role of annealing temperature and time on the NV spin properties, these studies were typically limited to maximum temperatures of about 1200 °C and often were focused on bulk diamond plates but not particulate diamond. For example, Naydenov et al. (2010) reported that the fraction of NV centers in ion implanted CVD diamond plates exhibiting coherence times (T 2) 50 µs or longer was increased from ∼40% to >80% following annealing under nitrogen at 1200 °C for 12 h. The increase in coherence times was attributed to removal of the implantation induced defects (e.g., O1, R4, R5, R9, and R10 defects). Yamamoto et al. (2013) reported on high temperature annealing (1000 °C for 2 h) of 10 MeV 15N ion implanted 12C enriched single crystal CVD diamond and achieved room temperature spin coherence (T 2) times of 2 ms. Tetienne et al. (2018) also reported the impacts of annealing in spin ensembles of near surface NV centers in ion implanted CVD diamond plates. Following annealing at 1200 °C, the authors of that study used optically driven double electron-electron resonance (DEER) and cross relaxation spectroscopy (T 1-EPR) and reported an increase in T 2 coherence times and Rabi contrast, as well as a reduced ODMR linewidth. This was ascribed to a removal of (i) fast relaxing paramagnetic species such as the R4/W6 center (neutral divacancy, V2 0) formed upon ion implantation, and, possibly, (ii) multivacancy chain defects such as the R5 center (neutral trivacancy, V3 0). Regarding studies involving diamond particles, Dei Cas et al. (2019) demonstrated the potential of low pressure high temperature (LPHT) rapid thermal annealing (RTA) of e-beam irradiated 20 µm particles in the temperature range from ca. 500 °C–2000 °C, including annealing of 140 nm particles at 1900 °C for 1 min. Most of the protocols were limited to annealing for 10 min or less although a single 50 min annealing at 1700 °C was performed. The primary focus of the study was on the luminescence of the annealed diamond particles with less attention paid to spin properties. However, EPR analysis showed a reduction in the total concentration of S = 1/2 defects from 412 ppm after irradiation to 32 ppm after 1 min annealing at 1900 °C and an estimated order of magnitude elongation in the spin lattice relaxation time. Annealing at 1900 °C also reduced the NV− center concentration to <1 ppm (Dei Cas et al., 2019). A subsequent study reported on LPHT annealing of e-beam irradiated 40 µm particles (Shenderova et al., 2020). The electron fluence and energy (3 × 10¹⁸ e/cm2, 1 MeV) were lower as compared with the initial study of 20 µm particles by Dei Cas et al. (2019) (1 × 10¹⁹ e/cm2, 5 × 10¹⁹ e/cm2, 3 MeV). Milder irradiation conditions provided a greater luminescence homogeneity among the particles, and, interestingly, a lesser impact of high temperature annealing on the estimated spin lattice relaxation times was observed from analysis continuous wave (CW) EPR microwave power saturation curves. This was attributed to a lower diamond lattice damage due to milder irradiation conditions (Shenderova et al., 2020). A third RTA study showed that magnetic field induced fluorescence contrast of 20 µm particles irradiated to a fluence of 1.5 × 10¹⁹ e/cm2 and annealed at 1740 °C for 8 min increased about fourfold, i.e., from ∼5% to ∼20% (Torelli et al., 2020). Furthermore, 20 µm particles annealed at 1720 °C for 20 min exhibited a 36-fold enhancement of optically driven 13C hyperpolarization compared to the same particles annealed at 850 °C for 2 h (Gierth et al., 2020). While these studies do indicate that higher temperature annealing can enhance NV spin properties, to the best of the authors knowledge, no systematic study of RTA parameters combined with ODMR characterization has been reported so far. The focus on the ODMR characterization is practically important because ODMR is the main platform for many quantum sensing applications of NV− centers.
To fill this gap in the current literature, we therefore conducted a systematic evaluation of the impact of annealing parameters in the high temperature regime by investigating the annealing of 3 µm diamond particles across a range of temperatures (1200 °C–1800°) for 5, 15, and 30 min. The main objective was to determine whether optimization of temperature and time of RTA treatment would improve NV− spin properties without sacrificing much the NV− concentration. The latter was of a particular concern because annealing at higher temperatures for longer duration (ca. 1600 °C for 2 h) was shown to result in a significant loss in NV− concentration from about 3–4 ppm to <0.5 ppm resulting in a lower fluorescence signal (Nunn et al., 2023). The particles were also characterized by EPR to estimate activation energies of paramagnetic center annihilation in the lattice.
Experimental methods
Figure 1 illustrates experimental design for this study. Particle sizes of ca. 3 μm were selected because they were anticipated to be less susceptible to graphitization at high temperature than small particles–an important consideration for both producing sufficient quantity of annealed particles and reducing cost. Moreover, larger particles can be further milled to smaller sizes.
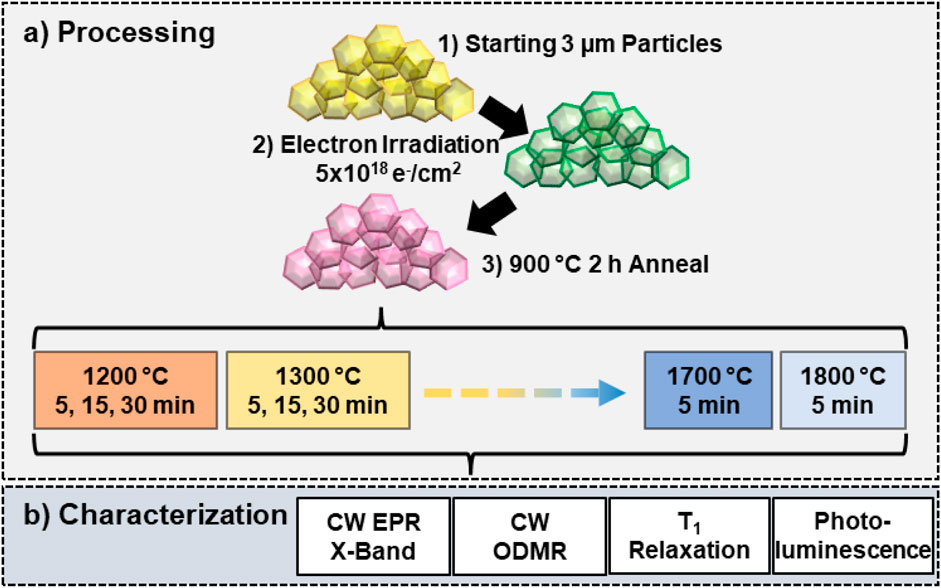
Figure 1. Experimental design for 3 µm diamond particle annealing study. (a) The starting 3 µm particles were irradiated with 3 MeV electrons to a fluence of 5 × 10¹⁸ e−/cm2 and subsequently annealed at 900 °C for 2 h in vacuo. The annealed particles were then subjected to further high temperature annealing from 1200°C–1800 °C in 100 °C increments for fixed times (5, 15, or 30 min). Duration of annealing at 1700 °C and 1800 °C was limited to 5 min to avoid further graphitization at these temperatures. (b) Each sample was characterized with CW EPR, CW ODMR, optical T 1 relaxation, and photoluminescence (PL) emission to identify defects present, determine spin concentrations, and evaluate optical properties of the samples as a function of annealing temperature and time.
Materials
Type 1b synthetic diamond particles ca. 3 μm in diameter (Adámas Nanotechnologies, Raleigh, NC, United States) were irradiated with 3 MeV electrons to a fluence of 5 × 10¹⁸ e−/cm2 and annealed in a vacuum tube furnace (CTF 17/600, Carbolite Gero Ltd., Hope Valley, United Kingdom) at ≈10−6 Torr at 900 °C for 2 h to form NV− centers and then oxidized in air at 550 °C for 2 h to remove surface graphite. 150 mg portions of these particles were then subjected to high temperature annealing in the range of 1200 °C–1800 °C for 5, 15, or 30 min in an all-graphite low pressure high temperature (LPHT) rapid thermal annealing furnace (High T Technologies, New York, NY, United States). For the 1700 °C and 1800 °C treatments, only 5-min annealing was performed due to significant graphitization and mass loss of the diamond particles observed at these temperatures (Table 1). A photograph of diamond powders following 5 min high temperature annealing in the temperature range of 1500 °C–1800 °C illustrates a progressive graphitization with temperature (Supplementary Figure S1, Supplemental Information). After the annealing, the particles were oxidized with molten potassium nitrate (KNO3, ACS Reagent Grade ≥99%, Sigma Aldrich, St. Louis, MO, United States) in air at 550 °C, similar to previously reported literature (Havlik et al., 2013), to remove graphitic phase carbon.
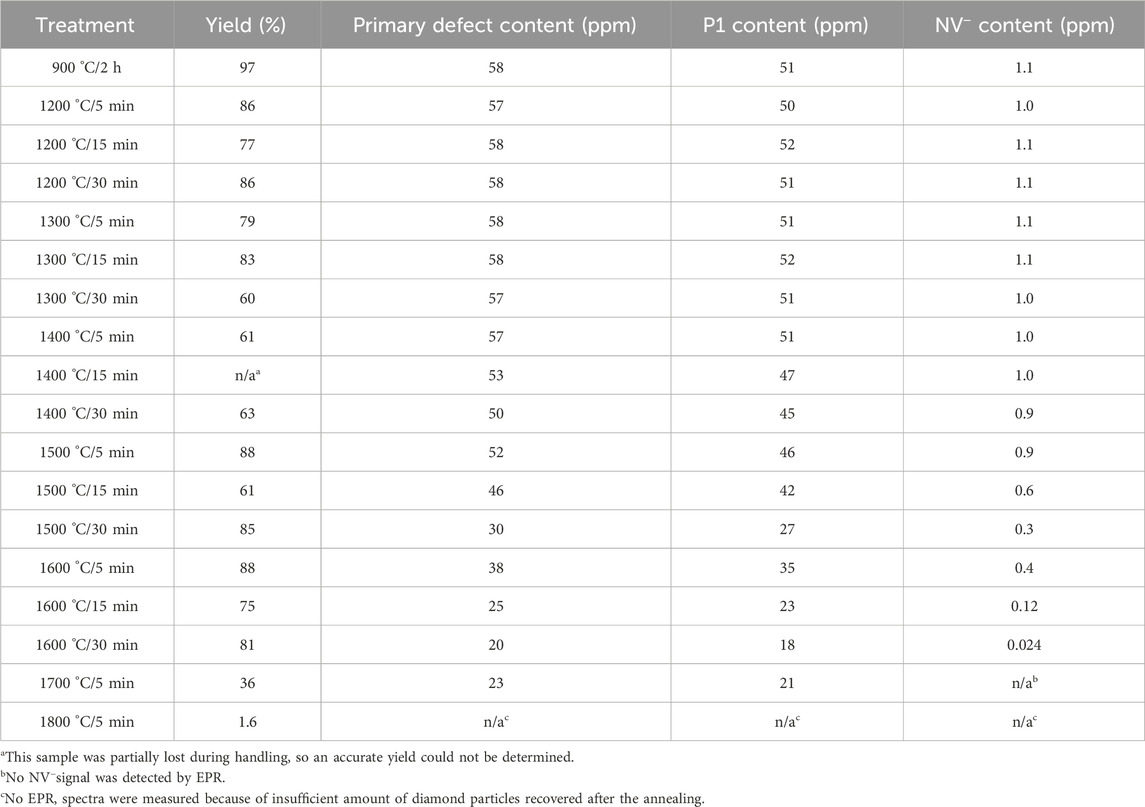
Table 1. Particle yields and estimated primary, P1, and NV− concentrations following different annealing protocols. Typical errors in spin concentrations do not exceed 15%.
Optically detected magnetic resonance
CW ODMR spectra were collected using an in-house built system configured with an Olympus IX71 epifluorescence microscope (Olympus Corporation of the Americas, Center Valley, PA, United States). Samples were prepared by drop casting aqueous suspensions of the particles (ca. 5 μL, 10 mg/mL) onto a glass coverslip. Once dried, the particles ensemble CW ODMR spectra were collected under continuous optical illumination and microwave driving. Light excitation was provided from a pE-300 white LED (CoolLED, Ltd., Andover, United Kingdom) filtered through a 562/40–25 nm bandpass excitation filter (Semrock FF01-562/40-25, IDEX Health and Science, LLC, West Henrietta, NY, United States). Emission light was passed through a beamsplitter (Semrock FF593-DI03-25 × 36) and 650 nm long-pass filter (FELH0650, Thorlabs Inc., Newton, NJ, United States) to a fiber coupled avalanche photodiode (APD) (APD440A, ThorLabs Inc.). Electrical output from the APD was captured on an oscilloscope (MDO4104C, Tektronix, Beaverton, OR, United States) and downloaded to a PC. A microwave signal (ca. 2.87 GHz) from a signal generator (SRS SG384, Stanford Research Systems, Inc., Sunnyvale, CA, United States) was amplified to ≈2 W by an amplifier (ZHL-2W-63-S+, MiniCircuits, Brooklyn, NY, United States) and delivered to the sample via a Thincol EMI near field RF ‘sniffer’ probe (Amazon, Seattle, WA, United States) in a ring configuration affixed to the stage of the microscope. The highest levels of photoluminescence magnetic field contrast were measured under low LED intensity (ca., 10% setpoint on LED controller) and a higher microwave power (−5 dBm or 0.3 mW). Therefore, all CW ODMR spectra were collected at the above conditions for a relative comparison. The LED power was estimated using a PM400 Optical Power Meter and an S401C Thermal Power Sensor Head (both from ThorLabs Inc.). Results of these power measurements are shown in Supplementary Figure S2 of Supplemental Information. A power density of ≈16 mW/mm2 was estimated for the 10% LED setpoint and 40× magnification was used for these measurements. ODMR spectra were fitted to a superposition of two Lorentzian functions to determine full width at half maximum (FWHM) of the signals and the strain parameter E.
T 1 relaxation measurements
For T 1 relaxation measurements, light excitation pulses were generated by the pE-300 white LED triggered by an arbitrary waveform generator (AWG) (SDG1025, Siglent Technologies NA, Inc., Solon, OH, United States). The optical excitation and emission filters for T 1 measurements were kept the same as in CW ODMR experiments. In a typical measurement, the NV− spins were initialized with a several ms pulse which length was optimized to ensure full polarization. The optimization consisted of monitoring the polarization buildup trace (the signal output of the APD) as a function of the initialization pulse length. The pulse duration at which no further buildup of the polarization was observed is then chosen for the initialization pulse. This initialization pulse was followed by a progressively incremented delay time t. The signal collected during the first ∼100 µs of the next initialization pulse was linearly extrapolated to determine the signal decay after the preceding pulse. Equation 1 was used to quantify the fluorescence intensity I as an output voltage of the APD as a function of the delay time t and fitted to a stretched exponential function containing a baseline term:
where I
polarized is the maximum increase of fluorescence due to light polarization, B is a parameter to account for a slow linear baseline drift, and I
relaxed represents the fluorescence signal in the fully relaxed state (i.e.,
We also define a T
1 contrast parameter (
This contrast is used as a metric to compare the amounts of optically induced NV polarization for different samples.
Continuous wave electron paramagnetic resonance
Continuous Wave EPR spectra were measured at X-band (9.87 GHz) using a Bruker Elexys-II E500 spectrometer (Bruker Biospin, Billerica, MA United States) equipped with a Super High Sensitivity Probehead installed at North Carolina State University (Raleigh, NC, United States). Spin concentrations were estimated by comparing double integrals of g ≈ 2.0 EPR signals with that of a reference sample of 1 µm diamond particles containing an estimated 3.5 × 10¹⁸ spins/g of primary defects and 9.7 × 10¹⁶ spin/g of NV− (Adámas Nanotechnologies, Raleigh, NC, United States). Spline interpolated baseline corrections of EPR spectra were carried out using XEpr software (Bruker) or MATLAB® (The MathWorks, Inc., Natick, MA United States) using the baseline fit function (Mathworks, 2024) as needed. NV− spin concentrations were estimated from double integration of the best fits of the experimental g ≈ 4.2 (i.e., half-field) spectra using EasySpin software (Stoll and Schweiger, 2006) instead of direct double integration due to a low signal-to-noise ratio of these EPR spectra corresponding to forbidden transitions.
Estimation of thermal activation energies of defect annihilation from EPR spectra
Activation energies of annihilation of EPR-active defects were estimated from sample mass-normalized EPR double integrated intensities measured for samples after the annealing treatments for a set of temperatures and the annealing periods. We assume that temperature ramping time is short relative to the duration of the annealing and that defect annihilation occurs only during the annealing period, hence, the duration of the annealing,
Both first and second order annihilation mechanisms were investigated. For the first order mechanism, the rate of annihilation of species X is given by Equation 3 and the corresponding integrated rate law by Equation 4, where [X0] is the initial concentration, and
Thus, a plot of
Once rate constants
Where
Photoluminescence (PL) characterization
Photoluminescence (PL) spectra of particles were collected under continuous blue illumination (470/20 nm excitation filter) provided from the same pE-300 white LED. This excitation wavelength was selected because it allows for simultaneous monitoring of NV and NVN related emissions. Specifically, the ratio of the PL intensities at 520 nm and 638 nm, corresponding to the NVN and NV− center emissions, respectively, was monitored as a function of the annealing temperature and time.
NV thermometry noise level measurement
Ambient temperature was monitored over the course of 1 h using either the 900 °C–2 h starting particles or the 1700 °C–5 min annealed particles. Measurements were recorded under high LED light intensity (30% setpoint) and low microwave power (−15 dBm). A previously published frequency jump modulation scheme (Singam et al., 2020) was used with our in-house instrument configuration to record the temperature. To estimate the noise level of the measurement, the raw temperature signals (Supplementary Figure S4, Supplementary Information) were corrected with a baseline spline to remove slow temperature drifts from the recorded data. Then, the noise level of the measurement was estimated by calculating standard deviations (σ) of the residual temperature fluctuations for each sample.
Results and discussion
Continuous wave EPR at X-band
There are two regions of interest in the EPR spectra of the diamond particles: (1) a region at g ≈ 2.00 and (2) a half-field ‘forbidden transition’ region at g ≈ 4.20–4.30. The strongest signal in the primary defect g ≈ 2.00 region for the type 1b diamond used in this study originates from P1 center corresponding to substitutional nitrogen atoms although other half-integer spins such as dangling bonds (S = 1/2) and vacancies (S = 3/2) (Shames et al., 2002; Shames et al., 2015; Shames et al., 2023) are also expected to contribute. The latter ‘non-P1’ EPR lines overlap with the central nitrogen hyperfine component of the P1 signal. P1 centers and the other paramagnetic defects in this g ≈ 2.00 region are referred to as the primary defects. Representative room temperature EPR spectra of the diamond particles before and after 30 min high temperature annealing treatments at 1400 °C, 1500 °C, and 1600 °C in the primary defect region are shown in Figures 2a–c. The most notable observation is a narrowing of the EPR lines after annealing at 1500 °C and higher. This is attributed to the removal of some of the aforementioned “non-P1” related centers and a reduction in P1 center concentration as indicated by a sharpening of the outer lines corresponding to P1
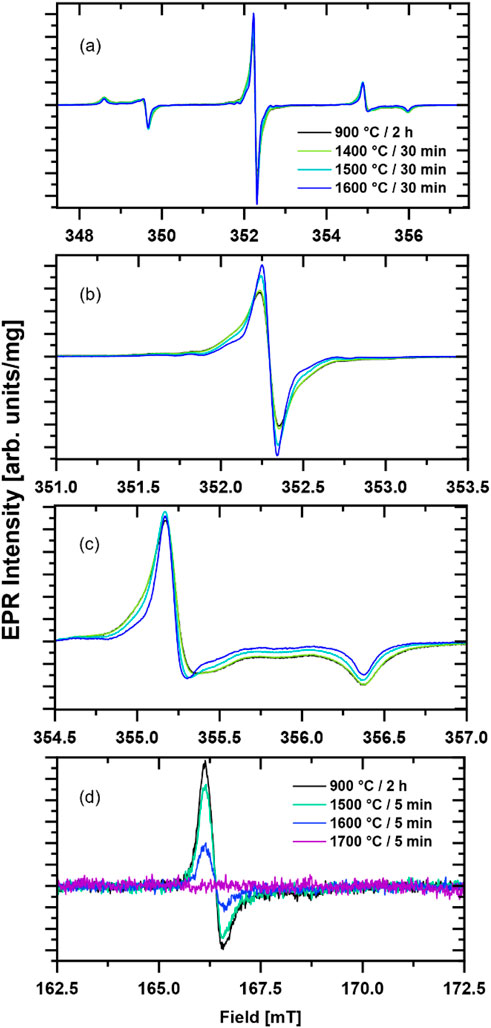
Figure 2. Mass-normalized experimental X-band CW EPR spectra of 3 µm diamond particles following 30 min annealing at specified temperature are compared to that of the initial particles annealed at 900 °C for 2 h. The spectrum in the g ≈ 2.00 region is shown as (a), (b) is a zoom-in of the central
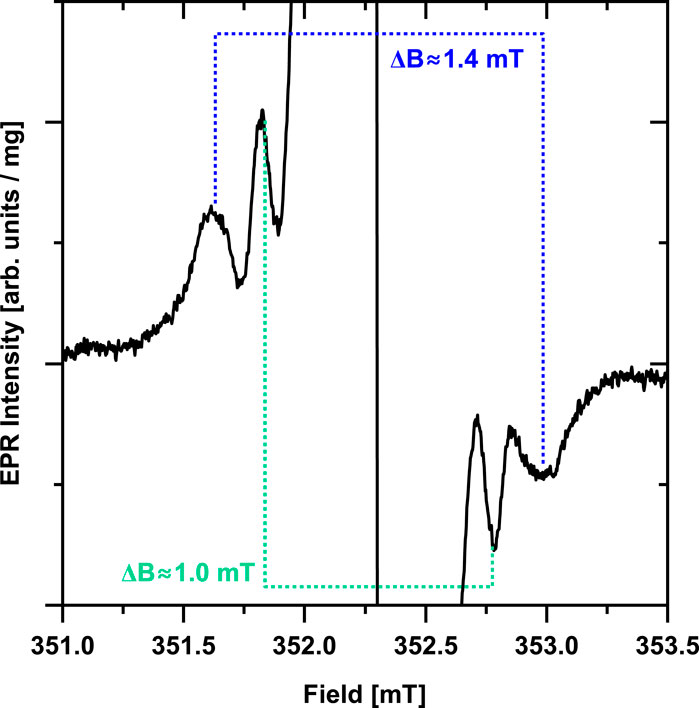
Figure 3. Zoom in on the g ≈ 2.00 region of the primary defect EPR signal of the 1600 °C/30 min annealed sample (black trace). Two pairs of weaker lines with separations of ≈1.0 mT and ≈1.4 mT are observed. These lines are likely hyperfine splitting on 13C present in the diamond lattice in natural abundance (1.1%) which become resolvable due to narrowing of the primary defect lines after high temperature annealing.
Estimated P1, primary, and NV defect contents (in ppm) from double integration of spectra are summarized in Table 1. Estimated primary and NV defect concentrations are additionally plotted as a function of the annealing time for different temperatures in Figures 4a,b, correspondingly. A reduction in P1 concentration from ≈50 to ≈20 ppm is observed as the annealing temperature and duration are increased. It should be noted that the estimated P1 content in the starting particles was lower than for typical type 1b diamond, but this is because the particles were previously irradiated and initially annealed at a lower (i.e., 900 oC) temperature (Shames et al., 2017b; Nunn et al., 2022). The fraction of P1 in the total paramagnetic defects observed by EPR increased from about 87% in the initial particles (900 °C/2 h) to about 94% after 1700 °C–5 min annealing. Because of the dominance of P1 centers among all the paramagnetic defects, the primary effect of the high temperature annealing of these 3 µm particles is mostly likely related to a dissolution of P1 centers at ca. 1400 °C–1500 °C and higher temperatures. Annealing of type 1b bulk diamond in this temperature range can result in an aggregation of substitutional nitrogen to form Nitrogen-Nitrogen (N-N) pairs (the so-called, A-centers) (Collins, 1980; Jones et al., 2015; Collins et al., 2005; Collins, 1979). The presence of vacancies (e.g., those formed upon irradiation) could accelerate nitrogen aggregation (Collins, 1980).
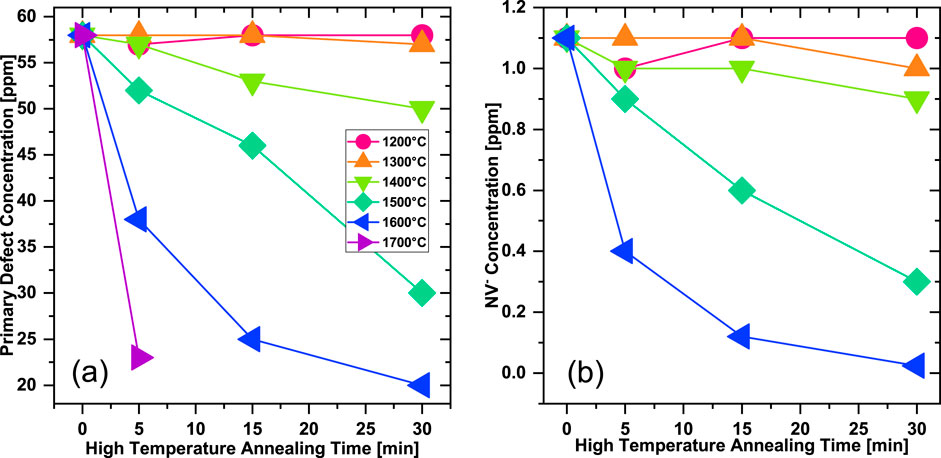
Figure 4. Concentration of (a) primary defects and (b) NV− centers derived from quantitative EPR measurements as a function of the annealing time for annealing temperatures from 1200 °C to 1700 °C. Color coding of the temperatures is shown as an insert in (a). Initial defect concentrations (0 minutes) are for the particles after e-beam irradiation and annealing at 900 °C for 2 h. Annealing at 1700 °C resulted in a significant loss of the particles yielding quantities insufficient for EPR detection of NV−.
A second magnetic field region of interest is g ≈ 4, where forbidden (Δm s = 2) half-field transitions of the NV− center are detected (Segawa and Shames, 2020). Some representative EPR spectra are shown in Figure 2d. A substantial reduction in the half-field signal intensity is observed with increasing annealing temperature. The signal becomes comparable with noise after annealing for 30 min at 1600 °C (not shown) and is undetectable for the sample annealed for 5 min at 1700 °C (Figure 2d, magenta EPR spectrum was recorded by averaging signal for 10 min at room temperature with 8.9 mg of sample.
The primary defects EPR signal is dominated by P1 centers for which the main mechanism of annihilation upon high temperature annealing is migration and aggregation of nitrogen defects to form N-N pairs that bear no unpaired electron and are EPR silent. Formation of N-N pairs is expected to follow second order kinetics given by Equations 5 and 6 (Chrenko et al., 1977; Evans and Qi, 1982). The second order rate constants can be estimated from the plots shown in Figure 5a and the corresponding Arrhenius plot is presented in Figure 5b yielding an estimated activation energy of E a(P1) = 3.63 ± 0.28 eV.
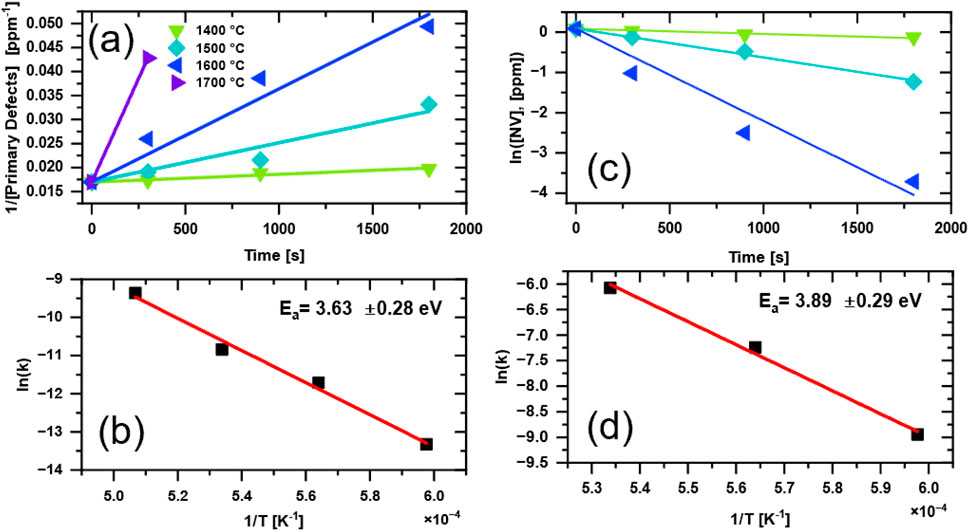
Figure 5. Analysis of the annealing kinetics and the corresponding Arrhenius plots for primary defect (a,b) and NV− centers (c,d). For the primary defects, second order kinetics are assumed, while first order kinetics are assumed for the NV centers. Spin concentrations were estimated from CW EPR (See Table 1). Note that the 1200 °C and 1300 °C temperatures were excluded, since the EPR results indicated no substantiative changes in the spin concentrations at those temperatures. Symbols of the same shape and color were used for (a) and (c) and the annealing temperatures are shown as an insert in (a). See text for details.
Analysis of changes in NV− concentration upon high temperature annealing showed that a first order kinetic model fits the limited set of data well (Figure 5c). The corresponding Arrhenius plot in Figure 5d yields an estimated activation energy E a(NV−) = 3.89 ± 0.29 eV. These estimated values lie between that of vacancy migration energy of 2.6 eV (Davies et al., 1992) and vacancy assisted nitrogen migration of 4.5 eV (Mainwood, 1994). The close values of E a(P1) and E a(NV−) may indicate that the reaction rate are dominated by the same temperature activated diffusion process in the diamond lattice, such as vacancy assisted nitrogen migration. Speculation on the mechanisms at play are beyond the scope of the current data and discussion; however, these results provide some insights into defect formation/annihilation kinetics in particulate diamond. One challenge with utilizing X-band EPR for studying diamond particles is low spectral resolution in the primary defects in the g ≈ 2.00 region where signals from different defects overlap and are also inhomogeneously broadened by orientational averaging in the magnetic field.
Photoluminescence (PL)
Changes in luminescent centers were monitored by PL spectroscopy. Two signals of interest are the peaks at 520 and 638 nm. These lines correspond to a sideband of the H3 (NVN) and/or Ni-related centers and the zero-phonon line (ZPL) of the NV− center, respectively (Zaitsev, 2001). Figure 6a shows representative PL emission spectra of the diamond particles under blue light excitation for 30 min annealing treatments in the temperature range of 1400 °C–1800 °C as compared with the starting particles. This range of temperatures is where the most significant PL changes are observed. Figure 6b shows the ratio of the 638 nm ZPL corresponding to the NV- center to the 520 nm peak relative to the starting particles (900 °C–2 h). Increase in the annealing temperature results in a growth of the 520 nm line along with a suppression of NV− line. This is indicative of a formation of H3 centers and/or Ni-related centers. A progressive decrease in the NV fluorescence emission with higher temperature annealing was observed. An example of a decrease in the fluorescence output for the 1600 °C annealing series is shown in Supplementary Figure S3 (Supplemental Information).
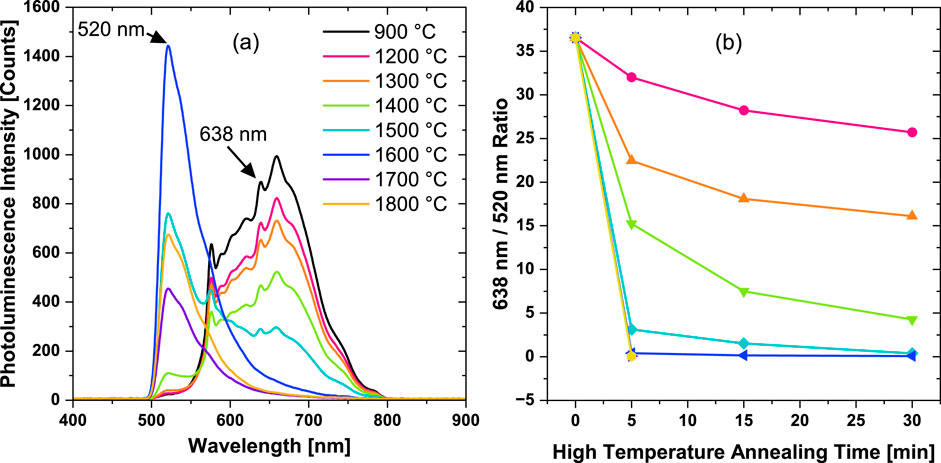
Figure 6. Photoluminescence spectra of 3 µm diamond particles under blue excitation after either 5 min (1700 °C and 1800 °C) or 30 min (series of temperatures from 1200 °C to 1600 °C) annealing (a). Color coding of the temperatures is shown as an insert in (a). (b) E Ratios of the PL intensities at 638 nm (NV− zero phonon line) to the intensities at 520 nm (H3 and Ni Related Center) for all the annealing treatments and durations (b). The ratio for the particles after e-beam irradiation and annealing at 900 °C for 2 h was used as a starting point (0 min high temperature annealing time). Lines are added as guides for the eye.
Optically detected magnetic resonance and T 1 relaxation
Figure 7 shows representative NV− ODMR spectra (a) and three parameters derived from such spectra: (1) the contrast (b), (2) the strain splitting E (c), and (3) the linewidth (d). The following trends were observed: a progressive increase in the ODMR contrast starting with annealing temperatures of ≈1400 °C (Figure 7a,b); a decrease in the strain (E) at 1500 °C annealing and higher (Figure 7C); a decrease in the linewidth at the annealing temperatures of 1500 °C and above (Figure 7d). We note that the particles annealed at 1800 °C fall out of most of these trends. This is likely attributed to considerable structural damage/rearrangements of the diamond crystal structure resulting from an extensive graphitization at this temperature. Thus, high temperature annealing at temperatures as high as ≈1700 oC improves NV− spin properties that manifest in enhancing ODMR contrast and reducing ODMR linewidth and the strain. The temperature onset of these improvements tends to coincide with the range where changes in EPR spectra and spin concentrations were also observed–generally, at 1500 °C and above (Table 1).
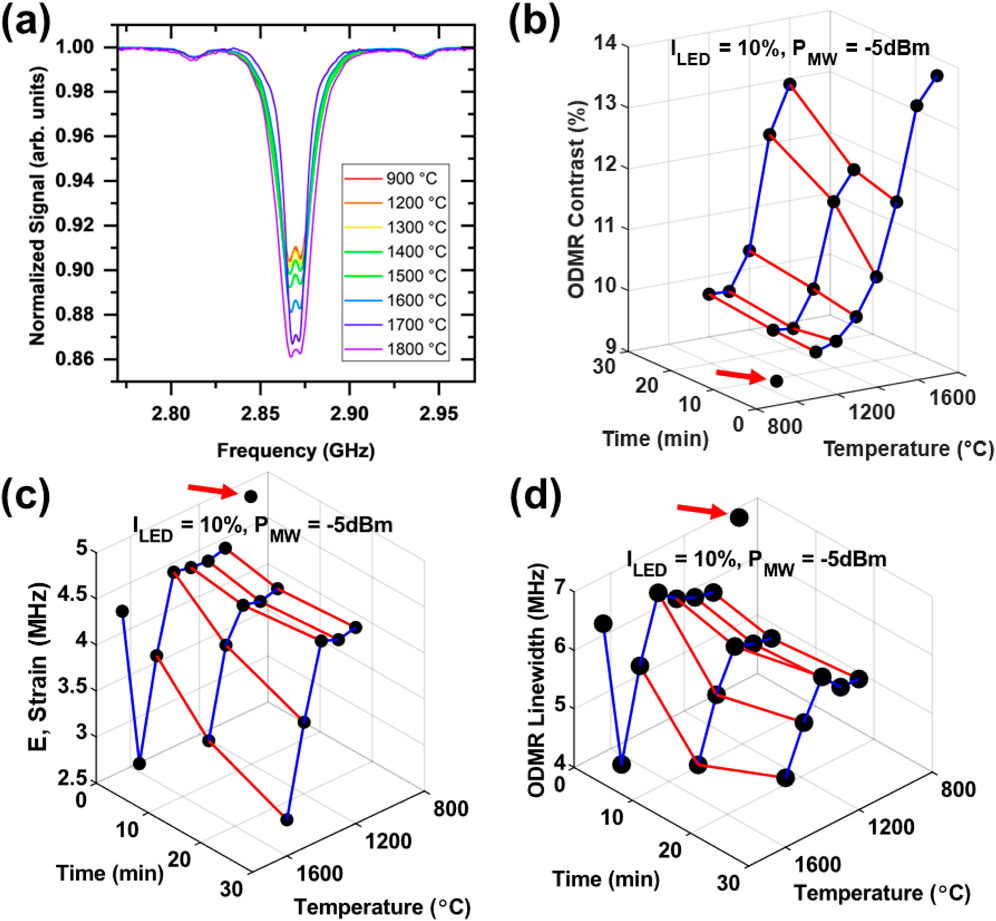
Figure 7. CW ODMR characterization of the annealed diamond particles. Representative ODMR spectra after 5 min annealing treatments (a). ODMR spectral contrast (b), strain (E-parameter) (c), and full width at half maximum (FWHM) linewidth (d) as a function of treatment time and temperature. Black dots denoted with red arrows in (b–d) are the 900 °C/2 h annealed starting particles.
We speculate that the observed changes in ODMR spectra upon annealing at high temperatures are attributed to several factors. The first factor is a decrease in dipolar interaction between NV− and other paramagnetic species present as the concentration of the latter decreases significantly upon annealing. This would result in an increased T 2 * and a reduced ODMR linewidth (Bauch et al., 2020). The second factor can be a reduced lattice strain, reflected by the strain parameter E, due to aggregation of nitrogen (Jones et al., 2015; Dobrinets et al., 2013). The NV− center is an axially symmetric defect, and for such defects in the absence of external electric fields, the E parameter in ZFS spin Hamiltonian (Equation 9) should be zero, but off-axis strains in the lattice may distort the defect symmetry (Rondin et al., 2014).
In Equation 9 S = 1 for the ground triplet state, D is the axial ZFS parameter (≈2.87 GHz), E is the off-axis ZFS strain parameter,
ODMR relaxation measurements for NV− centers showed T 1 relaxation times within a narrow range from ca. 2.5–5 ms for all the samples, with longer T 1 being observed for the samples annealed at higher temperatures. Annealing below ca. 1400 °C had a limited impact on the T 1 times. Thus, as with CW ODMR data, T 1 only seems to be affected when the annealing temperature and time are sufficient for nitrogen mobility. NV− T 1 relaxation at room temperature is predominantly caused by intrinsic processes such as phonon interactions and cross-relaxation effects between NVs and other spins (Jarmola et al., 2012). Thus, the observed increases in T 1 are likely a result of a reduced concentration of NV and other spins after annealing at higher temperatures. Figure 8 examines T 1 contrast (Equation 2) and T 1 relaxation times for existence of a linear correlation. We note that the T 1 contrast is an approximate measure of spin polarization, and, therefore, a positive correlation with the T 1 times is expected. Again, the poor contrast of the 1800 °C annealed sample is probably a result of a significant graphitization, and we speculate that annealing treatments at this and higher temperatures are not increasingly beneficial for particles of this size.
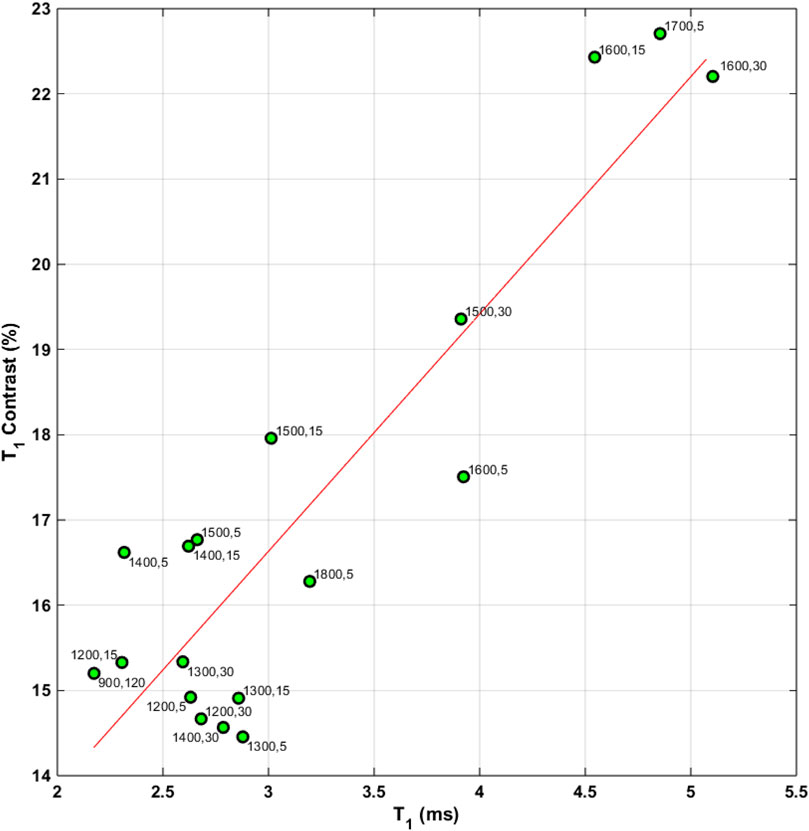
Figure 8. T 1 contrast defined by Equation 2 as a function of T 1 relaxation times for the various annealing temperatures.
Impact of annealing on NV−thermometry noise level
Thermometry of NV− defects in diamond is based on dependence of the triplet ground state ZFS parameter D ≈ 2.87 GHz on temperature. The ZFS decreases linearly with temperature with a proportionality constant
To demonstrate the benefits of high temperature annealing for NV− thermometry using diamond particles, we have chosen to compare the particles annealed at 1700 °C for 5 min with the initial particles annealed for 2 h at 900 °C. The former particles exhibited the highest magnetic field contrast and the narrowest lines in the ODMR spectrum among all the samples characterized here. Figure 9 compares temperature recordings for the two samples and the noise floor for the particles at 1700 °C for 5 min is clearly lower. An improvement of temperature precision measurement, defined as (σ900 °C/σ1700 °C - 1) × 100% ≈ 77% was observed. For the 1700 °C - 5 min annealed particles the contrast was improved by ca. 32% while the linewidth decreased also by ≈ 24%. Then the slopes at the inflection pointes, as discussed earlier, increased by a factor of ((1 + 0.32)/(1 - 0.24)) ≈ 1.74 resulting in ca. 74% improvement in temperature precision. This predicted value closely aligns with 77% improvement observed experimentally.
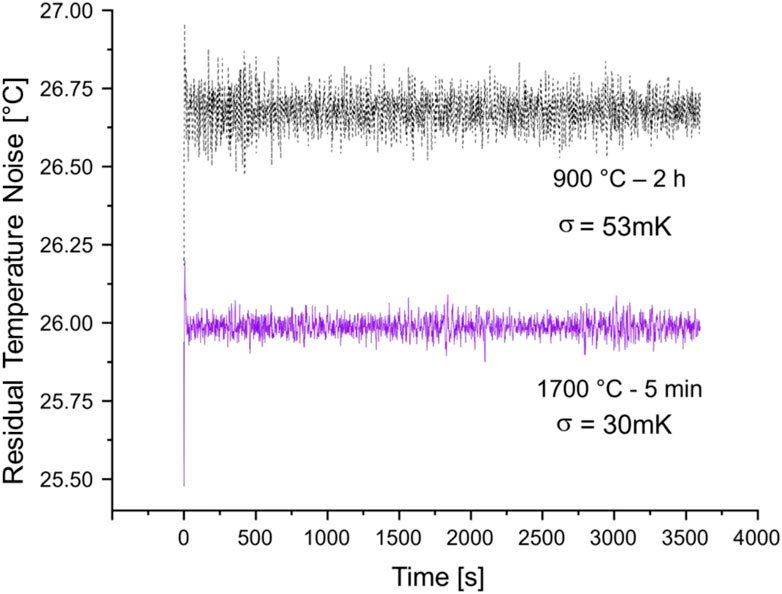
Figure 9. Residual temperature fluctuations of the NV− thermometer after monitoring ambient temperature for 1 h with either the starting particles (900 °C–2 h) (black, dashed trace) or high temperature annealed particles (1700 °C–5 min) (purple, solid trace) after baseline subtraction of the raw signal (Supplementary Figure S4, Supplemental Information).
Conclusion
A comprehensive analysis of high temperature annealing treatments of 3 µm fluorescent diamond particles and the impacts of such treatments on NV− spin properties was carried out. Annealing in the temperature range of ca. 1400 °C–1800 °C results in substantial changes to the concentrations of NV− centers as well as P1 centers. Quantitative CW EPR data on concentration of NV− and P1 centers for the series the annealed samples were analyzed to estimate activation energies for the annihilation of NV− centers and the aggregation of P1 centers to form A-centers (N-N pairs). The activation energies of 3.89 eV and 3.63 eV for each process are remarkably similar. We speculate that this may be an indication of the same limiting step in the defect annihilation such as temperature-activated defect migration through the diamond lattice. The activation energies reported here fall in between literature values of vacancy diffusion (ca. 2.3 eV41) and vacancy-assisted nitrogen migration (ca., 4.5 eV42) although the latter values were measured at lower temperatures. NV− spin properties were also assessed with CW ODMR and ODMR T
1 relaxometry. Overall, NV− spin properties improve by increasing the annealing temperatures from 1400 °C to 1700 °C. These improvements include a reduced ODMR linewidth, a decrease in the zero-field splitting strain parameter
Data availability statement
The raw data supporting the conclusions of this article will be made available by the authors, without undue reservation.
Author contributions
NN: Writing – review and editing, Investigation, Conceptualization, Formal Analysis, Writing – original draft, Methodology. AM: Investigation, Formal Analysis, Data curation, Writing – review and editing, Methodology. MT: Writing – review and editing. AS: Resources, Writing – review and editing, Funding acquisition, Supervision. OS: Supervision, Funding acquisition, Resources, Writing – review and editing.
Funding
The authors declare that financial support was received for the research and/or publication of this article. NN gratefully acknowledges the support of the Goodnight Doctoral Fellowship during his thesis research at NCSU. Research reported in this publication was supported by the National Institute of General Medical Sciences of the National Institutes of Health under Award Number R01GM143626 and by Department of Energy under Award Number DE_SC0022441. The content is solely the responsibility of the authors and does not necessarily represent the official views of the National Institutes of Health or the Department of Energy. EPR instrumentation at NCSU was supported by grants from the National Institutes of Health (nos. RR023614 and S10OD032355), the National Science Foundation (no. CHE-0840501), and NCBC (no. 2009-IDG-1015).
Conflict of interest
Authors NN, AM, MT, and OS were employed by Adámas Nanotechnologies, Inc.
The remaining author declares that the research was conducted in the absence of any commercial or financial relationships that could be construed as a potential conflict of interest.
Generative AI statement
The authors declare that no Generative AI was used in the creation of this manuscript.
Any alternative text (alt text) provided alongside figures in this article has been generated by Frontiers with the support of artificial intelligence and reasonable efforts have been made to ensure accuracy, including review by the authors wherever possible. If you identify any issues, please contact us.
Publisher’s note
All claims expressed in this article are solely those of the authors and do not necessarily represent those of their affiliated organizations, or those of the publisher, the editors and the reviewers. Any product that may be evaluated in this article, or claim that may be made by its manufacturer, is not guaranteed or endorsed by the publisher.
Supplementary material
The Supplementary Material for this article can be found online at: https://www.frontiersin.org/articles/10.3389/frqst.2025.1709220/full#supplementary-material
References
Acosta, V. M., Bauch, E., Ledbetter, M. P., Waxman, A., Bouchard, L. S., and Budker, D. (2010). Temperature dependence of the nitrogen-vacancy magnetic resonance in diamond. Phys. Rev. Lett. 104 (7), 070801. doi:10.1103/PhysRevLett.104.070801
Aslam, N., Zhou, H., Urbach, E. K., Turner, M. J., Walsworth, R. L., Lukin, M. D., et al. (2023). Quantum sensors for biomedical applications. Nat. Rev. Phys. 5 (3), 157–169. doi:10.1038/s42254-023-00558-3
Barklie, R. C., and Guven, J. (1981). 13C hyperfine structure and relaxation times of the P1 centre in diamond. J. Phys. C Solid State Phys. 14 (25), 3621–3631. doi:10.1088/0022-3719/14/25/009
Bauch, E., Singh, S., Lee, J., Hart, C. A., Schloss, J. M., Turner, M. J., et al. (2020). Decoherence of ensembles of nitrogen-vacancy centers in diamond. Phys. Rev. B 102 (13), 134210. doi:10.1103/PhysRevB.102.134210
Breeding, C. M., and Shigley, J. E. (2009). The “type” classification system of diamonds and its importance in gemology. Gems and Gemology 45 (2), 96–111. doi:10.5741/gems.45.2.96
Bruckmaier, F., Allert, R. D., Neuling, N. R., Amrein, P., Littin, S., Briegel, K. D., et al. (2023). Imaging local diffusion in microstructures using NV-based pulsed field gradient NMR. Sci. Adv. 9 (33), eadh3484. doi:10.1126/sciadv.adh3484
Bucher, D. B., Glenn, D. R., Park, H., Lukin, M. D., and Walsworth, R. L. (2020). Hyperpolarization-enhanced NMR spectroscopy with femtomole sensitivity using quantum defects in diamond. Phys. Rev. X 10 (2), 021053. doi:10.1103/PhysRevX.10.021053
Capelli, M., Lindner, L., Luo, T., Jeske, J., Abe, H., Onoda, S., et al. (2022). Proximal nitrogen reduces the fluorescence quantum yield of nitrogen-vacancy centres in diamond. New J. Phys. 24 (3), 033053. doi:10.1088/1367-2630/ac5ca9
Chrenko, R. M., Tuft, R. E., and Strong, H. M. (1977). Transformation of the state of nitrogen in diamond. Nature 270 (5633), 141–144. doi:10.1038/270141a0
Collins, A. T. (1979). High-temperature annealing of electron-irradiated type-I diamond. Bristol, United Kingdom: Institute of Physics. (46), 372–333. Available online at: https://inis.iaea.org/records/sehvj-8qc77
Collins, A. T. (1980). Vacancy enhanced aggregation of nitrogen in diamond. J. Phys. C Solid State Phys. 13 (14), 2641–2650. doi:10.1088/0022-3719/13/14/006
Collins, A. T., Connor, A., Ly, C.-H., Shareef, A., and Spear, P. M. (2005). High-temperature annealing of optical centers in type-I diamond. J. Appl. Phys. 97 (8), 083517. doi:10.1063/1.1866501
Davies, G., Lawson, S. C., Collins, A. T., Mainwood, A., and Sharp, S. J. (1992). Vacancy-related centers in diamond. Phys. Rev. B 46 (20), 13157–13170. doi:10.1103/PhysRevB.46.13157
Dei Cas, L., Zeldin, S., Nunn, N., Torelli, M., Shames, A. I., Zaitsev, A. M., et al. (2019). From fancy blue to red: controlled production of a vibrant color spectrum of fluorescent diamond particles. Adv. Funct. Mater. 0 (0), 1808362. doi:10.1002/adfm.201808362
Dobrinets, I. A., Vins, V. G., and Zaitsev, A. M. (2013). “HPHT-induced transformations,” in HPHT-treated diamonds: diamonds forever (Berlin Heidelberg: Springer), 39–86.
Evans, T., and Qi, Z. (1982). The kinetics of the aggregation of nitrogen atoms in diamond. Proc. R. Soc. Lond. Ser. A, Math. Phys. Sci. 381 (1780), 159–178. doi:10.1098/rspa.1982.0063
Gierth, M., Krespach, V., Shames, A. I., Raghavan, P., Druga, E., Nunn, N., et al. (2020). Enhanced optical 13C hyperpolarization in diamond treated by high-temperature rapid thermal annealing. Adv. Quantum Technol. 3 (10), 2000050. doi:10.1002/qute.202000050
Hall, L. T., Kehayias, P., Simpson, D. A., Jarmola, A., Stacey, A., Budker, D., et al. (2016). Detection of nanoscale electron spin resonance spectra demonstrated using nitrogen-vacancy centre probes in diamond. Nat. Commun. 7 (1), 10211. doi:10.1038/ncomms10211
Havlik, J., Petrakova, V., Rehor, I., Petrak, V., Gulka, M., Stursa, J., et al. (2013). Boosting nanodiamond fluorescence: towards development of brighter probes. Nanoscale 5 (8), 3208–3211. doi:10.1039/C2NR32778C
Healey, A. J., Stacey, A., Johnson, B. C., Broadway, D. A., Teraji, T., Simpson, D. A., et al. (2020). Comparison of different methods of nitrogen-vacancy layer formation in diamond for wide-field quantum microscopy. Phys. Rev. Mater. 4 (10), 104605. doi:10.1103/PhysRevMaterials.4.104605
Holzgrafe, J., Gu, Q., Beitner, J., Kara, D., Knowles, H. S., and Atatüre, M. (2020). Nanoscale NMR spectroscopy using self-calibrating nanodiamond quantum sensors. Phys. Rev. Applied 13 (4), 044004. doi:10.1103/PhysRevApplied.13.044004
Jarmola, A., Acosta, V. M., Jensen, K., Chemerisov, S., and Budker, D. (2012). Temperature- and magnetic-field-dependent longitudinal spin relaxation in nitrogen-vacancy ensembles in diamond. Phys. Rev. Lett. 108 (19), 197601. doi:10.1103/PhysRevLett.108.197601
Jones, R. G. J. P., Pinto, H., and Palmer, D. (2015). Diffusion of nitrogen in diamond and the formation of A-centres. Diam. Relat. Mater. 53, 35. doi:10.1016/j.diamond.2015.01.002
Luo, T., Lindner, L., Langer, J., Cimalla, V., Vidal, X., Hahl, F., et al. (2022). Creation of nitrogen-vacancy centers in chemical vapor deposition diamond for sensing applications. New J. Phys. 24 (3), 033030. doi:10.1088/1367-2630/ac58b6
Mainwood, A. (1994). Nitrogen and nitrogen-vacancy complexes and their formation in diamond. Phys. Rev. B 49 (12), 7934–7940. doi:10.1103/PhysRevB.49.7934
Mathworks (2024). Baseline fit; MATLAB central file exchange. Available online at: https://www.mathworks.com/matlabcentral/fileexchange/24916-baseline-fit (Accessed February 29, 2024).
Naydenov, B., Reinhard, F., Lämmle, A., Richter, V., Kalish, R., D’Haenens-Johansson, U. F. S., et al. (2010). Increasing the coherence time of single electron spins in diamond by high temperature annealing. Appl. Phys. Lett. 97 (24), 242511. doi:10.1063/1.3527975
Nunn, N., Milikisiyants, S., Danilov, E. O., Torelli, M. D., Dei Cas, L., Zaitsev, A., et al. (2022). Electron irradiation-induced paramagnetic and fluorescent defects in type Ib high pressure–high temperature microcrystalline diamonds and their evolution upon annealing. J. Appl. Phys. 132 (7), 075106. doi:10.1063/5.0103313
Nunn, N., Milikisiyants, S., Torelli, M. D., Monge, R., Delord, T., Shames, A. I., et al. (2023). Optical and electronic spin properties of fluorescent micro- and nanodiamonds upon prolonged ultrahigh-temperature annealing. J. Vac. Sci. and Technol. B 41 (4), 042206. doi:10.1116/6.0002797
Nunn, N., Milikisiyants, S., Torelli, M. D., Healey, A., Styles, R., Johnson, B. C., et al. (2025). Electronic spin relaxation and clustering in high-pressure high-temperature synthesized microcrystalline diamond particles with reduced nitrogen content. J. Phys. Chem. C 129 (15), 7493–7507. doi:10.1021/acs.jpcc.5c00471
Qin, Z., Wang, Z., Kong, F., Su, J., Huang, Z., Zhao, P., et al. (2023). In situ electron paramagnetic resonance spectroscopy using single nanodiamond sensors. Nat. Commun. 14 (1), 6278. doi:10.1038/s41467-023-41903-5
Rembold, P., Oshnik, N., Müller, M. M., Montangero, S., Calarco, T., and Neu, E. (2020). Introduction to quantum optimal control for quantum sensing with nitrogen-vacancy centers in diamond. AVS Quantum Sci. 2 (2), 024701. doi:10.1116/5.0006785
Rondin, L., Tetienne, J. P., Hingant, T., Roch, J. F., Maletinsky, P., and Jacques, V. (2014). Magnetometry with nitrogen-vacancy defects in diamond. Rep. Prog. Phys. 77 (5), 056503. doi:10.1088/0034-4885/77/5/056503
Segawa, T. F., and Shames, A. I. (2020). How to identify, attribute, and quantify triplet defects in ensembles of small nanoparticles. J. Phys. Chem. Lett. 11 (17), 7438–7442. doi:10.1021/acs.jpclett.0c01922
Shames, A. I., Panich, A. M., Kempiński, W., Alexenskii, A. E., Baidakova, M. V., Dideikin, A. T., et al. (2002). Defects and impurities in nanodiamonds: EPR, NMR and TEM study. J. Phys. Chem. Solids 63 (11), 1993–2001. doi:10.1016/S0022-3697(02)00185-3
Shames, A. I., Osipov, V. Y., Boudou, J. P., Panich, A. M., Bardeleben, H. J. v., Treussart, F., et al. (2015). Magnetic resonance tracking of fluorescent nanodiamond fabrication. J. Phys. D. Appl. Phys. 48 (15), 155302. doi:10.1088/0022-3727/48/15/155302
Shames, A. I., Osipov, V. Y., Bogdanov, K. V., Baranov, A. V., Zhukovskaya, M. V., Dalis, A., et al. (2017a). Does progressive nitrogen doping intensify negatively charged nitrogen vacancy emission from e-Beam-Irradiated Ib type high-pressure–high-temperature diamonds? J. Phys. Chem. C 121 (9), 5232–5240. doi:10.1021/acs.jpcc.6b12827
Shames, A. I., Smirnov, A. I., Milikisiyants, S., Danilov, E. O., Nunn, N., McGuire, G., et al. (2017b). Fluence-dependent evolution of paramagnetic triplet centers in e-Beam irradiated microcrystalline Ib type HPHT diamond. J. Phys. Chem. C 121 (40), 22335–22346. doi:10.1021/acs.jpcc.7b06514
Shames, A. I., Zegrya, G. G., Samosvat, D. M., Osipov, V. Y., and Vul, A. Y. (2023). Size effect in electron paramagnetic resonance spectra of impurity centers in diamond particles. Phys. E Low-Dimensional Syst. Nanostructures 146, 115523. doi:10.1016/j.physe.2022.115523
Shenderova, O. A., Nunn, N. A., Torelli, M. D., McGuire, G. E., Shames, A. I., and Zaitsev, A. M. (2020). Toward production of diamond particles with improved fluorescence uniformity. Phys. B Condens. Matter 579, 411868. doi:10.1016/j.physb.2019.411868
Singam, S. K. R., Nesladek, M., and Goovaerts, E. (2020). Nitrogen-vacancy nanodiamond based local thermometry using frequency-jump modulation. Nanotechnology 31 (10), 105501. doi:10.1088/1361-6528/ab5a0c
Stoll, S., and Schweiger, A. (2006). EasySpin, a comprehensive software package for spectral simulation and analysis in EPR. J. Magn. Reson. 178 (1), 42–55. doi:10.1016/j.jmr.2005.08.013
Tetienne, J. P., de Gille, R. W., Broadway, D. A., Teraji, T., Lillie, S. E., McCoey, J. M., et al. (2018). Spin properties of dense near-surface ensembles of nitrogen-vacancy centers in diamond. Phys. Rev. B 97 (8), 085402. doi:10.1103/PhysRevB.97.085402
Torelli, M. D., Nunn, N. A., Jones, Z. R., Vedelaar, T., Padamati, S. K., Schirhagl, R., et al. (2020). High temperature treatment of diamond particles toward enhancement of their quantum properties. Front. Phys. 8 (205), 205. doi:10.3389/fphy.2020.00205
Wood, B. D., Stimpson, G. A., March, J. E., Lekhai, Y. N. D., Stephen, C. J., Green, B. L., et al. (2022). Long spin coherence times of nitrogen vacancy centers in milled nanodiamonds. Phys. Rev. B 105 (20), 205401. doi:10.1103/PhysRevB.105.205401
Yamamoto, T., Umeda, T., Watanabe, K., Onoda, S., Markham, M. L., Twitchen, D. J., et al. (2013). Extending spin coherence times of diamond qubits by high-temperature annealing. Phys. Rev. B 88 (7), 075206. doi:10.1103/PhysRevB.88.075206
Keywords: photoluminescence, optically detected magnetic resonance (ODMR), electron paramagnetic resonance (EPR), NV centers, high temperature annealing, quantum sensing, spin relaxation, diamond particles
Citation: Nunn N, Marek A, Torelli MD, Smirnov AI and Shenderova OA (2025) Optimizing ensemble NV− spin properties of fluorescent diamond microparticles by systematic low pressure high temperature annealing. Front. Quantum Sci. Technol. 4:1709220. doi: 10.3389/frqst.2025.1709220
Received: 19 September 2025; Accepted: 06 November 2025;
Published: 27 November 2025.
Edited by:
Alastair Stacey, RMIT University, AustraliaReviewed by:
Shingo Sotoma, Kyoto Institute of Technology, JapanThitinun Gas-osoth, University of Phayao, Thailand
Copyright © 2025 Nunn, Marek, Torelli, Smirnov and Shenderova. This is an open-access article distributed under the terms of the Creative Commons Attribution License (CC BY). The use, distribution or reproduction in other forums is permitted, provided the original author(s) and the copyright owner(s) are credited and that the original publication in this journal is cited, in accordance with accepted academic practice. No use, distribution or reproduction is permitted which does not comply with these terms.
*Correspondence: Nicholas Nunn, bm51bm5AYWRhbWFzbmFuby5jb20=; Olga A. Shenderova, b3NoZW5kZXJvdmFAYWRhbWFzbmFuby5jb20=