Abstract
COVID-19 had an impact not only on human health but also on consumers' food consumption. Employing the Almost Ideal Demand System (AIDS), this study analyzes whether consumers change their demand for food between 2019 and 2020 in Japan, where the legal action was not implemented to restrict consumer behavior. Using the home scan data, 25 food items, including eating out and delivery, were analyzed to see the impact of COVID-19. Results show that the increase in shares of expenditure is mainly related to consumption in the home in 2020, while that for eating out turned into a significant decrease. The estimated own price elasticity and expenditure elasticity of demand shows that ingredients for home cooking are more substitutive with eating out and more complementary within the ingredients in 2020.
Introduction
The coronavirus disease found in 2019 (hereafter, COVID-19) caused a global pandemic in 2020. Its impact has not been limited to people's health but also the health of the economy. The responses to the pandemic outbreak vary from country to country. Some countries, such as Europe, the United States, and China, took strict restrictive measures, some other countries, such as Japan, took moderate measures; and the other countries, such as Taiwan, took relatively lax measures (Weible et al., 2020; Hale et al., 2021). In Japan, the government declared a state of emergency between 7 April and 25 May 2020, but this declaration was not legally binding. Although the government would rather choose a voluntary-based request to stay home than legally bind people's behavior (Watanabe and Yabu, 2021), many people in Japan refrained from going out, and the amount of time of staying home did not differ from the other countries where strict measures were taken (Ritchie et al., 2020). Thus, even though the request is voluntary, the request to stay home had wide-ranging effects on economies in Japan, including energy, foreign exchange markets, trade, lifestyles, and tourism (Baldwin and Tomiura, 2020; Inoue and Todo, 2020; Kitamura et al., 2020; Narayan et al., 2020; Aruga, 2021; Watanabe and Yabu, 2021).
The impact of COVID-19 extends to consumers' food consumption behaviors and preferences. While changes in food consumption have been mainly reported in Europe, the United States, and Africa (Celik and Dane, 2020; Janssen et al., 2021; Caso et al., 2022), such changes also exist in Japan, focusing on nutritional aspects, including changes in children's nutritional balance associated with school closure (Horikawa et al., 2021), changes in consumption and dietary behavior (Qian et al., 2020; Hayashi and Takemi, 2021), and changes in dietary behavior including alcohol consumption (Nishijima et al., 2021). However, studies looking at changes in food consumption in a comprehensive manner are limited. Unlike countries where people were legally restricted except for shopping for essential goods or going for walks, Japan did not impose legal restraints. Many restaurants complied with requests for shorter hours and refraining from serving alcoholic beverages, but some of them did not comply with such requests and kept their normal operations because it was not illegal. Therefore, the Japanese countermeasures against COVID-19 were more in the hands of consumers; some consumers continued going out for a meal, others reduced their chances to go out and increased their chances to cook at home (Morita et al., 2020; Hayashi and Takemi, 2021). The Japanese request-based measures against COVID-19 gave consumers many options to choose, and made consumer behavior more complex, and thus the case of Japan is necessary to analyze more comprehensively, including foods from cooking materials at home to eating out.
In previous literature for economic studies, hedonic price analyses exist that measure the impact of lockdown policies and COVID-19 on food prices (Dietrich et al., 2021; Hillen, 2021; Ruan et al., 2021). The possibility of an impact of COVID-19 on food demand has also been discussed (Cranfield, 2020), but there are few empirical studies of the impact on food demand. A study examines online demand for food in Taiwan, which finds a 5.7% increase in sales and a 4.9% increase in customers when additional cases of COVID-19 confirm in the online food market in Taiwan (Chang and Meyerhoefer, 2021). There is also a study using demand system analysis that examines the impact of the lockdown on the demand for food losses before and after COVID-19 (Vargas-Lopez et al., 2021). However, no studies have analyzed the demand for food in general and its substitutive and complementary relationships. In the case of Japan, where the lockdown was not legally imposed, it is necessary to understand the impact of COVID-19 on food consumption, including the relationship between food items.
This study investigates whether Japanese consumers' food consumption demand changed between pre- and post-year of the beginning of the COVID-19 outbreak in 2020, and how the voluntary restraint of action affects consumer demand in Japan. The Almost Ideal Demand System (AIDS) is employed to estimate the changes in food consumption share before and after COVID-19, as well as the price and expenditure elasticities of demand, to determine how the characteristics of Japanese consumer demand changed. The analysis targets the households around the Greater Tokyo area using home scan data.
The Almost Ideal Demand System, developed by Deaton and Muellbauer (1980), is a practical method to approximate theoretical values of demand by a regression. The demand for food consumption in Japan has been analyzed by AIDS including seafood, meat, and food trade (Hayes et al., 1990; Yang and Koo, 1994; Eales et al., 1997). AIDS using home scan data has also been conducted in the United States and Scotland (Davis et al., 2012; Akaichi and Revoredo-Giha, 2016). However, the only existing demand estimation using AIDS for COVID-19 is limited to the aforementioned food loss study (Vargas-Lopez et al., 2021).
This study aims to test any significant difference in demand between 2019 and 2020 using AIDS. Home scan data are analyzed between 2019 and 2020 among the same population. The analysis assumes that socio-demographics and preferences of the same population do not change in 1 year, except for an extraordinary external shock (i.e., the impact of COVID-19). This study is structured as follows: the analytical framework in the next section is followed by a description of the results, and then we conclude our analysis.
Analytical framework
Data
Home scan data (Macromill Holistic Spending Panel Survey), digital household account, were collected by Macromill, Inc. The participants of the home scan data scan their purchased receipts or manually input their consumption records if receipts are not available to keep their digital household account. Therefore, the home scan data provide comprehensive household consumption on food including fresh food, eating out, and delivery, which categories are excluded in point of sales data (POS); the data set targets households in the Greater Tokyo metropolitan area (Tokyo, Kanagawa, Chiba, and Saitama prefectures) from 1 January 2019 to 31 December 2020, for a total of 3,099 households and a total receipts record of 8,864,368. The Greater Tokyo area was selected for analysis because it is the most densely populated area in Japan, which means the area is most affected by COVID-19. The number of COVID-19 positive cases is the largest in Japan (Ministry of Health, Labor and Welfare, Confirmed positive cases of COVID-19, https://www.mhlw.go.jp/content/10900000/000962458.pdf, Accessed on 11 July 2022). Although the data are kept in the form of daily data, the daily data are converted into 2-year (2019 and 2020) data per household to analyze the data as yearly panel data. The data include nonfood items such as durable goods, consumables, and entertainment, however food items are kept for the analysis, focusing mainly on items that could be consumed as food for cooking in the home.
The following 25 categories used in the analysis are mostly compliant with the governmental household survey on the family income and expenditure survey: fresh and daily foods (fish and shellfish, fresh vegetables and fruits, seasonings and oils, tofu, natto, fish paste and pickles, meat, ham and eggs, and dairy products), staple foods (fresh noodles, cup noodles and dried noodles, flour, rice, grains, and cereals), storable foods (retort pouch and cooked ingredients, canned and dried foods, frozen foods and frozen ingredients, and alcoholic beverages), and food consumption outside the home (consumption in restaurants or café, meal delivery, and takeout). To exclude ineffective household data, outliers are removed, such as households where no consumption is recorded, where their annual expenditures consist of a few items, and where they recorded too few days of purchases and respective total expenditures. As a result, 2,882 households in 2019 and 2,890 in 2020, and totally 5,772 households, are identified as effective data and used for the analysis.
Table 1 compares the sociodemographics of the respondents in our data with those of the official statistics in the same region, which shows that the respondents, whose age is between 30 and 59 years, have two times as many as those in the official statistics. The number of women, household income, and the average number of people per household is higher in our data. In contrast, our data have less than half as many people in their 60s or older compared with the official statistics, which indicates that the effects of the generation most affected by COVID-19 are discounted in our analysis. The mode of our data is in the working age group (between 40s and 50s), which would reflect the impact of the population group with relatively higher annual incomes in working-age households, considering the working age groups in Japan show relatively higher annual incomes compared with other non-working age groups (METI, 2020), Average monthly income by age groups, https://www.mlit.go.jp/jidosha/anzen/04relief/resourse/data/kyuuyo.pdf, Accessed on 11 July 2022). Accordingly, this skewed distribution needs to be considered when interpreting the results.
Table 1
| Demographics | G. Tokyo | Our data |
|---|---|---|
| In their 10s | 8% | 0% |
| 20s | 12% | 3% |
| 30s | 13% | 17% |
| 40s | 16% | 31% |
| 50s | 13% | 33% |
| 60s or older | 37% | 15% |
| Female | 51% | 56% |
| Household income | 6,709 | 6,951 |
| Number per household | 2.14 | 2.51 |
Comparison between official demographics of metropolitan areas and home scan data.
Note: G. Tokyo denotes the Greater Tokyo area. The values of our data are based on the data that Macromill Inc. surveyed with the respondents of home scan data. Values in G. Tokyo are a weighted average of respective demographic data across prefectures (Ministry of Health, Labour and Welfare)1. Household income in G. Toyo is a weighted average of the working-age population (Ministry of Internal Affairs Communication, 2019). Household income in our data is based on categorical data (0–2 million yen (m), 2–4 m, 4–6 m, 6–8 m, 8–10 m, 10–12 m, 12–15 m, and 15–20 m, 20 m or more). To calculate the weighted average household income, we took the average of the respective income ranges up to 20 m (1 m, 3 m, 5 m, 7 m, 9 m, 11 m, 13 m, and 17.5 m), and took 20 m if the income is beyond 20 m.
The average purchased price and annual expenditure for each item in 2019 and 2020 are shown in Table 2. Compared with 2019, the average purchased price and expenditures in 2020 decreased for eating out and increased for food that requires cooking, frozen food, and preserved food. Although some significant changes are shown in expenditure, total expenditure between 2019 and 2020 is not significantly different, which COVID-19 seems to substitute the demand for food consumption at home with the demand for eating out.
Table 2
| 2019 | 2020 | |||||||||
|---|---|---|---|---|---|---|---|---|---|---|
| Purchased prices | Annual expenses | Purchased prices | Statistical | Annual expenses | Statistical | |||||
| Variables | Mean | Std. Dev. | Mean | Std. Dev. | Mean | Std. Dev. | difference | Mean | Std. Dev. | Difference |
| 1. Rice, grains and cereals | 961 | 654 | 8,067 | 15,505 | 994 | 816 | ** | 8,836 | 16,429 | ** |
| 2. Lunchboxes | 340 | 1,094 | 16,738 | 22,904 | 347 | 285 | 16,749 | 24,021 | ||
| 3. Cooked noodles | 347 | 179 | 1,958 | 6,322 | 354 | 753 | 2,182 | 6,429 | ||
| 4. Fresh noodles, cup noodles, dried noodles | 170 | 98 | 7,299 | 8,122 | 178 | 137 | *** | 8,457 | 9,244 | *** |
| 5. Bread | 165 | 105 | 18,049 | 18,840 | 167 | 104 | 18,117 | 18,556 | ||
| 6. Fresh vegetables and fruits | 170 | 229 | 28,905 | 35,053 | 194 | 728 | ** | 32,033 | 38,424 | *** |
| 7. Meat, ham, eggs | 335 | 284 | 29,910 | 38,025 | 363 | 495 | *** | 34,334 | 43,422 | *** |
| 8. Seafood | 419 | 345 | 12,898 | 21,629 | 451 | 493 | *** | 14,983 | 24,573 | *** |
| 9. Tofu, natto, fish paste, pickles | 142 | 144 | 9,333 | 10,888 | 141 | 156 | 10,248 | 11,715 | *** | |
| 10. Prepared foods and hot foods | 233 | 174 | 19,200 | 24,663 | 242 | 200 | ** | 19,676 | 25,791 | |
| 11. Dairy products | 186 | 126 | 10,014 | 12,424 | 201 | 164 | *** | 11,097 | 13,686 | *** |
| 12. Frozen foods and ingredients | 268 | 285 | 9,151 | 17,139 | 274 | 315 | 10,697 | 18,301 | *** | |
| 13. Retort pouch/cooking ingredients | 195 | 128 | 6,859 | 8,019 | 203 | 179 | ** | 7,767 | 9,316 | *** |
| 14. Seasonings and oils | 243 | 192 | 9,201 | 10,753 | 247 | 192 | 10,409 | 11,716 | *** | |
| 15. Canned and dried foods | 230 | 199 | 4,147 | 5,715 | 226 | 164 | 4,643 | 6,305 | *** | |
| 16. Flour etc. | 172 | 76 | 701 | 1,460 | 178 | 100 | *** | 886 | 1,678 | *** |
| 17. Confectionery, desserts, ice cream | 224 | 192 | 39,995 | 34,845 | 221 | 187 | 40,450 | 34,948 | ||
| 18. Beverage (liquid) | 160 | 159 | 27,552 | 25,809 | 172 | 199 | *** | 28,631 | 27,184 | |
| 19. Alcoholic beverages | 551 | 679 | 19,067 | 36,645 | 579 | 1,079 | 21,296 | 40,184 | ** | |
| 20. Nutritional drinks and health foods | 665 | 1,329 | 7,427 | 20,130 | 707 | 1,249 | 8,197 | 23,147 | ||
| 21. Tea leaves, powdered beverages, coffee beans | 442 | 410 | 4,850 | 7,794 | 447 | 397 | 5,387 | 9,307 | *** | |
| 22. Baby food and milk | 466 | 157 | 597 | 5,418 | 465 | 176 | 457 | 4,242 | ||
| 23. Other food products | 631 | 2,116 | 8,830 | 42,305 | 628 | 2,019 | 9,665 | 48,831 | ||
| 24. Cafes and restaurants (in-store) | 837 | 782 | 80,914 | 123,250 | 797 | 747 | ** | 57,115 | 98,801 | *** |
| 25. Cafes and take-out (to-go) | 471 | 282 | 5,773 | 12,195 | 509 | 307 | *** | 8,372 | 17,227 | *** |
| 26. Delivery | 1,477 | 993 | 1,742 | 9,547 | 1,462 | 671 | 2,283 | 13,742 | ** | |
| 27. Other outside catering and delivery | 577 | 1,060 | 3,432 | 8,895 | 590 | 771 | 3,215 | 8,524 | ||
| 28. Total expenditure | 392,609 | 264,192 | 396,182 | 271,789 | ||||||
Descriptive statistics of household expenses in 2019 and 2020.
Std. Dev. denotes standard deviation.
The statistical difference shows the results of t-test of means of prices and expenses between 2019 and 2020. ** and *** Indicate statistical significance at 5, and 1% levels, respectively. Unit of the value is yen.
One problem with comprehensive food analysis using household consumption is the presence of zero-consumption items. In many households, one or more items are treated as missing values when the households do not consume the item(s) throughout the year. This study also holds zero-consumption data in the range of 2 to 78%, depending on the item (Supplementary Table A). In particular, 74% of households do not use delivery between 2019 and 2020, but dropping such observations as missing values would make the analysis impossible. While the zero-consumption problem is not rare in analyses using household surveys, ignoring them causes underestimation of elasticity (Deaton and Irish, 1984; Heien and Wesseils, 1990). Therefore, in this study, dummy variables were introduced for the items with zero-consumption rates above 10% to control for their effects. The food consumption variable is left-censored at zero, and it is desirable to be addressed by the Tobit model, which well manages the bias coming from the censored data, but this study introduces dummy variables to control the censored observations due to the limitations of the software package. The introduction of the dummy variables at least separates censored observations from nonzero consumption data and lessens biased estimation. Heterogeneity of preferences also has the possibility of bias estimation. This study assumes that the sociodemographic characteristics and preferences of households, including zero consumption, do not change over the year, and possible biases caused by such heterogeneities can be canceled out by differentiating 2020 from 2019 to measure the impact of COVID-19.
Almost ideal demand system
The Almost Ideal Demand System (AIDS), developed by Deaton and Muellbauer (1980), is employed to analyze households' food consumption. Demand is estimated using “aidsills” as published by Lecocq and Robin (2015) in their STATA code. To obtain standard errors, the asymptotic variance-covariance matrix is estimated in the code according to Blundell and Robin (1999). A simultaneous equation model with a three-stage least squares method is applied to run the regression.2
The equation of the AIDS model is expressed as follows, and all of these expressions are quoted from Lecocq and Robin (2015).
where w is a household i's (i = 1, …, I (sample size of MHS)) share of expenditure on an item j (j = 1,…, J), xi is household i's total expenditure on food consumption, pi is the price vector of each food item, θ is a set of parameters α and γ, is the error term, and a(p, θ) is defined as the price index of all food items weighted by the shares. The parameter vectors to be estimated are α and γ. The nonlinear price aggregator in the above equation is given by,
The vectors of are parameters to estimate. The dummy vectors, which control for year dummies and zero consumption, are added to the variables, estimating the parameter vector α as follows (Pollak and Wales, 1981).
where α0 of the price index is not pre-specified and can be set to any fixed value.3 There are three necessary conditions to perform AIDS: (1) the additivity condition that the sum of βi and γi be sum to zero and the sum of αi be unity in all equations; (2) the homogeneity condition that the effect of the log price estimates be zero in each equation; and (3) the symmetry condition that the parameter γi of budget allocation j is equal to of budget allocation i as follows,
This study analyzes two models. The first model (Model 1) used pooled data to estimate the demand for the period from 2019 to 2020 introducing a 2020-year dummy. The second model (Model 2) runs regressions separately in 2019 and 2020 to estimate the demand for each year to examine how the elasticity of demand changed before and after 2020 when the pandemic occurred.
The expenditure elasticity is given by
and the uncompensated and compensated price elasticities are given by
respectively (Lecocq and Robin, 2015). δijis the Kronecker delta (δij = 1 if i = j, δij = 0 if i≠j). Compensated price elasticity represents a pure price effect where the point in time is compensated for the spending effect of price changes (Green and Alston, 1990). Therefore, compensated price elasticity is treated as elasticity in this study.
Results
Model 1
Model 1, estimation with pooled data, explains the respective equations with R-squares ranging from 2 to 40%, and all models are significant, and especially meat and eggs, eating out, seasonings, other foods, fresh fruits and vegetables, and seafood relatively well-explain the equations (Table 3). Detailed estimation results are available upon request. Expenditure elasticities and own-price elasticities for respective items are shown in Table 4. The estimated price elasticity for both uncompensated and compensated demand is quite similar to each other, but small differences are found in meat and eating out. The own-price elasticities for flour and other flour products (flour, etc.) turn out to be positive. The market price of flour has increased by nearly 10% since 2017, while its demand has also increased. Thus, the recent situation possibly causes a bandwagon effect. All the expenditure elasticities are estimated to be around 1, which means normal goods. Cafés and restaurants, including takeout and delivery, and lunchboxes, are non-essential goods but turn to be necessary goods. This suggests that certain types of consumers do not cook at home and rely solely on eating out (or cooked food) for their meals. Cross-price elasticities are also estimated, and the types of goods (substitutive or complementary) are shown in the (Supplementary Table B). Most ingredients for home cooking turn out to be complementary within themselves and substitutes for eating out.
Table 3
| Variables | Obs | Parms | RMSE | R-sq | F(34, 5737) | Prob > F |
|---|---|---|---|---|---|---|
| 1. Rice, grains and cereals | 5772 | 34 | 0.03 | 0.18 | 37.05 | 0 |
| 2. Lunchboxes | 5772 | 34 | 0.06 | 0.11 | 21.56 | 0 |
| 3. Cooked noodles | 5772 | 34 | 0.01 | 0.07 | 13.2 | 0 |
| 4. Fresh noodles, cup noodles, dried noodles | 5772 | 34 | 0.02 | 0.12 | 24.58 | 0 |
| 5. Bread | 5772 | 34 | 0.04 | 0.09 | 17.31 | 0 |
| 6. Fresh vegetables and fruits | 5772 | 34 | 0.05 | 0.25 | 56.93 | 0 |
| 7. Meat, ham, eggs | 5772 | 34 | 0.05 | 0.41 | 118.46 | 0 |
| 8. Seafood | 5772 | 34 | 0.03 | 0.21 | 47.38 | 0 |
| 9. Tofu, natto, fish paste, pickles | 5772 | 34 | 0.02 | 0.20 | 43.51 | 0 |
| 10. Prepared foods and hot foods | 5772 | 34 | 0.04 | 0.12 | 23.63 | 0 |
| 11. Dairy products | 5772 | 34 | 0.03 | 0.09 | 18.04 | 0 |
| 12. Frozen foods and ingredients | 5772 | 34 | 0.03 | 0.15 | 30.06 | 0 |
| 13. Retort pouch/cooking ingredients | 5772 | 34 | 0.02 | 0.14 | 29.45 | 0 |
| 14. Seasonings and oils | 5772 | 34 | 0.02 | 0.29 | 69.71 | 0 |
| 15. Canned and dried foods | 5772 | 34 | 0.01 | 0.17 | 34.83 | 0 |
| 16. Flour etc. | 5772 | 34 | 0.00 | 0.15 | 30.18 | 0 |
| 17. Confectionery, desserts, ice cream | 5772 | 34 | 0.07 | 0.09 | 17.53 | 0 |
| 18. Beverage (liquid) | 5772 | 34 | 0.06 | 0.16 | 33.68 | 0 |
| 19. Alcoholic Beverages | 5772 | 34 | 0.08 | 0.19 | 41.32 | 0 |
| 20. Nutritional drinks and health foods | 5772 | 34 | 0.04 | 0.17 | 34.8 | 0 |
| 21. Tea leaves, powdered beverages, coffee beans | 5772 | 34 | 0.02 | 0.16 | 32.36 | 0 |
| 22. Cafes and restaurants (in-store) | 5772 | 34 | 0.16 | 0.31 | 77.85 | 0 |
| 23. Cafes and take-out (to-go) | 5772 | 34 | 0.04 | 0.08 | 14.42 | 0 |
| 24. Delivery | 5772 | 34 | 0.02 | 0.02 | 4.25 | 0 |
| 25. Other Food Products | 5772 | 34 | 0.07 | 0.26 | 60.6 | 0 |
Model fit of AIDS estimation with pooled data (Model 1).
Table 4
| Variables | Estimated Budget share | Expenditure elasticity | Own price elasticity | |
|---|---|---|---|---|
| Uncompensated | Compensated | |||
| 1. Rice, grains and cereals | 0.021*** | 1.037*** | −0.313*** | −0.291*** |
| 2. Lunchboxes | 0.044*** | 0.863*** | −0.535*** | −0.497*** |
| 3. Cooked noodles | 0.005*** | 0.992*** | −0.276*** | −0.271*** |
| 4. Fresh, cup, dried noodles | 0.021*** | 1.055*** | −0.525*** | −0.503*** |
| 5. Bread | 0.049*** | 0.930*** | −0.797*** | −0.752*** |
| 6. Fresh vegetables and fruits | 0.074*** | 1.235*** | −0.773*** | −0.681*** |
| 7. Meat, ham, eggs | 0.077*** | 1.230*** | −0.365*** | −0.270*** |
| 8. Seafood | 0.031*** | 1.329*** | −0.671*** | −0.629*** |
| 9. Tofu, Natto, fish paste, pickles | 0.024*** | 1.164*** | −0.722*** | −0.694*** |
| 10. Prepared foods and hot foods | 0.048*** | 1.100*** | −0.401*** | −0.348*** |
| 11. Dairy products | 0.027*** | 1.094*** | −0.877*** | −0.848*** |
| 12. Frozen foods and ingredients | 0.024*** | 1.231*** | −0.424*** | −0.395*** |
| 13. Retort pouch/cooking ingredients | 0.019*** | 1.138*** | −0.505*** | −0.484*** |
| 14. Seasonings and oils | 0.025*** | 1.147*** | −0.608*** | −0.580*** |
| 15. Canned and dried foods | 0.011*** | 1.142*** | −0.458*** | −0.446*** |
| 16. Flour etc. | 0.002*** | 1.134*** | 0.343*** | 0.345*** |
| 17. Confectionery, desserts, ice cream | 0.110*** | 0.917*** | −0.722*** | −0.621*** |
| 18. Beverage (liquid) | 0.077*** | 0.868*** | −0.581*** | −0.514*** |
| 19. Alcoholic Beverages | 0.049*** | 0.881*** | −0.275*** | −0.231*** |
| 20. Nutritional drinks and health foods | 0.019*** | 0.870*** | −0.055 | −0.038 |
| 21. Tea leaf, powder beverages, coffee beans | 0.013*** | 0.839*** | 0.041 | 0.053 |
| 22. Cafes and restaurants (in-store) | 0.172*** | 0.873*** | −0.754*** | −0.604*** |
| 23. Cafes and take-out (to-go) | 0.019*** | 0.723*** | −0.674*** | −0.660*** |
| 24. Delivery | 0.005*** | 1.058*** | −1.679*** | −1.674*** |
| 25. Other food products | 0.033*** | 0.802*** | 0.300*** | 0.326*** |
Estimated budget share, elasticities of Model 1.
***Indicate 1% of significance levels.
The y20 dummies are estimated to be significantly positive for most of the ingredients for home cooking, delivery, and takeout from restaurants (Table 5). The rate of increase ranges up to 0.6%. The share of expenditure on items in 2020 that increases compared with 2019 is ingredients for cooking at home, such as fresh vegetables, seafood, tofu and other products, dairy products, seasonings, dairy products, flour, tea leaves, and preservable foods (noodles, frozen foods, canned foods, and retort pouch, etc.), alcoholic beverages, takeout, and delivery. Conversely, only the share of expenditure on eating out (in-store) significantly reduces its share by about 3%.
Table 5
| Variables | 2020 year dummy |
|---|---|
| 1. Rice, grains and cereals | −0.00013 |
| 2. Lunchboxes | −0.0013 |
| 3. Cooked noodles | −0.00052 |
| 4. Fresh noodles, cup noodles, dried noodles | −0.0012** |
| 5. Bread | −0.0012 |
| 6. Fresh vegetables and fruits | −0.0029** |
| 7. Meat, ham, eggs | −0.0021 |
| 8. Seafood | −0.0024*** |
| 9. Tofu, Natto, fish paste, pickles | −0.0010** |
| 10. Prepared foods and hot foods | −0.0013 |
| 11. Dairy products | −0.0015** |
| 12. Frozen foods and ingredients | −0.0019** |
| 13. Retort pouch/cooking ingredients | −0.00077 |
| 14. Seasonings and oils | −0.0014*** |
| 15. Canned and dried foods | 0.00097*** |
| 16. Flour etc. | 0.00022*** |
| 17. Sweets, desserts, ice cream | 0.00100 |
| 18. Beverage (liquid) | −0.00038 |
| 19. Alcoholic Beverages | 0.0054*** |
| 20. Nutritional drinks and health foods | 0.0013 |
| 21. Tea leaves, powdered beverages, coffee beans | 0.0014*** |
| 22. Cafes and restaurants (in-store) | −0.030*** |
| 23. Cafes and take-out (to-go) | 0.0061*** |
| 24. Delivery | 0.00088** |
| 25. Other food products | 0.0016 |
Result of the year dummy variable (Model 1).
** and *** Indicate 5 and 1% of significance levels.
Model 2
In Model 2, the respective yearly data are analyzed separately, resulting in expenditure and price elasticities for 2019 and 2020. The model fit for each year is almost identical to the model fit of Model 1 using the pooled data, and the root mean square error (RMSE) is not different between 2019 and 2020 within the range of 1% error (Supplementary Table C). The self-price elasticity is higher in 2020 than in 2019 (Table 6). Many goods in 2020 become more inelastic than in 2019. In contrast, delivery and frozen foods become more elastic. Expenditure elasticities of delivery, frozen foods, eating out, and tea leaves become closer to necessary goods, while goods such as noodles, boxed lunches, liquor, and takeout come to be closer to luxury goods. Eating out (in-store) is estimated as substitute goods with home cooking materials, and its cross-elasticity changed in a positive direction, which can be interpreted that the degree of substitution enhances between food service and home cooking materials.
Table 6
| 2019 | 2020 | Change (%) | ||||||
|---|---|---|---|---|---|---|---|---|
| Estimated share % | Expenditure Elas | Own price Elas. | Estimated share % | Expenditure Elas. | Own price Elas. | Exp Elas % | Price Elas. | |
| 1. Rice, grains and cereals | 2*** | 1.035*** | −0.356*** | 2*** | 1.041*** | −0.229*** | 1 | −13 |
| 2. Lunchboxes | 5*** | 0.83*** | −0.473*** | 4*** | 0.901*** | −0.523*** | 7 | 5 |
| 3. Cooked noodles | 1*** | 0.95*** | −0.4*** | 1*** | 1.023*** | −0.18 | 7 | −22 |
| 4. Fresh, cup, dried noodles | 2*** | 1.018*** | −0.465*** | 2*** | 1.085*** | −0.531*** | 7 | 7 |
| 5. Bread | 5*** | 0.918*** | −0.715*** | 5*** | 0.942*** | −0.786*** | 2 | 7 |
| 6. Fresh vegetables and fruits | 7*** | 1.236*** | −0.715*** | 8*** | 1.234*** | −0.656*** | 0 | −6 |
| 7. Meat, ham, eggs | 8*** | 1.221*** | −0.339*** | 8*** | 1.237*** | −0.194*** | 2 | −15 |
| 8. Seafood | 3*** | 1.341*** | −0.661*** | 3*** | 1.316*** | −0.608*** | −2 | −5 |
| 9. Tofu, natto, fish paste, pickles | 2*** | 1.176*** | −0.71*** | 3*** | 1.153*** | −0.678*** | −2 | −3 |
| 10. Prepared foods and hot foods | 5*** | 1.088*** | −0.361*** | 5*** | 1.114*** | −0.345*** | 3 | −2 |
| 11. Dairy products | 3*** | 1.082*** | −0.872*** | 3*** | 1.103*** | −0.837*** | 2 | −4 |
| 12. Frozen foods and ingredients | 2*** | 1.272*** | −0.294*** | 3*** | 1.197*** | −0.474*** | −8 | 18 |
| 13. Retort pouch/cooking ingredients | 2*** | 1.102*** | −0.464*** | 2*** | 1.171*** | −0.506*** | 7 | 4 |
| 14. Seasonings and oils | 2*** | 1.164*** | −0.606*** | 3*** | 1.133*** | −0.549*** | −3 | −6 |
| 15. Canned and dried foods | 1*** | 1.141*** | −0.466*** | 1*** | 1.142*** | −0.444*** | 0 | −2 |
| 16. Flour etc. | 0*** | 1.133*** | 0.43*** | 0*** | 1.128*** | 0.3*** | −1 | −13 |
| 17. Sweets, desserts, ice cream | 11*** | 0.915*** | −0.664*** | 11*** | 0.92*** | −0.58*** | 1 | −8 |
| 18. Beverage (liquid) | 8*** | 0.845*** | −0.551*** | 8*** | 0.89*** | −0.483*** | 5 | −7 |
| 19. Alcoholic Beverages | 5*** | 0.871*** | −0.25*** | 5*** | 0.896*** | −0.222*** | 3 | −3 |
| 20. Nutritional drinks and health foods | 2*** | 0.85*** | −0.038 | 2*** | 0.894*** | −0.05 | 4 | 1 |
| 21. Tea leaves, powdered beverages, coffee beans | 1*** | 0.918*** | −0.01 | 1*** | 0.775*** | 0.116 | −14 | 11 |
| 22. Cafes and restaurants (in-store) | 19*** | 0.91*** | −0.593*** | 15*** | 0.822*** | −0.615*** | −9 | 2 |
| 23. Cafes and take-out (to-go) | 2*** | 0.704*** | −0.637*** | 2*** | 0.749*** | −0.707*** | 5 | 7 |
| 24. Delivery | 0*** | 1.127*** | −1.474*** | 1*** | 1.024*** | −1.856*** | −10 | 38 |
| 25. Other food products | 3*** | 0.849*** | 0.357*** | 3*** | 0.761*** | 0.298*** | −9 | −6 |
Estimated elasticities of Model 2 and change rate from 2019 (Model 2).
Values in gray indicate insignificance.
***Indicate 1% of significance levels.
Compared with respective cross-price elasticities of demand between 2019 and 2020, the nature of goods does not change significantly from complementary goods (alternative goods) to substitutes (complementary goods) (refer to Supplementary Table D). Most of the changes in elasticities move toward the negative, which is the direction of strengthening the complementary relationship, while a few goods significantly strengthen substitutive relationships (Table 7). Among the items that are significant in both 2019 and 2020, the items with the largest increase found in complementary goods are flour-dairy products, flour-sweets, and cooked noodles-meat, all of which are shifted in the complementary direction. Many of the items strengthen complementary relationships among food ingredients for home cooking, which is presumably because people increase the chance of home cooking in 2020.
Table 7
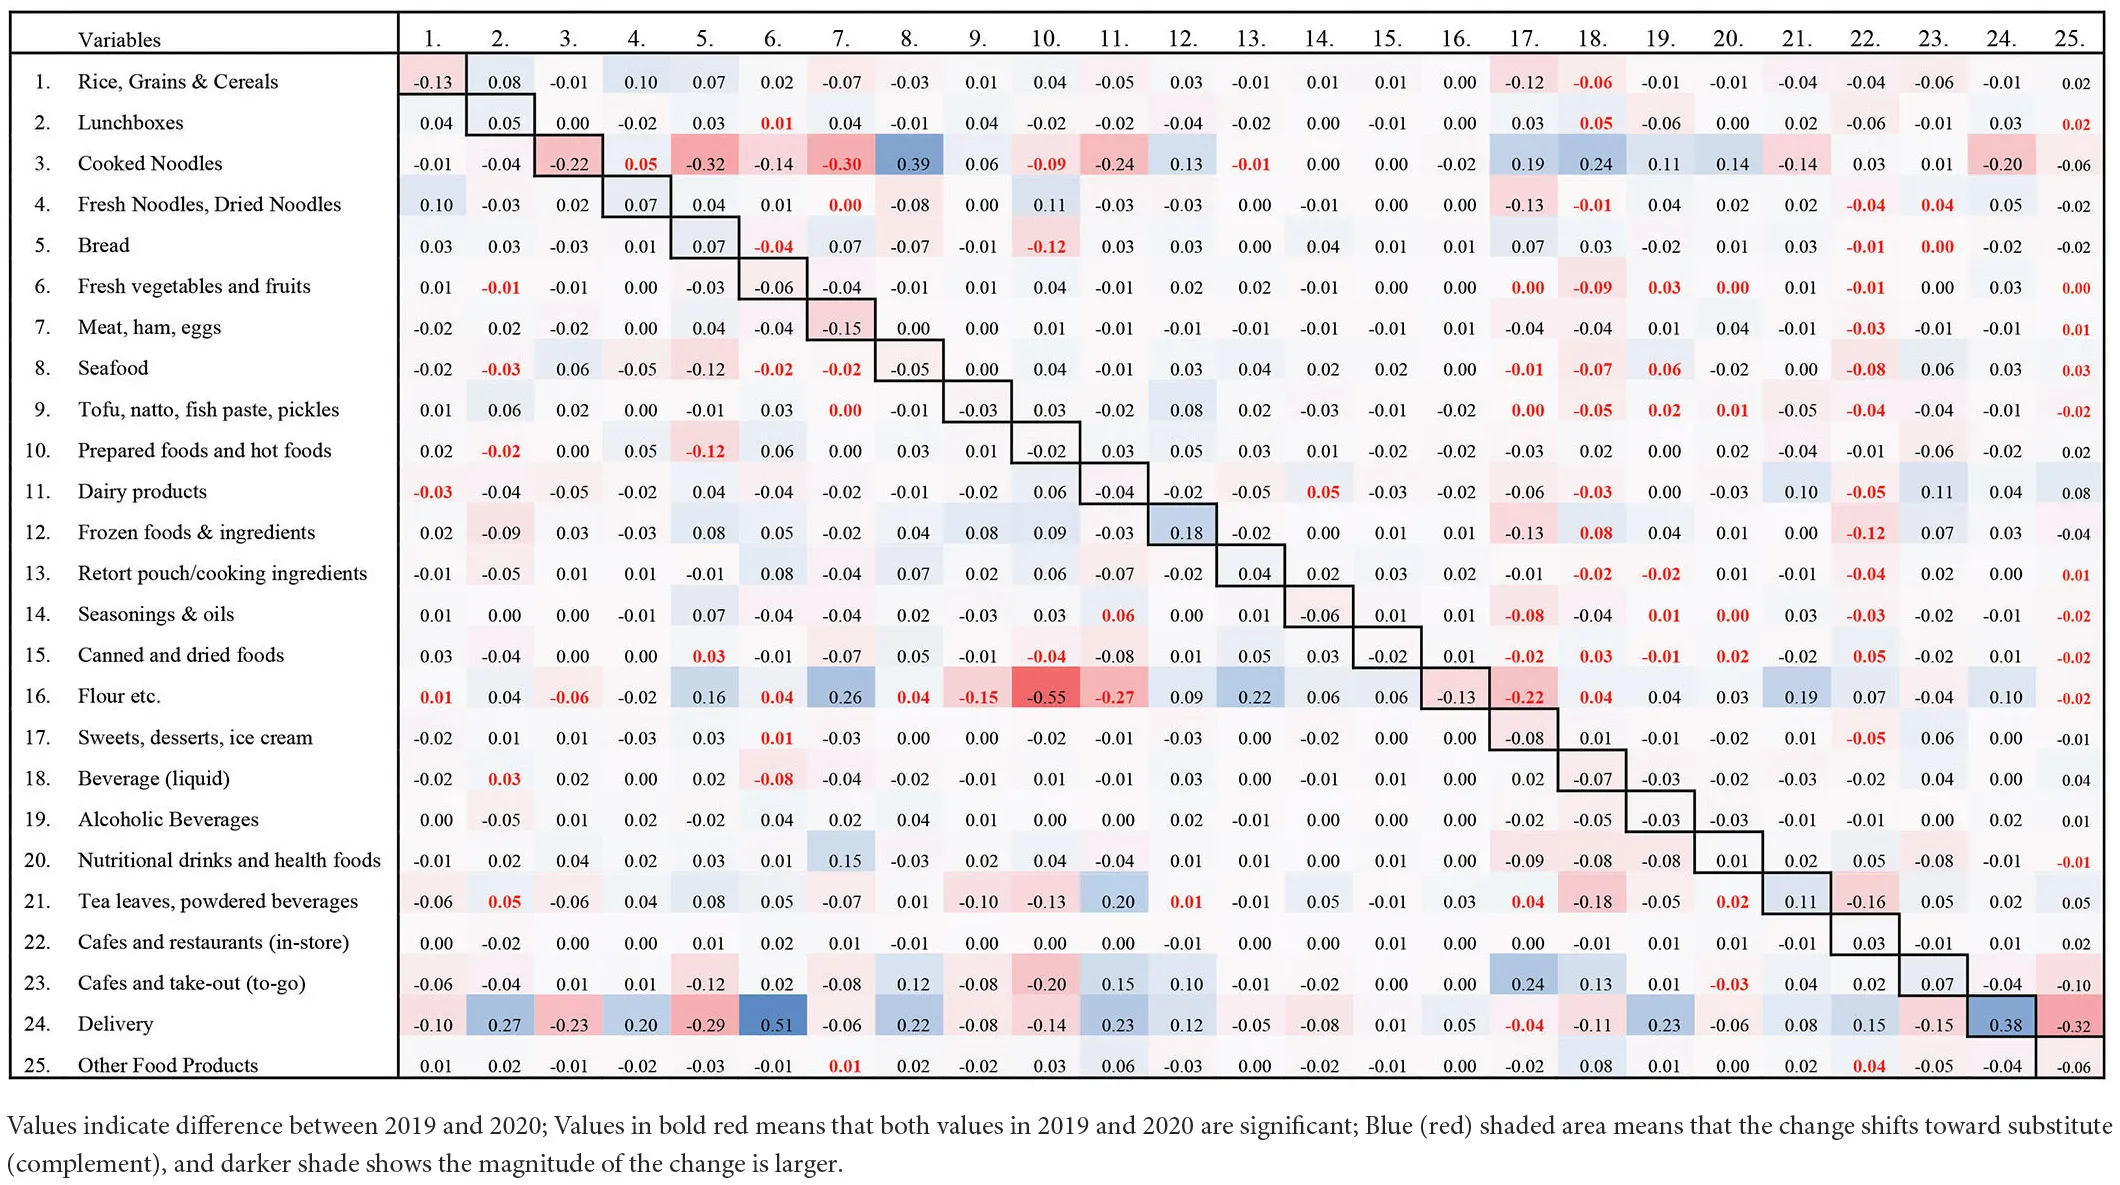 |
Rate of change in cross price elasticities from 2019 to 2020 (Model 2).
Values indicate difference between 2019 and 2020; Values in bold red means that both values in 2019 and 2020 are significant; Blue (red) shaded area means that the change shifts toward substitute (complement), and darker shade shows the magnitude of the change is larger.
Validation of estimation
Validation (robustness check) is often conducted in econometrics to test the consistency of models by adding or dropping some unnecessary variables when the true drivers of the model are unknown. However, this AIDS model is different from such models in that the framework of this model clearly defines all of the necessary variables, such as shares of food expenses, which we obtained from home scan data. Thus, the robustness check has relatively less importance to this study. In addition, the number of observations is ~3,000 or more, which is enough size to obtain consistent parameters following the large sample theory. Although multicollinearity sometimes biases estimation, our estimation in both models shows that the mean of variance inflation factor (VIF) is 1.4 and the maximum variable is 3.0, which is less than the threshold of multicollinearity of 20 (Greene, 2003). A three-stage least squares method generates a bias when the equation is not just identified (Lecocq and Robin, 2015), but our system of equations is just identified. We also estimate robust standard errors with an asymptotic variance-covariance matrix (Blundell and Robin, 1999).
Discussion
The results of this study generally do not contradict reality. The change in people's lifestyles due to the pandemic resulted in a significant increase in the expenditure share on home cooking ingredients (fresh vegetables, fruits, noodles, seafood, tofu, dairy products, etc.), frozen and canned foods that can be stored relatively long, and meal delivery and takeout instead of eating in restaurants. This is possibly because households took actions to avoid the risk of infection caused by going out (Janssen et al., 2021), or eating healthier meals to reduce health risks due to COVID-19 (Rodríguez-Pérez et al., 2020). In the meantime, this study also finds an increase in alcohol consumption in the home, which is also endorsed by existing studies that reported increased alcohol consumption in Europe and Japan due to the stress attributed to COVID-19 (Vanderbruggen et al., 2020; Janssen et al., 2021; Nishijima et al., 2021). Such an increase in expenditures on alcoholic beverages is not possible to conclude whether absolute alcohol consumption increased or drinking outside merely shifted to drinking at home since alcoholic expenditure within the eating-out category is not available. Price elasticity became less elastic for home-cooking ingredients in 2020, which suggests that households have become less sensitive to price because they avoided alternative options of inside-the-house consumption, such as eating out, and also because they reduced the frequency of shopping. On the contrary, storable foods have become more elastic; households hoarded storable foods when prices are low to be ready just in case. COVID-19 brought a variety of positive and negative influences on consumers' health, such as an increase in food consumption at home or alcohol. It is not possible for our study to conclude whether consumers' health improved or worsened by COVID-19, but our analysis ensures that consumers faced a certain effect on their food consumption.
The changes in respective elasticities in 2019 and 2020 show that the items estimated as substitutive (complementary) goods in 2019 do not turn out to be complementary (substitutive) goods. The substitutive/complementary relationships, such as the relationship between food consumption inside and outside the house and the relationship within ingredients for home cooking, seem to be amplified by COVID-19. Demand for food ingredients for home cooking increased due to the increase in domestic consumption. The expenditure elasticity of those ingredients also slightly increased, which means those goods became more sensitive to expenditures and inelastic to price. Considering that their total expenditure did not change between 2019 and 2020, the households sacrificed their consumption to balance their total expenditure for food consumption.
Expenditure elasticity with respect to eating out became more inelastic toward necessary goods. Some eating-out intensive households who do not (or cannot) cook at home (and eat only at restaurants) are considered to keep their consumption in 2020, while other households who do not only eat out but also cook at home have reduced their eating-out consumption in 2020. Such eating-out intensive households may be a reason to make expenditure elasticity more inelastic. From these results, we conjecture that the households in our data are categorized into three groups: home-cooking households, eating-out households, and hybrid households. COVID-19 gave hybrid households more chance of home cooking, while they gave up eating out, which makes eating-out households more isolated, eating-out intensive diets. The positive price elasticity for flour in both 2019 and 2020 may be due to the bandwagon effect. Although the price of flour and other flours has been rising in recent years, the demand has also increased recently as an increasing number of people bake their homemade baked goods to share on their social networking services.
Our results also find that the decrease in in-store food consumption is the largest among 25 food items, which also reflects the domestic economic situation in Japan that restaurants and the pub industry most suffered from the decrease in consumption. Given this situation, the Ministry of Economy, Trade, and Industry (METI) budgeted a subsidy program for sustaining business and subsidized small and medium-sized enterprises up to 2 million yen. As a result, 4.2 million small (or mid)-sized enterprises received as much as 55 trillion yen in total (METI, Application and provision of a subsidy program for sustaining business (in Japanese), https://www.meti.go.jp/covid-19/jizokuka-info.html, Accessed on 11 July 2022). Among the subsidy program, hotels and restaurants industry received 693 billion yen in total. Although this subsidy program mitigated the negative impact of COVID-19 on small- or mid-sized restaurants, the number of restaurants bankrupted increased by 6.6% and was the worst ever (Teikoku Data Bank, 2021, Statistics of Bankruptcy (in Japanese), https://www.tdb.co.jp/tosan/syukei/20nen.html, Accessed on 11 July 2022(. In addition, large-sized restaurants in Japan were not able to receive this subsidy and 14 main listed franchised restaurants and pubs reduced the number of their locations by 18.8% compared to before the pandemic (TSR, 2022, 14 major izakaya restaurants closed 1,356 stores compared to the pre-COVID period (in Japanese), https://www.tsr-net.co.jp/news/analysis/20220216_02.html, Accessed on 11 July 2022). Hence, in spite of the public subsidy, incurred economic losses in the in-store food and drink industry in Japan became profound.
Conclusion
This study analyzes how consumers responded to COVID-19 in the absence of legal regulation in Japan. This is the first study to look at comprehensive Japanese consumer food demand before and during COVID-19. Although the attitude and perception against COVID-19 vary across countries, similar results may apply to consumer behavior in countries where economic activity is relaxed owing to successful infection control. Home scan data used in this study are weighted toward the working-age group between the 30 and 50 s, compared to the official statistics. Since younger and elder age groups may be undervalued in this study, the result should be weighted toward the working-age group. To overcome this, a national household expenditure survey or equivalent official statistics is necessary to obtain more unbiased results for further study. The estimated elasticities in this study may also be underestimated by zero-consumption data. Although this study focuses on the difference between 2019 and 2020 and introduced zero-consumption dummies to treat this possible bias, a possibility of underestimation of estimates still remains, which should be considered.
Publisher's note
All claims expressed in this article are solely those of the authors and do not necessarily represent those of their affiliated organizations, or those of the publisher, the editors and the reviewers. Any product that may be evaluated in this article, or claim that may be made by its manufacturer, is not guaranteed or endorsed by the publisher.
Statements
Data availability statement
The data analyzed in this study is subject to the following licenses/restrictions: The datasets are owned by a private firm and anyone can purchased the data from Macromill, Inc. Requests to access these datasets should be directed to https://group.macromill.com.
Author contributions
NI, YM, and HW: conceptualization, validation, investigation, writing—review and editing, and visualization. HW: methodology, software, formal analysis, writing-original draft preparation, supervision and project administration. MH: resources. NI and YM: data curation. All authors contributed to the article and approved the submitted version.
Acknowledgments
We express our gratitude to the handling editor Dr. Prashant Rajput, and two reviewers Dr. Madhav Badami and Dr. Jai Prakash who provided us with useful comments to improve this manuscript.
Conflict of interest
The authors declare that the research was conducted in the absence of any commercial or financial relationships that could be construed as a potential conflict of interest.
Supplementary material
The Supplementary Material for this article can be found online at: https://www.frontiersin.org/articles/10.3389/frsc.2022.920722/full#supplementary-material
Footnotes
1.^Ministry of Health, Labour and Welfare Population by Age (Five-Year Groups) and Sex for Prefectures. Available online at: http://www.stat.go.jp/data/jinsui/2019np/index.html [Accessed June 22, 2022].
2.^A three-stage least-squares method is to estimate a system of regression equations simultaneously assuming dependent variables as endogenous variables (Zellner and Theil, 1962). AIDS assumes that the Engel curve is linear. A bias is sometimes observed when the Engel curve is nonlinear, and in such cases, a quadratic AIDS (QUAIDS) is required to cope with the bias, which corresponds to a quadratic Engel curve (Banks et al., 1997). In this study, however, the Engel curve is not identified as quadratic (refer to Supplementary Figure A) and the results are unchanged, so the Engel curve is assumed to be linear and AIDS is adopted.
3.^α0 is usually set to a value less than the logarithm of the minimum value of xt (Poi, 2012). ln(min(x)) was 10.48 in our data, α0 was set to 10 as an arbitrary value, but did not converge. Thus, we set the value to 8.
References
1
AkaichiF.Revoredo-GihaC. (2016). Consumers demand for products with animal welfare attributes: evidence from homescan data for Scotland. Br. Food J.118, 1682–1711. 10.1108/BFJ-09-2015-0321
2
ArugaK. (2021). Changes in human mobility under the COVID-19 pandemic and the Tokyo fuel market. J. Risk Financ. Manag.14:163. 10.3390/jrfm14040163
3
BaldwinR.TomiuraE. (2020). Thinking ahead about the trade impact of COVID-19. Econ. in the Time of COVID-19, 59–71.
4
BanksJ.BlundellR.LewbelA. (1997). Quadratic engel curves and consumer demand. Rev. Econ. Stat.79, 527–539. 10.1162/003465397557015
5
BlundellR.RobinJ. M. (1999). Estimation in large and disaggregated demand systems: an estimator for conditionally linear systems. J. Appl. Econom.14, 209–232. 10.1002/(SICI)1099-1255(199905/06)14:3andlt;209::AID-JAE532andgt;3.0.CO;2-X
6
CasoD.GuidettiM.CapassoM.CavazzaN. (2022). Finally, the chance to eat healthily: Longitudinal study about food consumption during and after the first COVID-19 lockdown in Italy. Food Qual. Prefer.95:104275. 10.1016/j.foodqual.2021.104275
7
CelikB.DaneS. (2020). The effects of COVID-19 pandemic outbreak on food consumption preferences and their causes. J. Res. Med. Dent. Sci.8, 169–173.
8
ChangH.-H.MeyerhoeferC. D. (2021). COVID-19 and the demand for online food shopping services: empirical evidence from Taiwan. Am. J. Agric. Econ.103, 448–465. 10.1111/ajae.12170
9
CranfieldJ. A. L. (2020). Framing consumer food demand responses in a viral pandemic. Can. J. Agric. Econ. Can. Agroeconomie68, 151–156. 10.1111/cjag.12246
10
DavisC. G.DongD.BlayneyD. P.YenS. T.StillmanR. (2012). US fluid milk demand: a disaggregated approach. Int. Food Agribus. Manag. Rev.15, 25–50. 10.22004/ag.econ.120856
11
DeatonA.IrishM. (1984). Statistical models for zero expenditures in household budgets. J. Public Econ.23, 59–80. 10.1016/0047-2727(84)90067-7
12
DeatonA.MuellbauerJ. (1980). An almost ideal demand system. Am. Econ. Rev.70, 312–326.
13
DietrichS.GiuffridaV.MartoranoB.SchmerzeckG. (2021). COVID-19 policy responses, mobility, and food prices. Am. J. Agric. Econ., 104, 569–588. 10.1111/ajae.12278
14
EalesJ.DurhamC.WessellsC. R. (1997). Generalized models of Japanese demand for fish. Am. J. Agric. Econ.79, 1153–1163. 10.2307/1244272
15
GreenR.AlstonJ. M. (1990). Elasticities in AIDS models. Am. J. Agric. Econ.72, 442–445. 10.2307/1242346
16
GreeneW. H. (2003). Econometric Analysis. Prentice Hall Upper Saddle River, NJ.
17
HaleT.AngristN.GoldszmidtR.KiraB.PetherickA.PhillipsT.et al. (2021). A global panel database of pandemic policies (Oxford COVID-19 Government Response Tracker). Nat. Hum. Behav.5, 529–538. 10.1038/s41562-021-01079-8
18
HayashiF.TakemiY. (2021). Factors Influencing Changes in Food Preparation during the COVID-19 Pandemic and associations with food intake among Japanese adults. Nutrients13:3864. 10.3390/nu13113864
19
HayesD. J.WahlT. I.WilliamsG. W. (1990). Testing restrictions on a model of Japanese meat demand. Am. J. Agric. Econ.72, 556–566. 10.2307/1243024
20
HeienD.WesseilsC. R. (1990). Demand systems estimation with microdata: a censored regression approach. J. Bus. Econ. Stat.8, 365–371. 10.1080/07350015.1990.10509807
21
HillenJ. (2021). Online food prices during the COVID-19 pandemic. Agribusiness37, 91–107. 10.1002/agr.21673
22
HorikawaC.MurayamaN.KojimaY.TanakaH.MorisakiN. (2021). Changes in selected food groups consumption and quality of meals in Japanese school children during the COVID-19 Pandemic. Nutrients13, 2743. 10.3390/nu13082743
23
InoueH.TodoY. (2020). The propagation of economic impacts through supply chains: The case of a mega-city lockdown to prevent the spread of COVID-19. PLoS ONE15:e0239251. 10.1371/journal.pone.0239251
24
JanssenM.ChangB. P. I.HristovH.PravstI.ProfetaA.MillardJ. (2021). Changes in food consumption during the COVID-19 pandemic: analysis of consumer survey data from the first lockdown period in Denmark, Germany, and Slovenia. Front. Nutr.8:635859. 10.3389/fnut.2021.635859
25
KitamuraY.KarkourS.IchisugiY.ItsuboN. (2020). Evaluation of the economic, environmental, and social impacts of the COVID-19 pandemic on the japanese tourism industry. Sustainability12:10302. 10.3390/su122410302
26
LecocqS.RobinJ.-M. (2015). Estimating almost-ideal demand systems with endogenous regressors. Stata J.15, 554–573. 10.1177/1536867X1501500214
27
METI. (2020). Average Monthly Income by Age Groups (in Japanese). Available online at: https://www.mlit.go.jp/jidosha/anzen/04relief/resourse/data/kyuuyo.pdf (accessed July 11, 2022).
28
Ministry of Internal Affairs Communication (2019). National Survey of Family Income and Expenditure. Available online at: https://www.e-stat.go.jp/dbview?sid=0003426444 (accessed June 22, 2022).
29
MoritaH.NakamuraS.HayashiY. (2020). Changes of urban activities and behaviors due to COVID-19 in Japan.10.2139/ssrn.3594054
30
NarayanP. K.DevpuraN.WangH. (2020). Japanese currency and stock market—What happened during the COVID-19 pandemic?Econ. Anal. Policy68, 191–198. 10.1016/j.eap.2020.09.014
31
NishijimaC.MiyagawaN.Tsuboyama-KasaokaN.ChibaT.MiyachiM. (2021). Association between lifestyle changes and at-home hours during and after the state of emergency due to the COVID-19 pandemic in Japan. Nutrients13:2698. 10.3390/nu13082698
32
PoiB. P. (2012). Easy demand-system estimation with quaids. Stata J. 12, 433–446. 10.1177/1536867X1201200306
33
PollakR. A.WalesT. J. (1981). Demographic variables in demand analysis. Econom. J. Econom. Soc.49, 1533–1551. 10.2307/1911416
34
QianK.JavadiF.HiramatsuM. (2020). Influence of the COVID-19 pandemic on household food waste behavior in Japan. Sustainability12:9942. 10.3390/su12239942
35
RitchieH.MathieuE.Rodés-GuiraoL.AppelC.GiattinoC.Ortiz-OspinaE.et al (2020). Coronavirus Pandemic (COVID-19). Our World Data. Available online at: https://ourworldindata.org/covid-google-mobility-trends (accessed March 22, 2022).
36
Rodríguez-PérezC.Molina-MontesE.VerardoV.ArtachoR.García-VillanovaB.Guerra-HernándezE. J.et al. (2020). Changes in dietary behaviours during the COVID-19 outbreak confinement in the Spanish COVIDiet study. Nutrients12:1730. 10.3390/nu12061730
37
RuanJ.CaiQ.JinS. (2021). Impact of COVID-19 and nationwide lockdowns on vegetable prices: evidence from wholesale markets in China. Am. J. Agric. Econ.103, 1574–1594. 10.1111/ajae.12211
38
Teikoku Data Bank. (2021). Statistics of Bankruptcy (in Japanese). Available online at: https://www.tdb.co.jp/tosan/syukei/20nen.html (accessed July 11, 2022).
39
VanderbruggenN.MatthysF.Van LaereS.ZeeuwsD.SantermansL.Van den AmeeleS.et al. (2020). Self-reported alcohol, tobacco, and cannabis use during COVID-19 lockdown measures: results from a web-based survey. Eur. Addict. Res.26, 309–315. 10.1159/000510822
40
Vargas-LopezA.CicatielloC.PrincipatoL.SecondiL. (2021). Consumer expenditure, elasticity and value of food waste: a Quadratic almost ideal demand system for evaluating changes in Mexico during COVID-19. Socioecon. Plann. Sci.82:101065. 10.1016/j.seps.2021.101065
41
WatanabeT.YabuT. (2021). Japan's voluntary lockdown. PLoS ONE16:e0252468. 10.1371/journal.pone.0252468
42
WeibleC. M.NohrstedtD.CairneyP.CarterD. P.CrowD. A.DurnováA. P.et al. (2020). COVID-19 and the policy sciences: initial reactions and perspectives. Policy Sci.53, 225–241. 10.1007/s11077-020-09381-4
43
YangS.-R.KooW. W. (1994). Japanese meat import demand estimation with the source differentiated AIDS model. J. Agric. Resour. Econ.19, 396–408. 10.22004/ag.econ.30760
44
ZellnerA.TheilH. (1962). Three Stage Least Squares: simultaneous estimation of simultaneous equations. Econometrica30, 54–78. 10.2307/1911287
Summary
Keywords
AIDS model, home scan data, the COVID-19, elasticity, food demand
Citation
Ito N, Maruyama Y and Wakamatsu H (2022) Consumer food demand in Japan before and after the beginning of COVID-19: AIDS analysis using home scan data. Front. Sustain. Cities 4:920722. doi: 10.3389/frsc.2022.920722
Received
15 April 2022
Accepted
27 July 2022
Published
22 August 2022
Volume
4 - 2022
Edited by
Prashant Rajput, Banaras Hindu University, India
Reviewed by
Madhav Badami, McGill University, Canada; Jai Prakash, Washington University in St. Louis, United States
Updates
Copyright
© 2022 Ito, Maruyama and Wakamatsu.
This is an open-access article distributed under the terms of the Creative Commons Attribution License (CC BY). The use, distribution or reproduction in other forums is permitted, provided the original author(s) and the copyright owner(s) are credited and that the original publication in this journal is cited, in accordance with accepted academic practice. No use, distribution or reproduction is permitted which does not comply with these terms.
*Correspondence: Hiroki Wakamatsu hwakamatsu@affrc.go.jp
This article was submitted to Climate Change and Cities, a section of the journal Frontiers in Sustainable Cities
Disclaimer
All claims expressed in this article are solely those of the authors and do not necessarily represent those of their affiliated organizations, or those of the publisher, the editors and the reviewers. Any product that may be evaluated in this article or claim that may be made by its manufacturer is not guaranteed or endorsed by the publisher.