 Chong Liu1
 Xiaoman Wang
- 1School of Public Policy & Management, Anhui Jianzhu University, Hefei, China
- 2School of Government, Sun Yat-sen University, Guangzhou, China
- 3School of Public Policy and Management, Tsinghua University, Beijing, China
Land use carbon emissions (LUCE) contribute significantly to global warming. Recognizing the influence of regional heterogeneity and geographical scale on socioeconomic development, studying LUCE at various scales is crucial for devising more effective emission reduction measures. However, previous studies have predominantly focused on a single scale. This study focuses on the Yangtze River Economic Belt (YREB), utilizing land use, nighttime light, and energy consumption data to compute LUCE at provincial, prefectural, and county scales, employing spatial autocorrelation, geographic detectors, and the Multiscale Geographically Weighted Regression (MGWR) model to analyze the spatiotemporal dynamics and impact factors of LUCE across different scales. Our results show: (1) Throughout the study period, LUCE in the YREB exhibited a steady increase, rising from 28,434.32 × 104 t to 86,581.79 × 104 t. (2) Positive spatial autocorrelation was observed in LUCE at all three scales. Notably, spatial clustering intensified at the provincial and prefectural levels, while a diminishing trend in clustering was noted at the county scale. (3) Predominant clustering patterns at the prefectural and county scales included H–H and L–L types, with the county scale displaying more pronounced clustering characteristics. (4) Economic development emerged as the primary influencing factor on LUCE at both the prefectural and county scales. Nevertheless, the intensity of impact from carbon emission intensity, industrial structure, population size, government intervention, and land use degree differs between the two levels. This research underscores the high sensitivity of LUCE to administrative scales, emphasizing the necessity of considering these scales when formulating emission reduction strategies.
1 Introduction
In the 21st century, one of the most pressing issues facing humanity is global warming, and how to prepare for climate change is a major global concern (Shehzad, 2023; Yuan et al., 2024;Yang et al., 2025). Human activities related to land use changes were responsible for approximately 33% of carbon emissions between 1850 and 1990 (Houghton and Hackler, 1999), and according to the Global Carbon Project 2020, from 1850 to 2019, land use change resulted in a cumulative amount of around 265 Gt of carbon dioxide (Friedlingstein et al., 2020). LUCE is a major contributor to global warming (Houghton, 2002; Lau et al., 2021; Yan et al., 2022). China is now the biggest carbon emitter in the world, surpassing the combined emissions of the US and the EU (Yu et al., 2022). In September 2020, China declared ambitious goals to reach maximum emissions of carbon by 2030 and zero emissions of carbon by 2060. To achieve China’s carbon neutrality target and encourage high-quality economic development, the national carbon peak plan must be implemented more quickly (Quan and Zhenghao, 2025). The Yangtze River Economic Belt (YREB) is one of the two principal axes of China’s territorial development and economic layout (Lu, 2018), as well as a key region for advancing ecological conservation and green development (Hu et al., 2025). The Chinese government unveiled a strategy for the YREB in November 2018 that prioritizes sustainable development, dissuades massive expansion, supports green ecosystem projects, and unifies operations in the upstream, middle, and downstream sectors of the area. However, many challenges remain in creating ecological development and paths of green growth in the YREB. Rapid economic growth has resulted in significant carbon emissions, a rise in construction, and a rapid decline in ecological and high-quality arable areas. Thus, research on LUCE in the YREB is essential for promoting low-carbon economic growth by informing policies and practices that enable sustainable and low-carbon land use in China.
Scholars have studied LUCE extensively, including carbon emission mechanisms, spatial distribution characteristics, impact factors, and carbon emissions accounting. Land use structure, population increase, and economic output are all major variables in increasing LUCE (Darwish et al., 2023). The bookkeeping model (van Marle et al., 2022), the plot inventory approach (Winkler et al., 2023), and the IPCC’s approach to emission coefficients (Feng et al., 2024; Garofalo et al., 2022) are currently the primary carbon emission accounting methods. Scholars commonly utilize IPCC criteria to calculate LUCE for country greenhouse gas inventories (McGlynn et al., 2022). However, this method utilizes diverse energy consumption data. At larger administrative scales, data completeness is higher, whereas, at smaller scales, data availability is limited. For instance, there are significant gaps in China’s energy consumption statistics at the prefectural and county scales (Lv et al., 2020), although the data at the province scale is comparatively full (Bu et al., 2022). Energy consumption data are frequently used as the primary foundation for calculating carbon emissions from construction land that are indirect. Therefore, past research has mostly concentrated on the national (Lai et al., 2016) and provincial scale (Rong et al., 2022), with few studies undertaken at the prefectural and county scales and much fewer multiscale studies. The intensity of nighttime light and carbon emissions from energy use have been found to be significantly correlated as remote sensing technology develops (Raupach et al., 2010). Scholars have increasingly utilized nighttime light data to explore LUCE at prefectural (Zheng et al., 2024) and county (Liu et al., 2024a) levels. However, research on LUCE has predominantly focused on single administrative scales. Given that socioeconomic development is significantly influenced by regional heterogeneity and geographical scale (Deng et al., 2022), a systematic investigation of LUCE across multiple administrative levels is essential for devising more reasonable and effective emission reduction strategies. Consequently, adopting a multi-scale perspective to study LUCE is of great importance in supporting the formulation of targeted and efficient emission reduction policies for governments at various administrative levels in YREB.
Prior research has used a number of techniques to examine the variables impacting carbon emissions, such as the STIRPAT model (Aziz and Chowdhury, 2023), the IPAT model (Haberl et al., 2023), and the logarithmic mean Divisia index (LDMI) (Khan and Majeed, 2023). However, these investigations predominantly rely on traditional econometric approaches for factor decomposition, often neglecting the spatial dimension’s influence on carbon emission factors and failing to address potential spatial deviations that could affect the results. Furthermore, Moreover, the cumulative effect of numerous influencing factors on carbon emissions is not considered. Geographically weighted regression (GWR) is a traditional local regression model that takes into account both the spatial properties of the data and the geographic location of effect variables. Compared to the classical global regression model, GWR effectively addresses geographical heterogeneity (Pribadi and Pauleit, 2016). However, GWR employs a single bandwidth, leading to homogeneous regression features and a lack of multiscale consideration in studying the impact elements of LUCE. Different factors show varying scale effects on LUCE, and the MGWR model overcomes the limitations of GWR by allowing each factor to possess a unique bandwidth. This exclusive bandwidth reflects its spatial scale and mitigates estimation bias (Fotheringham et al., 2017). MGWR was introduced in 2017 and has seen gradual refinement and practical application since (Yu et al., 2020). Currently, there is limited research utilizing MGWR, primarily focusing on multiscale impact analysis related to environmental pollution and ecological resources. Few academics have applied this approach to studying the impact variables of LUCE. Meanwhile, the geographical detector effectively analyzes the interactions between different influencing factors (Wang and Yang, 2024), distinguishing between individual effects and interactive effects, demonstrating strong applicability. However, the integration of the geographical detector with the MGWR model for an in-depth investigation of the effect factors of LUCE remains limited.
Based on this, this paper focuses on the YREB to investigate the spatiotemporal characteristics and influencing factors of LUCE. Using land use data, energy consumption data, and nighttime light data, LUCE is calculated at the provincial, prefectural, and county levels. Subsequently, a multi-scale analysis is conducted to systematically examine the spatiotemporal features of LUCE and its impact factors through spatial autocorrelation analysis, the Geographic Detector, and the MGWR model. The study aims to provide a scientific foundation for governmental authorities at various administrative levels within the YREB to develop tailored emission reduction strategies.
2 Materials and methods
2.1 Summary of the research area
The YREB (Figure 1) is one of China’s key economic zones, playing a significant role in the country’s overall development (Song et al., 2022). It spans China’s eastern, central, and western regions, serving as a vital link between these areas. The YREB, which makes up over 20% of China’s geographical area and accounts for 45% of the country’s GDP, is essential to economic growth. The YREB is divided into three regions (Dong et al., 2020): the lower reaches (Shanghai, Zhejiang, Jiangsu, and Anhui), covering 17.1% of the belt (353,300 km2); the middle reaches (Jiangxi, Hubei, and Hunan), covering 27.5% of the belt (564,600 km2); and the upstream region (Chongqing, Guizhou, Sichuan, and Yunnan), covering 55.4% of the belt (1,137,400 km2). The region is rich in resources of natural origin and has significant growth potential.
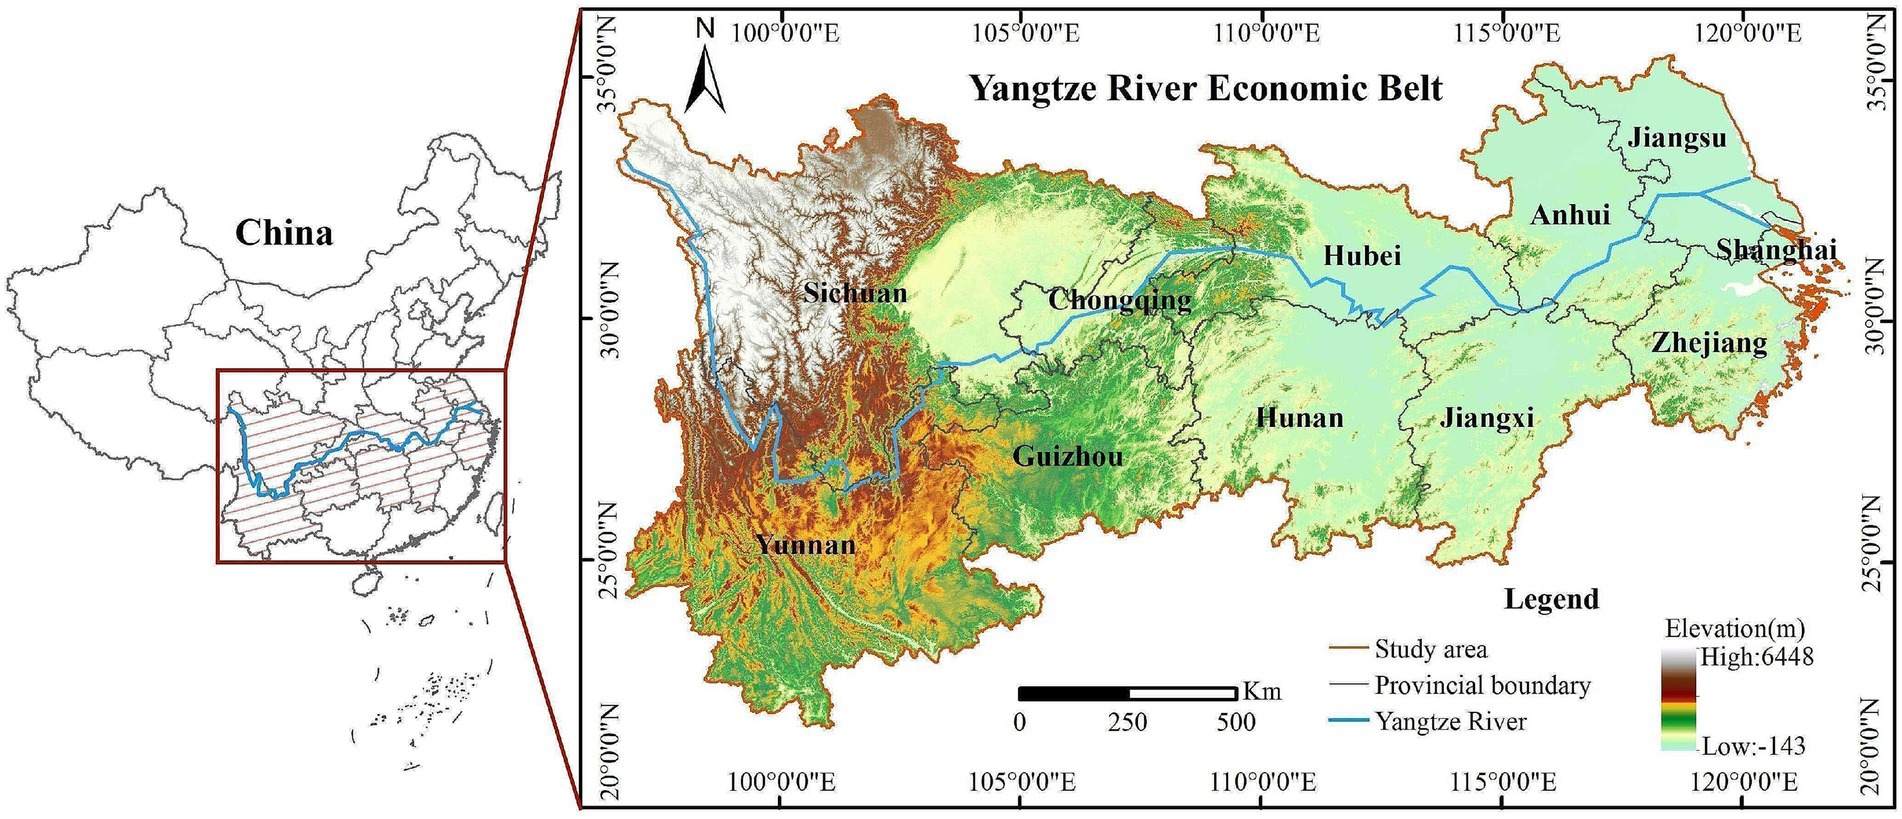
Figure 1. The YREB’s location map.
2.2 Sources of data
The land use data were sourced from Resource and Environmental Science Data Platform.1 This dataset covers five time periods: 2000, 2005, 2010, 2015, and 2020. To meet the research needs, the original 30 m resolution data is resampled to 300 m. In the study area, the land was divided into six primary varieties, including grassland, woodlands, cropland, water, construction land, and unused land. The nighttime light data came from the corrected Chinese long-term dataset spanning 2000–2020 (Zhong et al., 2022), whereas the energy data came from the China Energy Statistical Yearbook (2001–2021). Socioeconomic data primarily originated from the China County Statistical Yearbook and district/county reports on national economic and social development statistics (2001–2021). Population data were retrieved from the World Population database.2 Prefectural scale economic data were obtained through conversions from corresponding county scale data to ensure consistency and accuracy, thereby eliminating errors arising from statistical discrepancies.
2.3 Selection of influencing factors
Economic development (X1), government intervention (X2), population size (X3), industrial structure (X4), carbon emission intensity (X5), and land use degree (X6) were chosen for this article based on available literature and relevant studies (Li et al., 2021; Rahaman et al., 2022;Cai and Li, 2024; Fan et al., 2024; Wang et al., 2024). Carbon dioxide emissions are greatly influenced by economic development; fast economic expansion frequently results in higher energy consumption and, consequently, higher carbon dioxide emissions, as measured by GDP (Shi et al., 2019). Government intervention is a pivotal factor in impacting economic growth, industrial composition, and technological advancement and, consequently, carbon emissions. The ratio of fiscal expenditure to GDP is frequently used to evaluate the degree of government intervention (Ma and Liu, 2021). The industrial sector is a major source of CO2 emissions, and changes in industrial structure can have a large influence on carbon emissions (Shi et al., 2019). Population has a considerable impact on carbon dioxide emissions, as there is a tight link between the two. The continuing rise of the population not only directly contributes to increasing energy consumption but also to higher carbon dioxide emissions (Li et al., 2017). The industrial structure is assessed by calculating the ratio of the output value of the tertiary industry to that of the secondary industry (Li et al., 2023). It is anticipated that carbon emission intensity will continue to decline as technology develops, which is essential for reducing total CO2 emissions (Li et al., 2021). The quantity of carbon emissions for each unit of economic production is shown by the carbon intensity decrease, which is computed as the ratio of total carbon emissions to GDP. A higher land use degree usually leads to larger construction land areas and greater carbon emissions. However, efficient and economical construction land use can reduce carbon dioxide emissions. The percentage of construction land to the entire land area is one metric used to evaluate the extent of land utilization (Song et al., 2022).
2.4 Research approach
2.4.1 Method of calculating carbon emissions
Direct carbon emission calculation method:
where Ek is direct carbon emission; Ei represents the amount of carbon emissions produced in type i land; Ti stands for the total land area of type i; and δi signifies the coefficient representing carbon emissions or absorption for land use type i. Based on prior research findings, the carbon emission (absorption) coefficients for different land use types were established as follows: cropland (0.422 t/ha2.a) (Sun et al., 2015; Zhang et al., 2022), woodland (−0.644 t/ha2.a) (Sun et al., 2015; Zhang et al., 2022), grassland (−0.021 t/ha2.a) (Sun et al., 2015; Zhang et al., 2022), water (−0.253 t/ha2.a) (Sun et al., 2015; Zhang et al., 2022), and unused land (−0.005 t/ha2.a) (Sun et al., 2015; Zhang et al., 2022).
2.4.1.1 Indirect carbon emission calculation method
Energy consumption data and nighttime light data were utilized to indirectly estimate the carbon emissions from construction land in the provinces, prefecture-level cities, and counties of the YREB (Liu et al., 2024b). The comprehensive calculation process is provided in Supplementary Appendix.
2.4.2 Global spatial autocorrelation analysis
The following is the formula:
where I is the global Moran’s value; n stands for the quantity of study subjects; xi and xj are the desired genus traits’ values that were observed in the objects of study i and j; wij is the adjacent weight of objects i and j; and represents the mean value of the attribute of the research object.
2.4.3 Local spatial autocorrelation analysis
The following is the expression:
where Ii is the local Moran index; x’i and x’j are unit observations that are standardized; and wij is the weight.
2.4.4 Geographical detector
This study primarily utilizes two methods from the Geographical Detector: factor detection and interaction detection. The exact equation is as follows (Wang and Xu, 2017):
Where q represents the explanatory power of the impact factor on LUCE; h = 1,…, L represents the categorization or zoning of LUCE impact factor X; Nh and N are the sample sizes for layer h and the study area; and the variances of Y values for layer h and the entire area are denoted as. The value of q ranges from [0,1], with larger values indicating stronger explanatory power of the influencing factor on LUCE.
The interaction detector is used to identify the interactions between different influencing factors, i.e., to assess whether the joint effect of two factors enhances or weakens the explanatory power of LUCE. The relationships between two factors include five types: nonlinear weakening, single-factor nonlinear weakening, two-factor enhancement, independence, and nonlinear enhancement.
2.4.5 MGWR
The MGWR model is expressed as:
where yi is the explained variable of research area i, (ui, vi) represents the central coordinate of position i, xij stands for the value of the jth impact factor in study area i, β0 is the intercept term, εi is the error term, βbwj (ui, vi) is the local regression coefficient of the jth impact factor in study region i, and bwj stands for the bandwidth used by the regression coefficient of the jth impact factor.
3 Results
3.1 Land use change analysis
Significant variance was seen in land use types and change patterns over the whole YREB from 2000 to 2020. The most common land use categories were grassland, cropland, and woodland (Figure 2a). In general, cropland with grassland consistently decreased, while woodlands, water bodies, construction land, and unused land exhibited upward trends. Notably, among these changes, the shifts in cropland and construction land were particularly noteworthy. Cropland decreased from 638,558.68 to 607,027.86 km2, marking a total reduction of 31,530.83 km2. Conversely, construction land expanded from 52,107.04 to 84,604.74 km2, representing a gain of 32,497.7 km2. Woodlands, water, and unused land increased by 661.14, 2,142.44, and 269.34 km2, respectively, while the grassland area remained under 4,039.80 km2. According to Sankey’s diagram (Figure 2b) illustrating land use transitions over different periods, cropland, primarily converted into construction land, emerged as the most significant land use transformation. This implies that a significant loss of cropland resources resulted from the YREB’s fast urbanization.
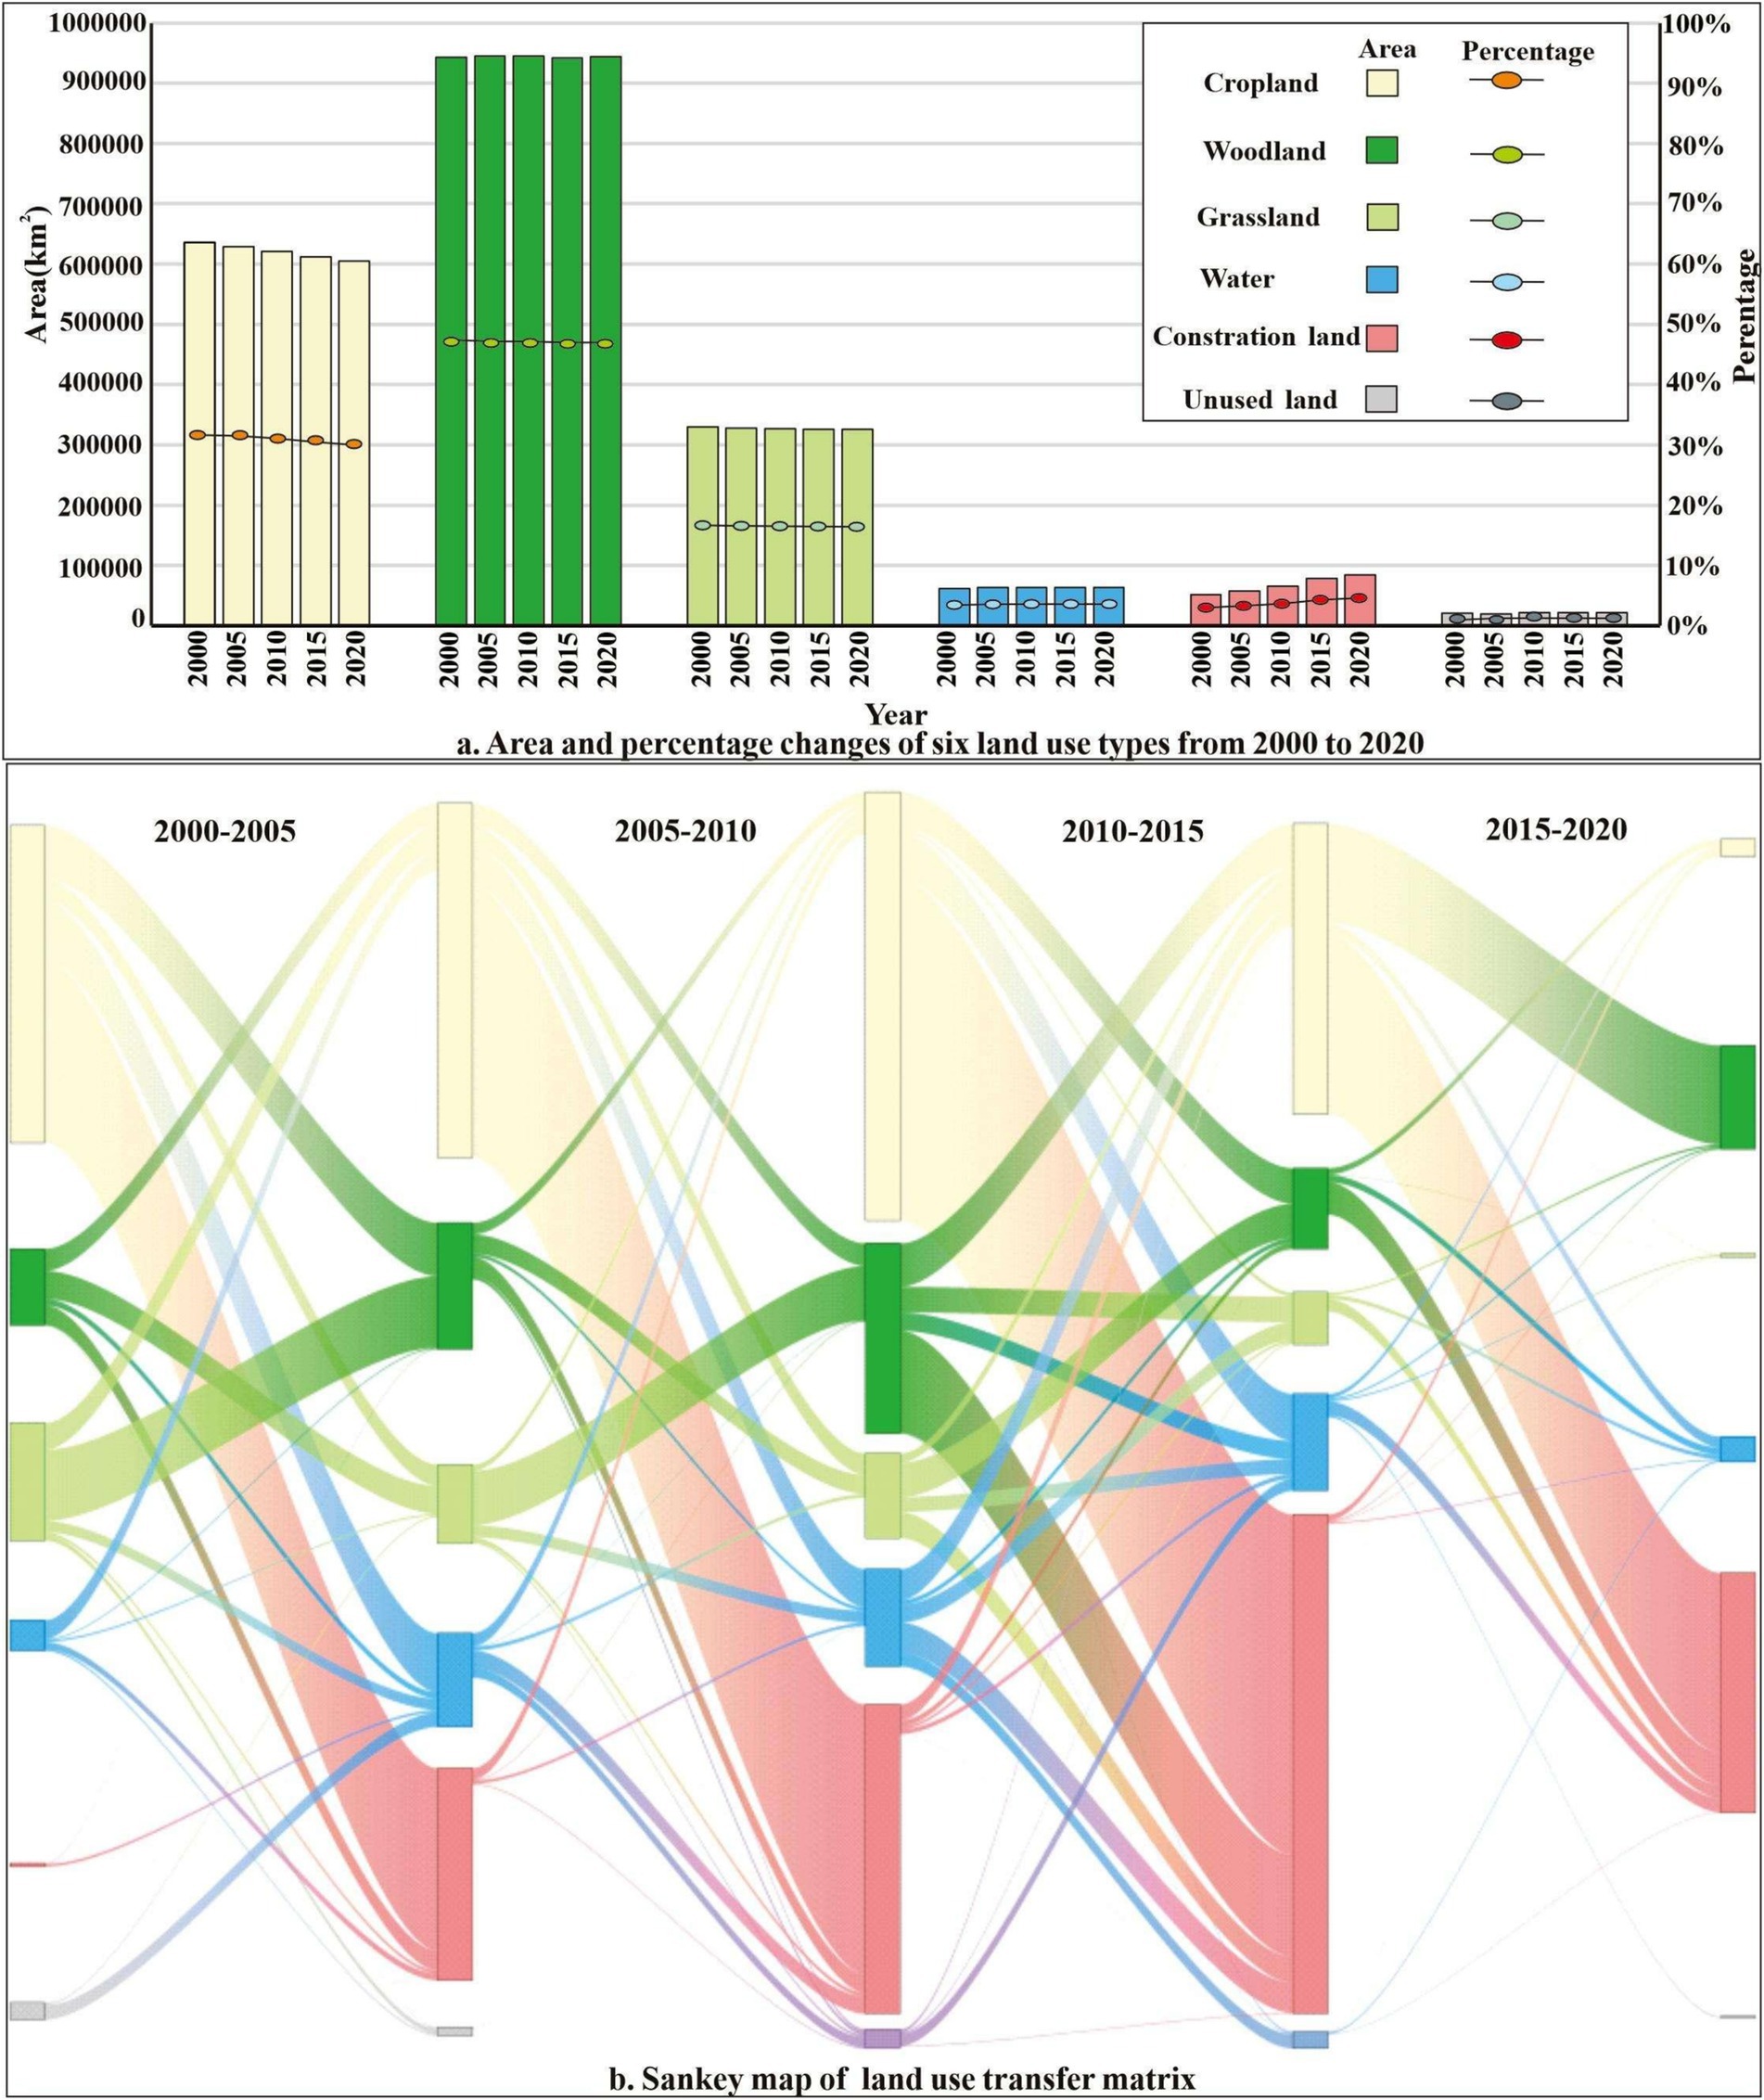
Figure 2. Land use change in the YREB.
3.2 Spatiotemporal evolution characteristics of the LUCE in the YREB
3.2.1 Time evolution characteristics
The overall LUCE (sum of the carbon sources and carbon sinks) in the YREB increased by nearly 3.04 times between 2000 and 2020 (Figure 3c), from 28434.32 × 104 t to 86,581.79 × 104 t. Figure 3a illustrates the variations in the carbon source structure of various land types. It is evident that the carbon source from construction land is much greater, surpassing 92%, while the carbon source from cropland is very low, making up less than 8%. While the YREB’s construction land area grew between 2000 and 2020, the cropland area continued to decline. This shift led to a steady decrease in the percentage of carbon emissions from cropland, while the percentage from construction land progressively increased (Figure 3a). Carbon sinks serve a crucial function in carbon sequestration and regional carbon emissions. The YREB (Figure 3b) witnessed minimal variations in carbon sinks over the research period, with woodlands contributing to approximately 96% of the region’s carbon sink capacity. Conversely, the combined amount of the other three land types accounted for around 4% of the carbon sink capacity of the area.
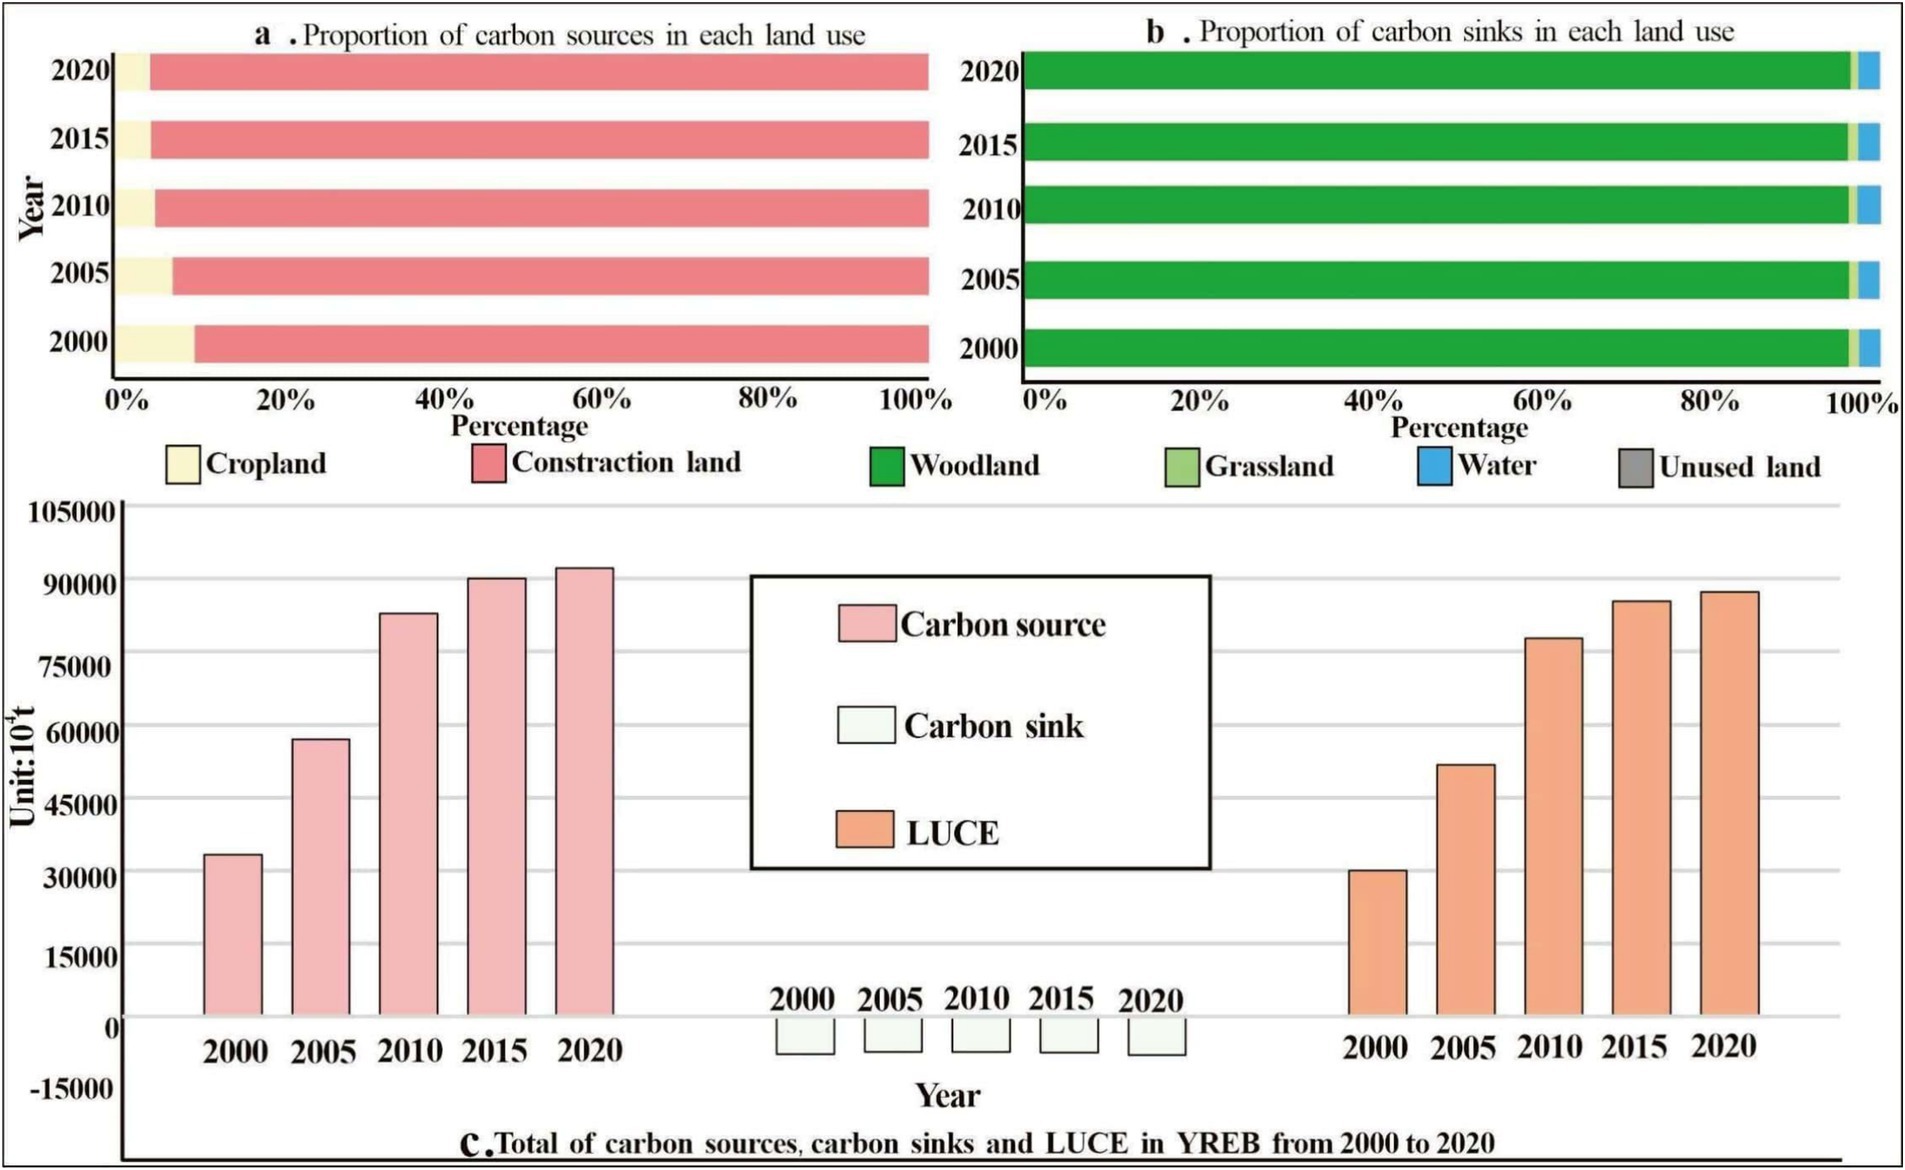
Figure 3. Changes in the LUCE in the YREB.
3.2.2 Characteristics of spatial evolution
From 2000 to 2020 (Figures 4–6), the LUCE in the YREB showed different characteristics of regional change. In general, they have “high downstream and low upstream” characteristics. At the provincial scale (Figure 4), Jiangsu and Zhejiang consistently ranked highest in terms of LUCE within the YREB. Notably, these two provinces are also prominent developed regions in China. Their rapid economic growth has been accompanied by an expansion of construction land and significant energy consumption, resulting in substantial carbon emissions. Consequently, Jiangsu and Zhejiang Provinces should be the YREB’s primary emission reduction provinces. On the other hand, Yunnan, Jiangxi, and Guizhou reported the lowest LUCE. These provinces are less developed within China and are characterized by relatively underdeveloped economies and extensive woodland and grassland areas, which contribute to their lower LUCE.
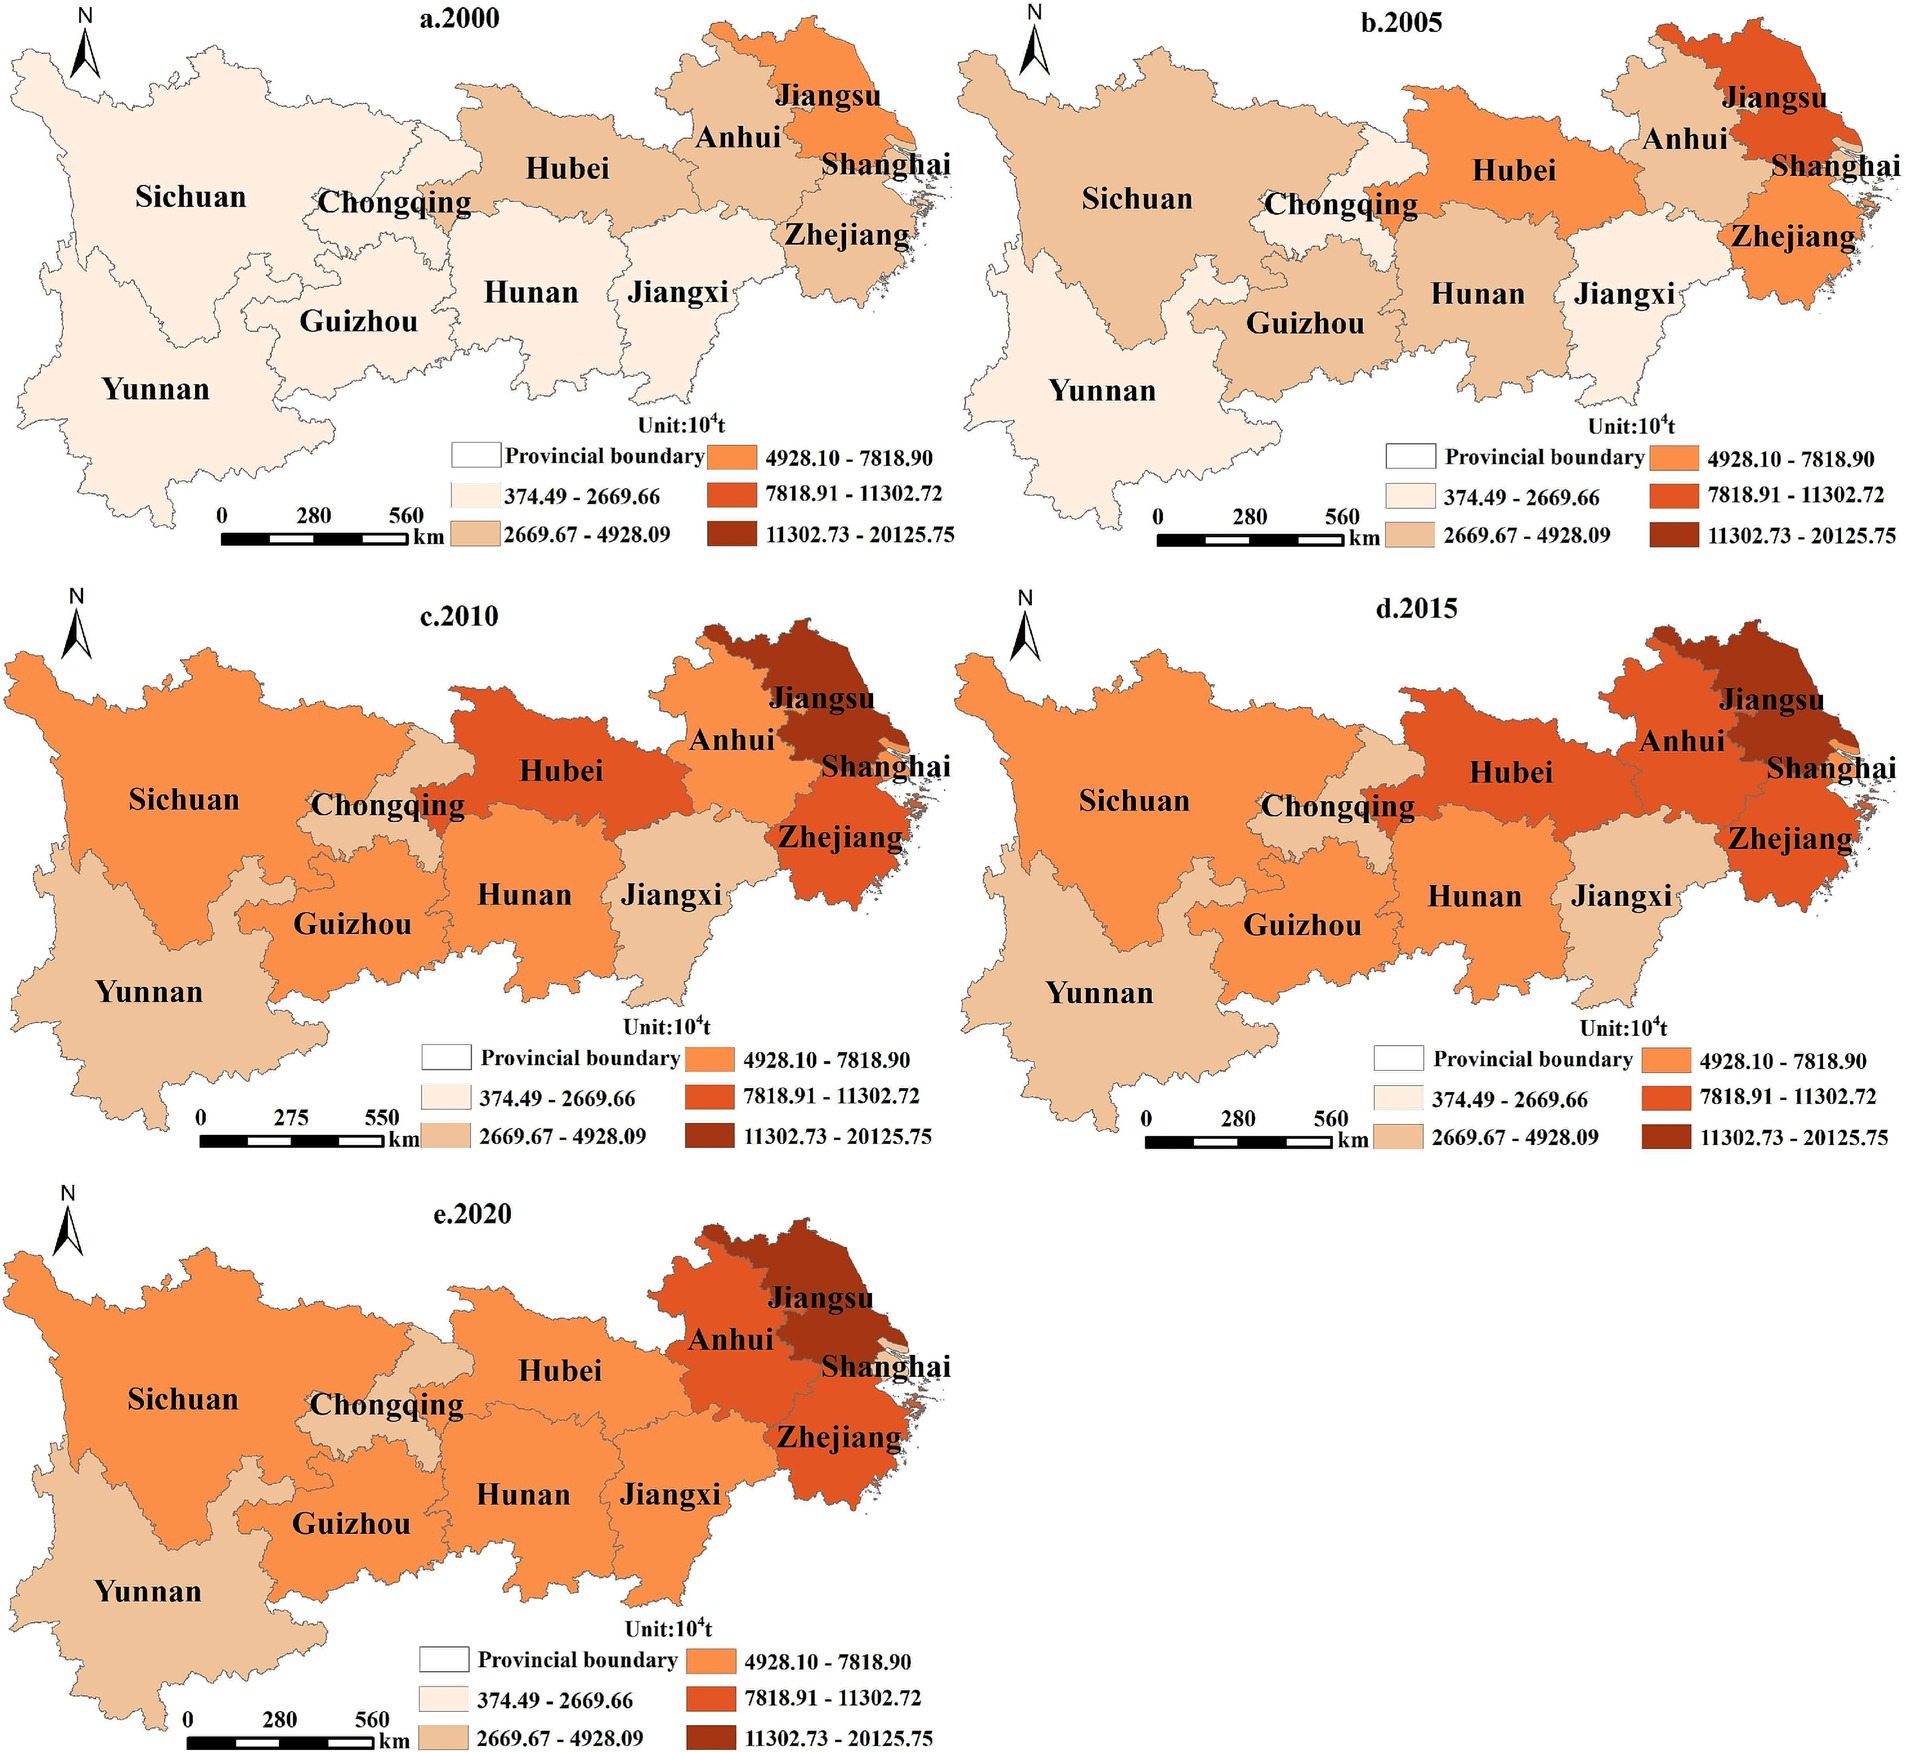
Figure 4. Spatial distribution of provincial LUCE in the YREB.
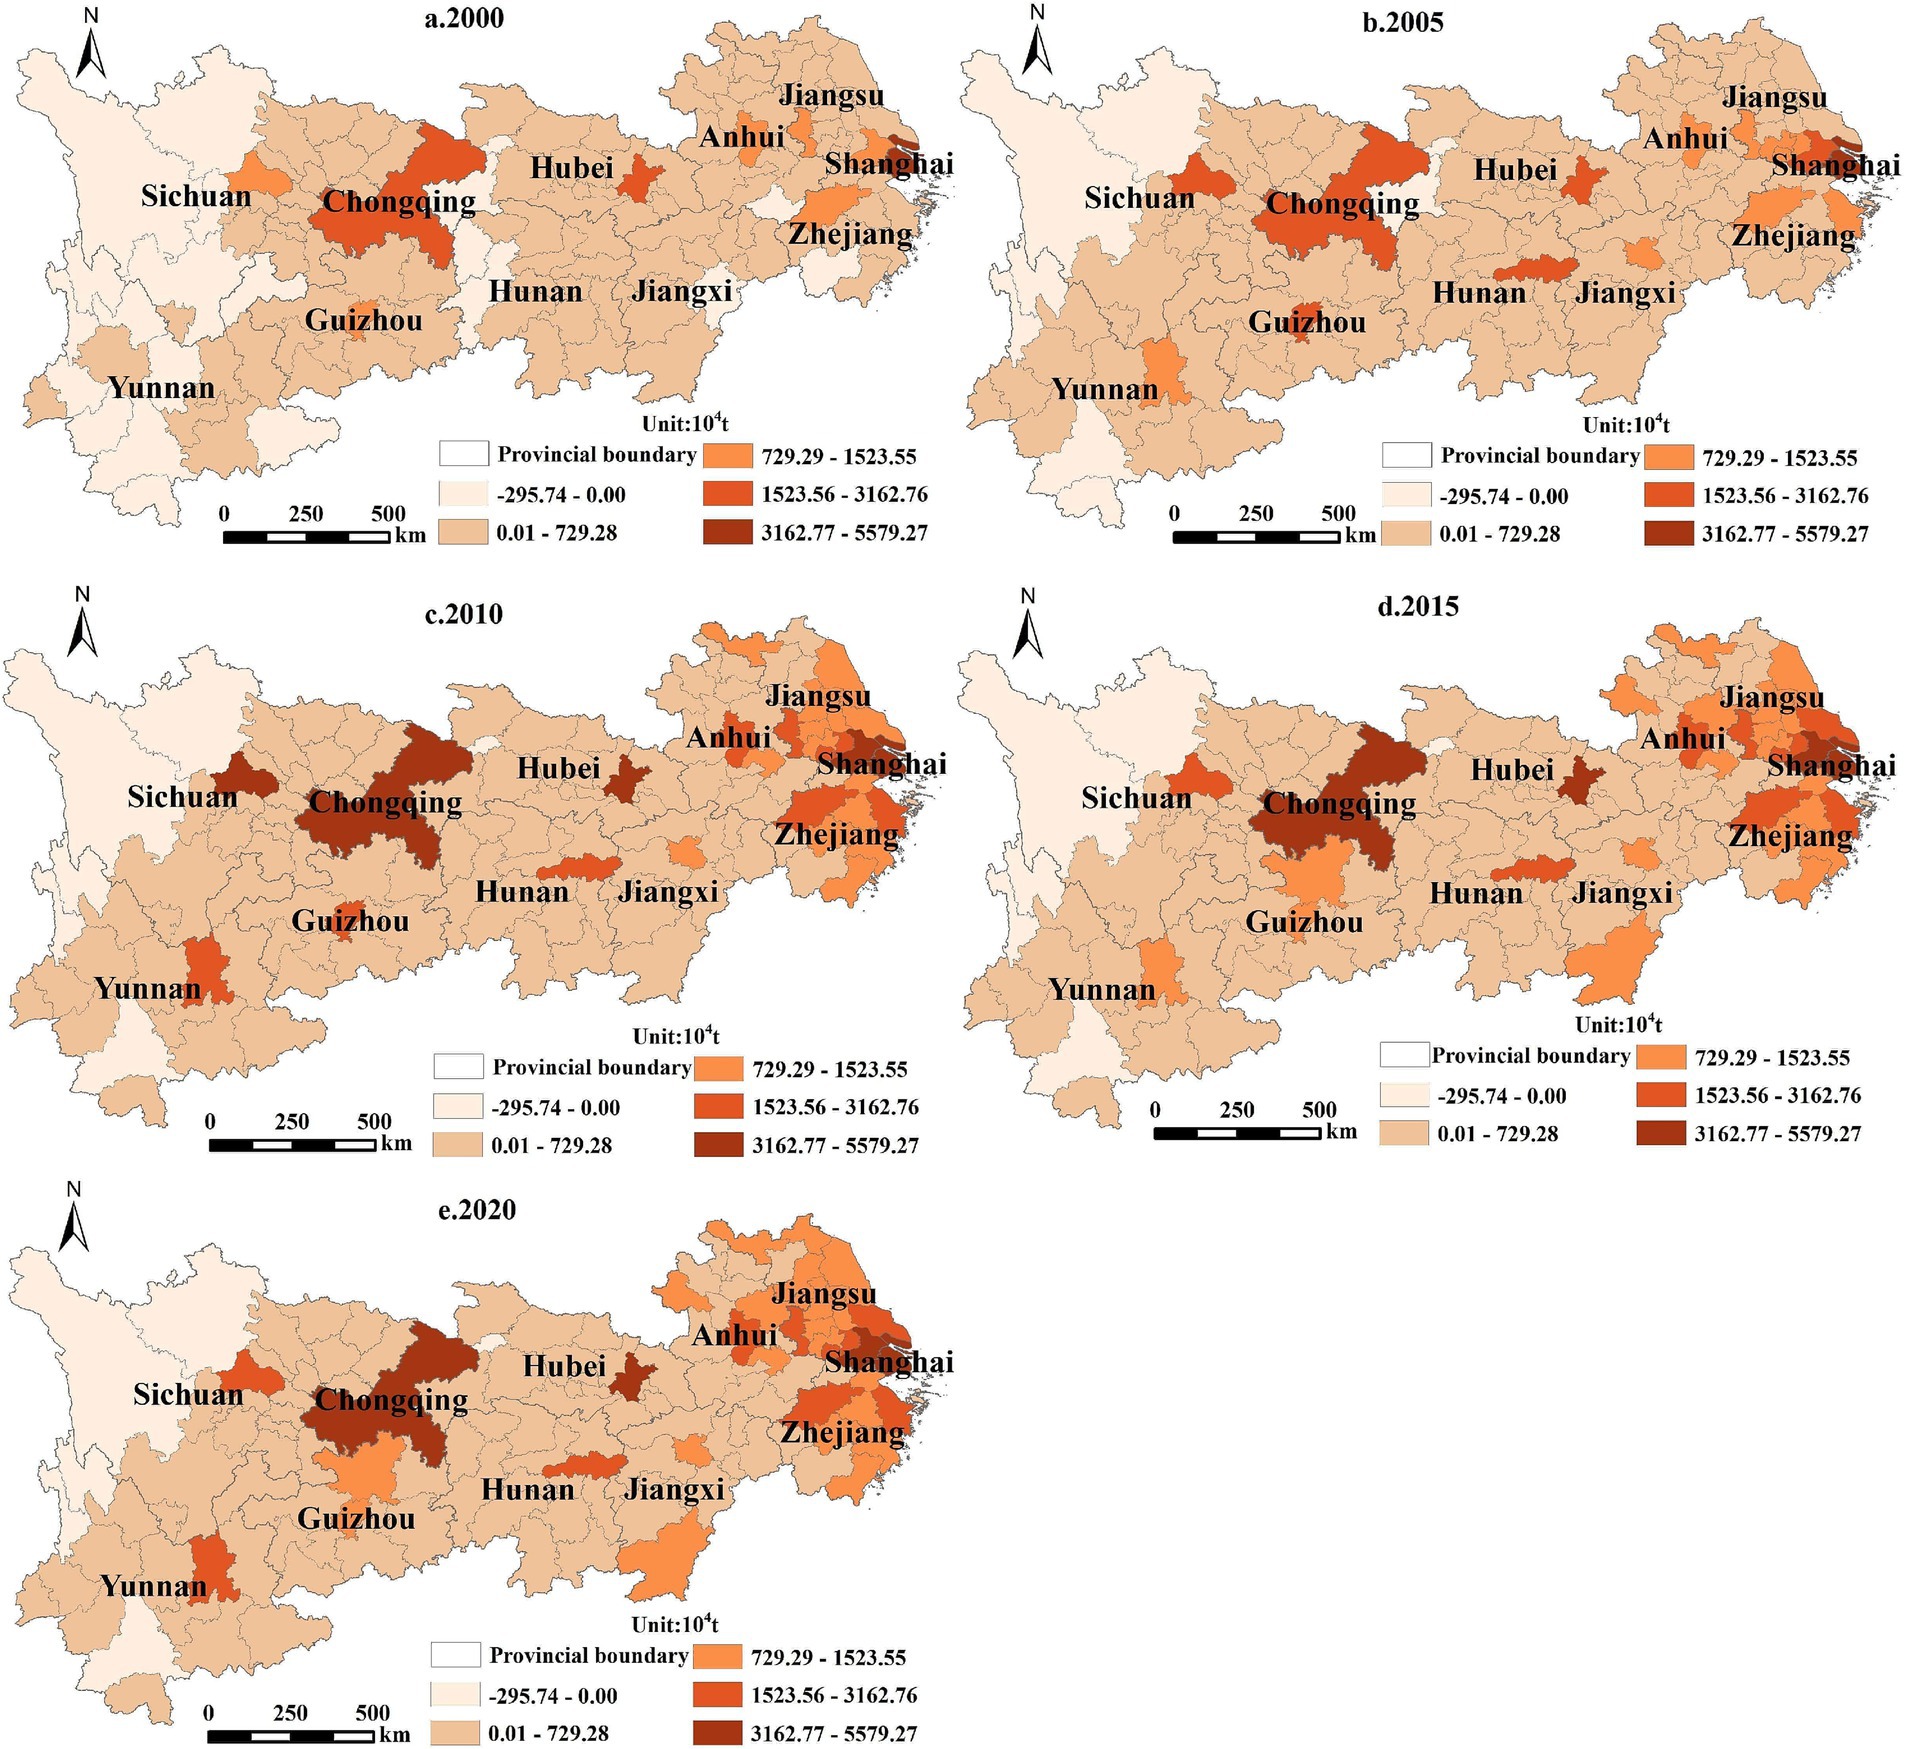
Figure 5. Spatial distribution of prefecture LUCE in the YREB.
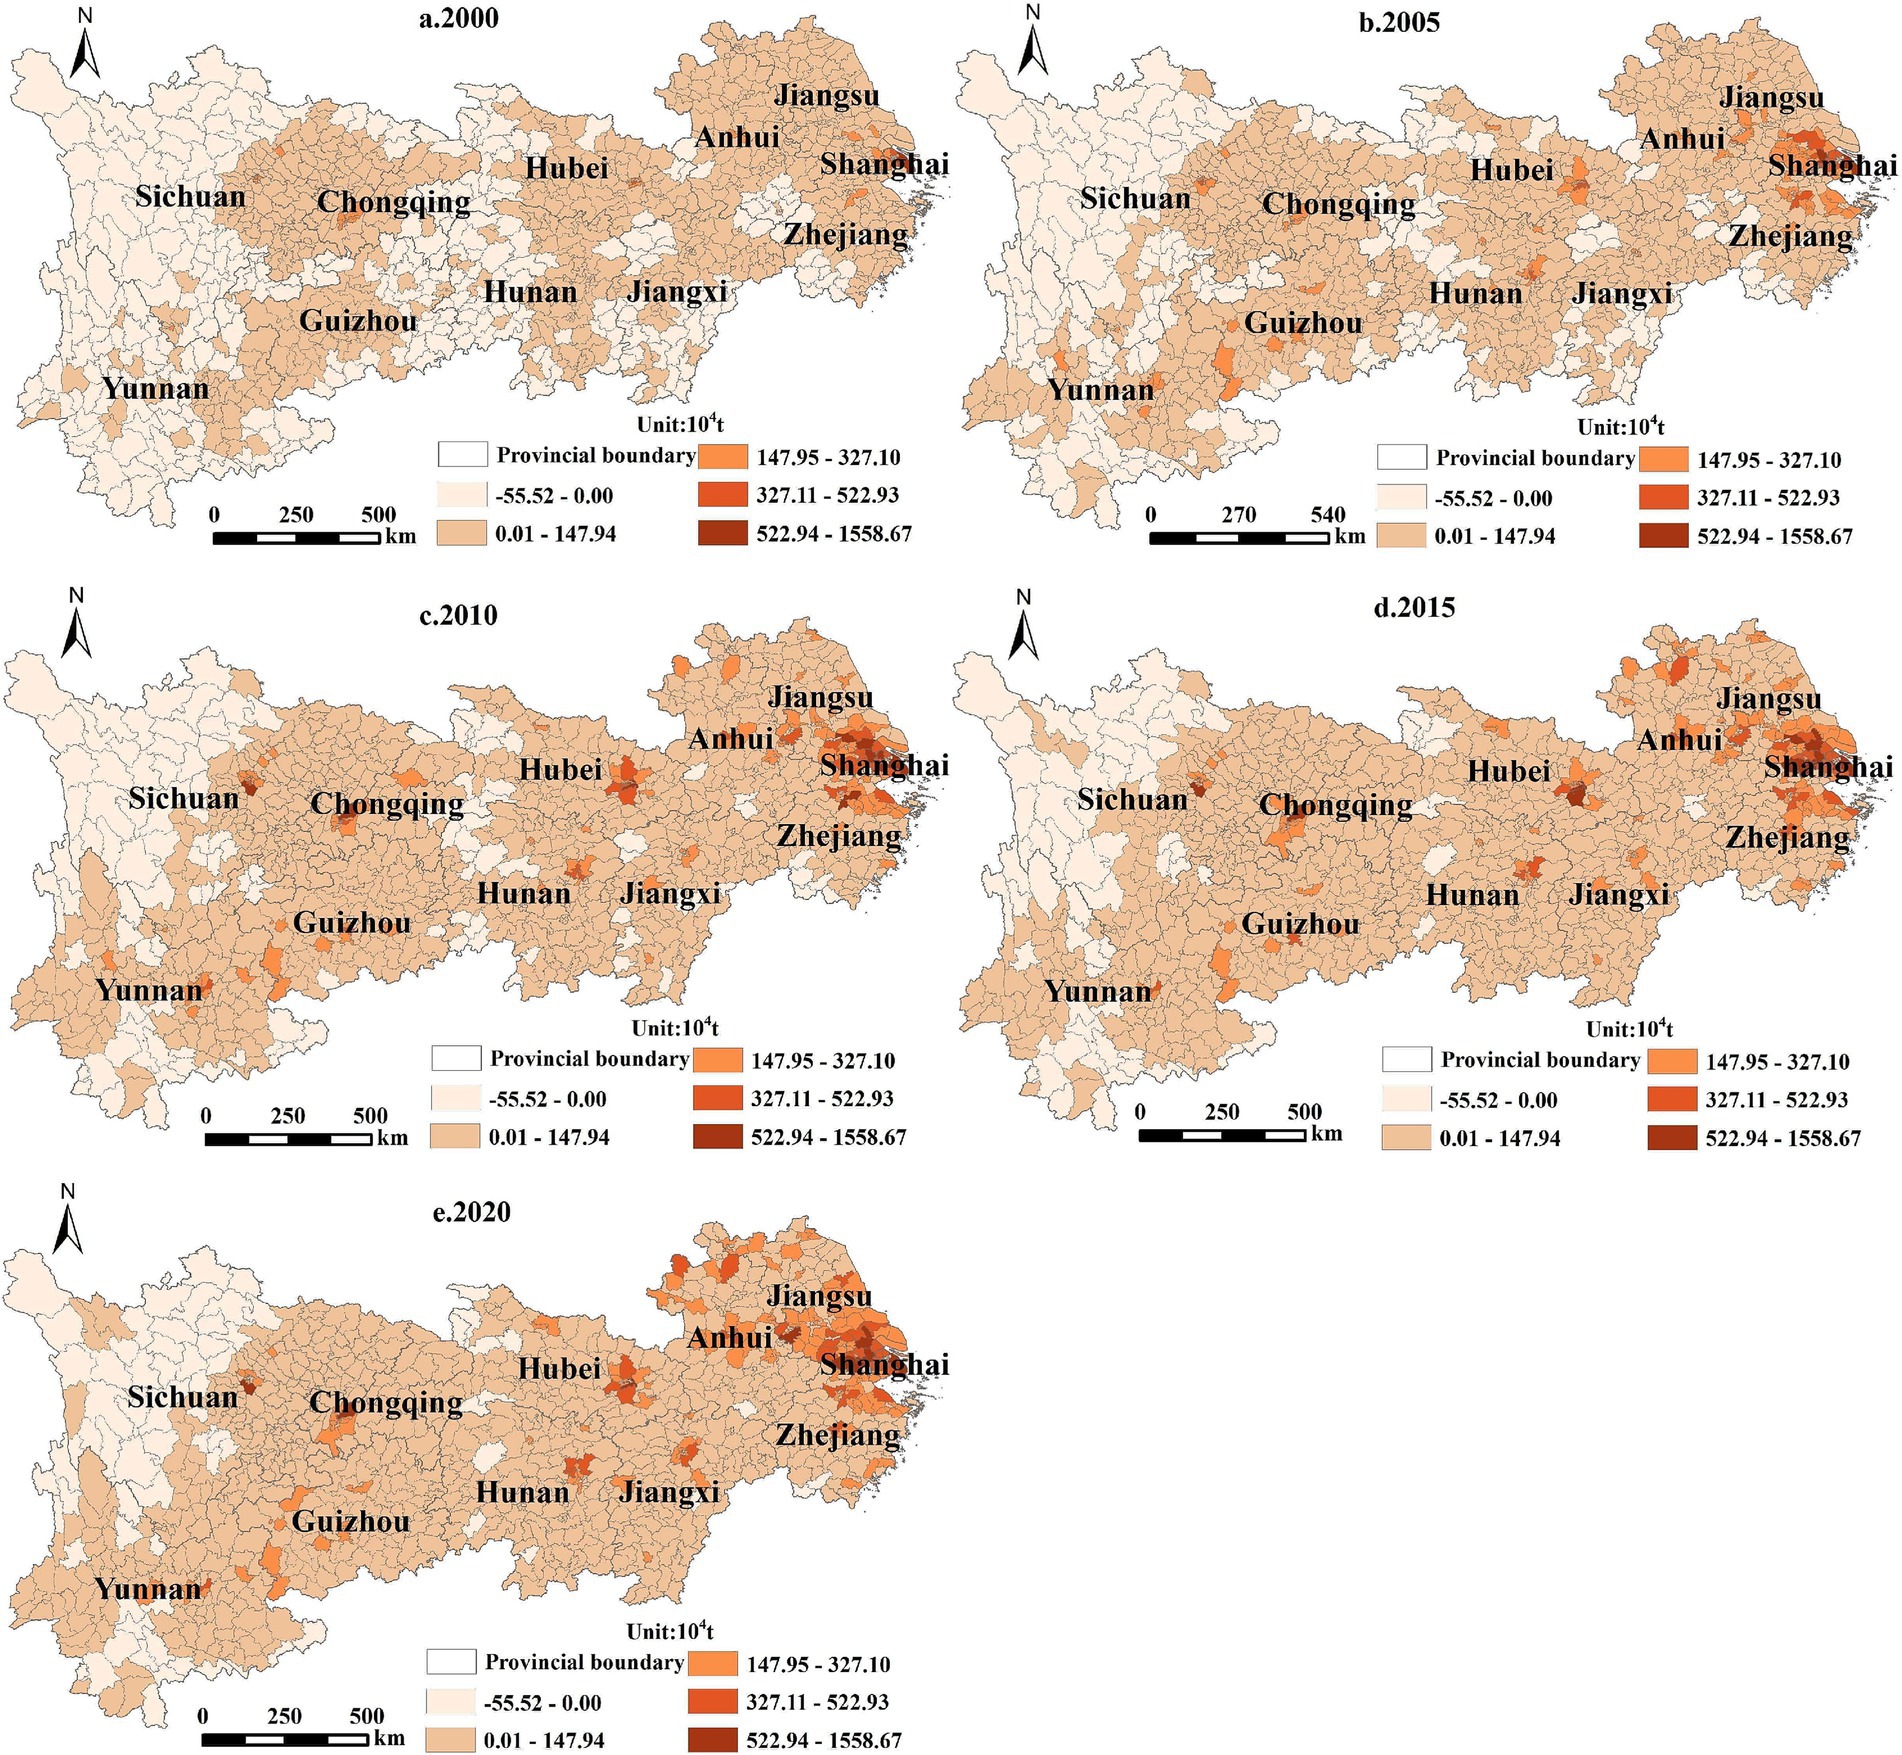
Figure 6. Spatial distribution of county-scale LUCE in the YREB.
At the prefecture scale (Figure 5), cities with high LUCE are primarily located in Jiangsu, Zhejiang, Shanghai, and Chongqing. Conversely, cities with lower LUCE scales are primarily located in Sichuan and Yunnan. Specifically, Shanghai, Chongqing, Suzhou, and Wuhan have the highest LUCE values, followed by Wuxi, Hangzhou, Ningbo, Changsha, Chengdu, Nanjing, Nantong, and Hefei. These cities should be the central focus of carbon emission reduction efforts within the YREB. When compared to the provincial scale, Jiangsu and Zhejiang have the highest LUCE values. The prefectural cities with the highest LUCE generally follow provincial trends but also show some variations within the same province.
At the county scale (Figure 6), there is a noticeable increase in areas with high LUCE values within the YREB. These areas are primarily concentrated in Zhejiang and Jiangsu Provinces, along with major cities such as Shanghai, Suzhou, Wuxi, Nantong, and others. These counties with higher LUCE scales are focal points for carbon emissions reduction within the YREB’s county scale. The distribution of LUCE characteristics at the county scale in the YREB is similar to that at the provincial and prefectural scales, although there are notable internal differences.
3.3 Spatial correlation examination
From 2000 to 2020, the LUCE’s global Moran’s I values at the three administrative scales in the YREB are continuously positive (Table 1). The Z-value exceeds 1.96, except for the provincial scales in 2005, 2010, and 2015, with the p-value at the 5% level being significant. These findings suggest a significant positive spatial correlation in the LUCE at all three administrative scales in the YREB. Between 2000 and 2020, there were significant fluctuations in the global Moran’s I values for LUCE across different administrative scales. Specifically, at the provincial scale, the global Moran’s I grew from 0.201 to 0.211, indicating a clear upward trend. Similarly, at the prefectural scale, the global Moran’s I also showed an increasing trend, rising from 0.136 in 2000 to 0.161 in 2020. It is noteworthy that the increase in Moran’s I at the provincial scale was more pronounced than that at the prefectural scale. Conversely, at the county scale, the global Moran’s I showed a decreasing trend, declining from 0.561 in 2000 to 0.522 in 2020. This phenomenon may be attributed to the diversification of land use patterns among counties and the differences in policy implementation and development positioning. Some counties have significantly reduced carbon emissions due to the promotion of ecological protection and restoration projects, while others have experienced increased carbon emissions driven by urbanization and the expansion of construction land. This heterogeneity has weakened the spatial agglomeration at the county level. Meanwhile, during rapid urbanization, the relatively slower growth of carbon emissions in economically underdeveloped counties further diminishes the agglomeration effect. In contrast, the increase in the global Moran’s index at the provincial and prefectural levels reflects the uniformity of macro-level policies and the convergence of industrial planning. At these scales, the development of low-carbon industries and regional coordination planning significantly enhance the spatial correlation of carbon emissions. Larger spatial units effectively smooth out local differences, resulting in a stronger spatial aggregation effect over broader areas. Overall, the spatiotemporal characteristics of land use carbon emissions exhibit significant scale effects, with the county level highlighting local heterogeneity more prominently.
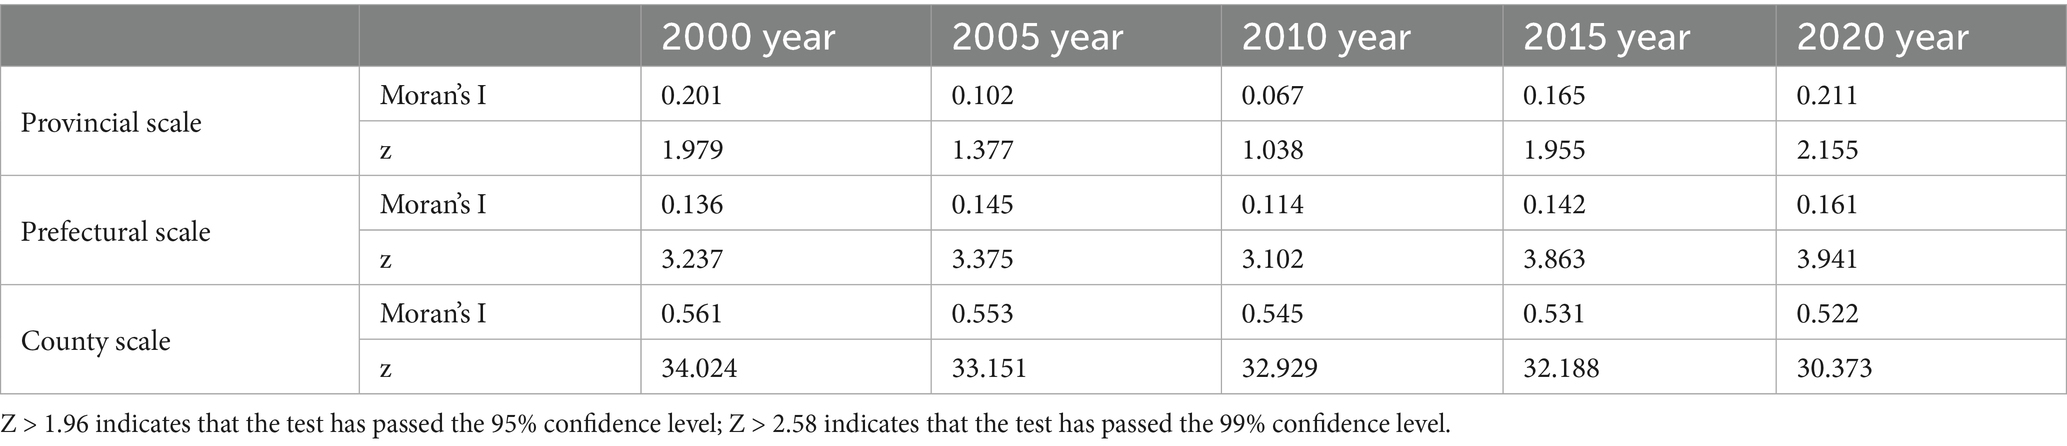
Table 1. Global correlation analysis results.
Concerning local spatial autocorrelation, it is observed that at the provincial scale, the LUCE in the YREB lacks spatial agglomeration features. At the prefectural scale, there is no significant alteration in the spatial clustering pattern of the LUCE in the YREB (Figure 7). This pattern is characterized by High–High (H–H) and Low–Low (L–L) regional clustering, along with sporadic occurrences in High–Low (H–L) and Low–High (L–H) regions. In general, the H–H agglomeration regions are concentrated in the lower Yangtze River region, encompassing Shanghai, Jiangsu, and Zhejiang provinces. L–L agglomeration regions are primarily situated in Sichuan and Yunnan Provinces. L–H regions are mostly located in Huzhou, Zhoushan, and Ziyang. These cities are mainly concentrated around cities with high LUCE, indicating that their LUCE is low but affected by the positive spillover effect of high-carbon areas. The main regions with H–L characteristics are Chengdu and Chongqing, clustered predominantly around L–L agglomeration areas, leading to significant carbon emissions that spill over into the low-value regions. The prefectural scale LUCE displays more pronounced regional agglomeration and spatial heterogeneity compared to the provincial level.
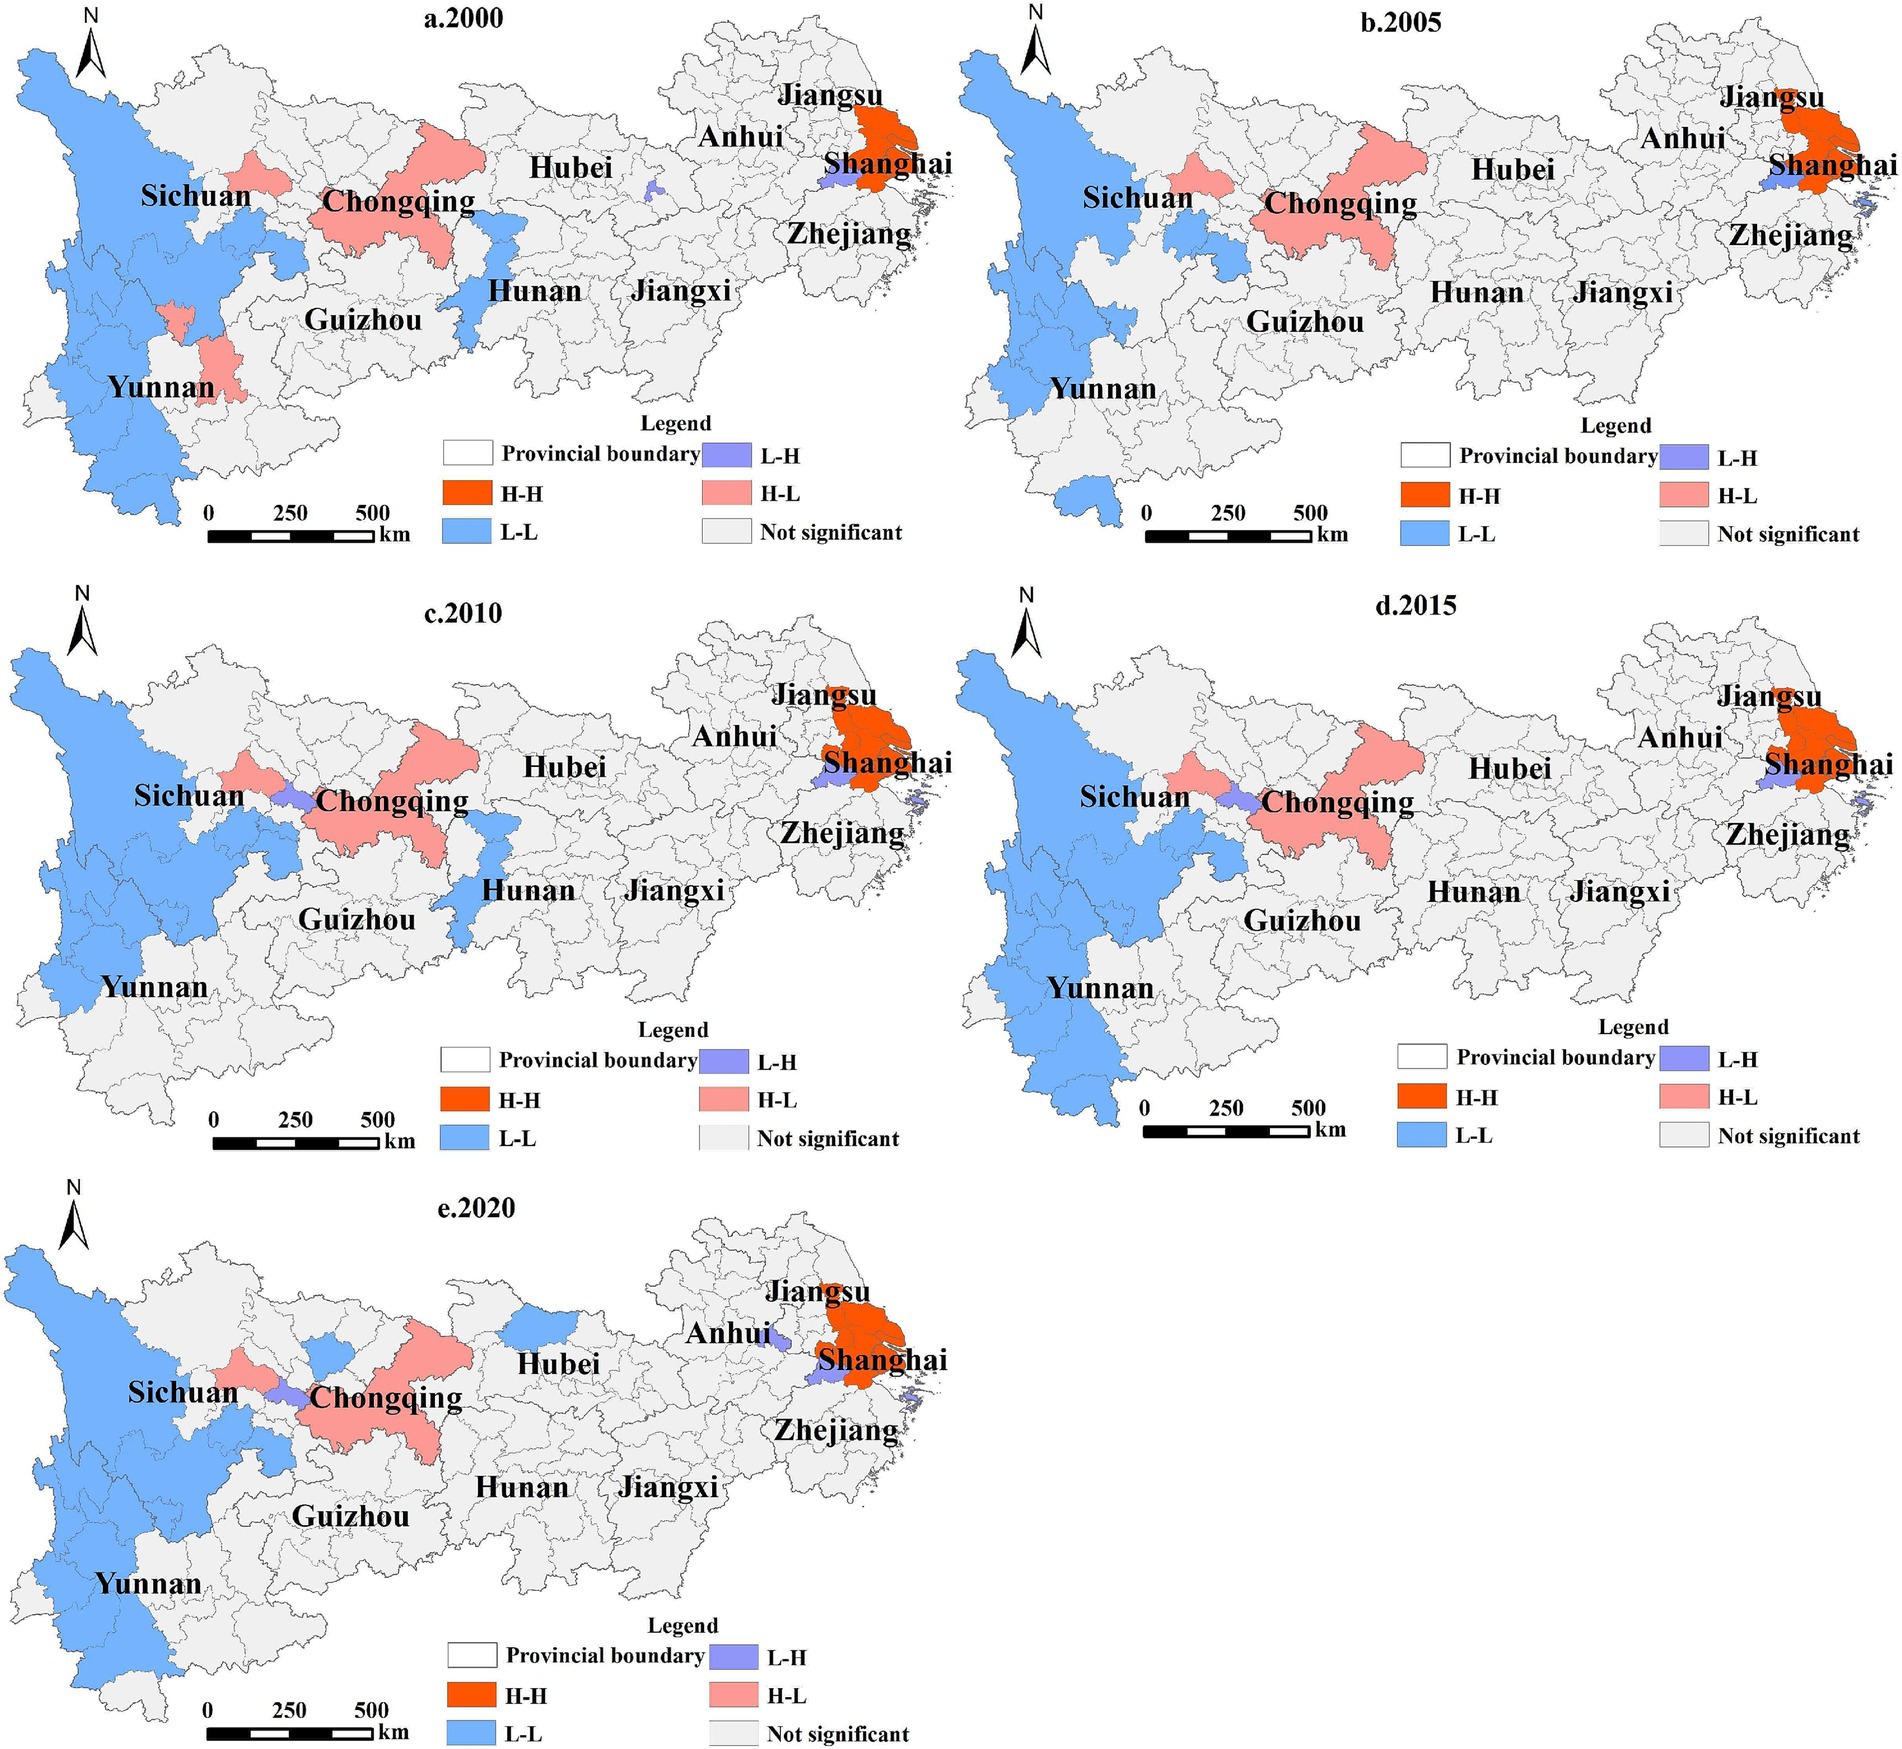
Figure 7. LISA aggregation map of prefectural LUCE in the YREB.
At the county level (Figure 8), the spatial clustering of the LUCE in the YREB exhibits no significant variation. They are characterized by H–H and L–L regional agglomeration, with sporadic instances of H–L and L–H distribution. From 2000 to 2020, regions with H–H agglomeration were mostly concentrated in Zhejiang, Jiangsu, and Shanghai, and their numbers continued to grow. H–H agglomeration regions were detected in the districts and counties of Wuhan, Changsha, Chongqing, and Chengdu. L–L agglomeration areas were mostly found in Jiangxi, Yunnan, and Sichuan. Additionally, they were sparsely distributed in the central parts of Hubei and Hunan, with occasional appearances in the lower Yangtze River portions of Zhejiang. L–H agglomeration regions are characterized by low LUCE values, although they are impacted by the favorable spillover effects of high-carbon areas. H–L agglomeration regions are located around the L–L agglomeration regions in the central reaches of Hunan, Hubei, and Jiangxi Provinces, and the upstream regions of Sichuan and Yunnan Provinces. Their high LUCE scales have a spillover impact on the L–L agglomeration regions to some extent. The findings of the global Moran’s I analysis are consistent with this, indicating that the spatial correlation of LUCE at the county level decreased throughout this time. In summary, the county level exhibits greater spatial heterogeneity and regional agglomeration characteristics compared to the prefectural scale.
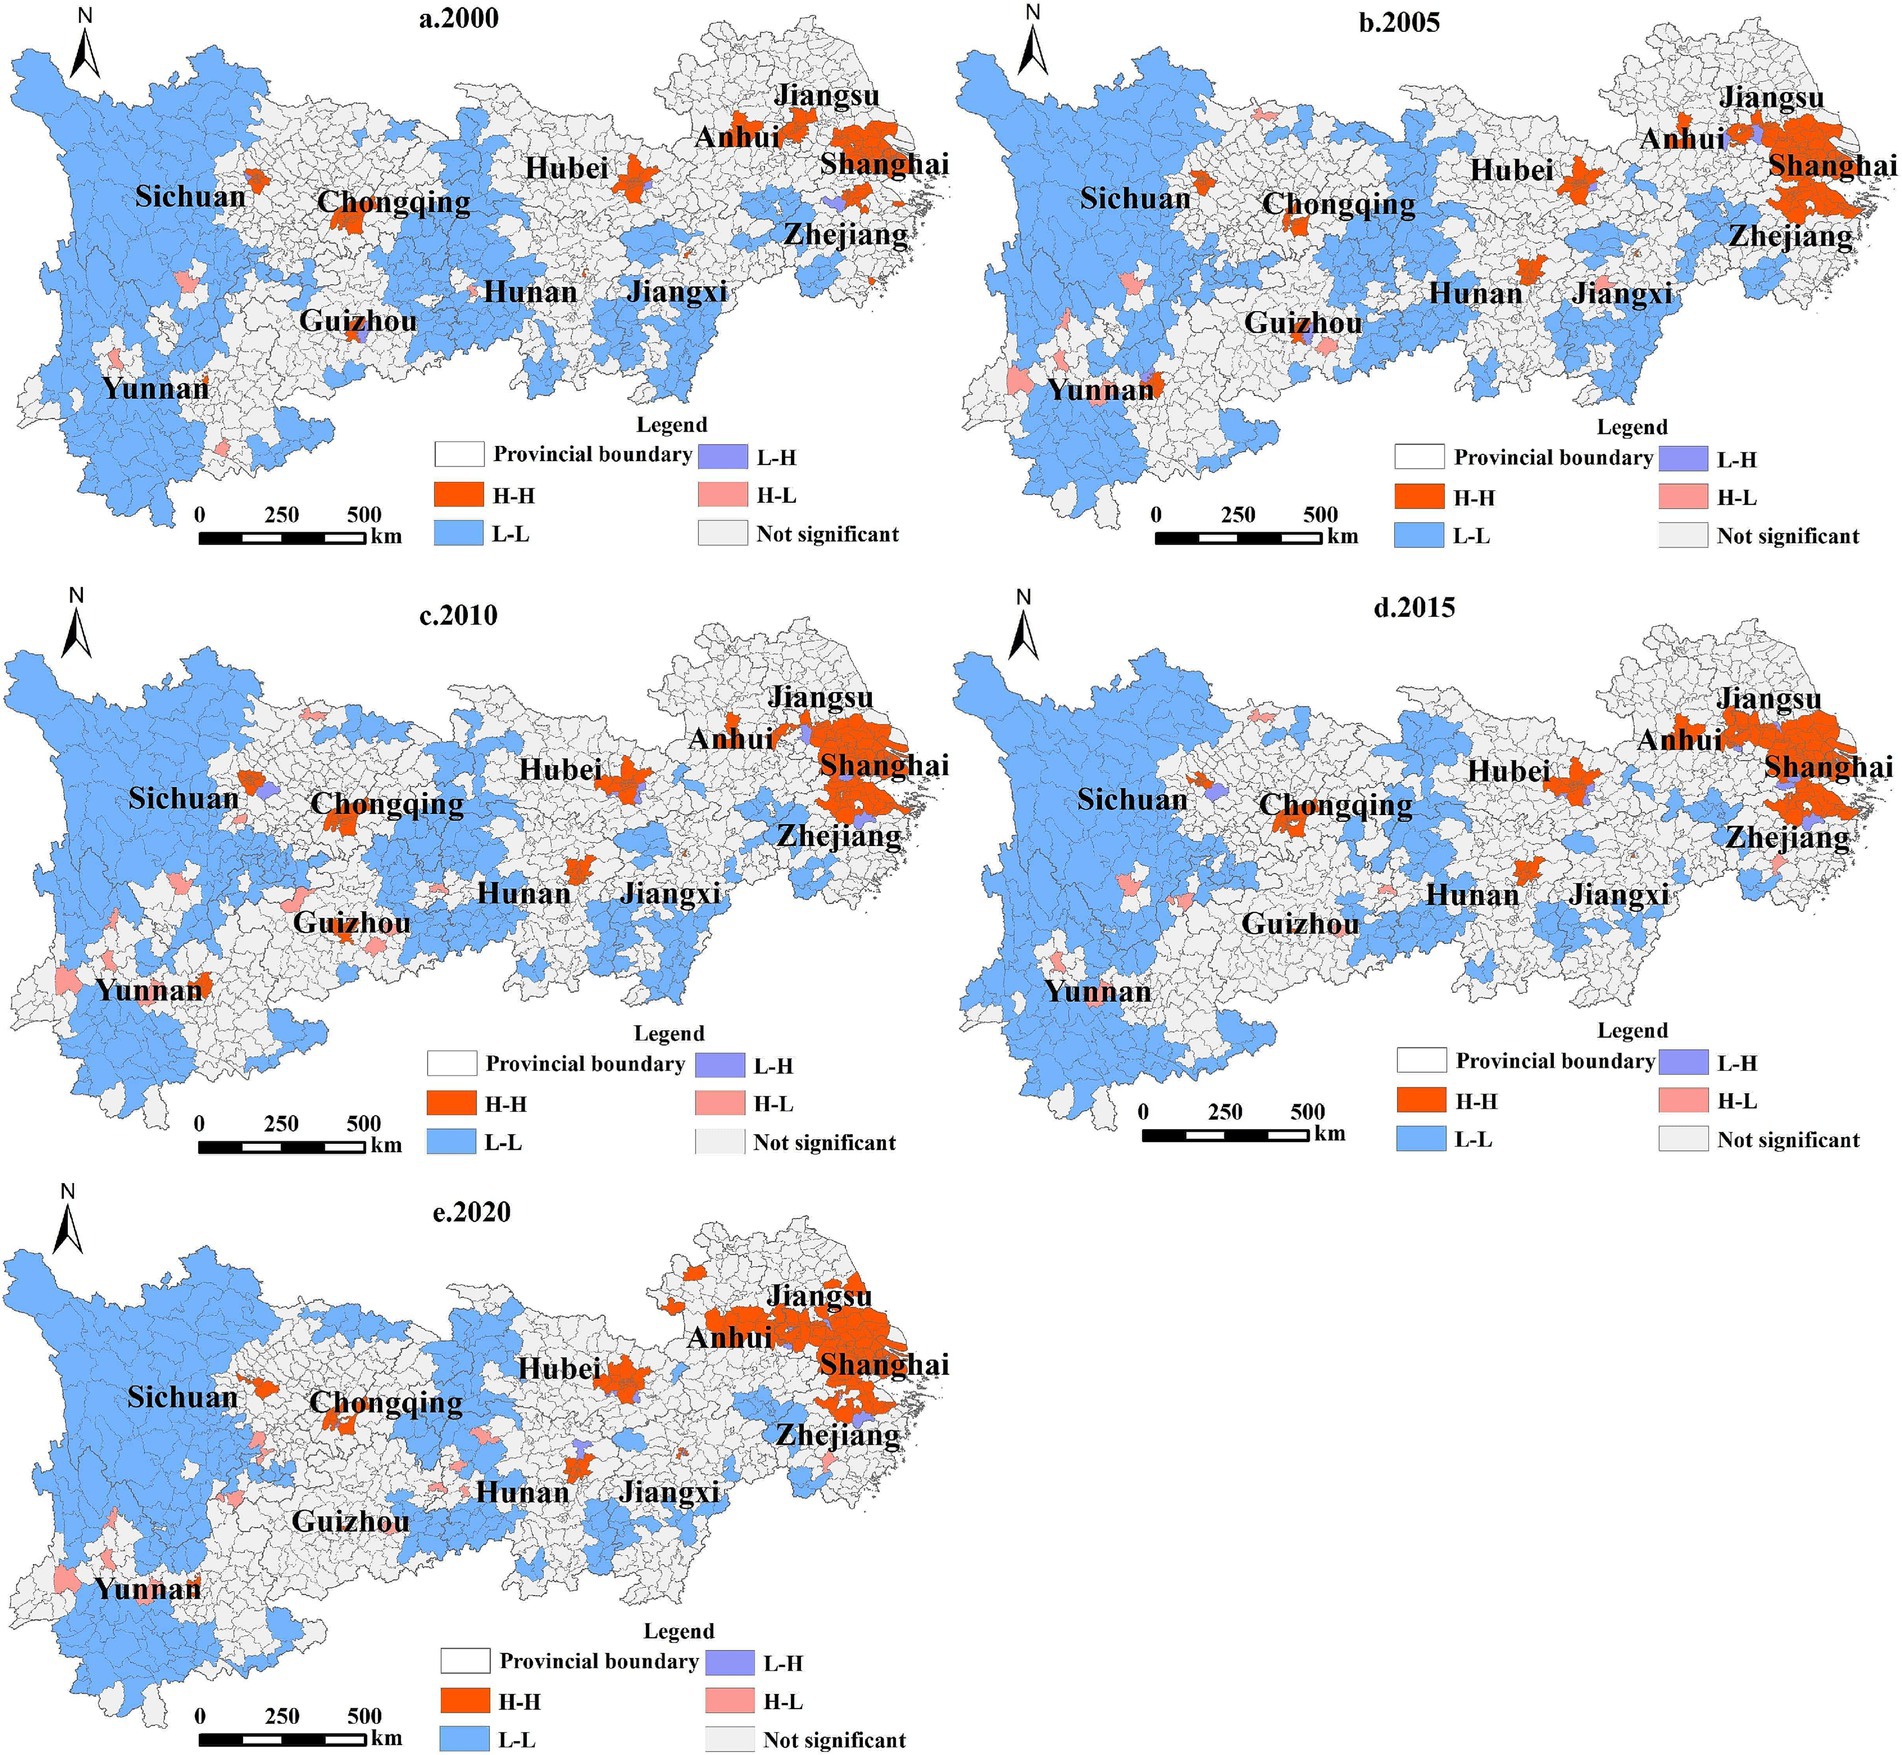
Figure 8. LISA aggregation map of county-scale LUCE in the YREB.
3.4 Research on impact factors
Due to data availability and the limited number of provincial-scale samples, this study focuses exclusively on examining the factors influencing LUCE at the prefectural and county scales within the YREB for the years 2000, 2005, 2010, 2015, and 2020.
3.4.1 Geographical detector analysis results
3.4.1.1 Single factor detection characteristics at the prefectural scale
Using the GD package in R, the natural break classification method was applied to categorize the LUCE impact factors at the prefectural scale in the YREB for the years 2000, 2005, 2010, 2015, and 2020. The q-values of these factors were calculated, and the spatial scale with the optimal q-value was selected as the parameter for the geographic detector analysis. The significance test was passed by every detection factor, as seen in Figure 9a. In the results of the single-factor q-values for the LUCE influencing factors at the prefectural scale for the five periods in the YREB, economic development (X1) consistently had the highest q-values, ranging from 0.8128 to 0.9273, indicating that economic development is the most significant influencing factor with the greatest explanatory power over LUCE. Population (X3) had the second-highest q-values, from 0.6032 to 0.7579, with a relatively stable trend of initially decreasing and then increasing, suggesting that population size also has a strong explanatory power over LUCE at the prefecture level, with a certain level of stability. Government intervention (X2) showed a continuous increase in its q-values, from 0.1263 in 2000 to 0.2465 in 2020. Its explanatory power increased from 6th place in 2000 to 4th in 2005, where it remained at 4th position throughout the research period. Industrial structure (X4) had q-values ranging from 0.1300 to 0.1862, maintaining 5th or 6th place in terms of explanatory power, indicating that while industrial structure’s explanatory power is relatively low compared to other factors, it remains stable over time. Carbon emission intensity (X5) exhibited a downward trend, with q-values ranging from 0.1246 to 0.2243, decreasing from 0.2243 in 2000 to 0.1336 in 2020. Its explanatory power dropped from 3rd place in 2000 to 5th in 2005 and 2010, and further declined to 6th place in 2015 and 2020, suggesting significant fluctuations and relative instability in its explanatory power compared to other factors. Land use degree (X6) showed a continuous increase in its q-values, ranging from 0.2005 to 0.4571, indicating that the explanatory power of land use degree on LUCE increased over the research period.
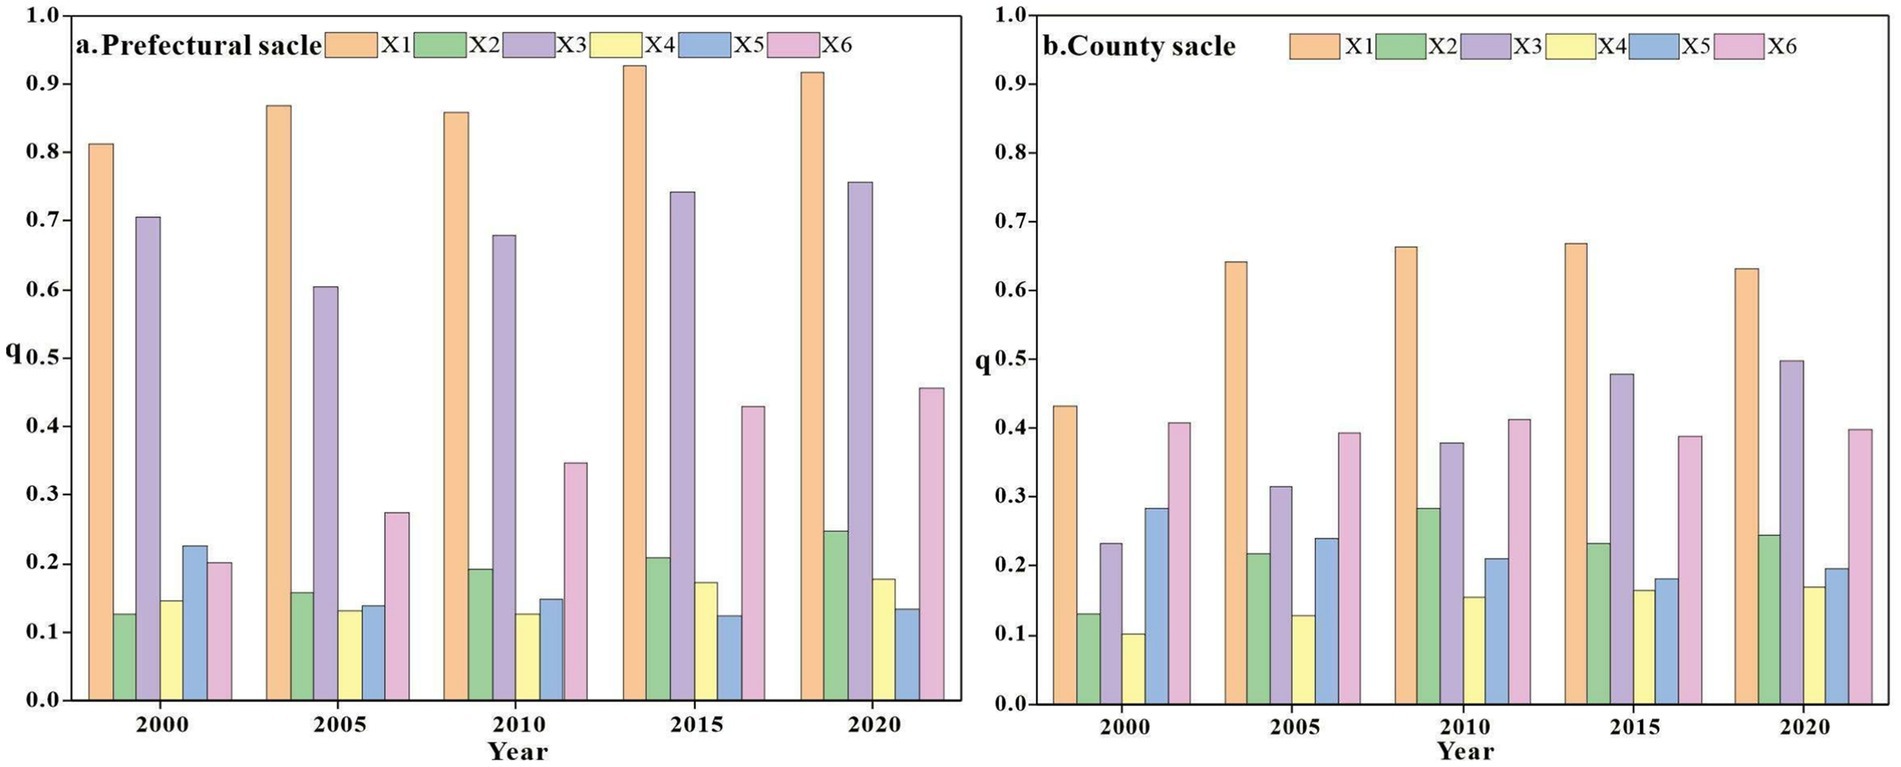
Figure 9. Single-factor q-values of LUCE at different scales in the YREB.
From the perspective of the magnitude of each influencing factor in different periods, the q-values for the influencing factors in 2000 were ranked as follows: economic development (X1) > population (X3) > carbon emission intensity (X5) > land use degree (X6) > industrial structure (X4) > government intervention (X2). In 2005, the q-values were ranked as: economic development (X1) > population (X3) > land use degree (X6) > government intervention (X2) > carbon emission intensity (X5) > industrial structure (X4). In 2010, the ranking was: economic development (X1) > population (X3) > land use degree (X6) > government intervention (X2) > carbon emission intensity (X5) > industrial structure (X4). In 2015, the ranking was: economic development (X1) > population (X3) > land use degree (X6) > government intervention (X2) > industrial structure (X4) > carbon emission intensity (X5). In 2020, the ranking was: economic development (X1) > population (X3) > land use degree (X6) > government intervention (X2) > industrial structure (X4) > carbon emission intensity (X5). The average strength of the influencing factors over the five periods is ranked as follows: economic development (X1) > population (X3) > land use degree (X6) > government intervention (X2) > carbon emission intensity (X5) > industrial structure (X4).
3.4.1.2 Single-factor detection characteristics at the county scale
All detection factors passed the significance test (Figure 9b). In the results of single-factor q-values for LUCE detection at the county scale in the YREB across five periods, economic development (X1) consistently had the highest q-values, ranging from 0.4318 to 0.6689. The q-value of economic development (X1) initially increased and then decreased, with a clear overall trend upward, arising from 0.4318 in 2000 to 0.6328 in 2020. This indicates that economic development (X1) has a high and continually increasing explanatory power for LUCE at the county scale in the YREB. The q-values of government intervention (X2) followed a trend similar to that of economic development (X1), with a pattern of initially increasing and then decreasing, but overall showing a significant rise from 0.1300 in 2000 to 0.2442 in 2020. The explanatory power of government intervention (X2) also increased during the study period, with its ranking rising from 5th in 2000 to 4th in 2010 and maintaining that ranking thereafter. The q-values of the population (X3) showed continuous growth during the study period, increasing from 0.2324 in 2000 to 0.4977 in 2020. The explanatory power of population (X3) also rose in ranking, from 4th in 2000 to 3rd in 2005, and further to 2nd in 2015. This indicates that the explanatory power of population on LUCE at the county scale significantly increased. The q-values of industrial structure (X4) ranged from 0.1016 to 0.1706, with the explanatory power consistently ranked 6th throughout the study period. This indicates that the industrial structure has relatively low but stable explanatory power for LUCE compared to other factors. The q-values of carbon emission intensity (X5) ranged from 0.1813 to 0.2833, exhibiting an overall downward trend. It decreased from 0.2243 in 2000 to 0.1966 in 2020. Its explanatory power also decreased from 3rd in 2000 to 4th in 2005 and continued to decline, ranking 6th in 2010, 2015, and 2020. This suggests that the explanatory power of carbon emission intensity for LUCE is diminishing relative to other factors. The q-values of land use intensity (X6) ranged from 0.3932 to 0.4127, with relatively stable changes, and the explanatory power ranked consistently between 2nd and 3rd. This indicates that land use intensity (X6) has a strong and stable explanatory power for LUCE.
In 2000, the q-values of the factors were ranked as: economic development (X1) > land use intensity (X6) > carbon emission intensity (X5) > population (X3) > government intervention (X2) > industrial structure (X4). In 2005, the q-values were ranked as: economic development (X1) > land use intensity (X6) > population (X3) > carbon emission intensity (X5) > government intervention (X2) > industrial structure (X4). In 2010, the q-values were ranked as: economic development (X1) > land use intensity (X6) > population (X3) > government intervention (X2) > carbon emission intensity (X5) > industrial structure (X4). In 2015, the q-values were ranked as: economic development (X1) > population (X3) > land use intensity (X6) > government intervention (X2) > carbon emission intensity (X5) > industrial structure (X4). In 2020, the ranking of the influencing factors remained the same as in 2015. The average q-values of the influencing factors over the five periods were ranked as: economic development (X1) > land use intensity (X6) > population (X3) > carbon emission intensity (X5) > government intervention (X2) > industrial structure (X4).
3.4.1.3 The dual-factor interaction results of LUCE at the prefectural scale
The types of interactions among the factors only included dual-factor enhancement and nonlinear enhancement. Throughout the study period, dual-factor enhancement was predominant, with relatively stable changes (Figure 10a). Overall, the interaction effect of dual factors was larger than the individual effects of the factors. The research results indicate that LUCE at the prefecture-level city scale in the YREB is not caused by a single factor but by the combined effects of multiple factors. During the study period, the interaction strength of economic development (X1) and population (X3) with other factors was greater than 0.5, suggesting that economic development (X1) and population (X3) are the main influencing factors of LUCE at the prefecture-level city scale in the YREB. Additionally, we found that the interaction between economic development (X1) and carbon emission intensity (X5) was the strongest. Therefore, it is crucial to completely take into account how economic development and technology advancement interact when creating emission reduction plans, since this may help ensure that these plans are implemented effectively.
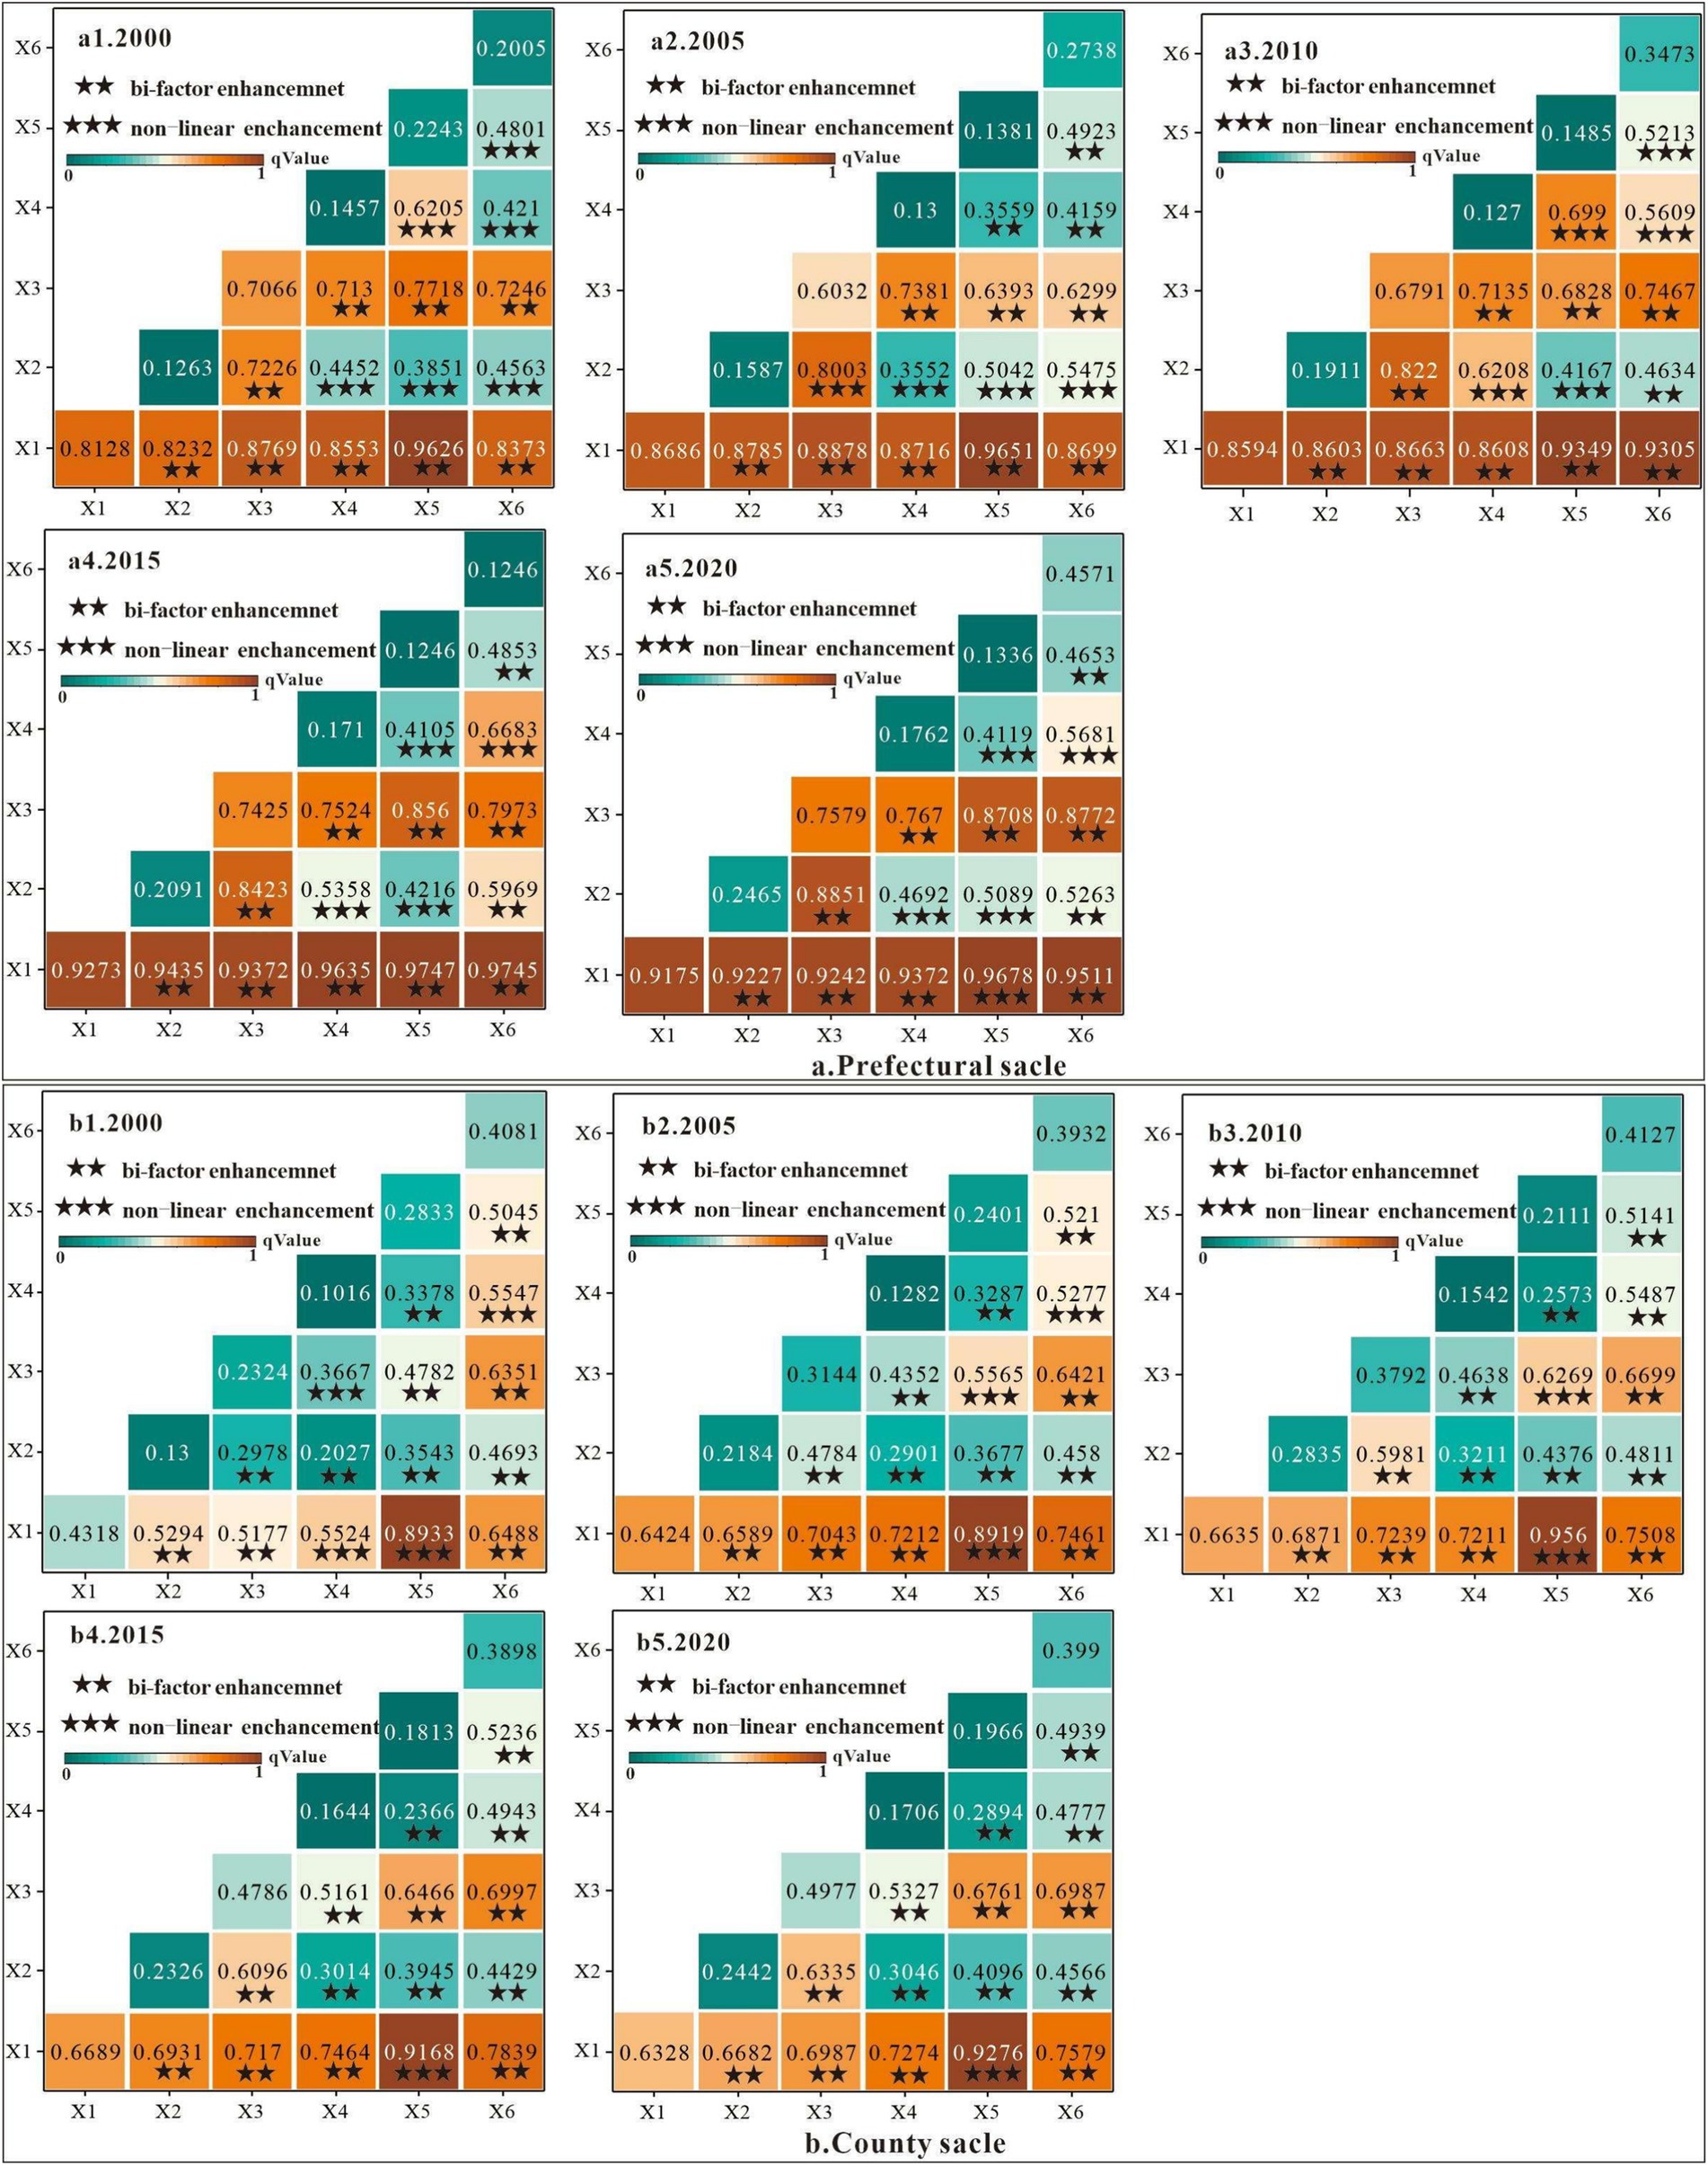
Figure 10. Dual-factor interaction detection of LUCE in the YREB.
3.4.1.4 The dual-factor interaction results of LUCE at the county scale
The types of factor interactions were limited to dual-factor enhancement and nonlinear enhancement, consistent with the results at the municipal scale. Throughout the study period, dual-factor enhancement predominated, showing relatively stable variation (Figure 10b). Overall, the interaction effects of dual factors were greater than the individual effects of single factors. In line with the findings at the prefectural scale, the results show that the variables affecting LUCE at the county scale in the YREB are not caused by a single factor but rather by the combined impacts of several factors. During the study period, the interaction strength between economic development (X1) and other factors was greater than 0.5, significantly exceeding the interactions between other factors, suggesting that economic development (X1) is the primary driver of LUCE at the county scale. Additionally, it was found that the interaction between economic development (X1) and carbon emission intensity (X5) was the most powerful, and in all five periods, this interaction exhibited a nonlinear enhancement type.
3.4.2 MGWR analysis results
Although the use of the Geodetector model determined the main impact factors of LUCE at the municipal and county scales in the YREB, the results are global and do not account for spatial location factors. Therefore, the MGWR model was further established to examine the local features of the influence of impact factors on LUCE. Significant factors were used as explanatory variables, and local spatial regression analysis of the impact factors for the year 2020 at both the prefectural and county administrative scales in the YREB was carried out to examine the spatial differences of the different impact factors.
3.4.2.1 Prefectural scale
All the factors under investigation have been tested for multicollinearity. To further assess the accuracy of the MGWR model, this study also established Ordinary Least Squares (OLS) and GWR models for comparative analysis with the MGWR model. The adjusted R2 of the standard OLS model is 0.965, the adjusted R2 of the GWR model is 0.975, and the adjusted R2 of the MGWR model is 0.987, as indicated by the findings in Table 2. The MGWR model offers a better match than the other two models, as seen by its higher adjusted R2 value. The reason for selecting the adjusted R2 for comparison lies in its ability to more accurately reflect the goodness-of-fit of the model compared to the original R2. Specifically, when the number of variables differs among models, the adjusted R2 effectively mitigates the artificial inflation of R2 caused by the inclusion of additional variables. This ensures a more objective evaluation of the model’s performance. According to the AICc criterion, the AICc value of the MGWR model is smaller. The reason for using AICc lies in its ability to assess the goodness-of-fit of the model while incorporating a penalty term for model complexity, effectively mitigating the risk of overfitting. Compared to the traditional AIC, AICc is more suitable for small sample sizes, as its correction term better accounts for the influence of sample size on model selection. Therefore, adopting AICc as an evaluation criterion provides a more comprehensive balance between model fit and complexity, thereby enhancing the reliability of the results. This further indicates that the MGWR model demonstrates a certain level of robustness (Zhao et al., 2015).
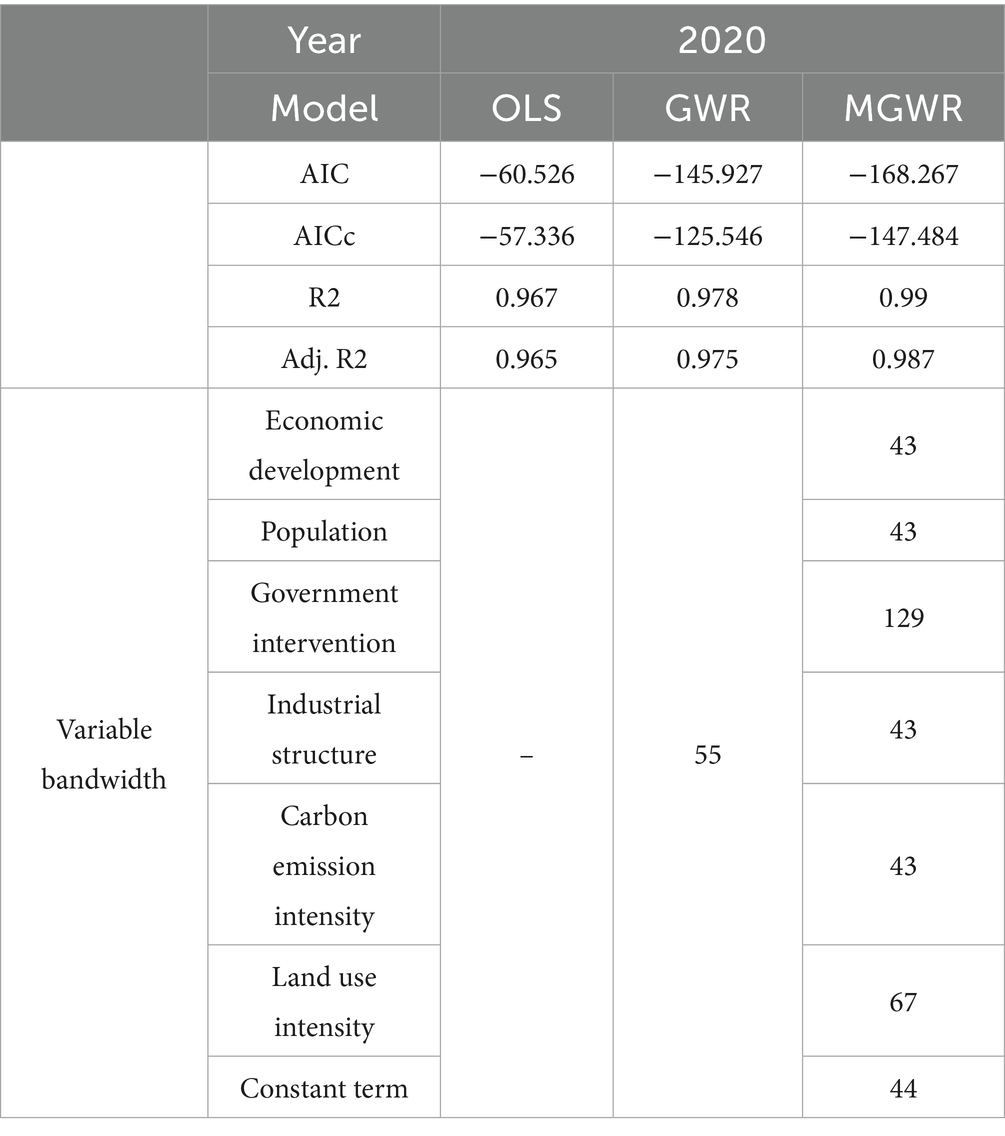
Table 2. Comparison of OLS, GWR, and MGWR regression results at the prefectural scale.
The geographical heterogeneity of the impact factor’s effect decreases with increasing bandwidth and vice versa (Yang and Li, 2022). By comparing the sizes of different bandwidths, this study found that, at the prefectural scale in 2020, the bandwidths for economic development, industrial structure, government intervention, population size, land use intensity, and carbon emission intensity were 43, 43, 129, 43, 67, and 43, respectively. The spatial heterogeneity of each influencing factor at the prefectural scale is ranked from largest to smallest as follows: economic development = industrial structure = population = carbon emission intensity > land use intensity > government intervention. Among these, government intervention exhibits a global scale effect with almost no spatial heterogeneity (Table 2). These results suggest that at the prefectural scale, factors such as economic development, industrial structure, population size, and carbon emission intensity have strong spatial heterogeneity. This is because there are significant differences in the economic, industrial, and population characteristics among cities, leading to notable spatial variation. The bandwidth for land use intensity is 67, which is relatively large, indicating weaker spatial heterogeneity. This can be as a result of the minimal variations in land use among cities and the comparatively uniform land use rules and planning at the prefectural scale. The bandwidth for government intervention is the largest at 129, showing almost no spatial heterogeneity. This suggests that at the prefectural scale, government policies and interventions are more uniform, and there is generally a lack of significant spatial differences.
The following are the spatial distribution features of each impact factor’s regression coefficients (Figure 11). The regression coefficients for economic development (0.591–0.985) are consistently positive, indicating a positive influence on the LUCE. The regions with high regression coefficients are predominantly located in Jiangsu, Anhui, Hubei, Zhejiang, and Shanghai, while those with low regression coefficients are situated in Sichuan, Yunnan, and Guizhou. The degree of economic development is closely correlated with this trend. The industrial structure regression coefficients (−0.174 to −0.011) are all negative, demonstrating that industry structure has an inhibitory influence on LUCE at the prefectural scale. Cities located in Jiangsu Province, Shanghai, and Zhejiang, show a strong negative correlation, suggesting their relatively advanced economic development and successful transition from a “231” to a “321” industrial structure. In contrast, regions with weaker negative correlations are primarily found in cities in Sichuan and Yunnan. This might be attributed to the relatively underdeveloped urban economies in these areas, lower resource allocation efficiency, and slower growth of the tertiary sector, which hinders the maximization of carbon reduction benefits from industrial upgrading. The regression coefficients of government intervention (−0.07 to −0.061) are all negative, and their variation range is small, indicating that government intervention has an inhibitory effect on LUCE at the prefectural scale and that the effect is relatively consistent. The population factor regression coefficients (0.113–0.290) are positive, demonstrating that the population has a positive influence on LUCE. The regions with high coefficients are mainly located in Jiangsu, Anhui, Hubei, and Chongqing, whereas the regions with low coefficients are primarily located in Jiangxi, Hunan, Sichuan, and Yunnan, which is essentially aligned with the distribution characteristics of the population. The regression coefficients for land use degree (0.009–0.124) are positive, indicating that the expansion of construction land promotes carbon emissions from land use. Spatially, the expansion shows a general pattern of higher values in the central region and lower values on both sides. This is possibly due to the downstream areas being economically developed, where efficient and intensive land use practices have reduced carbon emissions. Meanwhile, the central region has further absorbed traditional industries from the upstream areas, leading to more construction land and higher carbon emissions. In contrast, the upstream regions have a less developed economy, limited construction land, and lower overall carbon emissions. Regions with higher regression coefficients are primarily located in Hunan, Jiangxi, and Hubei, while regions with lower coefficients are primarily found in Sichuan and Guizhou. Carbon emission intensity regression coefficients (0.052–0.446) are all positive, showing that carbon emission intensity promotes the LUCE, and the overall performance is high in the east and low in the west. Potential explanations for this include the fact that although the eastern region’s economy is advanced and technical advancements have continued to lower carbon intensity, the region’s high energy consumption means that overall carbon emissions remain high. This situation compensates for the reduced impact of lower carbon emission intensity. Central and western regions, in comparison, exhibit lower economic development, a relatively uniform industrial structure, and limited technological advancement, leading to increased carbon emission intensity. However, due to lower total carbon emissions in these regions, the influence of carbon emission intensity on overall carbon emissions is less pronounced compared to the eastern region on the whole, economic development, population size, land use degree, and carbon emission intensity can promote LUCE. while industrial structure and government intervention can inhibit LUCE.
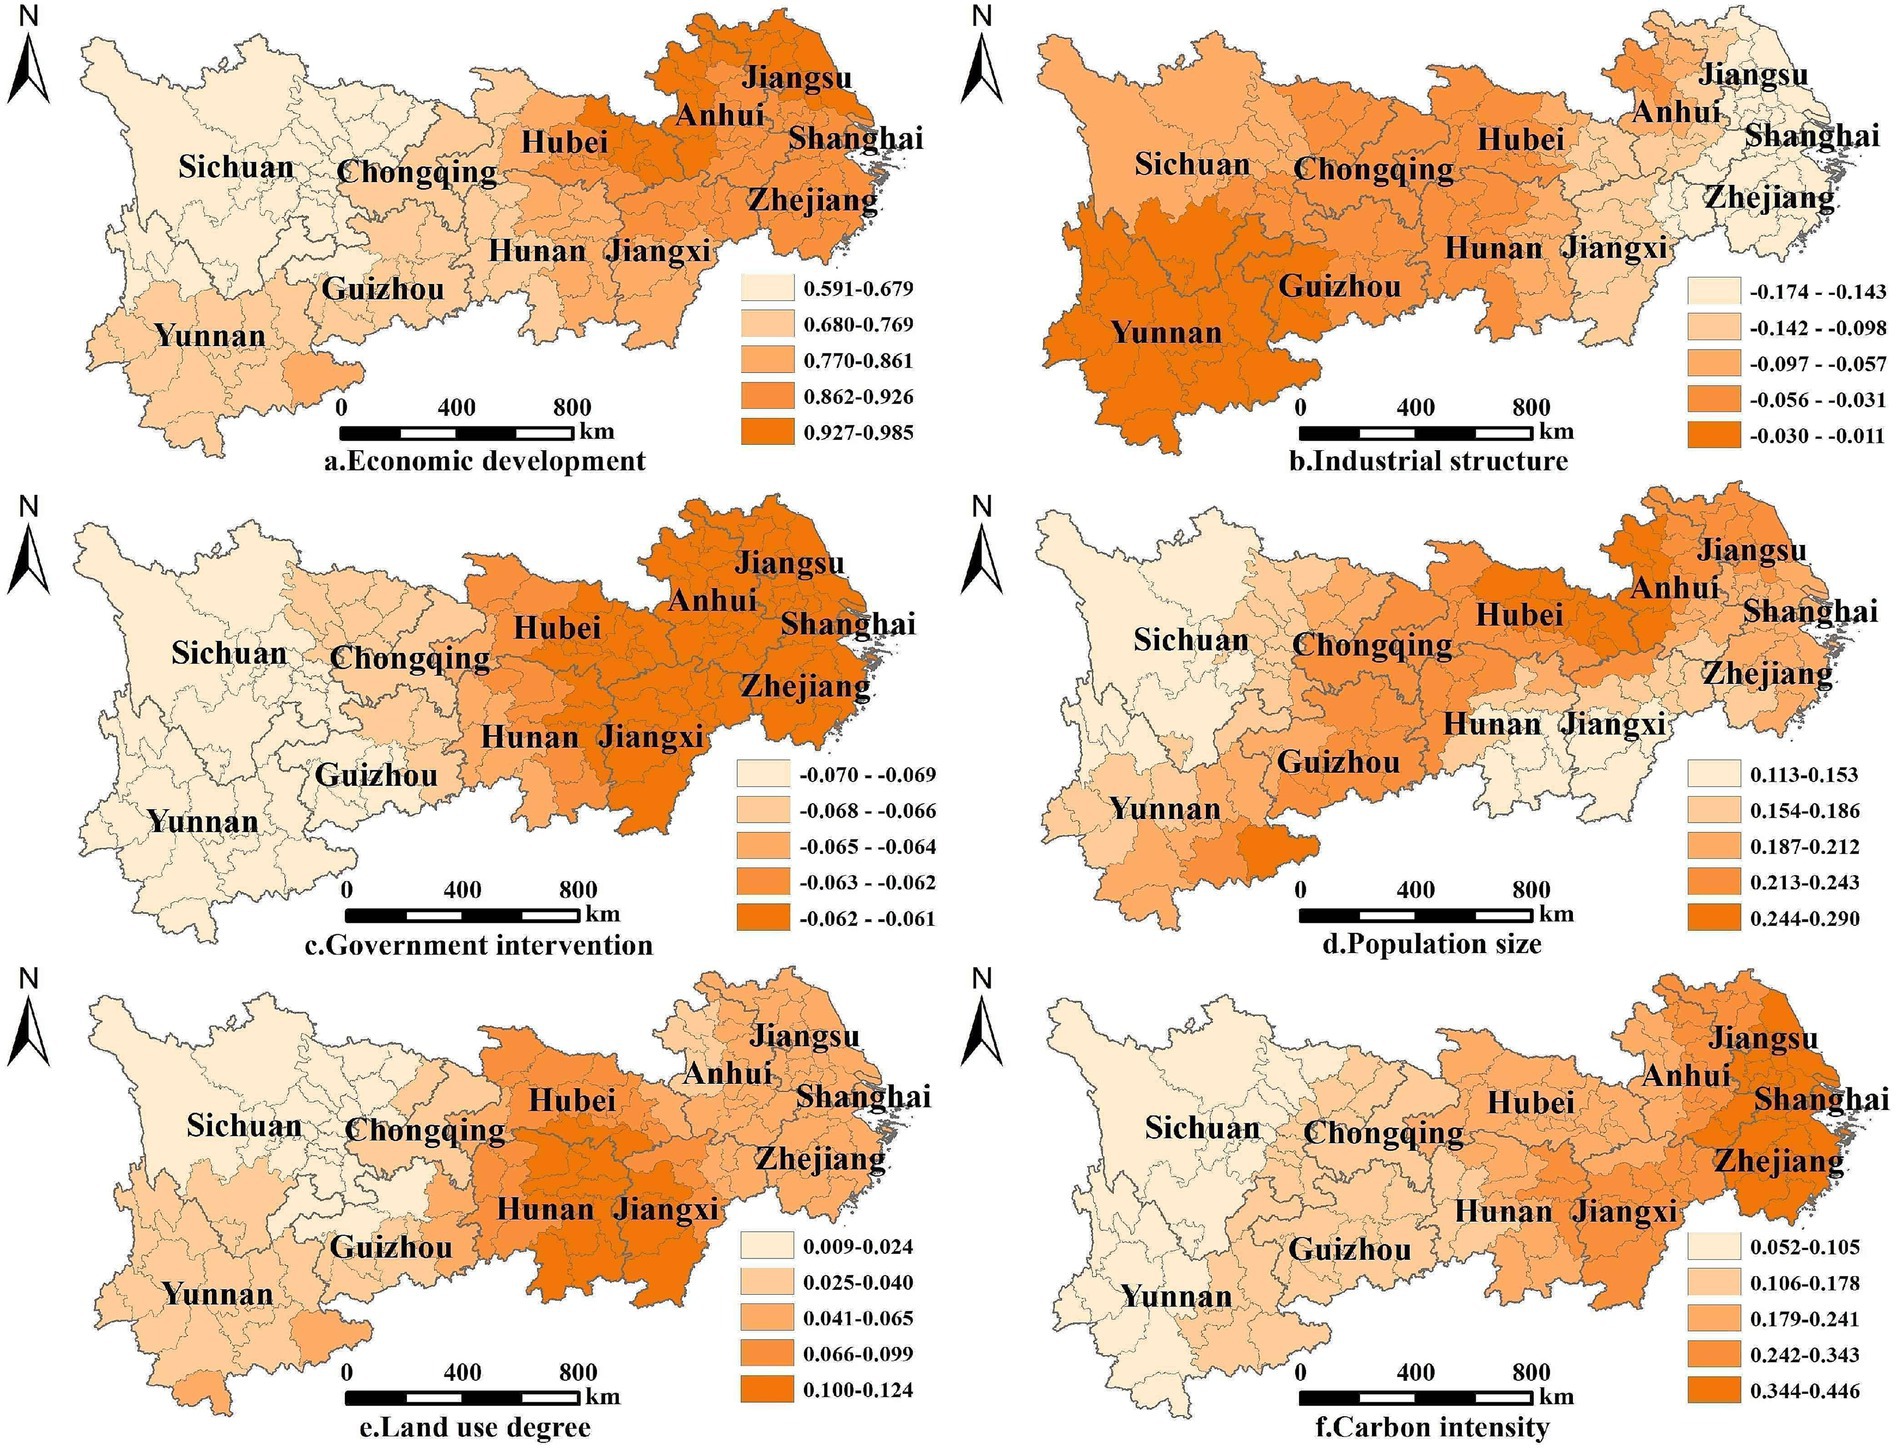
Figure 11. Spatial distribution of regression coefficients of impact factor at the prefectural scale in 2020.
3.4.2.2 County scale
The results at the county scale show that in 2020, the bandwidths for economic development, industrial structure, government intervention, population, land use degree, and carbon emission intensity were 43, 271, 68, 61, 71, and 47, respectively. At the county level, the spatial heterogeneity of various influencing factors in the YREB, from large to small, is as follows: economic development > carbon emission intensity > population > government intervention > land use degree > industrial structure (Table 3). Due to notable variations in economic development levels among various county units, which directly affect carbon emissions, economic development exhibits the greatest geographical heterogeneity. Carbon emission intensity ranks second, exhibiting substantial spatial heterogeneity due to multiple factors such as energy efficiency and technological level.
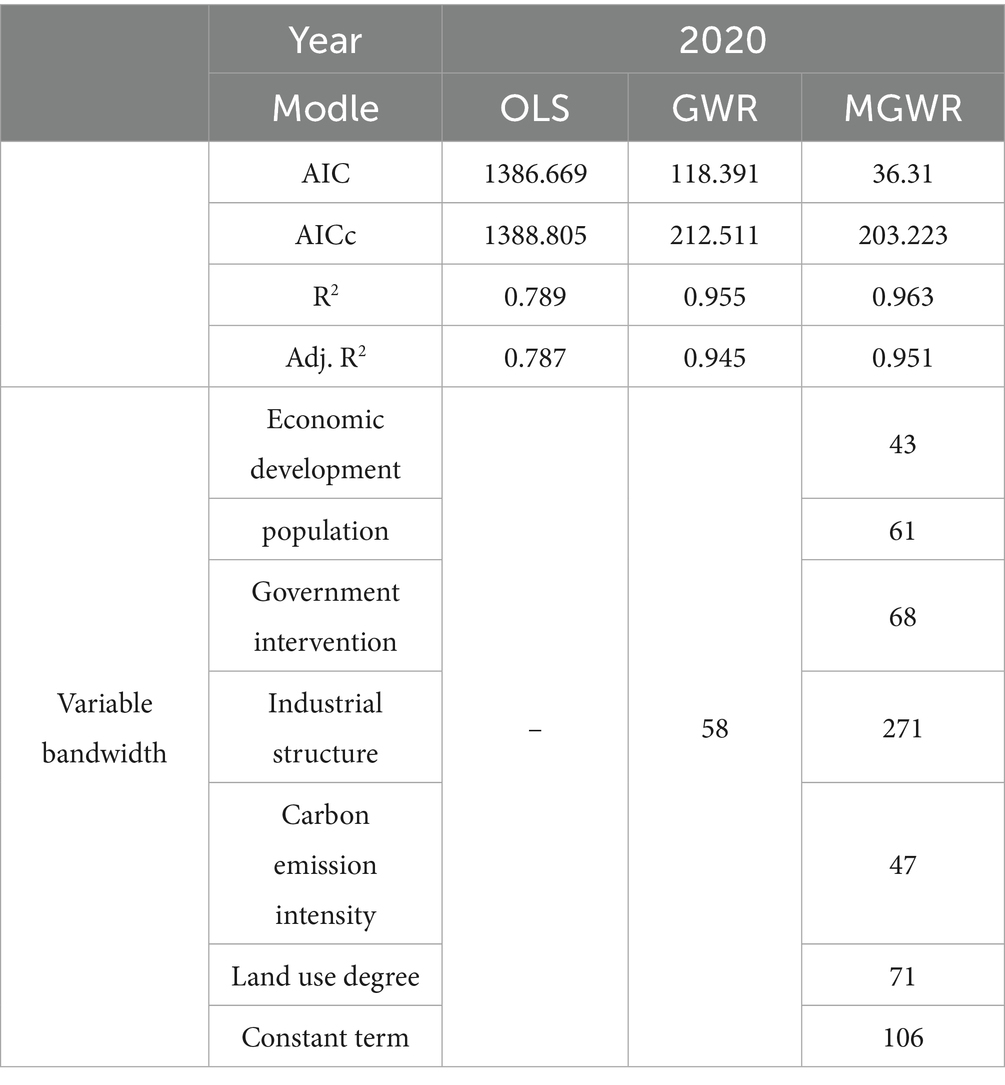
Table 3. Comparison of OLS, GWR, and MGWR regression results at the county scale.
The spatial distribution features of each impact factor’s regression coefficients are as follows (Figure 12): the economic development regression coefficients (0.197–1.362) are all positive, demonstrating that economic growth promotes LUCE at the county scale. The provinces with the highest regression coefficients are Anhui, Hubei, and Hunan, whereas the provinces with the lowest regression coefficients are Jiangxi, Guizhou, and Sichuan. Most districts and counties in Zhejiang, Shanghai, and Jiangsu have lower economic regression coefficients than the prefectural scale, indicating that economic green growth is simpler to achieve at the county scale. The regression coefficient of industrial structure (−0.22 to 0.057) is positive and negative, indicating a negative correlation in general. The negative zone is mainly located in the provinces of the Yangtze River’s upper and middle reaches, while the positive zone is primarily situated in Yunnan, Sichuan, and Guizhou. Compared to the prefectural scale, the impact of industrial structure on carbon emissions may show a longer delay at the county scale. Government intervention has a positive and negative regression coefficient (−1.376 to 0.064), and total performance has a negative correlation, showing that government involvement has an inhibitory influence on LUCE. The positive values observed in a few districts and counties could be explained by the orientation of government intervention in fiscal budget expenditure. This orientation may lead to the clustering of similar enterprises and even duplication of construction, resulting in increased carbon emissions. This suggests that government intervention is more likely to have a negative effect at the county scale. The regression coefficients for population factors (ranging from 0.001 to 0.511) were consistently positive, with high-value areas concentrated primarily in upstream Jiangsu, Shanghai, Zhejiang, Hubei, and Sichuan. The regression coefficient of land use degree (−0.257 to 0.563) was positive, and the negative area was mainly concentrated in upstream Jiangsu, Anhui, Shanghai, Zhejiang, and downstream Sichuan. Compared with the prefectural scale, the inhibitory effect of intensive LUCE was better reflected at the county scale. The carbon emission intensity regression coefficients (0.004–2.422) are all positive, and overall performance is high in the east and low in the west, which is similar to the prefectural scale distribution. Overall, economic growth, population, land use degree, and carbon emission intensity promote LUCE, but the industrial structure and government intervention limit LUCE, consistent with the prefectural scale.
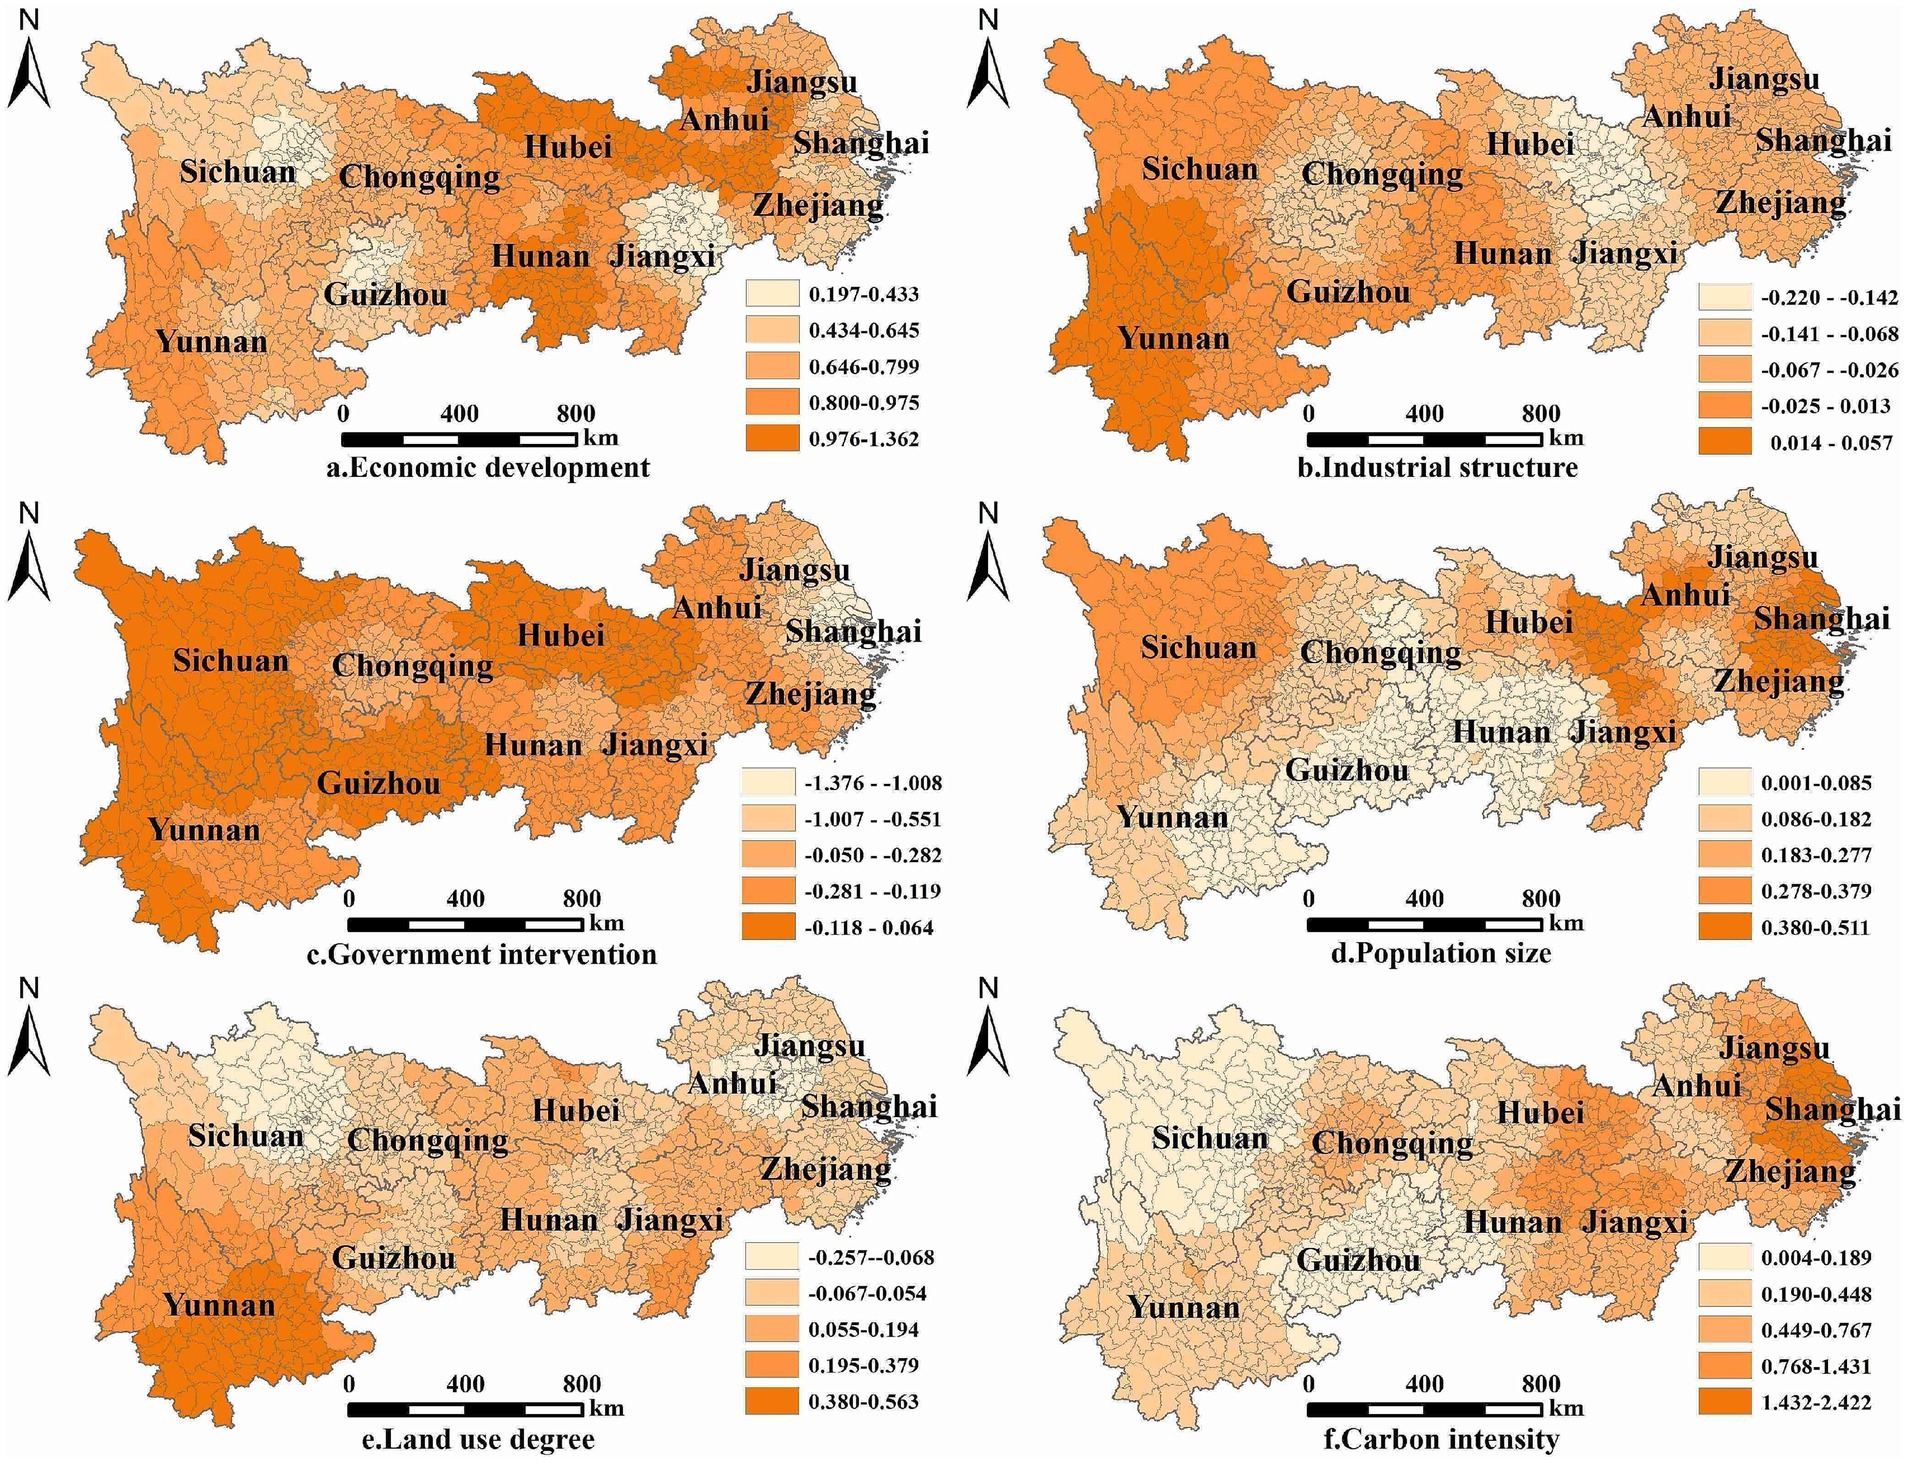
Figure 12. Spatial distribution of regression coefficients of each impact factor at the county scale in 2020.
4 Discussion
China’s administrative divisions are hierarchical, comprising provinces with numerous prefectural cities and prefectural units encompassing multiple county-scale entities (Liao and Shi, 2022). Research has indicated that a single administrative scale cannot effectively represent spatial patterns at other scales (Ma et al., 2016). Thus, it is essential to study the temporal and spatial characteristics, along with the impact factors, of the LUCE at various administrative scales. Based on this, our study focuses on the YREB as our research area. We investigate the spatiotemporal characteristics of LUCE across three administrative scales: province, prefectural city, and county. To explore the impact factors at the prefectural and county scales.
4.1 Spatiotemporal evolution of the LUCE in the YREB at different scales
The YREB’s considerable increase in LUCE from 2000 to 2020 was mostly caused by the expansion of construction land that contributes to carbon emissions. The period between 2000 and 2010 saw rapid growth (Figure 3), fueled by an extensive development model and the expansion of construction land. However, growth slowed from 2010 to 2020, influenced by the 2012 ecological civilization construction plan and subsequent sustainable development policies (Lin, 2018). Despite the slowdown, urbanization and construction land expansion persist, leading to a continued rise in LUCE.
The spatial distribution of the LUCE in the YREB can be summarized as higher in the lower reaches and lower in the upper reaches. The downstream provinces in the YREB, such as Zhejiang, Jiangsu, and Shanghai, are economically developed and experience rapid infrastructure development, accompanied by significant human activity, substantial energy consumption, and the ongoing growth of construction land (Wang and Shao, 2023). Simultaneously, the ongoing reduction in cropland, woodlands, and grasslands leads to the LUCE’s growth. In contrast, the upstream region, with slower urbanization and larger woodlands, grasslands, and carbon sequestration capacity (Luo et al., 2022), exhibits lower LUCE. However, the middle and upper reaches experience increasing LUCE, attributed to “Western development,” “One Belt, One Road” initiatives, and the relocation of high-emission enterprises (Tian et al., 2019).
County-scale LUCE in the YREB demonstrates stronger spatial autocorrelation, indicating that smaller administrative units are prone to prominent spatial clustering patterns for LUCE (Shi et al., 2019). Local spatial autocorrelation analysis indicates that the provincial administrative scale lacks significant spatial agglomeration, possibly due to a limited number of samples. The prefectural scale exhibits positive spatial agglomeration, while the county administrative scale shows even more significant positive spatial agglomeration than the prefectural scale. Overall, the county scale in the YREB demonstrates stronger spatial heterogeneity and regional agglomeration features compared to the other two administrative scales. The primary reasons for the observed results lie in the differences in spatial unit division and socio-economic driving factors across various administrative scales. At the provincial scale, the relatively large administrative unit size often conceals internal variations in land use. The prefectural scale, situated between the provincial and county scales, provides a better representation of land use differences and their connections to regional economic activities, while also revealing heterogeneity that remains undetected at the provincial scale. In contrast, the county scale focuses on smaller spatial units, capturing local characteristics of land use changes, population distribution, and economic activities more comprehensively. This allows for a more pronounced observation of spatial heterogeneity and agglomeration effects. Consequently, land use carbon emissions exhibit distinct spatial heterogeneity across different administrative scales.
4.2 Impact factors of the LUCE in the YREB at different scales
Economic development is the primary determinant of LUCE at the prefectural and county levels in the YREB, according to the findings of the geographic detector study. This result is in line with previous studies showing that the main driver of the rise in carbon emissions in Chinese cities has always been economic development (Guan et al., 2018; Zheng et al., 2020). The main cause for this result is that rapid local economic growth mainly stems from infrastructure construction and industrial upgrading. Meanwhile, infrastructure development and industrial upgrading also affect regional energy consumption and carbon emissions. With the advancement of urbanization, the urban agglomeration effect further strengthens the driving force behind local economic development, creating a virtuous cycle. This cyclical mechanism leads to the continuous interaction between economic development, industrial upgrading, and urbanization, promoting rapid regional economic growth. However, as economic activities increase, carbon emissions also show a noticeable accumulation trend, particularly in regions with rapid economic development, where the growth in carbon emissions is especially prominent.
Apart from economic development, other influencing factors also show different characteristics at different administrative scales. Specifically, at the prefectural scale, the importance of influencing factors is ranked as follows: population, land use degree, government intervention, industrial structure, and carbon emission intensity. At the county scale, the ranking is: land use degree, population, carbon emission intensity, government intervention, and industrial structure. The differences in the intensity ranking of influencing factors across scales highlight the impact of scale effects on carbon emissions. The differences in the ranking of carbon emission influencing factors across administrative scales essentially reflect the scale effect, meaning that the importance of these factors varies with scale due to differences in spatial and social contexts. This effect highlights the regional heterogeneity and the necessity of tailoring policies to local conditions, indicating that emission reduction strategies should be precisely designed according to the specific circumstances of each region. An examination of the two-factor interaction reveals that it takes the form of two-factor enhancement and nonlinear enhancement at both scales. This implies that the combined activity of several factors influences LUCE, with the two-factor interaction having a greater effect than the effects of the individual elements. A thorough analysis of the interplay between variables should be taken into account while developing emission reduction strategies.
The MGWR model is utilized to investigate the influencing variables of LUCE at the prefectural and county scales in the YREB in 2020 in order to better assess the local characteristics of the influencing factors on LUCE while taking spatial aspects into account. Applying the MGWR model in 2020 at the prefectural and county scales, economic development, population size, industrial structure, and carbon emission intensity exhibit similar bandwidths with pronounced spatial heterogeneity. Land use intensity followed, while government intervention manifested as a global feature, with minimal spatial heterogeneity. However, at the county scale, the bandwidths of impact factors demonstrated certain spatial heterogeneity, with no single dominant global factor. The degree of spatial heterogeneity decreased in the order of economic development > carbon intensity > population size > government intervention > land use intensity > industrial structure. This indicates that different impact factors show different spatial heterogeneity on the same research scale, and the same impact factors would also show different spatial heterogeneity due to different research scales. Comparing impact factor coefficient ranges between prefectural and county scales reveals that the county scale exhibits greater variability, emphasizing its stronger spatial heterogeneity in contrast with the prefectural scale. Comparing the coefficient ranges of the same impact factors between the prefectural and county scales, we found that the county scale showed larger variations than the prefectural scale. This is mainly because, in comparison to the prefectural scale, different counties have significant geographic, economic, and social differences, which, at the county scale, lead to a noticeable regional variability in the LUCE affecting factors.
4.3 Policy implications
The study’s findings are critical for the government in developing more accurate emission reduction plans and measures for the YREB. Based on this, the following three recommendations are made in this study. First, county-scale carbon emission management: because the spatial heterogeneity of factors affecting LUCE at the county scale is high, the government should prioritize county-scale carbon emission control. To address the carbon emission challenges effectively, tailored policies and measures must be developed, taking into account the unique characteristics and issues specific to various county-scale regions. This may involve the implementation of strategies like promoting low-carbon agriculture, enhancing ecological preservation efforts, and advancing renewable energy initiatives in high-carbon emission counties. Additionally, providing comprehensive support through carbon emission monitoring and technological assistance is essential. Second, urban planning and carbon emission reduction should be integrated. As economic growth drives LUCE, the government must integrate carbon emission reduction into urban planning. This requires adopting low-carbon urban planning, setting carbon reduction targets, and fostering economic development while coordinating carbon emissions effectively. This might involve encouraging the use of clean energy, encouraging sustainable mobility, enhancing urban land planning, and enhancing the monitoring and control of carbon emissions. By combining urban planning and carbon emission management, a win-win scenario of economic expansion and carbon emission reduction may be realized. Finally, interregional cooperation should be strengthened. LUCE at different scales in the YREB have differing spatial heterogeneity, implying that interregional differences must be addressed and resolved. To jointly address carbon emission challenges, governments can promote interregional collaboration and cooperation as well as share experience and technology through cross-regional cooperation mechanisms. Additionally, the government can enhance interregional policy coordination and formulate integrated carbon emission management policies. This will facilitate coordinated development and optimize carbon emission reduction across diverse YREB regions.
4.4 Limitations and future research
In this paper, we examined the spatiotemporal traits of LUCE in YREB provinces, prefectural cities, and counties. We also evaluated the LUCE-affecting elements at the county and prefectural levels, which led to important findings. Nevertheless, the following restrictions are present: (1) Because most energy data at the prefectural and county scales are unavailable, the energy carbon emission data estimated at the prefectural and county scales must be checked and examined further. (2) As impact factors, only economic development, industrial structure, government interference, population size, land use degree, and carbon emission intensity are examined. However, because LUCE is a complicated process with numerous impact components, other driving forces and internal processes need to be studied further.
5 Conclusion
This study marks the inaugural assessment of LUCE in the YREB at the provincial, prefectural, and county scales. It delves into the spatiotemporal evolution variations of LUCE at these administrative scales and employs the MGWR model to scrutinize impact factors at the prefectural and county scales. The following are the resulting conclusions:
LUCE grew in the YREB from 2000 to 2020, growing at a greater pace from 2000 to 2010 and then noticeably slowing down between 2010 and 2020. The change in the administrative scale affects the spatiotemporal change in the LUCE. At different administrative scales within the YREB, there was a notable positive spatial correlation. The global Moran’s I displayed varying trends, with LUCE in the YREB showing a greater concentration at the provincial and prefectural scales while becoming more dispersed at the county scale. Based on local spatial autocorrelation analysis, the LUCE in the YREB did not exhibit significant spatial clustering at the provincial administrative scale. However, they did demonstrate spatial clustering at the prefectural and county scales. Specifically, the H-H and L-L types were the primary clustering patterns at the prefectural and county scales, with the county scale showing stronger clustering characteristics and spatial heterogeneity. Impact factors exhibited varying effects on spatial patterns at both the prefecture and county scales. Economic growth had the greatest influence on LUCE in both tiers. However, the impacts of industrial structure, population size, government intervention, and land use degree diverged between these administrative scales.
Data availability statement
The original contributions presented in the study are included in the article/Supplementary material, further inquiries can be directed to the corresponding author.
Author contributions
CL: Methodology, Data curation, Writing – original draft, Visualization, Conceptualization, Software, Investigation, Writing – review & editing, Formal analysis. XW: Data curation, Writing – original draft, Validation, Formal analysis, Methodology, Conceptualization, Investigation, Software, Supervision. HL: Investigation, Formal analysis, Software, Data curation, Conceptualization, Methodology, Writing – review & editing.
Funding
The author(s) declare that financial support was received for the research and/or publication of this article. This work was supported by Postdoctoral Special Project of Anhui Jianzhu University (Grant No. 2025QDHR02).
Conflict of interest
The authors declare that the research was conducted in the absence of any commercial or financial relationships that could be construed as a potential conflict of interest.
Generative AI statement
The authors declare that no Gen AI was used in the creation of this manuscript.
Publisher’s note
All claims expressed in this article are solely those of the authors and do not necessarily represent those of their affiliated organizations, or those of the publisher, the editors and the reviewers. Any product that may be evaluated in this article, or claim that may be made by its manufacturer, is not guaranteed or endorsed by the publisher.
Supplementary material
The Supplementary material for this article can be found online at: https://www.frontiersin.org/articles/10.3389/frsc.2025.1616652/full#supplementary-material
Footnotes
References
Aziz, S., and Chowdhury, S. A. (2023). Analysis of agricultural greenhouse gas emissions using the STIRPAT model: a case study of Bangladesh. Environ. Dev. Sustain. 25, 3945–3965. doi: 10.1007/s10668-022-02224-7
Bu, Y., Wang, E., Qiu, Y., and Möst, D. (2022). Impact assessment of population migration on energy consumption and carbon emissions in China: a spatial econometric investigation. Environ. Impact Assess. Rev. 93:106744. doi: 10.1016/j.eiar.2022.106744
Cai, Y., and Li, K. (2024). Spatiotemporal dynamic evolution and influencing factors of land use carbon emissions: evidence from Jiangsu Province, China. Front. Environ. Sci. 12:1368205. doi: 10.3389/fenvs.2024.1368205
Darwish, A. M., Zagow, M., and Elkafoury, A. (2023). Impact of land use, travel behavior, and socio-economic characteristics on carbon emissions in cool-climate cities, USA. Environ. Sci. Pollut. Res. 30, 91108–91124. doi: 10.1007/s11356-023-28487-9
Deng, L., Zhang, Q., Cheng, Y., Cao, Q., Wang, Z., Wu, Q., et al. (2022). Underlying the influencing factors behind the heterogeneous change of urban landscape patterns since 1990: a multiple dimension analysis. Ecol. Indic. 140:108967. doi: 10.1016/j.ecolind.2022.108967
Dong, Y., Jin, G., and Deng, X. (2020). Dynamic interactive effects of urban land-use efficiency, industrial transformation, and carbon emissions. J. Clean. Prod. 270:122547. doi: 10.1016/j.jclepro.2020.122547
Fan, M., Wang, Z., and Xue, Z. (2024). Spatiotemporal evolution characteristics, influencing factors of land use carbon emissions, and low-carbon development in Hubei Province, China. Ecol. Inform. 81:102567. doi: 10.1016/j.ecoinf.2024.102567
Feng, M., Chen, Y., Li, Z., Duan, W., Zhu, Z., Liu, Y., et al. (2024). Optimisation model for sustainable agricultural development based on water-energy-food nexus and CO2 emissions: a case study in Tarim river basin. Energy Convers. Manag. 303:118174. doi: 10.1016/j.enconman.2024.118174
Fotheringham, A. S., Yang, W., and Kang, W. (2017). Multiscale geographically weighted regression (MGWR). Ann. Am. Assoc. Geogr. 107, 1247–1265. doi: 10.1080/24694452.2017.1352480
Friedlingstein, P., O'sullivan, M., Jones, M. W., Andrew, R. M., Hauck, J., Olsen, A., et al. (2020). Global carbon budget 2020. Earth Syst. Sci. Data Discuss. 2020, 1–3. doi: 10.5194/essd-12-3269-2020
Garofalo, D. F. T., Novaes, R. M. L., Pazianotto, R. A., Maciel, V. G., Brandão, M., Shimbo, J. Z., et al. (2022). Land-use change CO2 emissions associated with agricultural products at municipal level in Brazil. J. Clean. Prod. 364:132549. doi: 10.1016/j.jclepro.2022.132549
Guan, D., Meng, J., Reiner, D. M., Zhang, N., Shan, Y., Mi, Z., et al. (2018). Structural decline in China’s CO2 emissions through transitions in industry and energy systems. Nat. Geosci. 11, 551–555. doi: 10.1038/s41561-018-0161-1
Haberl, H., Löw, M., Perez-Laborda, A., Matej, S., Plank, B., Wiedenhofer, D., et al. (2023). Built structures influence patterns of energy demand and CO2 emissions across countries. Nat. Commun. 14:3898. doi: 10.1038/s41467-023-39728-3
Houghton, R. A. (2002). Magnitude, distribution and causes of terrestrial carbon sinks and some implications for policy. Clim. Pol. 2, 71–88. doi: 10.3763/cpol.2002.0206
Houghton, R. A., and Hackler, J. L. (1999). Emissions of carbon from forestry and land-use change in tropical Asia. Glob. Change Biol. 5, 481–492. doi: 10.1046/j.1365-2486.1999.00244.x
Hu, S. L., Zeng, G., Wang, S. P., and Liu, H. M. (2025). Spatio-temporal evolution and technological innovation driven in reduction of pollution and carbon emissions of the Yangtze River Economic Belt. Geogr. Res. 44, 72–90.
Khan, S., and Majeed, M. T. (2023). Toward economic growth without emissions growth: the role of urbanization & industrialization in Pakistan. J. Environ. Stud. Sci. 13, 43–58. doi: 10.1007/s13412-022-00797-3
Lai, L., Huang, X., Yang, H., Chuai, X., Zhang, M., Zhong, T., et al. (2016). Carbon emissions from land-use change and management in China between 1990 and 2010. Sci. Adv. 2:e1601063. doi: 10.1126/sciadv.1601063
Lau, H. C., Ramakrishna, S., Zhang, K., and Radhamani, A. V. (2021). The role of carbon capture and storage in the energy transition. Energy Fuel 35, 7364–7386. doi: 10.1021/acs.energyfuels.1c00032
Li, J., Huang, X., Chuai, X., and Yang, H. (2021). The impact of land urbanization on carbon dioxide emissions in the Yangtze River Delta, China: a multiscale perspective. Cities 116:103275. doi: 10.1016/j.cities.2021.103275
Li, J., Huang, X., Yang, H., Chuai, X., and Wu, C. (2017). Convergence of carbon intensity in the Yangtze River Delta, China. Habitat Int. 60, 58–68. doi: 10.1016/j.habitatint.2016.12.012
Li, L., Li, J., Peng, L., Wang, X., and Sun, S. (2023). Spatiotemporal evolution and influencing factors of land-use emissions in the Guangdong-Hong Kong-Macao Greater Bay Area using integrated nighttime light datasets. Sci. Total Environ. 893:164723. doi: 10.1016/j.scitotenv.2023.164723
Liao, L., and Shi, C. (2022). Multi-level governance in centralized state? Evidence from China after the territorial reforms. Lex Localis 20, 1–26. doi: 10.4335/20.1.1-26(2022)
Lin, Z. (2018). Ecological urbanism in East Asia: a comparative assessment of two eco-cities in Japan and China. Landsc. Urban Plan. 179, 90–102. doi: 10.1016/j.landurbplan.2018.07.008
Liu, C., Hu, S., Wu, S., Song, J., and Li, H. (2024a). County-level land use carbon emissions in China: spatiotemporal patterns and impact factors. Sustain. Cities Soc. 105:105304. doi: 10.1016/j.scs.2024.105304
Liu, C., Wang, X., and Li, H. (2024b). County-level land use carbon budget in the Yangtze River Economic Belt, China: spatiotemporal differentiation and coordination zoning. Land 13:215. doi: 10.3390/land13020215
Lu, D. (2018). Conservation of the Yangtza River and sustainable development of the Yangtze River Economic Belt: an understanding of general secretary xi Jinping’s important instructions and suggestions for their implementation. Acta Geograph. Sin. 73, 1829–1836.
Luo, Q., Zhou, J., Zhang, Y., Yu, B., and Zhu, Z. (2022). What is the spatiotemporal relationship between urbanization and ecosystem services? A case from 110 cities in the Yangtze River Economic Belt, China. J. Environ. Manag. 321:115709. doi: 10.1016/j.jenvman.2022.115709
Lv, Q., Liu, H., Wang, J., Liu, H., and Shang, Y. (2020). Multiscale analysis on spatiotemporal dynamics of energy consumption CO2 emissions in China: utilizing the integrated of DMSP-OLS and NPP-VIIRS nighttime light datasets. Sci. Total Environ. 703:134394. doi: 10.1016/j.scitotenv.2019.134394
Ma, Q., He, C., and Wu, J. (2016). Behind the rapid expansion of urban impervious surfaces in China: major influencing factors revealed by a hierarchical multiscale analysis. Land Use Policy 59, 434–445. doi: 10.1016/j.landusepol.2016.09.012
Ma, Y., and Liu, Z. Z. (2021). Study on the spatial-temporal evolution and infuencing factors of land use carbon emissions in the Yellow River Basin. Ecol. Econ. 37, 35–43.
McGlynn, E., Li, S., Berger, F., Amend, M., and Harper, K. L. (2022). Addressing uncertainty and bias in land use, land use change, and forestry greenhouse gas inventories. Clim. Chang. 170:5. doi: 10.1007/s10584-021-03254-2
Pribadi, D. O., and Pauleit, S. (2016). Peri-urban agriculture in Jabodetabek metropolitan area and its relationship with the urban socioeconomic system. Land Use Policy 55, 265–274. doi: 10.1016/j.landusepol.2016.04.008
Quan, B. A. I., and Zhenghao, L. I. U. (2025). China’s progress in implementing carbon-peaking pilot policies. Chin. J. Urban Environ. Stud. :2550003. doi: 10.1142/S2345748125500034
Rahaman, Z. A., Kafy, A. A., Saha, M., Rahim, A. A., Almulhim, A. I., Rahaman, S. N., et al. (2022). Assessing the impacts of vegetation cover loss on surface temperature, urban heat island and carbon emission in Penang city, Malaysia. Build. Environ. 222:109335. doi: 10.1016/j.buildenv.2022.109335
Raupach, M. R., Rayner, P. J., and Paget, M. (2010). Regional variations in spatial structure of nightlights, population density and fossil-fuel CO2 emissions. Energy Policy 38, 4756–4764. doi: 10.1016/j.enpol.2009.08.021
Rong, T., Zhang, P., Zhu, H., Jiang, L., Li, Y., and Liu, Z. (2022). Spatial correlation evolution and prediction scenario of land use carbon emissions in China. Ecol. Informatics 71:101802. doi: 10.1016/j.ecoinf.2022.101802
Shehzad, K. (2023). Extreme flood in Pakistan: is Pakistan paying the cost of climate change? A short communication. Sci. Total Environ. 880:162973. doi: 10.1016/j.scitotenv.2023.162973
Shi, K., Yu, B., Zhou, Y., Chen, Y., Yang, C., Chen, Z., et al. (2019). Spatiotemporal variations of CO2 emissions and their impact factors in China: a comparative analysis between the provincial and prefectural levels. Appl. Energy 233-234, 170–181. doi: 10.1016/j.apenergy.2018.10.050
Song, Y., Sun, X., Xia, P., Cui, Z., and Zhao, X. (2022). Research on the spatiotemporal evolution and influencing factors of green economic efficiency in the Yangtze River Economic Belt. Environ. Sci. Pollut. Res. 29, 68257–68268. doi: 10.1007/s11356-022-20542-1
Sun, H., Liang, H., Chang, X., Cui, Q., and Tao, Y. (2015). Land use patterns on carbon emission and spatial association in China. Econ. Geogr. 35, 154–162. doi: 10.15957/j.cnki.jjdl.2015.03.023
Tian, J., Shan, Y., Zheng, H., Lin, X., Liang, X., and Guan, D. (2019). Structural patterns of city-level CO2 emissions in Northwest China. J. Clean. Prod. 223, 553–563. doi: 10.1016/j.jclepro.2019.03.146
van Marle, M. J., van Wees, D., Houghton, R. A., Field, R. D., Verbesselt, J., and van der Werf, G. R. (2022). Retracted article: new land-use-change emissions indicate a declining CO2 airborne fraction. Nature 603, 450–454. doi: 10.1038/s41586-021-04376-4
Wang, H., He, Y., Shi, W., Zeng, W., and He, Y. (2024). Spatiotemporal spillover effect and efficiency of carbon emissions from land use in China. Environ. Dev. Sustain. 26, 8915–8953. doi: 10.1007/s10668-023-03076-5
Wang, Z., and Shao, H. (2023). Spatiotemporal differences in and influencing factors of urban carbon emission efficiency in China’s Yangtze River Economic Belt. Environ. Sci. Pollut. Res. 30, 121713–121733. doi: 10.1007/s11356-023-30674-7
Wang, J. F., and Xu, C. D. (2017). Geodetector: principle and prospective. Acta Geograph. Sin. 72:19. doi: 10.11821/dlxb201701010
Wang, W., and Yang, Y. (2024). Spatial-temporal differentiation characteristics and driving factors of China's energy eco-efficiency based on geographical detector model. J. Clean. Prod. 434:140153. doi: 10.1016/j.jclepro.2023.140153
Winkler, K., Yang, H., Ganzenmüller, R., Fuchs, R., Ceccherini, G., Duveiller, G., et al. (2023). Changes in land use and management led to a decline in Eastern Europe’s terrestrial carbon sink. Commun. Earth Environ. 4:237. doi: 10.1038/s43247-023-00893-4
Yan, H., Guo, X., Zhao, S., and Yang, H. (2022). Variation of net carbon emissions from land use change in the Beijing-Tianjin-Hebei region during 1990–2020. Land 11:997. doi: 10.3390/land11070997
Yang, Y., and Li, H. (2022). Monitoring spatiotemporal characteristics of land-use carbon emissions and their driving mechanisms in the Yellow River Delta: a grid-scale analysis. Environ. Res. 214:114151. doi: 10.1016/j.envres.2022.114151
Yang, X., Yu, Q., Avirmed, B., Wang, Y., Zhao, J., Sun, W., et al. (2025). Spatiotemporal dynamics and future projections of carbon use efficiency on the Mongolian plateau: a remote sensing and machine learning approach. Remote Sens. 17:1392. doi: 10.3390/rs17081392
Yu, Z., Chen, L., Tong, H., Chen, L., Zhang, T., Li, L., et al. (2022). Spatial correlations of land-use carbon emissions in the Yangtze River Delta region: a perspective from social network analysis. Ecol. Indic. 142:109147. doi: 10.1016/j.ecolind.2022.109147
Yu, H., Fotheringham, A. S., Li, Z., Oshan, T., Kang, W., and Wolf, L. J. (2020). Inference in multiscale geographically weighted regression. Geogr. Anal. 52, 87–106. doi: 10.1111/gean.12189
Yuan, X., Li, S., Chen, J., Yu, H., Yang, T., Wang, C., et al. (2024). Impacts of global climate change on agricultural production: a comprehensive review. Agronomy 14:1360. doi: 10.3390/agronomy14071360
Zhang, C. Y., Zhao, L., Zhang, H., Chen, M. N., Fang, R. Y., Yao, Y., et al. (2022). Spatial-temporal characteristics of carbon emissions from land use change in Yellow River Delta region, China. Ecol. Indic. 136:108623. doi: 10.1016/j.ecolind.2022.108623
Zhao, Z., Gao, J., Wang, Y., Liu, J., and Li, S. (2015). Exploring spatially variable relationships between NDVI and climatic factors in a transition zone using geographically weighted regression. Theor. Appl. Climatol. 120, 507–519. doi: 10.1007/s00704-014-1188-x
Zheng, X., Lu, Y., Yuan, J., Baninla, Y., Zhang, S., Stenseth, N. C., et al. (2020). Drivers of change in China’s energy-related CO2 emissions. Proc. Natl. Acad. Sci. USA 117, 29–36. doi: 10.1073/pnas.1908513117
Zheng, X., Wang, J., Xu, X., Yu, R., and Zhang, S. (2024). Carbon Kuznets curve in China: nighttime light analysis in prefecture-level cities. Heliyon 10:e36312. doi: 10.1016/j.heliyon.2024.e36312
Keywords: land use carbon emissions, impact factor, multiscale perspective, MGWR, Yangtze River Economic Belt
Citation: Liu C, Wang X and Li H (2025) Variations and impact factors of land use carbon emissions in the Yangtze River Economic Belt from a multiscale perspective. Front. Sustain. Cities. 7:1616652. doi: 10.3389/frsc.2025.1616652
Edited by:
Francisco Sampaio, Escola Superior de Enfermagem do Porto, PortugalReviewed by:
Qingxi Zhang, Hebei Normal University, ChinaXiaoping Zhang, Shandong Jianzhu University, China
Bin Liu, Chinese Academy of Sciences (CAS), China
Chao Zhang, Chinese Academy of Forestry, China
Wei Heng, Zhongkai University of Agriculture and Engineering, China
Copyright © 2025 Liu, Wang and Li. This is an open-access article distributed under the terms of the Creative Commons Attribution License (CC BY). The use, distribution or reproduction in other forums is permitted, provided the original author(s) and the copyright owner(s) are credited and that the original publication in this journal is cited, in accordance with accepted academic practice. No use, distribution or reproduction is permitted which does not comply with these terms.
*Correspondence: Xiaoman Wang, d2FuZ3htODdAbWFpbDIuc3lzdS5lZHUuY24=