 Li Li
Li Li Dingsheng Li
- School of Community Health Sciences, University of Nevada, Reno, NV, United States
Current life cycle impact assessment (LCIA) practices use a characterization factor to linearly scale chemical emission to human health impact assuming a homogeneous exposure and toxicological susceptibility for the entire population. However, both exposure and toxicological susceptibility may vary within the population, making the same emission elicit disproportionate impacts. Here we explore how inter-individual variabilities in human exposure and toxicological susceptibility interact to affect the estimated overall health impacts on the population level. For exemplification, we use the PROTEX model to simulate the exposure of the general American population to dieldrin and heptachlor, two organochlorine pesticides that tend to accumulate in food items. Using a Monte-Carlo analysis, we characterize inter-individual variabilities in exposure by considering variations in anthropometrics and dietary patterns between ages, sexes, and racial groups. We assess the overall health impact on the population level in five scenarios with different combinations of assumptions in exposure (homogeneous/heterogeneous) and the dose-response relationship (linear/non-linear, homogeneous/heterogeneous susceptibility). Our results indicate human exposure can vary by a factor of six among the different demographic groups. Combined with a non-linear dose-response relationship with heterogeneous susceptibility, the estimated overall health impact is substantially higher than the results using homogeneous susceptibility. However, the current LCIA practice of using a linear dose-response relationship produces even higher results that may overestimate the health impacts.
Introduction
Life cycle impact assessment (LCIA) frequently encounters the problem of quantitative characterization of health impact from human exposure to toxic substances. Currently, the human health characterization approach in the USEtox framework (Rosenbaum et al., 2008) is the most widely utilized. Under this approach, several regional factors influencing characterization of the human health impact in LCIA such as environmental parameters, population size, and population exposure patterns are considered. However, the characterization of human exposure to chemicals often builds on anthropometric and exposure factors representative of medians or averages of a population in a region of interest. Underlying this practice is an assumption that all individuals across a population share homogeneous exposure and identical heath response to a marginal increase in exposure. This exposure is then scaled linearly by an effect factor representing a fixed slope of the dose-response relationship and homogeneous toxicological susceptibility to the chemical to derive a characterization factor before multiplied by the emission of chemical to arrive with the impact result (Rosenbaum et al., 2011). The use of linear representation of dose-response relationship and the assumption of homogenous population are largely shared by other LCIA methodologies (European Commision, 2010; Wegener Sleeswijk and Heijungs, 2010; Bare, 2012; Fazio et al., 2018; Bulle et al., 2019) and prevail in the LCIA practice nowadays.
However, studies in other fields have long shown systematic inter-individual variabilities in human exposure and toxicological susceptibility due to a mixture of factors including genetics (Fenna et al., 1971; Zhang et al., 2011), development stage (Bearer, 1995; Garí and Grimalt, 2013), dietary pattern (Shikany et al., 2015; Awata et al., 2017), and behavior (Li L. et al., 2020). For instance, compared to individuals on an omnivorous or a vegetarian diet, those on a lipid-richer diet are found to be associated with a higher rate of ingestion of lipophilic persistent organic chemicals like organochlorine pesticides, because these compounds show a strong tendency to accumulate and concentrate in animal lipids (Undeman et al., 2010). In addition, the acceptability of using a linear dose-response relationship in toxicity characterization, especially for non-cancer effects, is also being questioned because it runs against our understanding of dose-response relationships for many substances (Fantke et al., 2018). Our recent work also evaluated the effect of using a non-linear dose-response relationship in human health characterization (Li D. et al., 2020), indicating that the traditional linear dose-response relationship underestimates substantially the overall health impacts in the case that a transient high exposure exerts disproportionate health effects. The most exposed and susceptible individuals would be underrepresented if generic, one-size-fits-all population characterization factors and the linear dose-response relationship were used in LCIA. Since these individuals may suffer severer health impacts compared to less vulnerable individuals, such an underrepresentation may bias the characterized health impacts at the entire population level. As such, it is imperative to understand the extent to which the characterized overall population health impacts in LCIA are influenced by the use of a linear representation of the dose-response relationship and the omission of inter-individual variations in human exposure and toxicological susceptibility. Such a quantitative understanding would benefit the future LCIA practice if population- and region-specific characterization factors should be refined in LCIA. However, these issues have not yet to be well-understood from the current perspectives of LCIA.
In the following, we model the daily oral doses of two lipophilic persistent organic chemicals (dieldrin and heptachlor) by ~330,000 virtual Americans varying in age (from 0 to 80), sex (male and female), and race/ethnicity (Non-Hispanic White, Non-Hispanic Black, Non-Hispanic Asian, and Hispanic). In this way, the exposure of the general U.S. population can be characterized using either individual-specific estimates or the population median. We also construct three types of dose-response relationships: linear, non-linear with homogeneous susceptibility across the population, and non-linear with individual-specific heterogeneous susceptibility. The overall health impacts of the general U.S. population are then evaluated using combinations of different expressions of human exposure and dose-response relationships.
Materials and Methods
Overview of the Method
Figure 1 gives an overview of the approach used in this work, using dieldrin as an example. First, a comprehensive fate and exposure model called PROTEX, is used to predict the life-course daily oral dose (in μgchemical/kgbodyweigt/d) of dieldrin and heptachlor by archetypal, average males and females of four groups of race/ethnicity (Figure 1A). Such PROTEX modeling enables us to characterize inter-individual variability in exposure resulting from variabilities in anthropometric data and dietary patterns between ages, sexes, and races/ethnicities.
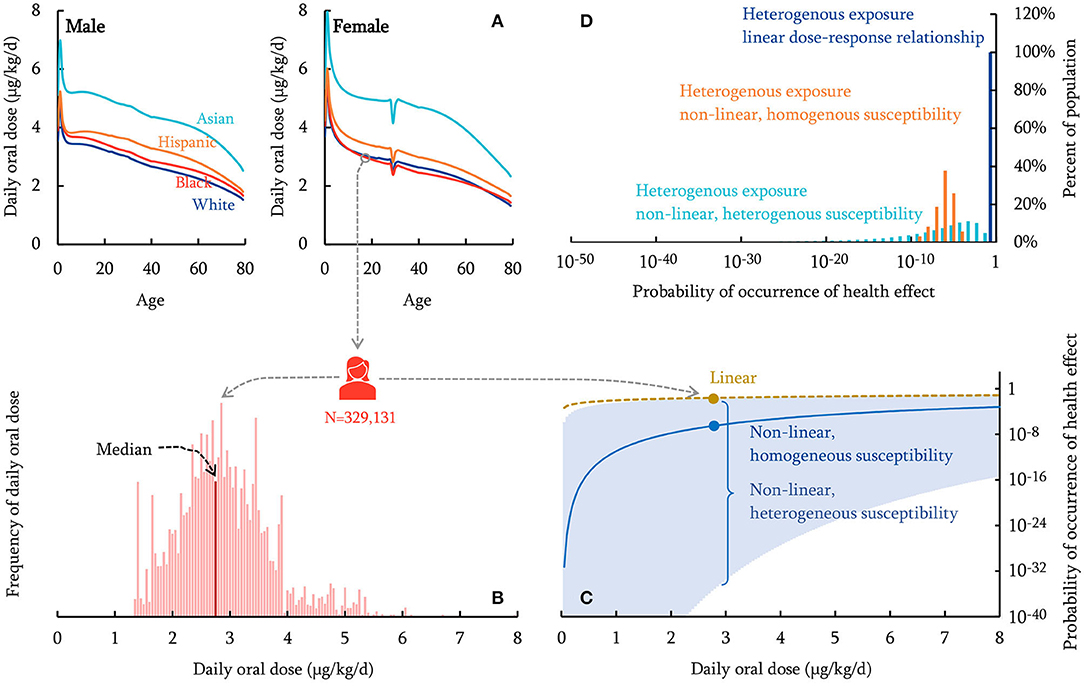
Figure 1. Schematic overview of the human health characterization approach (dieldrin for illustration). The PROTEX model predicts daily oral dose of chemicals with variabilities in age, sex, race/ethnicity (A). A nationally representative population of 329,131 virtual individuals is generated, each of which is assigned a daily oral dose sampled from the PROTEX predictions based on the individual's age, sex, race/ethnicity (B; the population median is indicated). The probability of occurrence of health effects is calculated for each virtual individual, based on dose-response relationships that are linear (dashed curve), non-linear with homogeneous susceptibility across the population (solid curve), or non-linear with individual-specific heterogeneous susceptibility (95% Confidence Interval shown in shadow) (C; Probability of occurrence of health effects on a logarithmic scale). (D) shows the distribution of the calculated probability of occurrence of health effects within the virtual population.
We then generate a virtual population using a Monte-Carlo simulation with 329,131 repetitions, each representing a virtual American with age, sex, and race/ethnicity stochastically sampled from the United States demographic composition in 2019 (U.S. Census Bureau, 2020a) (Supplementary Material Part 1). This virtual population represents ~0.1% of the actual U.S. total population (U.S. Census Bureau, 2020b). Next, each virtual individual is assigned a daily oral dose from PROTEX predictions based on their age, sex, and race/ethnicity (Figure 1B); for instance, Figure 1B shows that a 19-year-old Black female is predicted to have a daily oral dose of 2.9 μgchemical/kgbodyweigt/d on average for dieldrin. The exposure of this virtual population can be characterized using either individual-specific estimates (“heterogeneous exposure”) or the population median (“homogeneous exposure,” indicated in Figure 1B). Meanwhile, each virtual individual is assumed to follow a dose-response relationship, which can be either linear, non-linear with homogeneous susceptibility across the population, or non-linear with individual-specific heterogeneous susceptibility (Figure 1C). The estimated daily oral doses and dose-response relationships are then combined to assess the probability of occurrence of adverse health effects of these virtual individuals (Figure 1D). These probabilities of occurrence of health effects are then aggregated and scaled to estimate the overall health impact (the incidence of disease) of the general U.S. population. We seek to compare the estimated health impacts with and without considering inter-individual variabilities in human exposure and the dose-response relationship.
The PROTEX Model
PROTEX is a process-based, modular model that supports simulating life-course human exposure to chemicals present in various exposure media through multiple exposure pathways (Li et al., 2018a,b). PROTEX's performance has been well-evaluated elsewhere (Li et al., 2018a,b; Li et al., 2019; Li L. et al., 2020). In this work, we use three modules in PROTEX. First, fed with rates of chemical emission, a regional environmental fate module predicts the concentrations of chemicals in environmental compartments (e.g., air, soil, freshwater, freshwater sediment, estuary water, and estuary sediment in a modeled rural environment) due to their transport, transformation, and accumulation. Next, a food-web bioaccumulation module predicts chemical concentrations in the bodies of aquatic (planktivorous and piscivorous fish) and terrestrial organisms (beef and dairy cattle, pigs, poultry, and vegetables) living in this modeled rural environment, resulting from their absorption of chemicals from environmental compartments and predation, as well as toxicokinetics. These organisms constitute the diet of the modeled individual in PROTEX. For instance, the levels of chemicals in beef cattle, dairy cattle, pigs, poultry represent the levels in beef, dairy products, pork, and poultry and eggs, respectively. Finally, with anthropometric data (body weight and height), dietary patterns (weights of individual food items), and levels of contamination in food items, a human exposure module predicts age-dependent and sex-specific daily oral doses of chemicals via dietary ingestion throughout the lifetime.
In this work, PROTEX is parameterized to represent an archetypal subtropical U.S. environment. Specifically, 94.7% of the total regional area is rural, where unforested soil, forest, freshwater, and estuarine account for 29.2, 35.8, 7.0, and 28.0%, respectively (Nowak and Greenfield, 2012; US Census Bureau, 2018). Each year, the modeled rural region receives 379 mm of precipitation, with monthly ambient temperature varying from 287 to 296 K and monthly windspeed varying from 3.4 to 4.2 m/s (Arguez et al., 2010). The extrapolated monthly hydroxyl radical concentrations in the lower atmosphere vary from ~0.7 × 10⁵ to ~5.7 × 10⁵ molecule/cm3 (Spivakovsky et al., 2000). PROTEX's built-in defaults are used for other environmental parameters, to which the modeled results are less sensitive.
The two compounds are assumed to be emitted exclusively to the compartment of rural air. Since the soil compartment in PROTEX represents the growth environment for livestock and vegetables (as opposed to agricultural fields receiving the two pesticides) where the direct application of dieldrin and heptachlor is absent, atmospheric deposition is the main mechanism responsible for the occurrence of these two compounds in the soil compartment. The emission rate is assumed to be 299 kg/d for dieldrin and 1,507 kg/d for heptachlor based on historical high estimates (Fendick et al., 1990; Jorgenson, 2001), as these two compounds have no longer been used in the U.S. since the 1980s. Because we focus on variability in exposure in a generic context, we perform steady-state calculations. Since PROTEX is a time-variant model, we assume that the rate of chemical emission keeps constant throughout the modeling and starts 10 years prior to the birth of the modeled individuals. This decadal “spin-up” time ensures contamination in the environment and food items to reach and maintain the steady state throughout the lifetime of the modeled individual.
Demographic Parameters
When parameterized with sex- and race-specific anthropometric data and dietary patterns, PROTEX predicts the central tendencies of daily oral doses for females and males of four groups of race/ethnicity (Non-Hispanic White, Non-Hispanic Black, Non-Hispanic Asian, and Hispanic) throughout the lifetime.
The anthropometric data, i.e., body weight and height, are taken from the U.S. National Health and Nutrition Examination Survey (NHANES) between 1999 and 2018. A total of 102,956 NHANES participants are categorized into eight demographic groups based on their four groups of race/ethnicity and sex (male and female) according to the NHANES codebook (National Center for Health Statistics, 2020). Mexican American and Other Hispanic originally coded in NHANES are both considered Hispanic in this study. It should be noted that the sample size for Non-Hispanic Asians is significantly lower than the other races because it was not until 2011 when NHANES broke it out from the group of “Other Race—Including Multi-Racial.” Meanwhile, the ages of NHANES participants are converted to years with fractions if recordings of age in months are available for any given year in NHANES or whole numbers of years if recordings of age are only available in years. Participants older than 80 are assumed to be 80 since it is the maximum age defined in PROTEX. For each of the eight demographic groups, we use quartic regressions to express the central tendencies of body height and weight as quartic functions of age. The curated data from NHANES and regression functions can be found in Supplementary Material Part 1, Part 2, respectively.
Dietary patterns for individuals aged 20 and over are curated from Food Patterns Equivalents Database (2015-2016) by the U.S. Agricultural Research Service (Agricultural Research Service, 2018). Since the Food Patterns Equivalents Database uses a categorization different from that in PROTEX, we match the reported food items with their best corresponding items represented in PROTEX (Supplementary Material Part 2). Since the daily food consumption rates in the Database are in cups equivalent and ounce equivalent, depending on food items, they are converted into grams according to the information in the user guide accompanied the report (Bowman et al., 2018). Details about the conversion and the curated dietary patterns can be found in Supplementary Material Part 1. For each demographic group, PROTEX requires inputs of daily food consumption rates of a 25-year-old individual who has the average body weight and height in the racial group. The central tendencies of daily food consumption rates recorded in the Database are used to parameterize the 25-year-old male, whereas they are scaled, based on the ratio between national averages of males and females, to parameterize the 25-year-old female. A built-in algorithm in PROTEX (Li et al., 2018a) then extrapolates the daily food consumption rates at age 25 to other ages based on age-dependent body weight.
Chemicals Used in This Study
We evaluate human exposure to dieldrin and heptachlor because dietary ingestion has been revealed as the most predominant pathway of human exposure for these organochlorine pesticides. This is because they are almost exclusively used in agricultural environments (i.e., far-field environments) and their lipophilic and persistent features make them readily bioaccumulative in living organisms (Li et al., 2019). PROTEX requires inputs of properties describing the multimedia partitioning and transformation of dieldrin and heptachlor (Table 1).
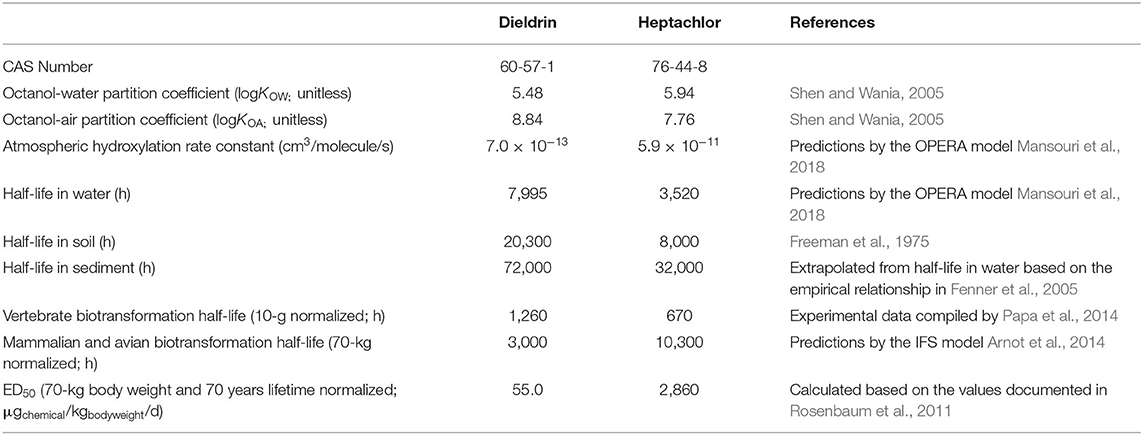
Table 1. Physicochemical properties and toxicity values of dieldrin and heptachlor.
To evaluate the health risks associated with dietary ingestion of the two compounds, we take the toxicity values in estimated effective dose causing a probability of health effects of 50% (in kgchemical over lifetime), a body weight of 70 kg, and a lifetime of 70 years (Rosenbaum et al., 2011) to derive an ED50 with the unit consistent with that of the daily oral dose (in μgchemical/kgbodyweigt/d). By this measurement, dieldrin is about 50-folds more toxic than heptachlor, which is another reason why we choose these two chemicals—to showcase potential differences when comparing chemicals of substantial differences in toxicity (Table 1).
Human Health Characterization
Assessment of human impact largely follows our previous work (Li D. et al., 2020) using a non-linear dose-response relationship to arrive at health impact estimates with some modifications. In this work, although the focus is on non-cancer effects, for which an exposure threshold below which no risks are usually assumed (Barnes et al., 1988; Lu, 1988), we do not make this assumption. This is because a recent study on probabilistic dose-response assessment suggests this threshold could have a large uncertainty—typically around 100-fold between upper and lower 95% confidence bounds—partly due to variability of susceptibility to the toxic chemical among the human population (Chiu et al., 2018). As a result, applying a deterministic threshold may artificially ignore the effects to those more susceptible.
For each virtual individual with long-term exposure to chemical i, expressed as a daily oral dose Xi [μgchemical/kgbodyweigt/d], we quantify the health impact using the probability of occurrence of adverse health effects (PrHE, unitless) by assuming this level of exposure persists over the lifetime. Since we use a steady state setting for exposure, Xi remains the same for each day over time, so does PrHE. Here, we use two types of daily oral dose in the assessment:
(I) individual-specific estimates for the 329,131 modeled virtual Americans varying in sex, age, and race/ethnicity (denoted as “heterogenous exposure”); and
(II) the median of the estimates for the 329,131 virtual Americans (denoted as “homogeneous exposure”).
On the other hand, we examine three types of dose-response relationships:
(I) the linear dose-response relationship. We follow the method used in USEtox (Rosenbaum et al., 2011) by multiplying exposure and an effect factor (calculated by 50% over ED50,i):
We only adopt this equation from USEtox for the representation of a linear dose-response relationship and should not be confused as the method in this work is based on USEtox—i.e., Xi is characterizing exposure but not equivalent to intake fraction in USEtox.
(II) a non-linear dose-response relationship, given by Huijbregts et al. (2005) and adapted for lifetime daily oral dose instead of aggregated total lifetime exposure:
where σlog [unitless] is the spread in human susceptibility for a non-cancer effect in a lognormal distribution. The spread in human toxicological susceptibility (σlog) is assumed to be identical for all the modeled individuals, with a value of 0.26 based on the central tendency recommended by Huijbregts et al. (2005). This way is denoted as “homogeneous human susceptibility.”
(III) The spread in toxicological susceptibility (σlog) is assumed to vary between the 329,131 virtual Americans. That is, there are 329,131 dose-response curves with different shapes. Their σlog are randomly sampled from a log-normal distribution with the central tendency of 0.26 and squared geometric standard deviation (i.e., the ratio between 97.5th and 2.5th percentiles, otherwise known as “uncertainty factor” in Huijbregts et al., 2005) of 2.5 (Huijbregts et al., 2005). This way is denoted as “heterogeneous human susceptibility.”
It should be noted that if Xi varies by day, the calculated PrHE from the above equations should be aggregated for the lifetime and then normalized over the lifetime to represent the lifetime probability (Li D. et al., 2020). However, since Xi is constant in this study, so does PrHE, we omit this step in the calculation.
As such, considering the combination of the inter-individual variability in daily oral dose and the type of dose-response relationship, we discuss five scenarios in this work, as summarized in Table 2.
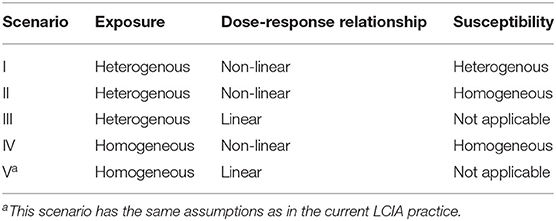
Table 2. Scenarios considered in this study with a breakdown of their combinations of exposure, dose-response relationship, and susceptibility assumptions.
The calculated probabilities of occurrence of health effects of the virtual Americans (n = 1, 2, …, 329,131) are then aggregated and scaled to the total population in the U.S. (329,131,338) to calculate the overall health impacts (the number of cases of disease):
Results and Discussions
Inter-Individual Variability in Exposure
Figure 2 shows the modeled human exposure to dieldrin and heptachlor when these organochlorine pesticides were in prevalent use. Accounting for variabilities in sex, age, and race/ethnicity, PROTEX estimates that the median daily oral dose is 2.81 (95% Confidence Interval: 1.43–4.95) μg/kg/d for dieldrin and 1.27 (95% Confidence Interval: 0.66–1.86) μg/kg/d for heptachlor. These numbers are close to historical measurements among Americans, with a difference within an order of magnitude (Hunter et al., 1967; McGill et al., 1972). For instance, surveys conducted in the mid-1960s, when the use of dieldrin and heptachlor started to decline nationally, show that the mean dietary intake of dieldrin by the general American population ~0.3 μg/kg/d (Hunter et al., 1967; Duggan and Corneliussen, 1972; McGill et al., 1972).
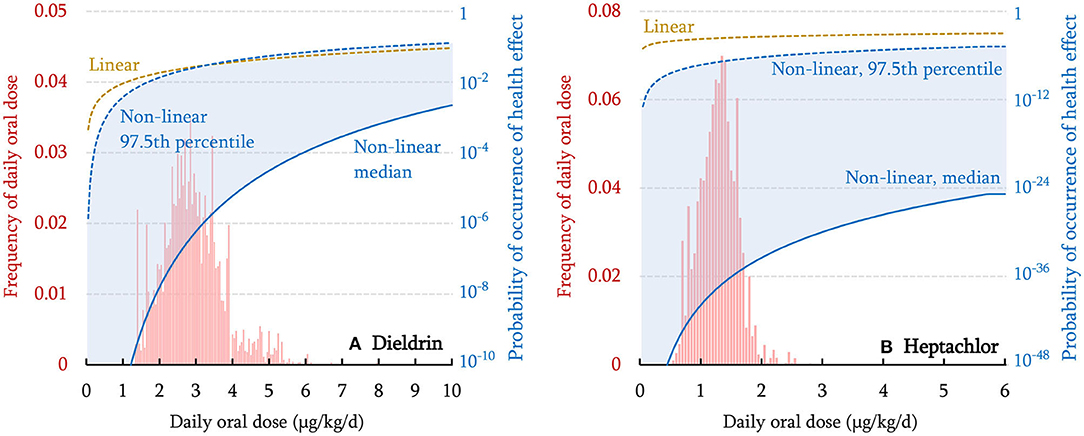
Figure 2. Distribution of modeled daily oral dose within the virtual population (histogram in red), the linear dose-response relationship (dashed curve), non-linear dose-response relationship with homogeneous susceptibility (median) across the population (solid curve), and non-linear dose-response relationship with individual-specific heterogeneous susceptibility (97.5th percentile shown in shadow) for dieldrin (A) and heptachlor (B). Note that the probability of occurrence of health effects is displayed on a logarithmic scale. The curve representing the 2.5th percentile is too low to be shown.
As shown in Figure 2, a ~3-fold variation is associated with the 95% Confidence Interval of the modeled daily oral doses. Such an interindividual variation is similar to that observed in reality, i.e., 3–6 folds for the two compounds in the 1960s surveys (Duggan and Corneliussen, 1972) and 3–4 folds for the two compounds in the 1990 survey (MacIntosh et al., 1996). Note that the interindividual variation is independent of the rate of chemical emissions, and thus, should not change with time. The agreement between modeled and observed variations indicates that variabilities in age, sex, and race/ethnicity account to a large extent for inter-individual variabilities in human exposure to the two compounds, although the inter-individual variability within each demographic group is not considered in this work.
Across age, sex, and race/ethnicity, the total variation of daily oral doses of these two compounds can be as high as a factor of 6. Variability in age, by a factor of ~4 (Figure 1A), contributes the most to this total variation, whereas sex and race/ethnicity make relatively smaller contributions (approximately a factor of 2 for race/ethnicity and up to 18% for sex). The dependence of the daily oral dose on age is caused by age-variant changes in food consumption rate and body weight, as the daily oral dose is defined as chemical exposure normalized by body weight. The daily oral dose is highest in early childhood and declines rapidly before 5 years of age due to fast growth. Throughout adulthood, the daily oral dose keeps decreasing because of a constant but slim increase in body weight. In particular, when a woman becomes pregnant (assumed to occur at 29 years of age by default in PROTEX), her body weight increases but the rate of food consumption remains almost the same, resulting in a sharp decline in the daily oral dose (Figure 1A). The daily oral dose rebounds to the pre-pregnancy level after child delivery.
The variation associated with race/ethnicity is a result of differences in anthropometrics and dietary patterns. Supplementary Figure 1 in Supplementary Material Part 2 shows the relative contributions of different food items to the daily oral dose, using a 25-year-old median female American as an example. For dieldrin, consumption of fish contributes the most (~40%) to daily oral dose, followed by consumption of beef and dairy products (~35%), and leafy vegetables and root plants (~15%). For heptachlor, consumption of beef and dairy products is dominant (~45%), followed by leafy vegetables and root plants (30%) and poultry (12%). Our modeling results are consistent with findings in an earlier theoretical study (Undeman et al., 2010), in which consumption of fish and beef was also identified as the dominant contributors to human exposure to chemicals with partition coefficients identical to dieldrin and heptachlor, respectively. The predominance of fish consumption in human exposure to dieldrin has also been confirmed by a national comprehensive food survey in the U.S. (Dougherty et al., 2000). Asian Americans have higher daily oral doses of both chemicals (see the example of dieldrin in Figure 1A), which results mainly from their higher consumption of fish and leafy vegetables than other racial groups, although they consume the least amount of beef. Asian Americans also have the highest total food consumption rate. Their lighter body weight is also a reason for the higher daily oral dose of Asian Americans.
Inter-Individual Variability in Dose-Response Relationships
The dose-response relationship varies, depending on (i) the assumed shape (linear vs. non-linear) and (ii) toxicological susceptibility if a non-linear dose-response relationship is assumed. Figure 2 compares the probability of health effects estimated using linear and non-linear dose-response (median, and 97.5th percentile that represents high susceptibility) relationships for two compounds. For dieldrin (Figure 2A), within the daily oral dose range of up to 10 μg/kg/d, a linear dose-response relationship (brown dashed curve) always gives higher estimates of the probability of occurrence of health effects than a non-linear dose-response relationship with median susceptibility (the blue solid curve); the two curves get closer as exposure increases. The linear dose-response curve intersects with the non-linear dose-response curve with high susceptibility (the blue dashed line) at the daily oral dose of 3.3 μg/kg/d. These indicate that the relative magnitude of linear and non-linear dose-response relationships is dependent on daily oral dose as well as susceptibility. When daily oral dose exceeds 3.3 μg/kg/d, a linear dose-response relationship gives a lower estimate of the probability of occurrence of health effects relative to a non-linear dose-response relationship with high susceptibility. As such, assuming a linear dose-response relationship underestimates the health impact of highly exposed and more susceptible individuals. By contrast, for heptachlor (Figure 2B), in the investigated dose range, a linear dose-response relationship always gives a higher estimate of the probability of occurrence of health effects than the non-linear dose-response relationship, regardless of whether the median or 97.5th percentile is used for toxicological susceptibility. Overall, when exposure is relatively low (median exposure ~5% of ED50 for dieldrin and ~0.04% of ED50 for heptachlor in Figure 2), the estimate of health impact is the most conservative for almost all individuals if a linear dose-response relationship is used, but it becomes less conservative once exposure reaches a higher level. This is consistent with our findings reported previously (Li D. et al., 2020).
Numerically, the maximum marginal increase in probability occurs at exposure relative to ED50 depending on the spread in human susceptibility, σlog. In the case of using 0.104, 0.26, and 0.65 as the 2.5% percentile, median, and 97.5% percentile for σlog, respectively, the maximum marginal increase in response is for exposures at ~94, 70, and 11% of the ED50, respectively. This would indicate that the rate of increase in response would slow down first in the individuals supposedly with higher susceptibility than those with lower susceptibility. In addition, after reaching exposure equal to ED50, at which all curves will intersect according to the equation representing the non-linear dose-response relationship used in this study, individuals supposedly with higher susceptibility would see lower responses compared to those with lower susceptibility as exposure increases. This is purely due to the mathematical description of the non-linear dose-response relationship used in this study and may not reflect reality. However, this limitation may not significantly affect the results of this study as exposure is much lower than the ED50, similar to what to be expected in reality. Nevertheless, future study is needed for mathematical descriptions that agree better with reality.
Overall Human Health Impacts Across the U.S. Population
It is mathematically intuitive that the probability of occurrence of health effects is proportional to the level of exposure when a linear dose-response relationship is assumed. However, when a non-linear dose-response relationship is assumed, the interplay of the variabilities in exposure and human susceptibility results in uncertainty in human health impacts. Table 3 compares the probability of occurrence of health effects when the lower (2.5th percentile), median, and higher (97.5th percentile) estimates of the daily oral dose of the 329,131 virtual Americans, and the lower (2.5th percentile; σ = 0.104), median (σ = 0.260), and higher (97.5th percentile; σ = 0.650) estimates of the human susceptibility, are used in the assessment. The comparison shows that the estimated probability of occurrence of health effects is the highest if the assessment is based on the high end of exposure estimate and a larger fraction of the population is assumed to be susceptible to the health impact. Note that the probabilities in Table 3 are for individuals and due to the nature of a sigmoid shaped non-linear dose-response relationship, individuals with low exposure and/or low susceptibility landing on the “flat” part of the curve would experience negligible risk, represented by the extremely low estimates of probabilities that are effectively 0.
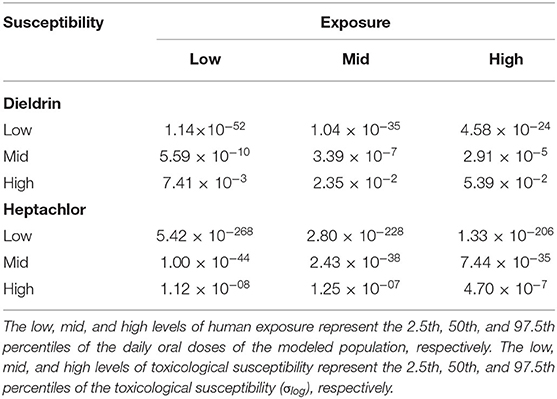
Table 3. The probability of occurrence of health effects (unitless) resulting from a virtual individual's exposure to dieldrin and heptachlor, calculated based on low, mid, and high levels of human exposure and toxicological susceptibility.
As indicated in Section “Inter-individual variability in exposure,” the daily oral doses of these two compounds vary roughly by a factor of 6 within the modeled population. However, Table 3 shows that the variation in the probability of occurrence of health effects is more pronounced, e.g., by factors of 7 (dieldrin) and 42 (heptachlor) in the case of high human susceptibility and factors of 104 (dieldrin) and 109 (heptachlor) in the case of median human susceptibility. That is, variability in human susceptibility amplifies the variation in exposure for health impacts. Notably, in our case, such amplification is more remarkable when human susceptibility is low. This is due to the coincidence between the range of daily oral doses of the modeled individuals and the range of dose-response curve with the steepest slope (Figure 2). As a sigmoid dose-response curve indicates, the increase in the probability of occurrence of health effects eventually becomes minimal when the daily oral dose reaches a sufficiently higher level, where the dose-response curve is flattened. As shown in Figure 2 and discussed in the previous section, compared with the case of medium human susceptibility, the curve is flattened at a much lower dose level when human susceptibility is high. In this case, therefore, the probability of occurrence of health effects becomes less responsive in the range of daily oral doses of the modeled individuals.
Table 4 compares the overall health impact estimated for the entire U.S. population under five scenarios. It also shows the contributions to the overall health impact estimates from individuals at the top 10, 5, and 1% of health impact estimates. The following findings can be obtained. First, when a linear dose-response relationship is applied, the estimated disease cases across the U.S. are almost the same regardless of heterogeneous or homogeneous exposure (Scenarios III vs. V). This is not surprising, as the variation of exposure within the population could eventually be “averaged” out among themselves. Second, when the non-linear dose-response relationship is used, the combination of a homogeneous exposure and homogeneous human susceptibility, i.e., ignoring variabilities in both human exposure and susceptibility, leads to the lowest estimate of disease cases (Scenario IV). This is because the median daily oral doses of the modeled Americans (2.81 μg/kg/d for dieldrin and 1.27 μg/kg/d for heptachlor) are both located where the curve representing the median of non-linear dose-response relationship is below the one representing the linear dose-response relationship (see Figure 1 and discussion in Section “Inter-individual variability in dose-response relationships”). Compared with Scenario IV, adding variability in human exposure increases disease cases (Scenario II) for dieldrin (Table 4) because the involvement of individuals with higher daily oral doses contributes significantly more to the health impact estimate (Figure 1).
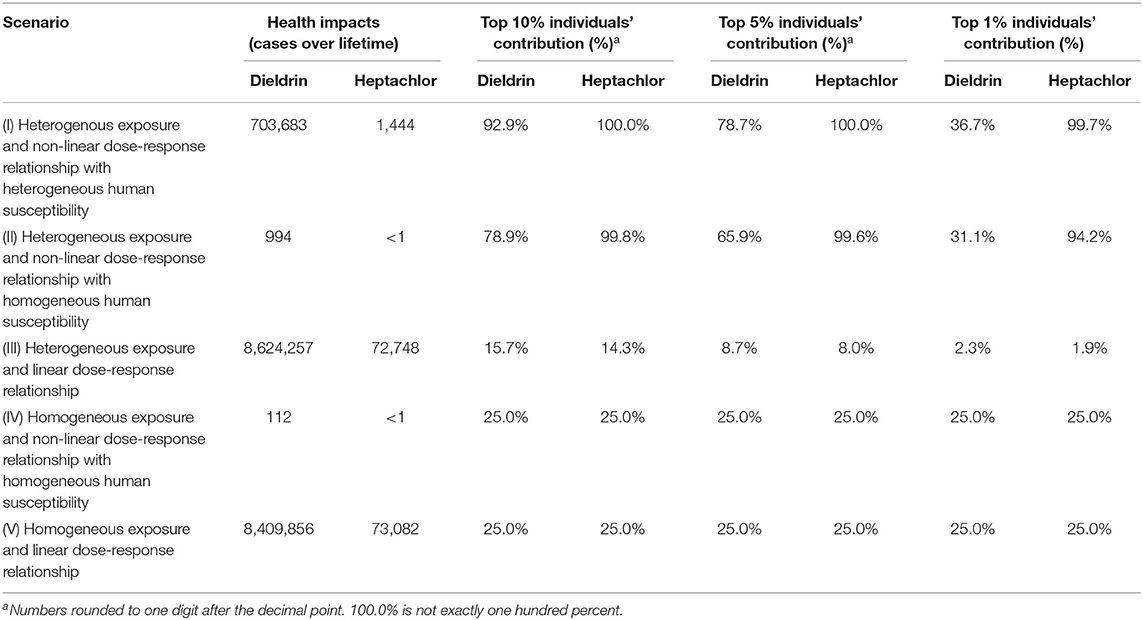
Table 4. Overall health impacts estimated for the total population of the United States under five scenarios with the assumed emission rates in this study.
Most surprisingly but not totally unexpected is the substantial increase—more than hundreds of times at least—in health impact estimates in the simultaneous consideration of the heterogenous exposure and heterogeneous human susceptibility (Scenario I vs. IV). This is because the health impact estimates are dominated by the small portion of highly susceptible individuals who also have higher exposure, as revealed by the disproportionate contributions from the top 10, 5, and 1% of such individuals (Table 4). Supplementary Figure 2 compares the distribution of the probability of occurrence of health effects within the modeled population between different scenarios. It is evident in Supplementary Figure 2A that considering the variability in human susceptibility spreads out the distribution, lowering the health impact to a portion of the modeled population but elevating that to the other. Overall, since the probability of occurrence of health effects is small (e.g., at a level of ~10−7 when a homogeneous exposure is used, Scenarios IV), a further reduction in the already small probability can impact only marginally the aggregated health impact among the modeled population. However, this level of exposure is sufficient to result in severe health outcomes in the highly susceptible subpopulation. For example, Supplementary Figure 2A demonstrates that more than 5% of the modeled individuals are associated with a probability of occurrence of health effects >1%. As such, the highly susceptible subpopulation makes a disproportionately outsized contribution to the national overall health impacts. Furthermore, compared to results in Scenario I (heterogenous human susceptibility), the overall health impacts estimate in Scenario II (homogeneous human susceptibility) is substantially smaller while the contributions from the top 10, 5, and 1% most impacted individuals are similar. This indicates that the distribution of health impact largely depends on the variation of the exposure among the population, but by using the median dose-response relationship for everyone, susceptible individuals will not be represented in the estimate and lead to a substantially lower estimation for health impact.
The health impact estimates are the highest, e.g., 8 million cases for dieldrin over the entire lifetime, when using a linear dose-response relationship (Scenario III and V). This is because the linear dose-response relationship implies a more conservative estimate of the probability of occurrence of health effects relative to other assumed dose-response relationships, as explained earlier in Section “Inter-individual variability in dose-response relationships.” It should be noted that Scenario V, i.e., the homogenous exposure and linear dose-response relationship, also represents the key assumptions of calculating characterization factors for human health impact from toxic chemicals in most “mainstream” LCIA methodologies used in LCA practices. Scenario III takes a heterogenous exposure assumption, but its effect is minimal as long as the linear dose-response relationship is still in effect. However, it remains unknown whether these estimates are realistic or not. For dieldrin alone, such a high estimate of incidence corresponds to an annual incidence rate of 37.4 per 100,000 during its peak use across the United States. This annual incidence rate is close to the high end of estimates for health impacts resulting from exposure to a wide range of endocrine-disrupting chemicals (Attina et al., 2016), and it even rivals the annual incidence rate of syphilis, one of the most common infectious disease (US CDC, 2019). Future epidemiology studies may confirm the plausibility and validity of using a linear dose-response relationship in this estimation.
The consideration of the non-linear dose-response relationship and inter-individual variability could have several implications on the calculation of characterization factors in LCIA. First, when a non-linear dose-response relationship is assumed, characterization factors may no longer be independent of emission amount as they are in current LCIA methods. As emission increases, even if exposure increases linearly, the marginal increase in health response could increase more/less as the dose moves toward a steeper/flatter part of the sigmoid shaped dose-response relationship curve. Even if the total emission amount keeps the same, characterization factors for long-term low-dose exposure (e.g., the case that the emission is spread evenly throughout a year) would differ substantially from those for short-term high-dose exposure (e.g., the case that the emission is concentrated in a presumed accidentally release) (Li D. et al., 2020). Second, should the spread in toxicological susceptibility among the population vary between chemicals, the current ranking of characterization factors would change even if emissions were assumed to be equal. As discussed above, the overall health impacts are contributed mostly by a small portion of highly susceptible individuals (Table 4, Supplementary Figure 2). If two chemicals have similar exposure and ED50, we would expect a larger number of disease cases for the chemical with a larger spread of susceptibility (σlog), because it exerts a higher probability of occurrence of health effects on the highly susceptible individuals. Thus, this chemical could have a higher characterization factor, which would not be the case for current LCIA methods assuming homogeneous susceptibility. However, since the current understanding of toxicological susceptibility is limited, we have to assume this spread of susceptibility is not chemical specific. Under this assumption, the ranking of characterization factors would remain unchanged.
Limitations
In this study we assume the spread in toxicological susceptibility (σlog) has the same probability distribution among demographic groups while this may not be true given variabilities in toxicokinetics, genetics, ontogeny, and physiology. For instance, it has been demonstrated that hepatic clearance rate, a key determinant in the metabolism of compounds in the body, varies systematically between racial groups for some compounds (Ja, 2000; Piccinini et al., 2017). It is also well-known that the level of tolerance to certain substances associates with demographics due to genetic differences (Jorgenson et al., 2017; Ugidos-Rodríguez et al., 2018). Although it is desirable to incorporate this systematic difference in susceptibility to toxic compounds among subpopulations in the calculation, to our knowledge, there is no quantitative representation that can be used.
Moreover, the probabilistic non-linear dose-response relationship used in this study is theoretical and generic. It has not been validated for specific toxic compounds with observational data, which is unlikely feasible to be at all due to the sheer size of chemical space and the resources needed to gather experimental data points. As such, this study is exploratory in nature and does not imply the health impact estimates are accurate. Recently, sophisticated efforts considering a number of variations in the extrapolation from animal data to expected human toxicity have been made to derive probabilistic Reference Doses for more than a thousand chemicals (Chiu and Slob, 2015; Chiu et al., 2018). However, this risk assessment-oriented approach is only suitable to determine the exposure threshold that can protect the desired fraction of the population and cannot be employed with varying exposure to estimate health impacts. Without validated non-linear dose-response relationships for specific toxic compounds, the accuracy of results from this study remains uncertain and should be interpreted in the comparative sense of contrasting results with or without the non-linear dose-response relationship.
In addition, when estimating human exposure, PROTEX assumes homogeneous contamination in various environmental compartments and food items. This assumption may not be true for less ubiquitous chemicals since the emission of chemicals to the environment is not evenly distributed spatially (Mennis and Jordan, 2005; Logue et al., 2010) nor the real environment is a “well-mixed box” often assumed in fate and transport models. However, this challenge is out of the scope of this study and better suited to be addressed by research in life cycle inventory (Tessum et al., 2012) and fate and transport modeling (Wannaz et al., 2018). The variation in exposure potential across the population will only enhance the variation we show with our health impact estimate results by further driving the range of daily oral dose.
Conclusions
Our results show that with a given emission of chemicals, variations in both human exposure and toxicological susceptibility to the chemical as well as the adoption of a non-linear representation of dose-response relationship can influence the health impact estimate. Overall, the variation in exposure may not be influential if a linear dose-response relationship is used to estimate health impacts for a large and diverse population but could be important when comparing two or more distinctive subpopulations. The influence of adopting a non-linear dose-response relationship instead of a linear one depends on the relativeness of exposure and toxicity. In contrast to heterogeneous exposure and the non-linear dose-response relationship with heterogeneous toxicological susceptibility, the current LCIA practice that uses a linear dose-response relationship and homogenous exposure gives a more conservative estimate of the overall health impacts, which could be one order of magnitude higher. This significant effect on the human health impact result could potentially alter the conclusions of LCA studies when impact estimates from all categories are viewed together. To better estimate the health impacts associated with exposure to chemicals with a higher degree of confidence, we need an improved understanding of the dose-response relationship as well as the variation of toxicological susceptibility among the diverse population. Then, LCIA methods can incorporate such variations in population characteristics and provide more realistic estimates of health impact when coupled with life cycle inventory data for the region where the population lives.
Data Availability Statement
The original contributions presented in the study are included in the article/Supplementary Material, further inquiries can be directed to the corresponding author/s.
Author Contributions
LL performed the exposure model calculation. DL performed the health impact model calculation. LL and DL analyzed the results and wrote the manuscript. All authors contributed to the article and approved the submitted version.
Conflict of Interest
The authors declare that the research was conducted in the absence of any commercial or financial relationships that could be construed as a potential conflict of interest.
Supplementary Material
The Supplementary Material for this article can be found online at: https://www.frontiersin.org/articles/10.3389/frsus.2021.648138/full#supplementary-material
References
Agricultural Research Service (2018). Food Patterns Equivalents Intakes from Food: Mean Amounts Consumed per Individual, by Race/Ethnicity and Age, What We Eat in America, NHANES 2015-2016. U.S. Department of Agriculture. Available online at: www.ars.usda.gov/nea/bhnrc/fsrg (accessed August 24, 2020).
Arguez, A., Durre, I., Applequist, S., Squires, M., Vose, R., Yin, X., et al. (2010). NOAA's U.S. Climate Normals (1981-2010). Washington, DC: NOAA National Centers for Environmental Information.
Arnot, J. A., Brown, T. N., and Wania, F. (2014). Estimating screening-level organic chemical half-lives in humans. Environ. Sci. Technol. 48, 723–730. doi: 10.1021/es4029414
Attina, T. M., Hauser, R., Sathyanarayana, S., Hunt, P. A., Bourguignon, J.-P., Myers, J. P., et al. (2016). Exposure to endocrine-disrupting chemicals in the USA: a population-based disease burden and cost analysis. Lancet Diabetes Endocrinol. 4, 996–1003. doi: 10.1016/S2213-8587(16)30275-3
Awata, H., Linder, S., Mitchell, L. E., and Delclos, G. L. (2017). Biomarker levels of toxic metals among Asian populations in the United States: NHANES 2011-2012. Environ. Health Perspect. 125, 306–313. doi: 10.1289/EHP27
Bare, J. (2012). Tool for the Reduction and Assessment of Chemical and other Environmental Impacts (TRACI). U.S. Environmental Protection Agency Available online at: https://www.pre-sustainability.com/download/TRACI_2_1_User_Manual.pdf (accessed June 13, 2019).
Barnes, D. G., Dourson, M., Dourson, M., Preuss, P., Barnes, D. G., Bellin, J., et al. (1988). Reference dose (RfD): description and use in health risk assessments. Regul. Toxicol. Pharmacol. 8, 471–486. doi: 10.1016/0273-2300(88)90047-5
Bearer, C. (1995). How are children different from adults? Environ. Health Perspect. 103, 7–12. doi: 10.1289/ehp.95103s67
Bowman, S., Clemens, J., Shimizu, M., Friday, J., and Moshfegh, A. (2018). Food Patterns Equivalents Database 2015-2016: Methodology and User Guide. Beltsville, MD: Food Surveys Research Group, Beltsville Human Nutrition Research Center, Agricultural Research Service, U.S. Department of Agriculture Available online at: http://www.ars.usda.gov/nea/bhnrc/fsrg (accessed September 11, 2020).
Bulle, C., Margni, M., Patouillard, L., Boulay, A.-M., Bourgault, G., De Bruille, V., et al. (2019). IMPACT World+: a globally regionalized life cycle impact assessment method. Int. J. Life Cycle Assess. 24, 1653–1674. doi: 10.1007/s11367-019-01583-0
Chiu, W. A., Axelrad, D. A., Dalaijamts, C., Dockins, C., Shao, K., Shapiro, A. J., et al. (2018). Beyond the RfD: broad application of a probabilistic approach to improve chemical dose–response assessments for noncancer effects. Environ. Health Perspect. 126:067009. doi: 10.1289/EHP3368
Chiu, W. A., and Slob, W. (2015). A unified probabilistic framework for dose-response assessment of human health effects. Environ. Health Perspect. 123, 1241–1254. doi: 10.1289/ehp.1409385
Dougherty, C. P., Henricks Holtz, S., Reinert, J. C., Panyacosit, L., Axelrad, D. A., and Woodruff, T. J. (2000). Dietary exposures to food contaminants across the United States. Environ. Res. 84, 170–185. doi: 10.1006/enrs.2000.4027
Duggan, R. E., and Corneliussen, P. E. (1972). Dietary intake of pesticide chemicals in the United States. 3. June 1968–April 1970. Pestic. Monit. J. 5, 331–341.
European Commision (2010). International Reference Life Cycle Data System (ILCD) Handbook: Recommendations for Life Cycle Impact Assessment in the European Context, Based on Existing Environmental Impact Assessment Models and Factors. 1st ed. Ispra: European Commision.
Fantke, P., Aylward, L., Bare, J., Chiu, W. A., Dodson, R., Dwyer, R., et al. (2018). Advancements in life cycle human exposure and toxicity characterization. Environ. Health Perspect. 126:125001. doi: 10.1289/EHP3871
Fazio, S., Castellani, V., Sala, S., Schau, E., Secchi, M., Zampori, L., et al. (2018). Supporting Information to the Characterisation Factors of Recommended EF Life Cycle Impact Assessment Methods: New Methods and Differences With ILCD. Luxembourg: Publications Office of the European Union.
Fendick, E. A., Mather-Mihaich, E., Houck, K. A., St Clair, M. B., Faust, J. B., Rockwell, C. H., et al. (1990). Ecological toxicology and human health effects of heptachlor. Rev. Environ. Contam. Toxicol. 111, 61–142. doi: 10.1007/978-1-4612-3340-4_2
Fenna, D., Mix, L., Schaefer, O., and Gilbert, J. A. L. (1971). Ethanol metabolism in various racial groups. Can. Med. Assoc. J. 105, 472–475.
Fenner, K., Scheringer, M., MacLeod, M., Matthies, M., McKone, T., Stroebe, M., et al. (2005). Comparing estimates of persistence and long-range transport potential among multimedia models. Environ. Sci. Technol. 39, 1932–1942. doi: 10.1021/es048917b
Freeman, H. P., Taylor, A. W., and Edwards, W. M. (1975). Heptachlor and dieldrin disappearance from a field soil measured by annual residue determinations. J. Agric. Food Chem. 23, 1101–1105. doi: 10.1021/jf60202a010
Garí, M., and Grimalt, J. O. (2013). Inverse age-dependent accumulation of decabromodiphenyl ether and other PBDEs in serum from a general adult population. Environ. Int. 54, 119–127. doi: 10.1016/j.envint.2013.01.012
Huijbregts, M. A. J., Rombouts, L. J. A., Ragas, A. M. J., and van de Meent, D. (2005). Human-toxicological effect and damage factors of carcinogenic and noncarcinogenic chemicals for life cycle impact assessment. Integr. Environ. Assess. Manag. 1, 181–244. doi: 10.1897/2004-007R.1
Hunter, C. G., Robinson, J., and Jager, K. W. (1967). Aldrin and dieldrin—the safety of present exposures of the general populations of the united kingdom and the united states. Food Cosmet. Toxicol. 5, 781–787. doi: 10.1016/S0015-6264(67)83277-2
Ja, J. (2000). Predictability of the effects of race or ethnicity on pharmacokinetics of drugs. Int. J. Clin. Pharmacol. Ther. 38, 53–60. doi: 10.5414/CPP38053
Jorgenson, E., Thai, K. K., Hoffmann, T. J., Sakoda, L. C., Kvale, M. N., Banda, Y., et al. (2017). Genetic contributors to variation in alcohol consumption vary by race/ethnicity in a large multi-ethnic genome-wide association study. Mol. Psychiatry 22, 1359–1367. doi: 10.1038/mp.2017.101
Jorgenson, J. L. (2001). Aldrin and dieldrin: a review of research on their production, environmental deposition and fate, bioaccumulation, toxicology, and epidemiology in the United States. Environ. Health Perspect. 109, 113–139. doi: 10.2307/3434852
Li, D., Tao, M., Vieira, J., and Suh, S. (2020). The effects of incorporating non-linearity in LCA: characterizing the impact on human health. Front. Sustain. 1, 1–9. doi: 10.3389/frsus.2020.569385
Li, L., Arnot, J. A., and Wania, F. (2018a). Revisiting the contributions of far- and near-field routes to aggregate human exposure to Polychlorinated Biphenyls (PCBs). Environ. Sci. Technol. 52, 6974–6984. doi: 10.1021/acs.est.8b00151
Li, L., Arnot, J. A., and Wania, F. (2018b). Towards a systematic understanding of the dynamic fate of polychlorinated biphenyls in indoor, urban and rural environments. Environ. Int. 117, 57–68. doi: 10.1016/j.envint.2018.04.038
Li, L., Arnot, J. A., and Wania, F. (2019). how are humans exposed to organic chemicals released to indoor air? Environ. Sci. Technol. 53, 11276–11284. doi: 10.1021/acs.est.9b02036
Li, L., Hoang, C., Arnot, J. A., and Wania, F. (2020). Clarifying temporal trend variability in human biomonitoring of polybrominated diphenyl ethers through mechanistic modeling. Environ. Sci. Technol. 54, 166–175. doi: 10.1021/acs.est.9b04130
Logue, J. M., Small, M. J., Stern, D., Maranche, J., and Robinson, A. L. (2010). Spatial Variation in Ambient Air Toxics Concentrations and Health Risks between Industrial-Influenced, Urban, and Rural Sites. J. Air Waste Manage. Assoc. 60, 271–286. doi: 10.3155/1047-3289.60.3.271
Lu, F. C. (1988). Acceptable daily intake: Inception, evolution, and application. Regul. Toxicol. Pharmacol. 8, 45–60. doi: 10.1016/0273-2300(88)90006-2
MacIntosh, D. L., Spengler, J. D., Ozkaynak, H., Tsai, L., and Ryan, P. B. (1996). Dietary exposures to selected metals and pesticides. Environ. Health Perspect. 104, 202–209. doi: 10.1289/ehp.96104202
Mansouri, K., Grulke, C. M., Judson, R. S., and Williams, A. J. (2018). OPERA models for predicting physicochemical properties and environmental fate endpoints. J. Cheminform. 10:10. doi: 10.1186/s13321-018-0263-1
McGill, A. E., Robinson, J., and Stein, M. (1972). Methods of estimating dietary exposure of the general population to organochlorine insecticide residues: diet analyses 1965-1967. J. Assoc. Off. Anal. Chem. 55, 1245–1258. doi: 10.1093/jaoac/55.6.1245
Mennis, J. L., and Jordan, L. (2005). The distribution of environmental equity: exploring spatial nonstationarity in multivariate models of air toxic releases. Ann. Assoc. Am. Geograph. 95, 249–268. doi: 10.1111/j.1467-8306.2005.00459.x
National Center for Health Statistics (2020). National Health and Nutrition Examination Survey Data. Hyattsville, MD: U.S. Department of Health and Human Services, Centers for Disease Control and Prevention. Available online at: https://wwwn.cdc.gov/nchs/nhanes/
Nowak, D. J., and Greenfield, E. J. (2012). Tree and impervious cover in the United States. Landsc. Urban Plan. 107, 21–30. doi: 10.1016/j.landurbplan.2012.04.005
Papa, E., van der Wal, L., Arnot, J. A., and Gramatica, P. (2014). Metabolic biotransformation half-lives in fish: QSAR modeling and consensus analysis. Sci. Total Environ. 470–471, 1040–1046. doi: 10.1016/j.scitotenv.2013.10.068
Piccinini, F., Polidori, D. C., Gower, B. A., and Bergman, R. N. (2017). Hepatic but not extrahepatic insulin clearance is lower in African American than in European American women. Diabetes 66, 2564–2570. doi: 10.2337/db17-0413
Rosenbaum, R. K., Bachmann, T. M., Gold, L. S., Huijbregts, M. A. J., Jolliet, O., Juraske, R., et al. (2008). USEtox—the UNEP-SETAC toxicity model: recommended characterisation factors for human toxicity and freshwater ecotoxicity in life cycle impact assessment. Int. J. Life Cycle Assess. 13:532. doi: 10.1007/s11367-008-0038-4
Rosenbaum, R. K., Huijbregts, M. A. J., Henderson, A. D., Margni, M., McKone, T. E., Meent, D., et al. (2011). USEtox human exposure and toxicity factors for comparative assessment of toxic emissions in life cycle analysis: sensitivity to key chemical properties. Int. J. Life Cycle Assess. 16, 710–727. doi: 10.1007/s11367-011-0316-4
Shen, L., and Wania, F. (2005). Compilation, evaluation, and selection of physical–chemical property data for organochlorine pesticides. J. Chem. Eng. Data. 50, 742–768. doi: 10.1021/je049693f
Shikany, J. M., Safford, M. M., Newby, P. K., Durant, R. W., Brown, T. M., and Judd, S. E. (2015). Southern dietary pattern is associated with hazard of acute coronary heart disease in the Reasons for Geographic and Racial Differences in Stroke (REGARDS) study. Circulation 132, 804–814. doi: 10.1161/CIRCULATIONAHA.114.014421
Spivakovsky, C. M., Logan, J. A., Montzka, S. A., Balkanski, Y. J., Foreman-Fowler, M., Jones, D. B. A., et al. (2000). Three-dimensional climatological distribution of tropospheric OH: update and evaluation. J. Geophys. Res. 105, 8931–8980. doi: 10.1029/1999JD901006
Tessum, C. W., Marshall, J. D., and Hill, J. D. (2012). A spatially and temporally explicit life cycle inventory of air pollutants from gasoline and ethanol in the United States. Environ. Sci. Technol. 46, 11408–11417. doi: 10.1021/es3010514
U.S. Census Bureau (2020a). Current Population Survey, Annual Social and Economic Supplement, 2019. Available at: https://www.census.gov/programs-surveys/cps.html (accessed September 17, 2020).
U.S. Census Bureau (2020b). Population Clock. Available online at: https://www.census.gov/popclock/ (accessed October 15, 2020).
Ugidos-Rodríguez, S., Matallana-González, M. C., and Sánchez-Mata, M. C. (2018). Lactose malabsorption and intolerance: a review. Food Funct. 9, 4056–4068. doi: 10.1039/C8FO00555A
Undeman, E., Brown, T. N., Wania, F., and McLachlan, M. S. (2010). susceptibility of human populations to environmental exposure to organic contaminants. Environ. Sci. Technol. 44, 6249–6255. doi: 10.1021/es1009339
US CDC (2019). National Notifiable Diseases Surveillance System, 2018 Annual Tables of Infectious Disease Data. Atlanta, GA: CDC Division of Health Informatics and Surveillance Available online at: https://wonder.cdc.gov/nndss/static/2018/annual/2018-table1.html (accessed March 22, 2021).
US Census Bureau (2018). State Area Measurements and Internal Point Coordinates. The United States Census Bureau. Available online at: https://www.census.gov/geographies/reference-files/2010/geo/state-area.html (accessed December 19, 2020).
Wannaz, C., Fantke, P., and Jolliet, O. (2018). Multiscale Spatial Modeling of Human Exposure from Local Sources to Global Intake | Environmental Science & Technology. Available online at: https://pubs.acs.org/doi/10.1021/acs.est.7b05099 (accessed June 14, 2019). doi: 10.1021/acs.est.7b05099
Wegener Sleeswijk, A., and Heijungs, R. (2010). GLOBOX: a spatially differentiated global fate, intake and effect model for toxicity assessment in LCA. Sci. Total Environ. 408, 2817–2832. doi: 10.1016/j.scitotenv.2010.02.044
Keywords: human health, inter-individual variability, exposure, suscepibility, life cycle impact assessment, chemical
Citation: Li L and Li D (2021) Inter-Individual Variability and Non-linear Dose-Response Relationship in Assessing Human Health Impact From Chemicals in LCA: Addressing Uncertainties in Exposure and Toxicological Susceptibility. Front. Sustain. 2:648138. doi: 10.3389/frsus.2021.648138
Received: 31 December 2020; Accepted: 11 March 2021;
Published: 06 April 2021.
Edited by:
Reinout Heijungs, Vrije Universiteit Amsterdam, NetherlandsReviewed by:
Mikołaj Owsianiak, Technical University of Denmark, DenmarkLei Huang, University of Michigan, United States
Copyright © 2021 Li and Li. This is an open-access article distributed under the terms of the Creative Commons Attribution License (CC BY). The use, distribution or reproduction in other forums is permitted, provided the original author(s) and the copyright owner(s) are credited and that the original publication in this journal is cited, in accordance with accepted academic practice. No use, distribution or reproduction is permitted which does not comply with these terms.
*Correspondence: Dingsheng Li, ZGluZ3NoZW5nbEB1bnIuZWR1