 Viktor Pirmana1,2*
 Armida Salsiah Alisjahbana2,3Arief Anshory Yusuf2,3Rutger Hoekstra1,4
 Arnold Tukker1,5
- 1Institute of Environmental Sciences (CML), Leiden University, Leiden, Netherlands
- 2Department of Economics, Faculty of Economics and Business, Padjadjaran University, Sumedang, Indonesia
- 3Center for Sustainable Development Goals Studies, Padjadjaran University, Sumedang, Indonesia
- 4MetricsForTheFuture.com, Leiderdorp, Netherlands
- 5Netherlands Organization for Applied Scientific Research TNO, The Hague, Netherlands
Reducing environmental costs is a significant concern for Indonesia's future. This paper explores Indonesia's environmental costs from emissions and forest resources and identifies the priority sectors in terms of economic and environmental performance. We use environmentally extended input–output analysis for calculating the environmental costs and further extension with linkages analysis to identify the priority sectors. The study finds that the total environmental costs of emissions due to final demand is around 7% of the GDP. This environmental cost is significantly due to domestic products with household consumption being the largest contributor. The top 10 sectors in the Indonesian economy are responsible for about 70% of the total environmental costs of emissions. Based on pollutant source, SOx, NOx, CO2, and CH4 contribute more than half of emissions' ecological costs. We also find that forest resources' environmental cost is only 7.5% of the total environmental cost. Last, this study finds that key sectors of economic and sustainability points of view are textile manufacturing; publishing, printing, and reproduction of recorded media; chemicals n.e.c.; manufacture of other non-metallic mineral products; construction; and other land transport. Finally, this paper discusses the policy options for Indonesia to promote sustainable consumption and production in terms of reducing environmental costs while managing economic development.
Introduction
Environmental issues, for the first time, began to garner global attention at the Stockholm United Nations Conference on the Environment in Sweden in 1972. The conference, known as the Stockholm Conference, is the first international conference to discuss the environment as a major issue in response to various cases of environmental damage that are increasingly widespread and threatening the life of the world. Furthermore, in 1987, the World Commission on Environment and Development submitted its report titled “Our Common Future,” also known as the Brundtland report, which became a milestone for the concept of sustainable development (Borowy, 2014).
Since the publication, the concept of sustainable development has become a popular discourse. Attention at the world level toward sustainable development continues to increase, most recently with the UN Sustainable Development Summit in September 2015 in New York in the United States. At that conference, all the countries jointly adopted the new development agenda “Transforming Our World: the 2030 Agenda for Sustainable Development,” better known as sustainable development goals (SDGs), which include 17 goals with a total of 241 achievement indicators. Of the 17 goals, one of the SDGs is the 12th goal, namely, responsible consumption and production. Goal 12 implies that all parties should endeavor, for example, not to use hazardous materials in consumption and production activities. Goal 12 can provide an example of how the interests of all countries are represented in the SDGs. The existence of international regulations and bilateral agreements that prohibit using specific materials in export and import activities is one concrete example. Therefore, many development goals in the SDGs should be interpreted as a shared global vision that represents the interests of all parties, including Indonesia (Alisjahbana et al., 2018).
Wackernagel and Beyers (2019) group Indonesia into countries experiencing bio-deficit conditions, i.e., having an ecological footprint1 exceeding its bio-capacity. As shown in Figure 1, Indonesia's bio-capacity decreases over time, and the ecological footprint tends to increase. Based on data for 2016 from the Global Footprint Network, the percentage of ecological footprint exceeding bio-capacity deficit reaches 32% or around 0.4 gha per capita. Today, Indonesia is one of the top 10 countries with the highest ecological footprint in the world along with China, India, the United States, Russia, Brazil, Japan, Germany, Mexico, and the United Kingdom (Pata et al., 2021).
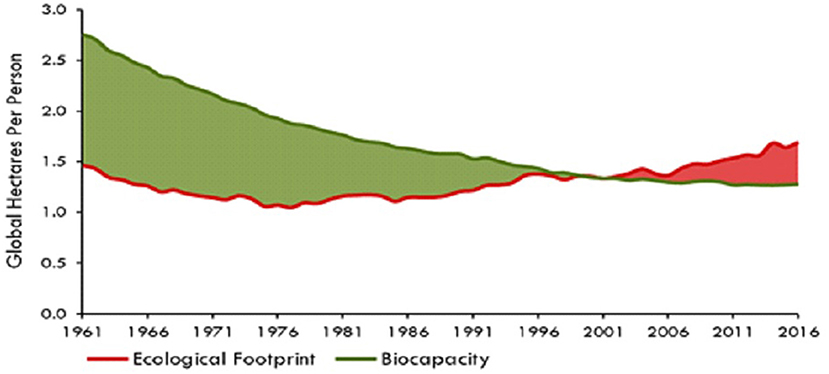
Figure 1. Ecological footprint and bio capacity trend in Indonesia. Source: Global Footprint Network, 2019, https://www.footprintnetwork.org/licenses/public-data-package-free/.
Numerous studies analyze factors affecting environmental deterioration due to increasing human activities. Danish et al. (2020) indicate that trends in economic progress accelerate the consumption and extraction of natural resources while increasing the ecological footprint. Hassan et al. (2018) underline that economic growth increases the need for natural resource use, which leads to environmental degradation in Pakistan. Other studies (e.g., Galli et al., 2012; Bello et al., 2018; Zall'e, 2018; Hanif et al., 2019; Pata, 2020) indicate similar results that environmental degradation might increase due to economic expansion. However, if sustainable development management practices are applied, the rate of resource depletion decreases, and resources are allowed to regenerate (Pata et al., 2021).
One option to reduce pressure related to environmental degradation and resource use is adjusting consumption patterns and shifting production toward more environmentally friendly sectors and technologies. According to Wiedmann et al. (2007), Watson et al. (2013), Peters et al. (2016), Tukker and Vivanco (2018), and Wiedmann and Lenzen (2018), environmental impacts from the economic system can be viewed from two complementary perspectives: production and consumption. The production perspective considers the direct environmental pressures caused by economic activities in a country. The consumption perspective focuses on the indirect environmental pressures driven along value chains by a country's final demand.
In the past decades, various studies discuss the environmental impact of both perspectives of production and consumption; see for instance Haas et al. (2005), Tukker et al. (2006), Tukker and Jansen (2006), Weisz and Schandl (2008), United Nations Environment Programme (2010, 2015), Jungbluth et al. (2011), Kitzes et al. (2007), Akenji and Bengtsson (2014), Ivanova et al. (2016), and Castellani et al. (2019).
This paper aims to provide a comprehensive analysis of Indonesia's environmental costs. This paper also tries to identify key sectors where economic and environmental performance are considered. Specifically, this study aims to answer the following questions: (i) How much are the environmental costs for each final demand component? (ii) How much is the ratio of environmental costs to value added by the economic sector? (iii) Which sectors and emissions are most responsible for pressures driven by final demand? (iv) How much is the value of environmental costs embodied in import due to final demand? (v) What are the economic sectors that perform best when both economic performance and environmental costs are considered simultaneously?
In answering these questions, we use the input–output (IO) analysis approach. This approach can link, in a comprehensive way, how consumption via value chains drives production and, in turn, emissions, resource use, and related external environmental costs or so-called “external cost” (Miller and Blair, 2009; United Nations Environment Programme, 2010, 2015; Jungbluth et al., 2011; Akenji and Bengtsson, 2014).
The paper is structured as follows: section IO Tables and Environmental Cost Accounting for Indonesia reviews [environmentally extended (EE)] IO studies for Indonesia and related environmental cost accounts. Section Methodology describes in more detail the methodology used in this study to answer the research questions. Section Results provides the results. Section Conclusion and Recommendation ends with the conclusion and policy considerations.
IO Tables and Environmental Cost Accounting for Indonesia
Indonesia's Central Bureau of Statistics has published IO tables for various years between 1971 and 2010 (see Appendix Table 1). In this study, we use the latest published IO table, the Indonesian IO table 2010. We realize that this IO database seems to be outdated; we decided to use this database with the following considerations:
(i) In analyzing the economic and environmental impacts from the production and consumption perspectives in detail, theory and empirical studies suggest using life cycle analysis or IO models.
(ii) The IO can be expanded to EE IO. IO tables, to our knowledge, contain comprehensive and detailed data not found in other databases, such as economic structure, sectoral added value, distribution of goods and services, and sectoral export-import structure.
(iii) During the 2010–2020 period, the sectoral contribution to the economy in Indonesia remained unchanged, and it is still dominated by three sectors: manufacturing; agriculture, fishery, and forestry; and wholesale and retail trade, car and motorcycle repair.
Based on these considerations, we conclude that, even though the data is outdated, they are still relevant to current conditions in Indonesia and have practical significance for today's policymaking.
There are no publications from official sources in Indonesia that present detailed information on resource extraction, emissions, and related external cost data by economic sector. To our knowledge, Pirmana et al. (2021) provide the first detailed description of environmental costs for each economic sector. Information on extraction of non-renewable resources and forestry products, including their external cost, can be obtained from Indonesian sources. Emissions by sector are, however, not available from Indonesian sources. Pirmana et al. (2021), therefore, utilize emission estimates for each sector in Indonesia provided in the Global Multi-regional Environmentally Extended Input-Output (GMRIO) database EXIOBASE (Stadler et al., 2018). By creating a common classification of 86 sectors between the 163 sectors of EXIOBASE and the 185 sectors of the Indonesian IO table (IIOT) and some other conversions, emissions for 86 sectors in Indonesia can be estimated. Pirmana et al. (2021) also estimate the external costs of these emissions based on the concept of damage costs related to human health and the environment.
This approach resulted in an EE IOT for Indonesia including extensions (E) and external costs (P) by sector (Figure 2), which was placed on the n + 1 line of the aggregated 86-sector version of the IIOT as an extension (outside the system of the goods/services flow matrix, where n is the number of sectors).
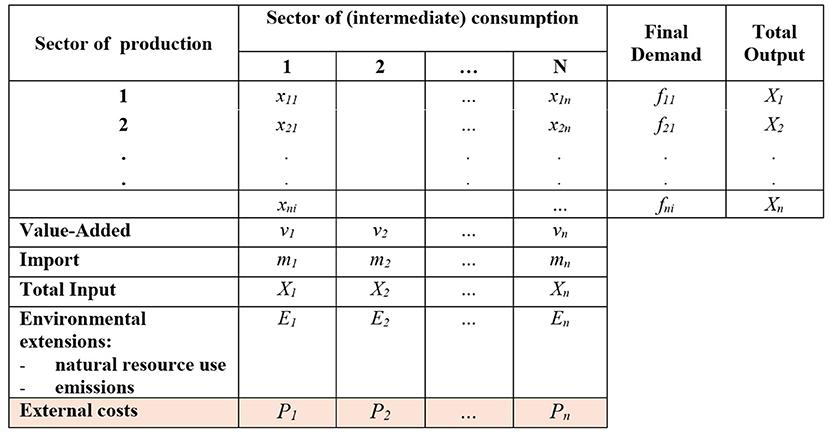
Figure 2. Structure of the Indonesian environmentally extended input-output table.
Methodology
Leontief Approach to Calculate Consumption-Based External Costs
As indicated in the previous section, EEIO is used to calculate the environmental costs driven by various components of final demand in Indonesia. The components are household consumption, consumption of non-profit institutions, government consumption, gross fixed capital formation, and exports (see Appendix Table 2 for detail).
We decided to limit ourselves to the external costs from emissions and the forestry sector and not to include non-renewable resource extraction.
The basic IO relationship developed by Leontief gives the relationship between the total output x and final demand y (Miller and Blair, 2009; Brolinson et al., 2010) by the following formula:
where (I − A)−1Y is the inverse matrix or so-called Leontief matrix. Final demand Y consists of several constituent components: consumption vector (C); fixed capital formation vector (K); and E and M, which are export and import vectors, respectively. Therefore, Equation (1) can also be written as follows:
By applying an environmental coefficient matrix F (environmental cost per unit of economic output) on Equation (1), the total environmental cost E can be calculated. This is shown in Equation (3) as follows:
To assess the environmental costs embodied in imported products, various approaches can be followed. In the ideal case, one would use a GMRIO, such as EXIOBASE, GTAP, or EORA (Tukker and Dietzenbacher, 2013; Wood et al., 2019) to estimate the emissions and resource use embodied in Indonesian imports. However, none of the available GMRIOs include external cost estimates for these emissions and resource uses. Trying to develop such external costs for the many countries included in such GMRIOs falls outside the scope of this paper. Therefore, we fall back on a simplifying assumption called the domestic technology assumption despite the fact that this can lead to less accurate results (e.g., Tukker et al., 2013). We estimate data on the import IO coefficient matrix (direct import requirements) from total IO transaction data minus domestic transaction IO data. Because, as we show later, the externalities in imports are relatively small compared with the externalities in domestic production, our approach still is a reasonable proxy of reality. Based on this approach, we can modify the input coefficient matrix A in Equations (1) and (2) by creating a direct import requirement matrix:
where Ad represents the direct domestic requirement (domestic IO coefficient matrix), Am is the direct import requirement (import IO coefficient matrix), and Atot is the direct total requirement (total IO coefficient matrix). Likewise, to obtain the total final demand, we can add final demand for domestic and imported products:
To calculate environmental costs associated with final demand, Equation (3) then can be rewritten:
To assess the embodied environmental cost from imported products, the above equation can be rewritten in such a way that the domestic technology assumption is made explicit by replacing Atot and Ytot by their domestic and import shares:
Based on the above equation, we can calculate the environmental impacts from the consumption-based accounting of air pollutant discharge for each final demand category and from both domestic or imported sources.
Prioritizing Sectors Based on Economic and Environmental Performance
It is essential to identify priority sectors when economic and environmental performance are taken into account. This identification of priority sectors is approached with a linkage analysis between sectors or what is commonly known as backward and forward linkages (Sonis et al., 2000; Dietzenbacher, 2002; Shmelev, 2010; Nguyen, 2018; Peng et al., 2020).
This study identifies the key sectors from an economic view by calculating an index of backward and forward linkages of economic sectors' value added. The formula to estimate these backward and forward linkages is as follows:
where and are the ith row and jth column elements of the matrix (I-Ad)−1 and (I-Bd)−1, respectively. We can standardize the BLj and FLj to obtain the unified backward linkage (UBL) and forward linkage (UFL) into the following equations:
The key sectors in the economy are the sectors that have a backward and forward linkage index higher than one, which are sectors with high potential to drive value-added growth in the upstream and downstream sectors. From an economic view, policies aimed at influencing the amount of economic output are sufficiently focused on these key sectors so that the government can save the development costs.
By adopting Equations (10) and (11), we can formulate an index of the backward and forward linkage of emissions and forest resources' environmental costs as follows (Peng et al., 2020):
where BLE is the adjusted backward linkage of the environmental cost, FLE is the forward linkage of the environmental cost, and EI is environmental cost intensity. If this index is >1, this implies that this sector has a greater influence than other sectors on increasing air pollution and related environmental costs in its upstream/downstream sectors. Based on the linkage indices for value added and environmental costs, we can identify four classes of sectors with different relevance for economic and sustainability policies as follows:
(i) Encouraged sectors: sectors with high linkages for value added and low linkages for external costs—sectors that should be stimulated by policy from a sustainability and economic point of view.
(ii) Slightly encouraged sectors: sectors with high value-added linkages, characterized mainly by low linkages in external costs.
(iii) Slightly constrained sectors: sectors characterized mainly by low linkages for value added and high linkages in external costs
(iv) Constrained sectors: sectors with low linkages for value added and high linkages for external costs—sectors that are no priority for economic stimulation.
The detailed classification of the economic sectors in terms of potential for reducing environmental costs is summarized in Table 1.
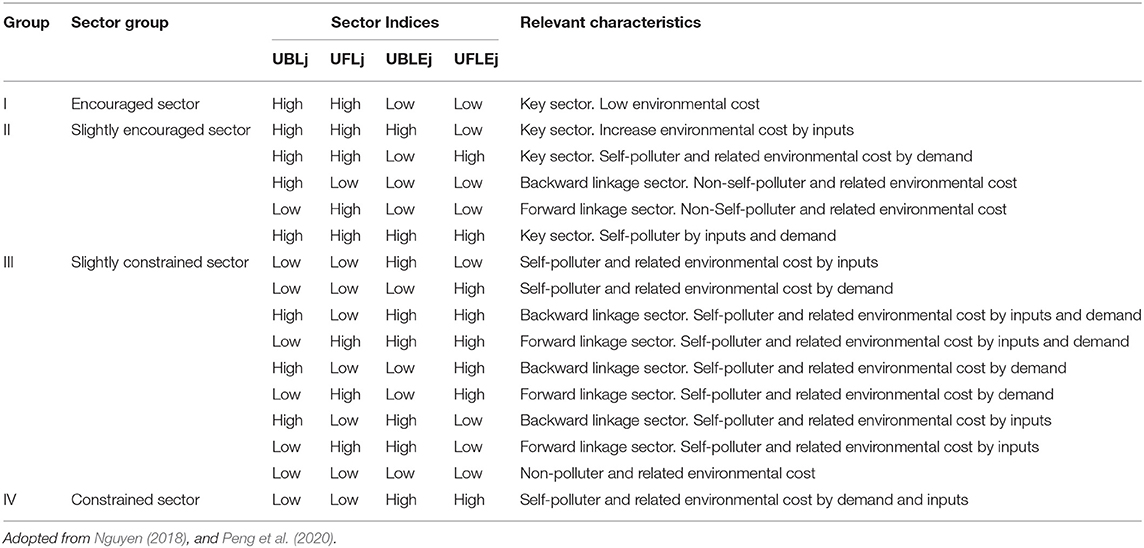
Table 1. Classification of sectors in terms of the potential of environmental cost reduction.
Results
Environmental Costs Driven by Indonesian Final Demand
This first results section analyzes environmental cost induced by final demand in Indonesia. We discuss environmental costs of emissions (Environmental Cost From Emissions Driven by Indonesian Final Demand), forestry resources (Environmental Costs of Forest Resources Driven by Indonesian Final Demand), and total consumption-based environmental costs and the ratio of environmental costs of value added by consumption category (Total Environmental Costs/Value Added Driven by Indonesian Final Demand and Comparison With Value-Added Creation).
Environmental Cost From Emissions Driven by Indonesian Final Demand
Table 2 shows the total environmental costs of emissions resulting from Indonesia's final demand in 2010, which amounted to Rp. 449.41 trillion. Most of this environmental cost value comes from domestic production of final demand of Rp. 419.55 trillion (93.4%) while the environmental cost from import sources is only around Rp. 29.86 trillion (6.6%). According to the final demand component, both domestic and imported household consumption is the largest contributor to the total environmental cost created in the economy, amounting to Rp. 196.26 trillion (43.67%), followed by environmental costs from the gross fixed capital formation of Rp 124.07 trillion (27.6%), and export of Rp. 101.81 (22.7%).
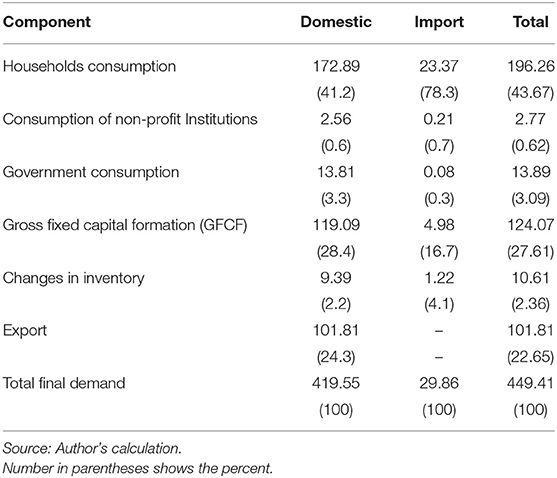
Table 2. Environmental cost from emission due to final demand in Indonesia (Trillion Rp).
Tables 3, 4 show the product environmental costs from emissions by final demand category. Driven by final demand, the top 10 sectors are responsible for ~70.4% of the total environmental costs of emissions. Almost 50% of the total environmental cost of these emissions comes only from the top five sectors. Manufacture of basic iron and steel and of ferro-alloys and first products thereof is the sector with the highest environmental costs, amounting to Rp. 70.50 trillion (15.7%). Furthermore, in second place is the electricity sector with an environmental cost value of Rp. 53.95 trillion (12%), followed by the sea and coastal water transport sector amounting to Rp. 31.62 trillion (7%); manufacture of rubber and plastic products of Rp. 30.98 trillion (6.9%); and the fifth position is coal mining, lignite, and extraction of peat amounting to Rp. 30 trillion (6.7%).
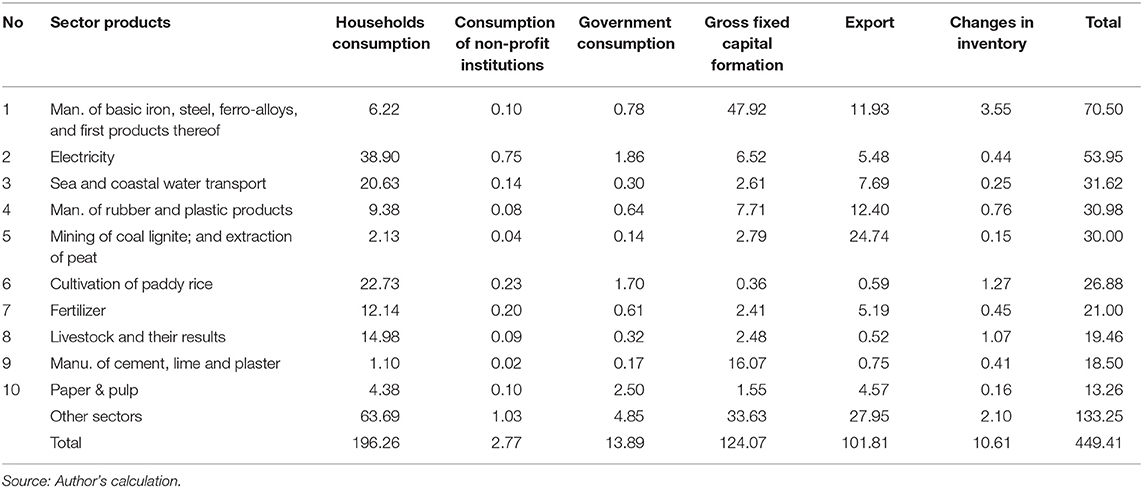
Table 3. Top 10 total environmental costs from emissions by sector in Indonesia in 2010 (Trillion Rp).
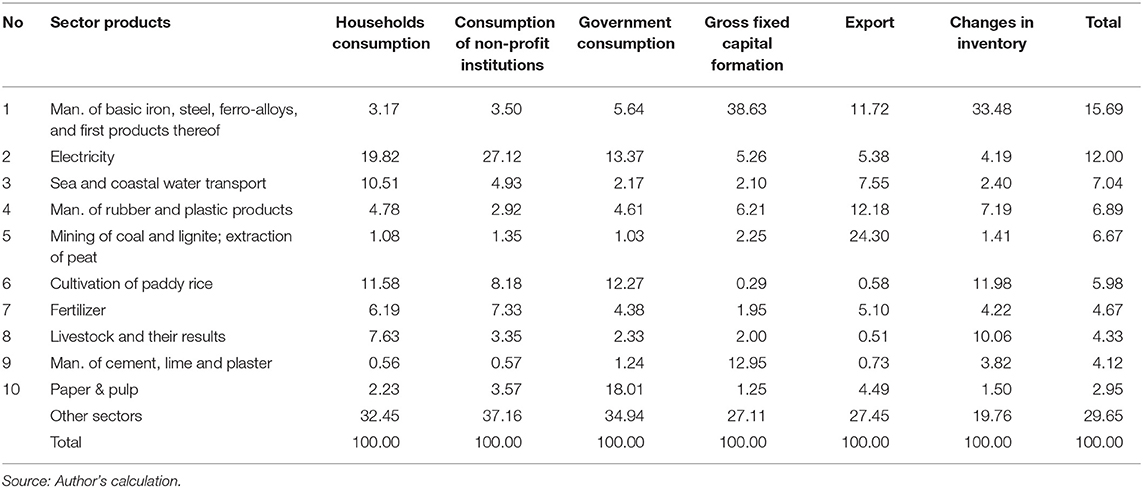
Table 4. Top 10 of total environmental cost from emissions by sector in Indonesia in 2010 (percent).
SOx, NOx, and the greenhouse gases CO2 and CH4 contribute to more than 50% of the external costs. Also, here we see that emissions within Indonesia are the most important; only CO2 and the contribution of imports to external costs is slightly more than 10% (see Appendix Tables 5–8 for details). We see furthermore that, for most emissions, there is no major difference in how the type of final demand drives contribution to external costs. For SOx, we see that government consumption and exports has somewhat higher than average external costs compared to total final demand, whereas for lead, this is the case for gross fixed capital formation.
Environmental Costs of Forest Resources Driven by Indonesian Final Demand
Pirmana et al. (2021) estimate that the environmental costs derived from forest resources in 2010 in Indonesia are Rp. 61.45 trillion, caused by the depletion of forest resources (wood resources) of 33.09 trillion (including conversions and damages), from the loss of eco-services value from the tropical forest of Rp. 28.35 trillion, and those caused by domestic emissions of Rp. 22.94 billion; meanwhile, from this study, including emissions from import activities, it becomes Rp. 25.4 billion.
This study attempts to trace the environmental costs of these forest resources from a consumption perspective. The estimation results may be overestimated because it only accumulates in the forestry, logging, and related service activities sector. This situation occurs because the responsibility for conversion and damage to forest resources may also be caused by activities in other sectors, such as sector groups in plantations and agriculture.
After the calculation and analysis of environmental costs originating from emissions in the previous section, which includes those from the forestry sector, Table 5 shows the results of the estimated calculation of environmental costs from timber resources from the consumption perspective. Total environmental costs of timber resources reach Rp. 36.66 trillion. Gross fixed capital formation and household consumption and export are final demand components with the highest environmental cost, each amounting to Rp. 18.02 trillion (49.2%) and Rp. 9.79 trillion (26.7%), and from export around Rp. 6.51 trillion (17.8%).
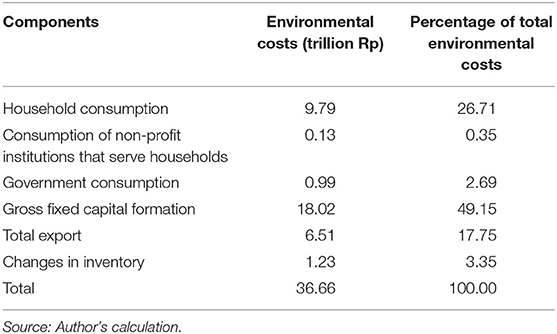
Table 5. The environmental cost of timber resources due to final demand in Indonesia in 2010 (Trillion Rp).
Total Environmental Costs/Value Added Driven by Indonesian Final Demand and Comparison With Value-Added Creation
In this section, we combine the external costs from emissions and the use of forestry resources driven by Indonesian final demand (see Table 6). The total environmental cost from a consumption perspective is 486.04 trillion with details of environmental costs originating from emissions amounting to 449.39 (92.5%) and environmental costs derived from forest resources of 36.66 trillion (7.5%). The external costs related to forest resources are fully allocated to consumption of forestry products. This leads to a total environmental cost from a consumption perspective for forestry products of Rp. 36.66 trillion2 of which the costs related to timber resources is Rp. 36.63 trillion (99.9%) and the costs related to emissions created in the value chain of forestry products is only Rp. 25.4 billion (0.07%).
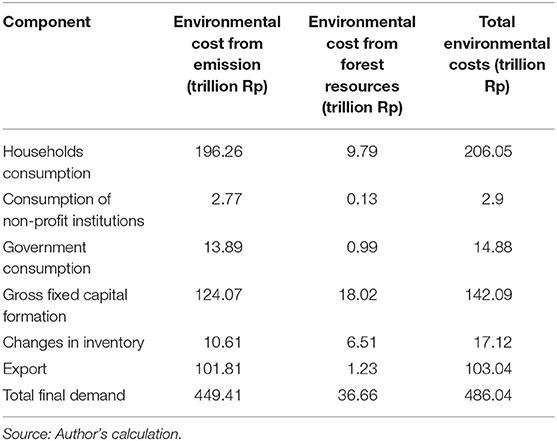
Table 6. Total environmental costs due to final demand in Indonesia in 2010 (Trillion Rp).
We also calculated the ratio of total environmental costs, a combination of environmental costs from emission and forest resources as a fraction of added value in Indonesia in 2010. This ratio appeared to be 0.07. Table 7 shows the top 10 sectors with the highest ratio in Indonesia in 2010. The table shows that the environmental costs of emissions resulting from the consumption of products in these 10 sectors have a greater value than value added (except electricity). The fact that total environmental costs exceed value added implies that, if the national accounts had included air pollution's external costs, these production outputs would create a negative value added (Pirmana et al., 2021).
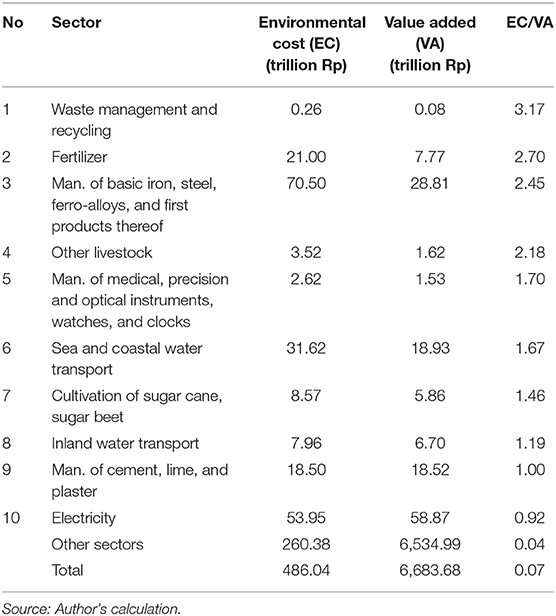
Table 7. Top 10 ratio of total environmental cost compared to value added.
The waste management and recycling sector is the sector with the highest ratio with a ratio of 3.17. This means that the environmental cost contained in this sector is 3.17 times greater than its value added. The second position was fertilizer with a ratio value of 2.70, followed by products from manufacture of basic iron, steel, ferro-alloys, and first products thereof (2.45); other livestock products (2.18); and products from manufacture of medical, precision, and optical instruments, watches, and clocks with a ratio of 1.70. Meanwhile, the other five products in the top 10 group has ratios between 0.92 and 1.67.
Priority Sector Based on Linkage Analysis
Using the method discussed in section Prioritizing Sectors Based on Economic and Environmental Performance, Table 8 shows a calculation of forward and backward linkages for value added as environmental costs. As suggested in section Prioritizing Sectors Based on Economic and Environmental Performance, sectors are classified into four groups: (i) encouraged sectors; (ii) slightly encouraged sectors; (iii) slightly discouraged sectors, and (iv) discouraged sectors. Of the 86 sectors, six are classified as encouraged sectors, 42 as slightly encouraged sectors, 34 as slightly constrained sectors, and four are grouped as constrained sectors (see Appendix Table 9 for detailed results). From a policy perspective, the following categories are most relevant:
(i) Encouraged sectors. These include manufacture of textile; publishing, printing, and reproduction of recorded media; chemicals; manufacture of other non-metallic mineral products; construction; and other land transport. Stimulation of economic activity in these sectors, hence, has a more than proportional positive impact on Indonesian economic development with a less than proportional rise of external costs.
(ii) Constrained sectors. Apart from not having a significant pulling and pushing effect on the development of other sectors, these sectors' activities also have a significant negative impact on environmental damage. Sectors included in the constrained sectors are the cultivation of sugar cane and sugar beet, other livestock, raw milk, and inland water transport. These sectors, hence, seem less of a priority for stimulation from an economic and environmental perspective.
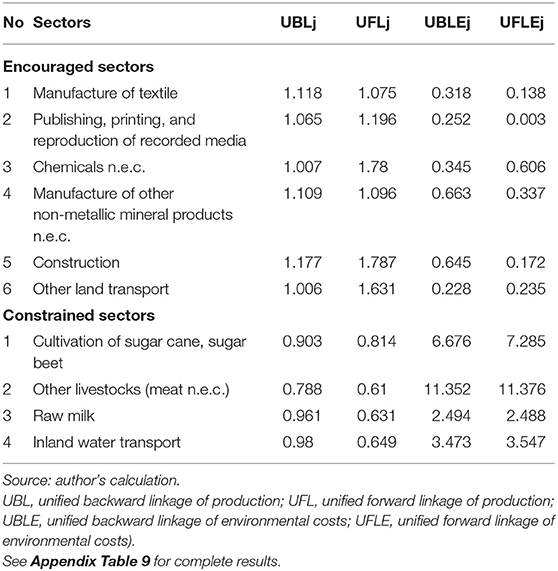
Table 8. Classification of sectors in the Indonesian economy, 2010, in terms of the potential of environmental costs reduction.
Conclusion and Recommendation
This paper is an initial attempt to provide an overview of the environmental cost of emissions and the associated environmental cost of forest resources from a consumption perspective and Indonesia's priority sectors when economic and environmental performance is considered. These study results can be used as a guide for policymakers in formulating sustainable development policies, especially in sustainable consumption and production policies.
We found that the total environmental cost from emissions due to the final demand is around 7.3% of the GDP. The environmental cost of emissions mostly comes from domestically produced final consumption with household consumption as the largest contributor to total emissions environmental costs.
This study also found that, driven by final demand, the top five sectors account for nearly half of the environmental costs of emissions. These sectors are manufacturing basic iron and steel and iron alloys and their first products; electricity; sea and coastal water transportation; manufacture of rubber and plastic products; and coal mining, lignite, and peat extraction. Efforts to reduce Indonesia's emission environmental costs should focus on these sectors.
SOx, NOx, CO2, and CH4 are the main contributors to Indonesia's environmental costs based on pollutant sources. Strategies to reduce environmental costs from emissions can be focused on these four pollutant sources. The results further show that, for most emissions, there are no significant differences in how the types of final demand drive contribute to environmental costs.
Regarding the environmental costs to value added ratio, nine sectors have a higher environmental cost value than their value added with waste management and recycling being the sectors with the highest environmental cost to value added ratio. Meanwhile, the total environmental costs derived from forest resources are about 7.54% of the total environmental cost.
Finally, the results from linkage analysis pointed out that key sectors for Indonesia from a sustainability and economic point of view (encouraged sectors) are manufacture of textile; publishing, printing, and reproduction of recorded media; chemicals n.e.c.; manufacture of other non-metallic mineral products n.e.c.; construction; and other land transport.
Based on the study findings, to reduce environmental costs and shift to more sustainable consumption and production, the following policy options and instruments can be considered by policymakers:
▪ Change consumer behavior. There are three different ways to influence consumer behavior. First, raise consumer awareness via mandatory or voluntary labeling schemes, information campaigns, information websites, and eco-benchmarking tools. Second, make sustainable consumption easy by providing attractive offers to consumers and limit the range of non-sustainable products on the market. Third, green the market by improving products' environmental performance, prohibiting products with a harmful environmental performance, and increasing the market share of environmentally friendly products.
▪ Adopt a green public procurements system. The government with large public funds can regularly behave as a sustainable consumer to procure public goods and services. The application of green public procurement benefits the government itself as a public organization, society, and the economy. On the other hand, the government plays a vital role in reducing negative impacts on the environment. The policy of a green public procurement system for a country like Indonesia that adheres to a decentralized system can be applied to relevant institutions at the central and local government levels. This policy determination can be combined with a fiscal decentralization policy (e.g., central government transfers to local governments for development funds).
▪ Stimulate the adoption of cleaner production. There is a wide range of economic and policy instruments that the government may use to promote cleaner production by raising the cost of harmful products or promoting more efficient use of natural resources. Policy instruments, such as taxes, subsidies, and other market-based instruments, can be applied for this purpose. The government can set regulations on carbon taxes for large polluters (primary audience: industry, consumers, and relevant departments) with the income invested to finance renewable energy, energy efficiency, and to compensate low-income households from subsidy instruments, for example, removing subsidies on products that promote unsustainable consumption and production patterns (e.g., fossil fuel subsidies). The tradable permit scheme is another policy instrument that can apply. A tradable permit scheme allows market participants to buy and sell permits to use or extract a certain amount of resources or emit a certain amount of a pollutant. Policymakers can use this kind of policy to fix environmental targets, such as maximum air emissions. This tradable permits scheme is especially applicable to large companies.
Last, from an economic point of view, sector development to increase value-added growth, besides focusing on key sectors with strong linkages to upstream and downstream sectors, can also be expanded to sectors that at least have a strong backward or forward linkage. The effective policy instruments to stimulate strong backward linkage sectors are demand-side policies. Otherwise, the supply side is expected to be more effective in targeting strong forward linkage sectors. Some examples of policy instruments that can be applied to stimulate targeted sectors include:
▪ Demand-side policies. Changing fiscal policies (via government expenditure or taxes) concerning specific consumer commodities, improvement of the attractiveness of specific areas (which includes the provision or improvements of industrial sites and public utilities)
▪ Supply-side policies. Subsidies to certain sector activities, small business grants, wage subsidies, privatization, and lower-income tax rates.
Data Availability Statement
The raw data supporting the conclusions of this article will be made available by the authors, without undue reservation.
Author Contributions
VP: conceptualization, methodology, validation, formal analysis, investigation, data curation, writing—original draft, and review and editing. AA: supervision, conceptualization, methodology, and review and editing. AY: validation and review and editing. RH: supervision, review and editing, and validation. AT: supervision, conceptualization, methodology, validation, and review and editing. All authors contributed to the article and approved the submitted version.
Funding
This research was funded by the Lembaga Pengelola Dana Pendidikan (LPDP), Grant No. PRJ-1461/LPDP.3/2016, Ministry of Finance, Republic of Indonesia. It is part of the VP scholarship at the Institute of Environmental Sciences (CML), Faculty of Science, Leiden University, Netherlands.
Conflict of Interest
The authors declare that the research was conducted in the absence of any commercial or financial relationships that could be construed as a potential conflict of interest.
Publisher's Note
All claims expressed in this article are solely those of the authors and do not necessarily represent those of their affiliated organizations, or those of the publisher, the editors and the reviewers. Any product that may be evaluated in this article, or claim that may be made by its manufacturer, is not guaranteed or endorsed by the publisher.
Supplementary Material
The Supplementary Material for this article can be found online at: https://www.frontiersin.org/articles/10.3389/frsus.2021.720177/full#supplementary-material
Footnotes
1. ^According to Monserrate et al. (2020), the ecological footprint is defined as the ecological impact caused by human activities. It is an aggregate indicator that helps individuals to understand both the direct and indirect impact of their actions on the planet.
2. ^Pirmana et al. (2021) include environmental costs from the loss of eco-services value from the tropical forest in calculating the forestry sector's environmental costs. In this study, we calculate environmental costs from a consumption perspective and do not include the environmental costs due to loss of eco-services value from the tropical forest.
References
Akenji, L., and Bengtsson, M. (2014). Making sustainable consumption and production the core of sustainable development goals. Sustainability 6, 513–529. doi: 10.3390/su6020513
Alisjahbana, A. S., Yusuf, A. A., Anna, Z., Kadarisman, A., Maulana, N., Larasati, W., et al. (2018). Menyongsong SDGs Kesiapan Daerah-daerah di Indonesia (2nd ed.). Bandung: Unpad Press.
Bello, M. O., Solarin, S. A., and Yen, Y. Y. (2018). The impact of electricity consumption on CO2 emission, carbon footprint, water footprint and ecological footprint: the role of hydropower in an emerging economy. J. Environ. Manag. 219, 218–230. doi: 10.1016/j.jenvman.2018.04.101
Borowy, I. (2014). Defining Sustainable Development for Our Common Future: A History of the World Commission Environment and Development [Brundtland Commission]. London: Routledge.
Brolinson, H., Sörme, L., Palm, V., Tukker, A., Hertwich, E., Wadeskog, A., et al. (2010). Methods to Assess Global Environmental Impacts From Swedish Consumption: Synthesis Report of Methods, Studies Performed and Future Development. Stockholm: Naturvårdsverket.
Castellani, V., Beylot, A., and Sala, S. (2019). Environmental impacts of household consumption in Europe: comparing process-based LCA and environmentally extended input-output analysis. J. Clean. Product. 240:117966. doi: 10.1016/j.jclepro.2019.117966
Danish Ulucak, R., and Klan, S. (2020). Determinants of the ecological footprint: role of renewable energy, natural resources, and urbanization. Sust. Cities Soc. 54, 101996. doi: 10.1016/j.scs.2019.101996
Dietzenbacher, E. (2002). Interregional multipliers: looking backward, looking forward. Reg. Stud. 36, 125–136. doi: 10.1080/00343400220121918
Galli, A., Kitzes, J., Niccolucci, V., Wackernagel, M., Wada, Y., and Marchettini, N. (2012). Assessing the global environmental consequences of economic growth through the ecological footprint: a focus on China and India. Ecol. Indicat. 17, 99–107. doi: 10.1016/j.ecolind.2011.04.022
Global Footprint Network. (2019). Free Public Data Set. Available online at: https://www.footprintnetwork.org/licenses/public-data-package-free/
Haas, G., Geier, U., Frieben, B., and Köpke, U. (2005). Estimation of Environmental Impact of Conversion to Organic Agriculture in Hamburg Using the Life-Cycle-Assessment Method. Institute of Organic Agriculture, University of Bonn. Available online at: http://orgprints.org/13935
Hanif, N., Arshed, N., and Aziz, O. (2019). On interaction of the energy: human capital Kuznets curve? A case for technology innovation. Environ. Dev. Sust. 22, 7559–7586. doi: 10.1007/s10668-019-00536-9
Hassan, S. T., Xia, E., Khan, N. H., Mohsin, S., and Shah, A. (2018). Economic growth, natural resources, and ecological footprints: evidence from Pakistan. Environ. Sci. Pollut. Control Ser. 26, 2929–2938. doi: 10.1007/s11356-018-3803-3
Ivanova, D., Stadler, K., Steen-Olsen, K., Wood, R., Vita, G., Tukker, A., et al. (2016). Environmental impact assessment of household consumption. J. Ind. Ecol. 20, 526–536. doi: 10.1111/jiec.12371
Jungbluth, N., Nathani, C., Stucki, M., and Leuenberger, M. (2011). Environmental Impacts of Swiss Consumption and Production: A Combination of Input-Output Analysis With Life Cycle Assessment. Bern: Environmental studies no.1111. ESU-services Ltd. & Rütter+Partner, commissioned by the Swiss Federal Office for the Environment (FOEN). Retrieved from: www.esu-services.ch/projects/ioa/or www.umwelt-schweiz.ch
Kitzes, J., Peller, A., Goldfinger, S., and Wackernagel, M. (2007). Current methods for calculating national ecological footprint accounts. Sci. Environ. Sust. Soc. 4, 1–8.
Miller, R. E., and Blair, P. D. (2009). Input-Output Analysis: Foundations and Extensions. Cambridge: Cambridge University Press. doi: 10.1017/CBO9780511626982
Monserrate, Z. M. A., Ruano, M. A., Ormeño-Candelario, V., and Sanchez-Loor, D. A. (2020). Global ecological footprint and spatial dependence between countries. J. Environ. Manage. 272:111069. doi: 10.1016/j.jenvman.2020.111069
Nguyen, H. T. (2018). Input-Output Analysis For Sustainable Economic-Environmental System Management in Vietnam. Osaka: Osaka University Knowledge Archive.
Pata, U. K. (2020). Renewable and non-renewable energy consumption, economic complexity, CO2 emissions and ecological footprint in the US: testing the EKC hypothesis with a structural break. Environ. Sci. Pollut. Control Ser. 28, 846–861. doi: 10.1007/s11356-020-10446-3
Pata, U. K., Aydin, M., and Ilham, H. (2021). Are natural resources abundance and human development a solution for environmental pressure? Evidence from top ten countries with the largest ecological footprint. Resourc. Policy 70:101923. doi: 10.1016/j.resourpol.2020.101923
Peng, J., Su, Y., Song, J., and Yang, W. (2020). Exploring potential pathways toward energy-related carbon emission reduction in heavy industrial regions of China: an input–output approach. Sustainablity 12:2148. doi: 10.3390/su12052148
Peters, G. P., Andrew, R. M., and Karstensen, J. (2016). Global Environmental Footprints: A Guide to Estimating, Interpreting and Using Consumption-Based Accounts of Resource Use and Environmental Impacts. Copenhagen: Nordic Council of Ministers. doi: 10.6027/TN2016-532
Pirmana, V., Alisjahbana, A. S., Yusuf, A. A., Hoekstra, R., and Tukker, A. (2021). Environmental costs assessment for improved environmental-economic account for Indonesia. J. Clean. Product. 280:124521. doi: 10.1016/j.jclepro.2020.124521
Shmelev, S. E. (2010). Environmentally Extended Input–Output Analysis of the UK Economy: Key Sector Analysis. QEH Working Paper Series-QEHWPS183. Oxford: University of Oxford.
Sonis, M., Hewings, G., and Guo, J. (2000). A new image of classical key sector analysis: minimum information decomposition of the leontief inverse. Econ. Syst. Res. 12, 401–423. doi: 10.1080/09535310050120952
Stadler, K., Wood, R., Bulavskaya, T., Södersten, C. J., Simas, M., Schmidt, S., et al. (2018). EXIOBASE 3: developing a time series of detailed environmentally extended multi-regional input-output tables. J. Ind. Ecol. 22, 502–515. doi: 10.1111/jiec.12715
Tukker, A., de Koning, A., Wood, R., Moll, S., and Bouwmeester, M. (2013). Price corrected domestic technology assumption—a method to assess pollution embodied in trade using primary official statistics only. with a case on CO2 emissions embodied in imports to Europe. Environ. Sci. Technol. 47, 1775–1783. doi: 10.1021/es303217f
Tukker, A., and Dietzenbacher, E. (2013). Global multiregional input–output frameworks: an introduction and outlook. Econ. Syst. Res. 25, 1–19. doi: 10.1080/09535314.2012.761179
Tukker, A., Huppes, G., Guinee, J., Heijungs, R., de Koning, A., van Oers, L., et al. (2006). Environmental Impact of Products (EIPRO). Analysis of the Life Cycle Environmental Impacts Related to the Final Consumption of the EU-25. Technical Report. Sevilla: JRC-IPTS, European Commission
Tukker, A., and Jansen, B. (2006). Environment impacts of products – a detailed review of studies. J. Indust. Ecol. 10, 159–182. doi: 10.1162/jiec.2006.10.3.159
Tukker, A., and Vivanco, D. F. (2018). “Input-output analysis and resource nexus assessment,” in Routledge Handbook of the Resource Nexus. eds. R. Bleischwitz, H. Hoff, C. Spataru, E. van der Voet, and S. D. VanDeveer (London: Routledge). doi: 10.4324/9781315560625-8
United Nations Environment Programme. (2010). Assessing the Environmental Impacts of Consumption and Production: Priority Products and Materials. Available online at: www.unep.org/resourcepanel/ documents/pdf/PriorityProductsandMaterials_Report_Full.pdf
United Nations Environment Programme. (2015). Sustainable Consumption and Production Global Edition: A Handbook for Policymakers. Available online at: https://sustainabledevelopment.un.org/content/documents/1951Sustainable%20Consumption.pdf
Wackernagel, M., and Beyers, B. (2019). Ecological Footprint – Managing our Biocapacity Budget. Gabriola Island, BC: New Society Publishers.
Watson, D., Acosta-Fernandez, J., Wittmer, G., and Pedersen, O. (2013). Environmental Pressures From European Consumption and Production. A Study in Integrated Environmental and Economic Analysis. EEA technical report 2/2013. Luxembor: Publications Office of the European Union
Weisz, H., and Schandl, H. (2008). Materials use across world regions. J. Indust. Ecol. 12:629–36. doi: 10.1111/j.1530-9290.2008.00097.x
Wiedmann, T., and Lenzen, M. (2018). Environmental and social footprints of international trade. Nat. Geosci. 11, 314–321. doi: 10.1038/s41561-018-0113-9
Wiedmann, T., Lenzen, M., Turner, K., and Barrett, J. (2007). Examining the global environmental impact of regional consumption activities — part 2: Review of input–output models for the assessment of environmental impacts embodied in trade. Ecol. Econ. 61, 15–26. doi: 10.1016/j.ecolecon.2006.12.003
Wood, R., Neuhoff, K., Moran, D., Simas, M., Grubb, M., and Stadler, K. (2019). The structure, drivers and policy implications of the European carbon footprint. Clim. Policy. 20, S39–S57. doi: 10.1080/14693062.2019.1639489
Keywords: environmental costs, sustainable consumption and production, emissions, environmentally-extended input-output, linkage analysis
Citation: Pirmana V, Alisjahbana AS, Yusuf AA, Hoekstra R and Tukker A (2021) Environmental Cost in Indonesia Spillover Effect Between Consumption and Production. Front. Sustain. 2:720177. doi: 10.3389/frsus.2021.720177
Received: 03 June 2021; Accepted: 12 August 2021;
Published: 20 September 2021.
Edited by:
Myriam Ertz, Université du Québec à Chicoutimi, CanadaReviewed by:
Shouheng Sun, Université du Québec à Chicoutimi, CanadaLucila De Almeida, Wageningen University and Research, Netherlands
Copyright © 2021 Pirmana, Alisjahbana, Yusuf, Hoekstra and Tukker. This is an open-access article distributed under the terms of the Creative Commons Attribution License (CC BY). The use, distribution or reproduction in other forums is permitted, provided the original author(s) and the copyright owner(s) are credited and that the original publication in this journal is cited, in accordance with accepted academic practice. No use, distribution or reproduction is permitted which does not comply with these terms.
*Correspondence: Viktor Pirmana, dmlrdG9yLnBpcm1hbmFAdW5wYWQuYWMuaWQ=