- 1Moss & Mollusk Consulting, Tampa, FL, United States
- 2Moss & Mollusk Consulting, Austin, TX, United States
- 3Circularity Informatics Laboratory, New Materials Institute, College of Engineering, University of Georgia, Athens, GA, United States
One important strategy to address plastic pollution is replacing disposable items with reusable ones and creating systems to support the circulation, cleaning and reuse of these items. The Global Landscape of Reusable Solutions was created to understand the evolution, current state, and potential environmental benefits of reuse and refill solutions being provided in nine distinct categories. The Landscape is a consistently updated dataset created through desktop research by researchers in seven geographic regions and engagement with experts around the world. As of June 10, 2022, the Landscape identified 1,196 solutions operating in 119 countries. The top three categories were 557 Package-Free Shops, 169 Reuse Advocacy Programs (excluding advocacy efforts by for-profit companies in the space), and 155 Reusable Cup and Container Programs. While 52 of the solutions in the global landscape are established or mature, 79.6% (952) are start-ups or small businesses (e.g., Package Free Shops with only one location). Europe has the largest number of reuse solutions with 441, and North America follows with 317. Barriers to growth for reuse solutions include solving for reusable item material and assortment, expanding and integrating reuse infrastructure, willingness of businesses to adopt reuse solutions amid concerns of impact on transaction speed and operations and acceptance by customers; and, in some locations, policies that restrict reusing and refilling containers. Adoption and scaling of reuse solutions can be supported by behavioral campaigns that normalize and promote reuse, better and more available data, sharing examples of successful systems, and increasing knowledge and understanding of reuse system design.
Introduction
Plastic pollution is already established as a pressing global issue. An estimated 11 million metric tons of plastics entered oceans in 2016, with most of the rest incinerated or landfilled (Lau, 2020). Plastics are found in all parts of the natural environment— from the deepest parts of the ocean (Peng et al., 2020) to the highest mountains (Napper et al., 2020), and even now in human blood (Leslie et al., 2022) and lungs (Pauly et al., 1998; Jenner et al., 2022). And plastic waste in our environment is just one part of the plastic pollution problem. Plastic production accounts for more than 3% of total U.S. energy consumption (DOE, 2022), and carbon emissions from plastic production will reach 17% of the global carbon budget by 2050 (Hamilton and Feit, 2019; Zheng and Suh, 2019).
Recycling systems are currently facing many challenges, especially related to recycling plastics. Only about 5% of the waste plastic in the United States was recycled in 2019, while 86% went to landfills (Milbrandtet al., 2022). Comprehensive modeling of all viable plastic leakage reduction strategies at their maximum realistic contribution found that recycling could only comprise 18% of the reduction of leakage of plastics by 2040, while new delivery models, reuse and reduction could represent as much as a 30% reduction (Lau, 2020).
Literature on reuse systems generally reflects the relatively new advent and spread of these systems, which are somewhat limited. A recent review of circular economy literature on plastics found that a high proportion of work focuses on the end-of-life phase, rather than examining design, production, use, or the value chain (Johansen, 2022). In calling for a more holistic view of plastics along the value chain, reuse systems are a key piece that can fill gaps and address needs for lightweight packaging while reducing overall footprints (Klemeš et al., 2021).
Waste hierarchies published by governmental (e.g., US EPA, European Commission, Thai Environmental Institute, etc). and nongovermental organizations (e.g., Zero Waste International Alliance, etc.) place Source Reduction/Prevention & Reuse at the top of the waste management hierarchy, followed by Recycling and Composting. Reuse is ranked above recycling in the “3Rs” as some life cycle assessment (LCA) findings show that reuse systems outperform single-use plastics in measures of environmental impact and bring other benefits, like reduction of waste and emissions (Hamade et al., 2020; Greenwood et al., 2021). Reuse and refill is a rapidly evolving space. However, this idea, that reusable products are always better than single-use plastics, comes with the caveat reusable products must actually be reused a certain number of times to achieve lesser greenhouse gas (GHG) emissions compared to disposable products (Miller, 2020). Other scholars have pointed out that GHG emissions are not the only measure of environmental impact that should be accounted for when drawing LCA boundaries to assess packaging options (Walker and McKay, 2021).
Though there is convergence among waste hierarchies in ranking prevention and reuse highest, recycling and composting have received high interest from corporations in addressing plastic pollution. For example, companies who have signed on to the Ellen MacArthur Foundation New Plastics Economy Global Commitment have committed to make all of their packaging recyclable, compostable or reusable by 2025, yet the evidence available to date shows that companies are leaning much more heavily on recycling and composting than reuse to achieve this goal (Ellen MacArthur Foundation., 2021). One reason companies are shying away from reuse may be that while consumers are driving the shift to reduce plastic consumption in the fast-moving consumer-good industry, their behavioral patterns are also viewed as an obstacle to change, according to a qualitative study of perceptions among industry leaders (Ma et al., 2020). Corporate commitments to reduce plastic waste entering the environment may use inconsistent definitions of the 3Rs, and concepts of reduction and reuse are mostly associated with recycling rather than redesign (Rhein and Schmid, 2020). As compostable plastics appear on more grocery shelves, the presence of both compostable and traditional plastics may lead to contaminated feedstocks in composting and recycling, and limits profitability, a necessary ingredient for expanding the availability of composting and recycling (Yesaya et al., 2021). With the goal of the circular economy to “slow, narrow, and close material resource loops”, switching from fossil fuels to biologically based resources alone may not provide a fundamental shift to sustainable and regenerative supply chains (Tan and Lamers, 2021).
Of particular note is the recent COVID-19 pandemic, where businesses turned to single-use take-out packaging as a way to manage during lockdowns (Charlebois et al., 2022). While reuse systems exist in some specific consumer markets (e.g. beer and soft drinks), reusable packaging solutions are more common in the business-to-business (B2B) space rather than business-to-consumer (B2C) markets (Coelho, 2020). An additional barrier is that consumers may be more willing to engage with familiar reuse systems rather than new innovation (Greenwood et al., 2021). A consumer study in the U.K. found that when given the choice to dispose, reuse, or recycle packaging that recycling was the preferred method of waste management (Greenwood et al., 2021). However, many large multinational companies have committed publicly to increase use of reusable packaging. The current global landscape of reusable solutions has not been well-documented, therefore, the objective of this work is to categorize the growing reuse sector and determine the number and types of reusable solutions around the world. In addition, we characterize how the market of reuse solutions is evolving, which solutions are thriving, and identify barriers and enablers to growth of reuse solutions.
Methods
A reuse solution is defined in this context as an activity that directly facilitates or encourages the use and circulation of reusable packaging and food ware for the same purpose for which it was created. This research focuses on formal reuse systems—those run by an organization or business—rather than informal reuse systems, which are embedded in culture, practice, or just daily life in many parts of the world. Both types of systems are needed and valuable, and more research is needed into both.
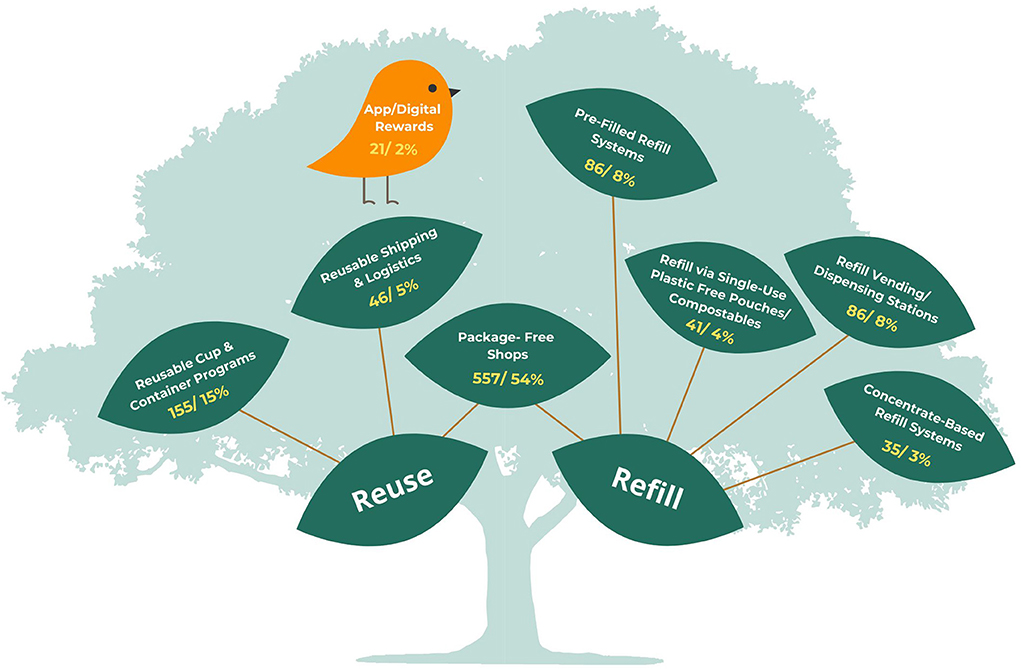
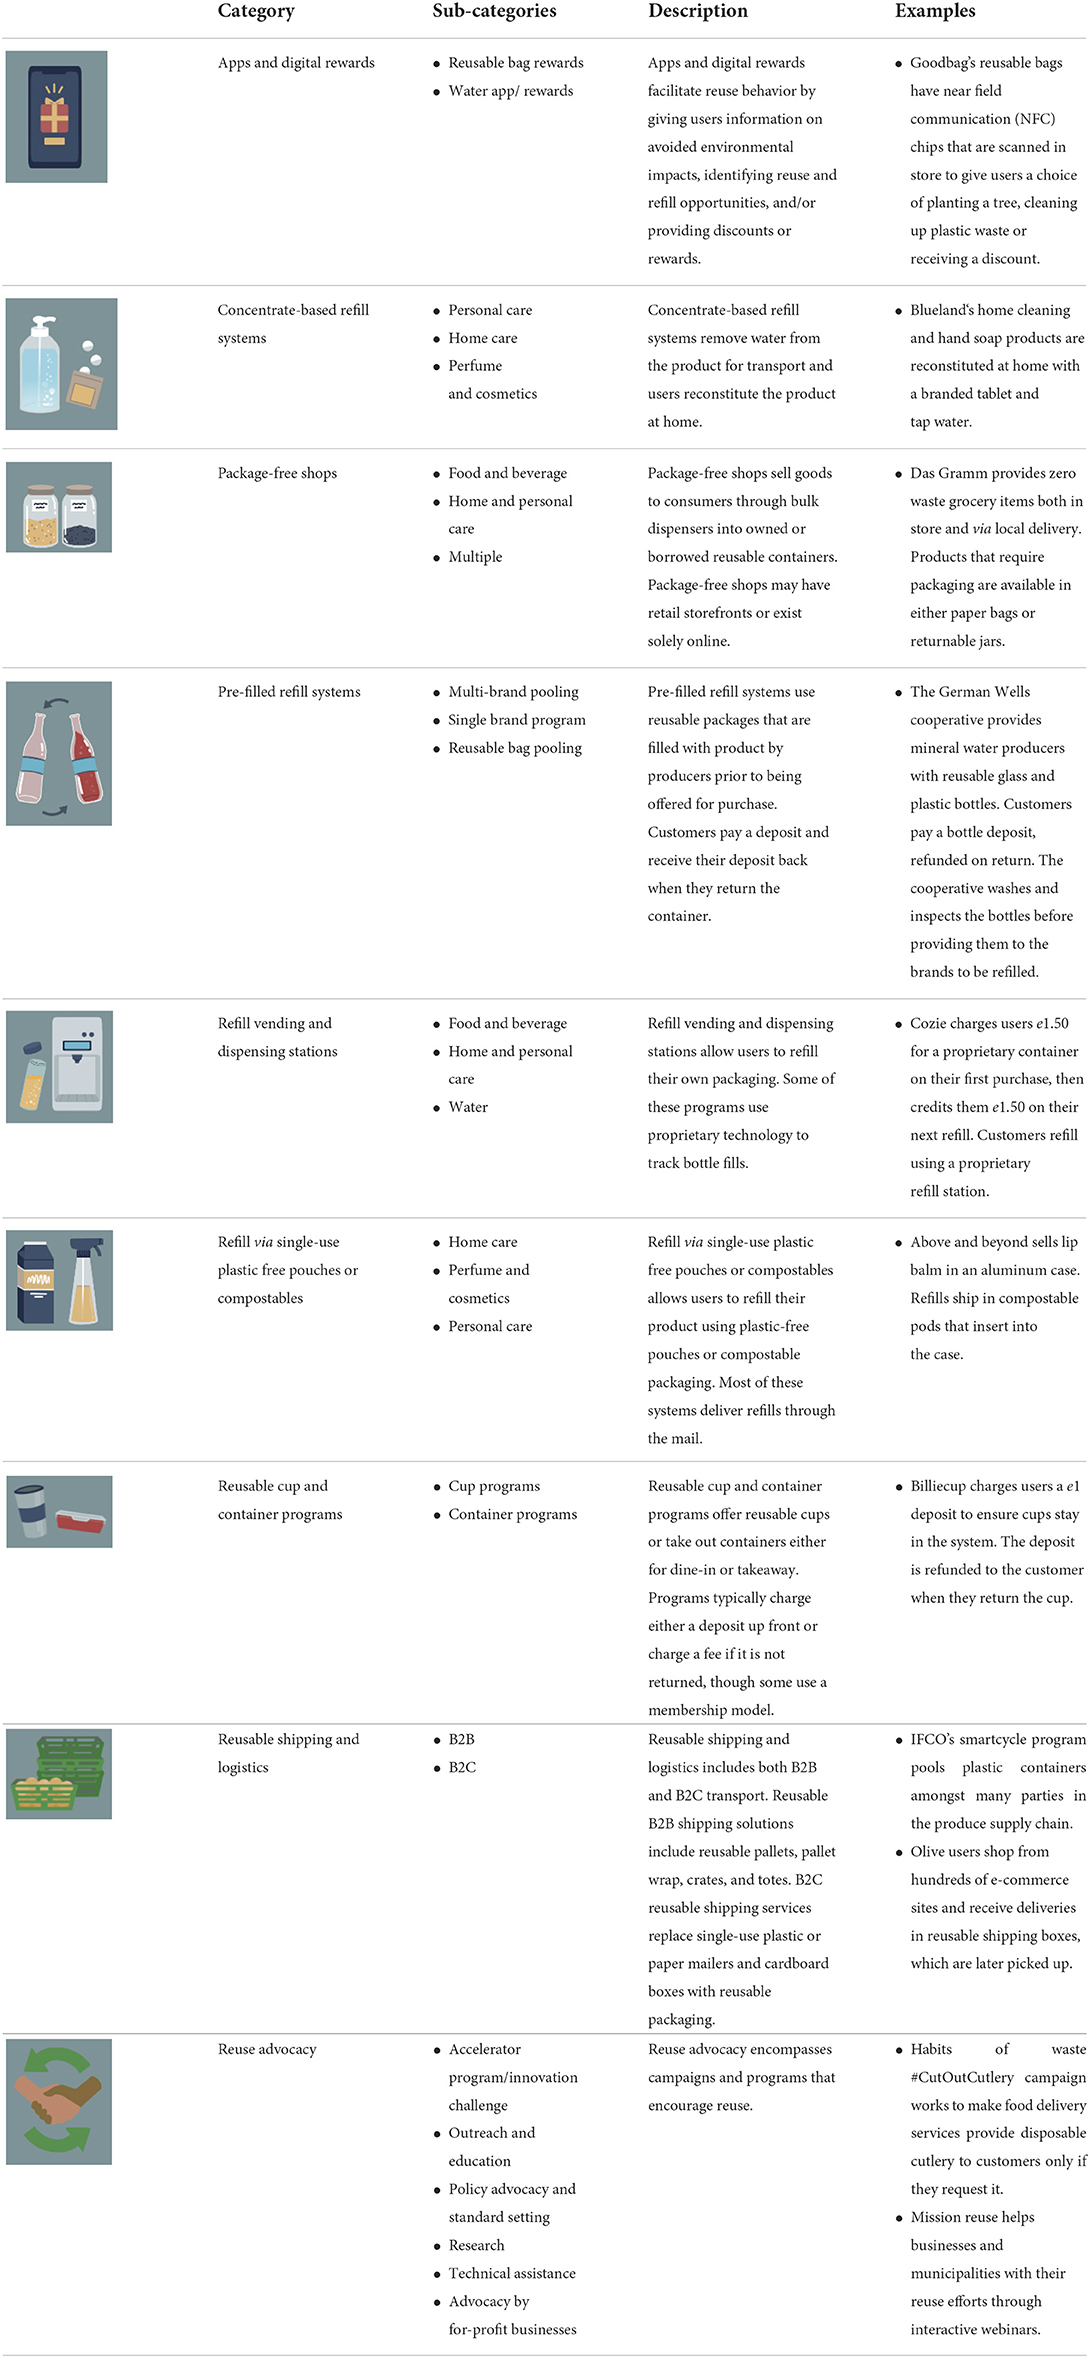
The compilation of reuse solutions examined for this research started with a focus on the US, EU and Canada in January 2021 and was created through desk research, leveraging existing lists and using search and news articles to identify additional solutions. In August 2021, the dataset was expanded to the rest of the world with additional research conducted by student interns, university professionals, and in-region contractors in Southeast Asia, South America, and Africa. Once a publicly available solution was entered into the spreadsheet, a subset of entries (26.8% excluding Package-Free Shops or 18.2% overall) were validated by confirming, correcting, or adding any additional information by local contacts in each location. The eight operational reuse solutions (excluding Reuse Advocacy) are visualized in Figure 1, while Table 1 provides definitions, sub-categories and examples for all nine categories. The definitions of each category build on commonly used terms in this space, but have been defined by the authors.
The full dataset as it existed on June 10, 2022 is available in Excel as part of the Supplemental material. The dataset continues to be updated regularly (typically weekly) and is open and free to everyone, published publicly at (www.reuselandscape.org/database) (note that solutions that cease operating are kept in the database and marked Inactive).
Besides the category of business, the growth stages for each were identified by the researchers according to four categories outlined below. The categories of the growth stages are:
• Concept—the solution is in development or testing, but not yet operating even at pilot scale.
• Pilot/Start-up—the organization or a pilot exists, has at least some level of active operations but is still testing; pre-Series A funding for startups (Package-Free Shops businesses with one location are considered start-ups).
• Growth stage—the organization or pilot is successful and growing, receiving Series A and Series B funding rounds.
• Established—the organization is a successful business with a successful operating model. Although it may still be growing, it is well-established in at least one geography.
To further explore the industry dynamics and understand barriers to reuse adoption, 30 semi-structured interviews with reuse practitioners and experts (reuse program operators, reuse advocacy organizations and other NGOs, and impact investors) were conducted from February 2021 to February 2022 and, separately, a survey of reuse business owners garnered 27 survey responses during April and May 2022. Respondents to the survey with 27 responses came from businesses around the world, but the majority were from businesses with North American operations (21). Responses also came from Europe (7), Asia (1), Oceania (1) and South America (1). (Some businesses operate in more than one region and all locations were included in the tally of responses per geographic region). All of the companies surveyed operate in an environment where individuals can choose to use a disposable option or the reusable option. This study does not explore the aspects of consumer preferences that may lead to this decision, but rather is focused on what businesses report about their own experiences.
Results and discussion
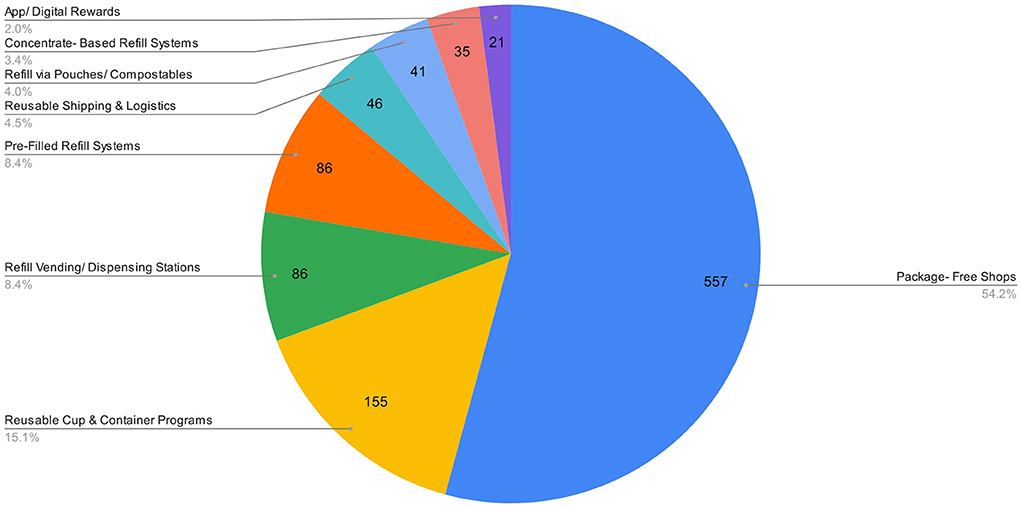
As of June 10, 2022, the landscape of reuse solutions contained 1,196 distinct solutions globally. Solutions that encourage reuse included 161 Reuse Advocacy activities by non-profit organizations and 94 Reuse Advocacy activities by for-profit companies. There were 1,027 solutions identified that directly facilitate reuse and refill (this includes the 86 companies that also advocate for reuse policy). Just over half of these solutions are Package-Free Shops (54%), which provide opportunities for both reuse and refill. Even with extensive research, it is likely that Package-Free Shops are still under-represented in this analysis as it is challenging to identify some of these very local shops around the world.
The reuse category of solutions comprised 20% of the total and included Reusable Cup & Container programs (15%) and Reusable Shipping and Logistics (5%). The refill category of solutions comprised 24% and included Refill Vending and Dispensing Stations (8%), Pre-Filled Refill Systems (8%), Refill via Pouches or Compostables (4%), and Concentrate-Based Refill Systems (3%). Apps and Digital Rewards are 2% of the total, and can be an enabler of other solutions as well (Figure 2). Refill solutions tend to be for branded products, typically replace primary product packaging, and largely reflect a commitment from individual brands to provide refill options. In contrast, within the reuse solutions category the solution providers are more often startups providing services rather than selling products. Reusable Shipping and Logistics solutions are replacing secondary or tertiary packaging with packaging-as-a-service and Reusable Cup and Container programs are replacing disposable foodware with foodware-as-a service. In this way, Package-Free Shops are more like refill solutions, as they are replacing single-use packaging for the products that they sell.
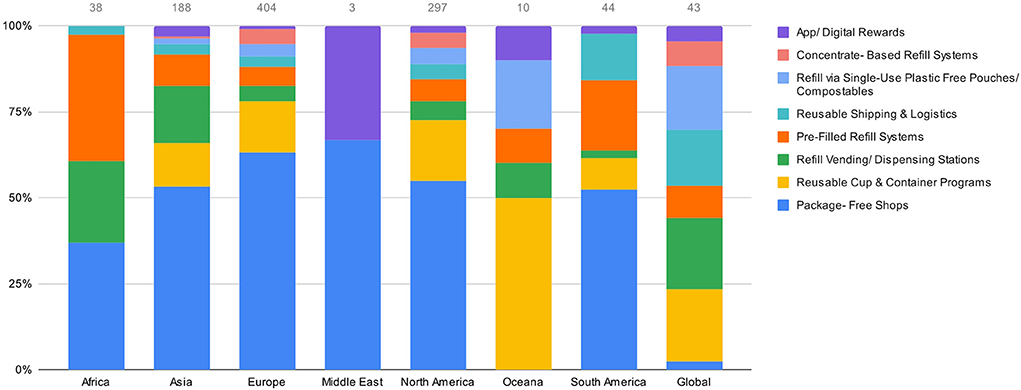
Reuse and refill solutions were identified in 119 countries across seven regions. Europe has the highest number of solutions identified (404), followed by North America (297) and then Asia (188). The mix of solutions is relatively consistent across those three regions. Organizations that operate globally (defined here as in at least 2 different regions) offer an even mix of solutions compared to individual regions. Regional differences in number and mix of solutions may be driven by consumption patterns, policy and regulatory context, alignment of reuse with existing cultural norms or legacy systems, appetite of local investors to fund new solutions, and other factors (Xanthos and Walker, 2017) (Figure 3). Despite dedicated efforts in Africa and the Middle East, researchers were unable to find as many solutions offered in these areas. This does not necessarily mean that they do not exist. It must also be acknowledged that this research focused specifically on “formal” reuse and refill, meaning companies that are providing reuse and refill solutions, which excludes “informal” reuse and refill practices that are embedded in daily habits and cultural norms still in many parts of the world. As a result, it is possible that countries that still have strong informal reuse practices appear to be doing less on reuse and refill, when in fact the opposite is true. Further study of informal reuse and refill practices as well as how to encourage their adoption would be of great value to this field and would be complementary with this research.
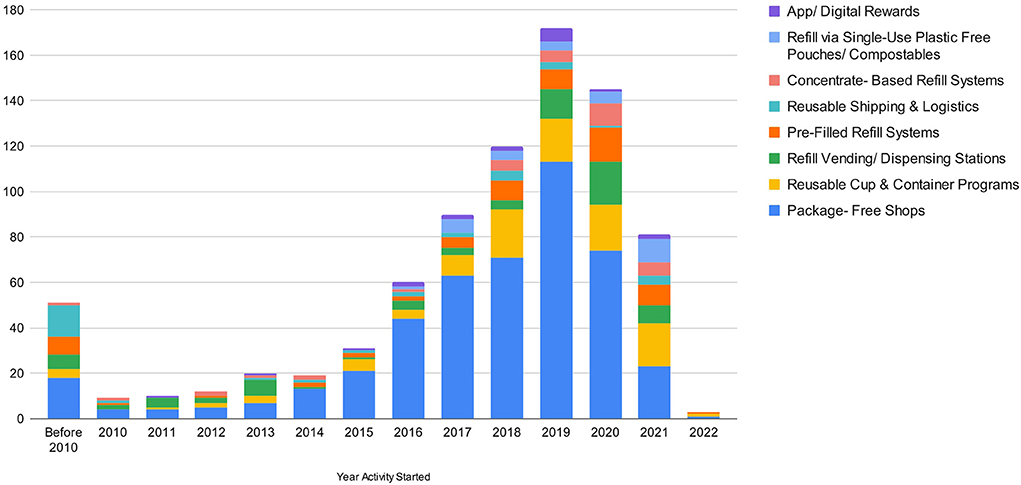
The trajectory of new business launches followed a steep upward trajectory from 2014 and was interrupted in 2020 due to the COVID-19 pandemic. There were 81 new solutions launched in 2021 compared to 172 in the last full year before the pandemic, though this gap is almost entirely explained by fewer new Package-Free Shops, with the number of other types of solutions being launched holding consistent with pre-pandemic levels (Figure 4). With people doing less in-person shopping during the pandemic, a decrease in the launching of shops such as this is reasonable. In some cases, reuse and refill practices were specifically limited or hindered by COVID-19 policies (Patrício Silva et al., 2021).
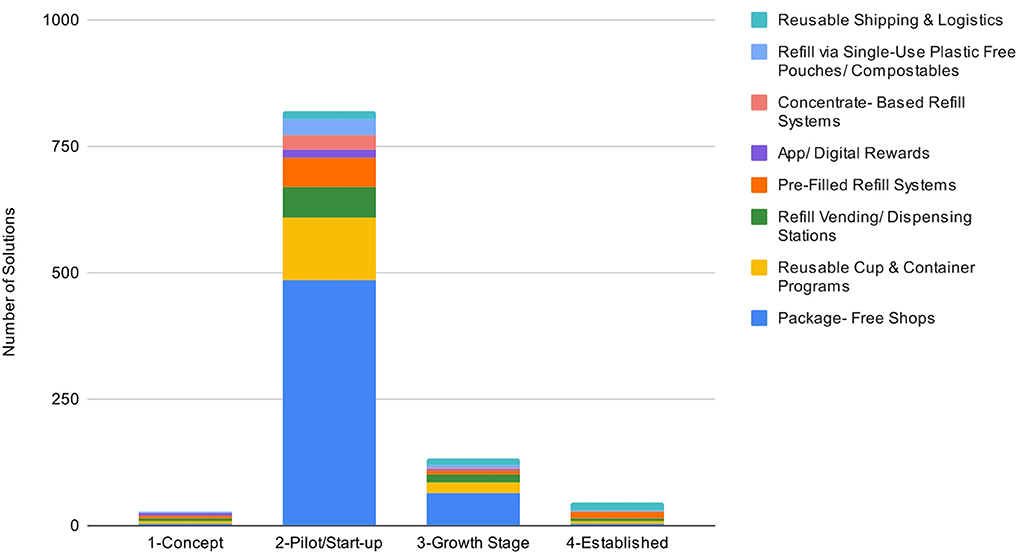
The vast majority of solutions (79.8%) are pilots or startups, indicating the young age of this field. It is important to keep this early stage sector maturity in mind when considering the barriers and enablers to growth. In Growth Stage, Package-Free Shops are the largest share, which here means shops with at least two locations, followed by Reusable Cup and Container programs and Refill Vending and Dispensing Stations, indicating that at least some of these businesses have been able to get traction with consumers. Of the established solutions, Reusable Shipping and Logistics make up 34.8% (16) and Pre-Filled Refill Systems make up 30.4% (14), which are primarily bottle pooling programs within bottle deposit return schemes (see Figure 5). It makes sense that the bulk of established solutions are in Shipping and Logistics and Pre-Filled Refill Systems because these are the two main ‘reuse legacy' businesses. Business-to-business transport packaging services have existed for many years, while bottle pooling was a pre-plastic solution that has endured in certain parts of the world and is being expanded now in others.
Refill via Single-Use Plastic Free Pouches or Compostables grew the fastest over the last 3 years, followed by Concentrate-Based Refill Systems and Pre-Filled Refill Systems, though all categories expanded in the total number of solutions offered since 2019 in spite of the pandemic. This makes sense because these are refill models that customers can take part in from home via ecommerce. The growing number of reuse and refill solutions are expanding the opportunities for businesses and consumers to take action to address plastic waste and participate in the circular economy. The number of solutions being offered has grown significantly since 2014 and certain types of solutions are continuing to grow despite the disruption from COVID. The space is overwhelmingly populated with start-ups and small businesses, with more than half of these being individual shops offering products in reusable or refillable package formats. The growth of reuse and refill could be described as the emergence of a movement as much as a market.
Barriers and enablers to the adoption and scaling of reuse and refill solutions
The results of the 30 semi-structured interviews identified six key barriers to the growth of reuse: (1) solving for reusable item material and assortment, (2) integration with existing infrastructure including accessing or installing washing capacity, (3) convincing businesses to try the reuse solution out, (4) the presence of restrictive policy and lack of reuse-focused lobbying, (5) insufficient funding / investment in the space, and (6) consumer behavior and awareness. A lack of alignment on what the “best” material for reusable items is was noted—with tension between the perceived benefits of plastic (lightweight—and therefore lower GHG emissions in transport—and durable) and the perceived risks (leaching of chemicals and microplastics into food and beverages and looks dirty with wear) as well as related tradeoffs for other materials (glass/ceramic is inert but heavy and not as durable, stainless steel is a high impact material but durable and safe). It should be noted that all six items listed above could be considered system-level challenges, meaning they must be solved by the sector collectively rather than by businesses individually. Indeed, this reveals a significant need for field-building for reuse and refill in general, supporting the cultural shift that must occur with both businesses, consumers and providers of capital. Additionally, the relationships between the barriers and their solutions suggests a logical sequencing that enables some barriers to provide unlocks for others. For example, getting consumers on board with and even demanding reuse and refill solutions could enable policy shifts as well as greater business adoption. Integration with existing or new infrastructure may be facilitated by greater adoption by businesses and securing funding, and would inform the reusable item material and assortmnet, underlining the importance of interoperability of systems. Reuse standards organization PR3 has released draft standards for each aspect of reusable systems to support the development of interoperable systems from the beginning.
In the survey of 27 reuse business owners, similar barriers were identified. The top concern was the perception by restaurant owners that using reusable foodware would have a negative effect on operations because it would slow down transactions and consumers would not accept it, followed closely by lack of consumer awareness about the solution—meaning consumers didn't even know it was an option. Funding was mentioned but was not a dominant concern and tended to be ranked third after restrictive policies (Figure 6 top half). Additional write-in answers included the need for bi-directional logistics, better cooperation with others in the supply chain or community, balancing complexity with a desire for a large number of SKUs (stock-keeping units), and the cost of reusables compared to disposables. These barriers are also largely system-level challenges more than individual business challenges and reflect the nascency of the sector as lack of awareness, understanding, and proof points are significant obstacles for businesses. Respondents saw different solutions to getting to parity on cost, with some seeing highly efficient, large-scale reuse systems as the path to economic sustainability whereas others are looking to policymakers to level the playing field.
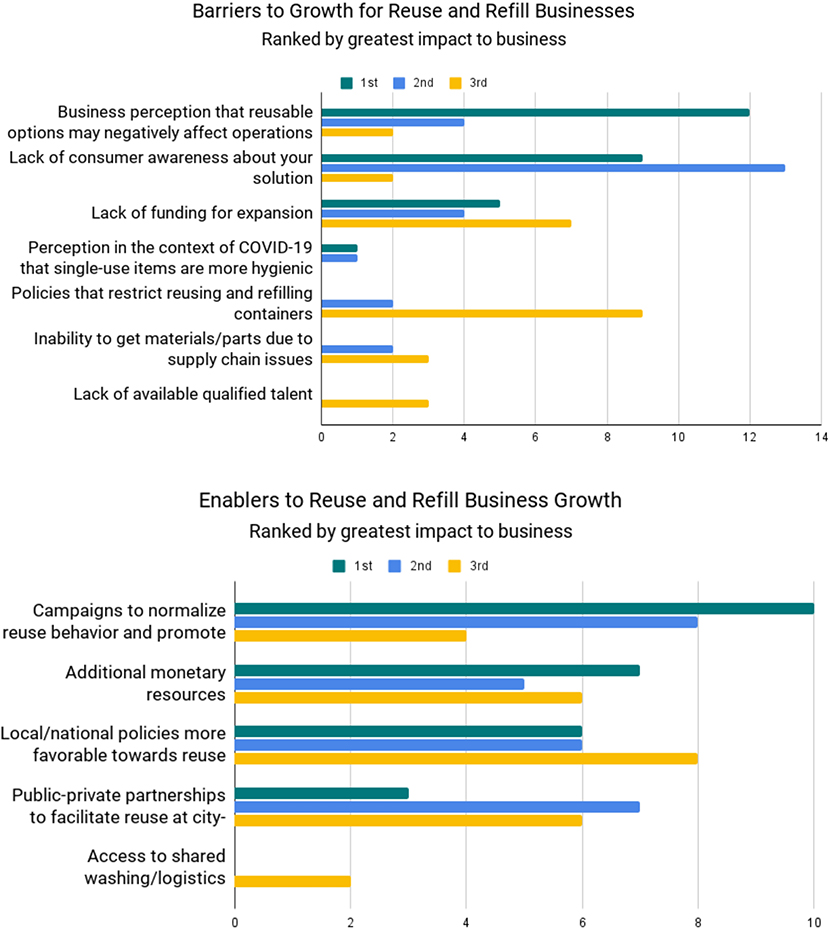
Figure 6. Barriers and enablers to growth for reuse and refill businesses, per survey of reuse business owners.
In the interviews, the top enablers for reuse and refill business growth were identified as the existence of successful models, better data, increased system design expertise (to ensure systems meet high consumer expectations and have lower environmental impact), and enabling policies. The survey results surfaced “campaigns to normalize and promote reuse behavior” as the top enabler. The second one was additional monetary resources, which had not shown up as highly in the barriers list (Figure 6 bottom half). Additional write-in answers included efforts to thwart greenwashing from “fake reuse” solutions providers (e.g., more durable “souvenir” cups with no mechanism for facilitating reuse), integration with food delivery services, campaigns informing consumers of health risks from microplastics and chemicals of concern including PFAS, and subsidies or incentives for those adopting reuse.
Synthesizing the barriers and enablers across both the interviews and the survey: even with the growth trajectory of reuse and refill solutions over the last several years, businesses, consumers, and funders overall are still looking for clear demonstrations of the viability of reuse and refill solutions at sufficient scale to overcome operational and logistical questions, economic uncertainty, and current consumer habits tied to disposability.
Summary
The nearly 1,200 solutions identified and analyzed here show that there is strong interest from these businesses as well as their customers to use refill and reuse solutions to reduce waste from disposable packaging and products, in particular single use plastics. 78% of these solutions are displacing primary packaging, 20% are displacing disposable foodware or secondary or tertiary packaging, and the remaining 2% are apps that support reuse and refill behavior. Europe and North America currently have the highest number of identified solution providers, and Asia has just under half the number found in Europe. The fewer number of solutions identified in other regions may be due to the authors' research limitations, less interest from businesses or customers in those regions in reuse and refill solutions, or the presence of informal reuse practices that make formal solutions less necessary, or some combination of the three. The field of reuse and refill solutions is still nascent, with the majority of businesses at a start-up stage of growth, and the sector is continuing to grow rapidly, picking up speed again following the COVID pandemic.
The growth of reuse and refill businesses and advocacy is enabling a needed shift in how modern society consumes products, but it is not currently happening fast enough to move the needle on the global scale of plastic pollution or climate change. Many different actors in society have the ability to support the growth of these new delivery models: governments can remove restrictions and pass enabling legislation; investors and philanthropic funders can support businesses using or providing reuse and refill models; city workers, urban planners and mission-based recyclers can partner with service providers to integrate reuse and refill infrastructure into their communities; businesses can adopt new delivery models and invest in optimizing with the same level of focus and resourcing as has been given to the single-use packaging model; and marketers and the entertainment industry can normalize reuse and refill models for consumers so it just becomes part of daily life.
Considering reuse and refill as essential to reducing plastic pollution and GHG emissions, it is critical to consider how these solutions can be grown in a way that accomplishes these goals. As the interview and survey responses identified, this growth can build on the success of pilots, but this will require a growing number of people with expertise in reuse systems and more data on how to optimize these systems. At the same time, reuse and refill must become familiar ways to consume products, while meeting consumer expectations and needs. The policy environment is also a critical piece—both ensuring the absence of restrictive policies and supporting the passage of enabling policies. While there are examples of reuse and refill on six continents and 119 countries, the growth and development of these solutions is not happening evenly across geographies. This creates opportunities for learning across geographies but with the recognition that solutions must be tailored to local context and culture.
It is easy to forget that it was not that long ago that single-use packaging was not available. While legacy reuse systems may provide helpful models and inspiration, reuse and refill models in the twenty first century can leverage the best available technology, hygiene systems, human-centered design insights, supply chain optimization, and life-cycle data to meet the needs of consumers today and for a very long time.
Data availability statement
The specific dataset presented in this study can be found in the Supplementary material. The live, continuously updated reuse landscape database can be found at the link below: https://www.reuselandscape.org/database.
Ethics statement
Ethical review and approval was not required for the study on human participants in accordance with the local legislation and institutional requirements. Written informed consent for participation was not required for this study in accordance with the national legislation and the institutional requirements.
Author contributions
EM and KG designed the database and the website to host it, reached out to each organization listed to ask them to validate their information, conducted the interviews, wrote and analyzed the survey, and analyzed the dataset. KG did a significant portion of the desk research in the US and Europe, worked with researchers in other regions to support them in their research, and also created the charts. KY did the literature review and provided input on the analysis and discussion. JJ provided overall guidance and support on the interviews, survey, data analysis, and insights. All authors contributed to the article and approved the submitted version.
Funding
The Living Landscape of Reuse Solutions was created and is maintained on an ongoing basis through funding from the Overbrook Foundation and the Plastic Solutions Fund.
Conflict of interest
Authors EM and KG are employed by Moss & Mollusk Consulting.
The remaining authors declare that the research was conducted in the absence of any commercial or financial relationships that could be construed as a potential conflict of interest.
Publisher's note
All claims expressed in this article are solely those of the authors and do not necessarily represent those of their affiliated organizations, or those of the publisher, the editors and the reviewers. Any product that may be evaluated in this article, or claim that may be made by its manufacturer, is not guaranteed or endorsed by the publisher.
Supplementary material
The Supplementary Material for this article can be found online at: https://www.frontiersin.org/articles/10.3389/frsus.2022.1006702/full#supplementary-material
References
Charlebois, S., Walker, T. R., and Music, J. (2022). Comment on the food industry's pandemic packaging dilemma. Front. Sustain. 3, 812608. doi: 10.3389/frsus.2022.812608
Coelho, P. M. (2020). Sustainability of reusable packaging–Current situation and trends. Resour. Conserv. Recycl: X 6, 100037. doi: 10.1016/j.rcrx.2020.100037
DOE (2022). U.S. Department of Energy Invests $13, 4. Million to Combat Plastic Waste, Reduce Plastic Industry Emissions. Available online at: https://www.energy.gov/eere/amo/articles/us-department-energy-invests-134-million-combat-plastic-waste-reduce-plastic (accessed on July 2022).
Ellen MacArthur Foundation. (2021). New Plastics Economy Global Commitment Signatory Reports, Available online at: https://ellenmacarthurfoundation.org/global-commitment/signatory-reports
Greenwood, S. C., Walker, S., Baird, H. M., Parsons, R., Mehl, S., Webb, T. L., et al. (2021). Many happy returns: combining insights from the environmental and behavioural sciences to understand what is required to make reusable packaging mainstream. Sustain. Prod. Consum. 27, 1688–1702. doi: 10.1016/j.spc.2021.03.022
Hamade, R., Hadchiti, R., and Ammouri, A. (2020). Making the environmental case for reusable PET bottles. Procedia Manuf. 43, 201–207. doi: 10.1016/j.promfg.2020.02.137
Hamilton L. A. and FeitCenter S. (2019). Center for International Environmental Law. Plastic and Climate: The Hidden Costs of a Plastic Planet.
Jenner, L. C., Rotchell, J. M., Bennett, R. T., Cowen, M., Tentzeris, V., and Sadofsky, L. R. (2022). Detection of microplastics in human lung tissue using μFTIR spectroscopy. Sci. Total Environ. 831, 154907. doi: 10.1016/j.scitotenv.2022.154907
Johansen, M. R. (2022). A review of the plastic value chain from a circular economy perspective. J. Environ. Manage. 2022, 302. doi: 10.1016/j.jenvman.2021.113975
Klemeš, J. J., Fan, Y. V., and Jiang, P. (2021). Plastics: friends or foes? The Circularity and Plastic Waste Footprint. Great Britain: Taylor & Francis.
Lau, W. W. Y. (2020). Evaluating scenarios toward zero plastic pollution. Science. 369, 1455–1461. doi: 10.1126/science.aba9475
Leslie, H. A., van Velzen, M. J. M., Brandsma, S. H., Vethaak, D., Garcia-Vallejo, J. J., and Lamoree, M. H. (2022). Discovery and quantification of plastic particle pollution in human blood. Environ. Int. 163, 107199. doi: 10.1016/j.envint.2022.107199
Ma, X., Park, C., and Moultrie, J. (2020). Factors for eliminating plastic in packaging: The European FMCG experts' view. J. Clean. Prod. 256, 120492. doi: 10.1016/j.jclepro.2020.120492
Milbrandt, A. A., Coney, K., Badgett, A., Beckham, G. T., et al. (2022). Quantification and evaluation of plastic waste in the United States. Resour. Conserv. Recycling 183, 106363. doi: 10.1016/j.resconrec.2022.106363
Miller, S. A. (2020). Five misperceptions surrounding the environmental impacts of single-use plastic. Environ. Sci. Technol. 54, 14143–14151. doi: 10.1021/acs.est.0c05295
Napper, I. E., Davies, B. F. R., Clifford, H., Elvin, S., Koldewey, H. J., Mayewski, P. A., et al. (2020). Reaching new heights in plastic pollution—Preliminary findings of microplastics on Mount Everest. One Earth 3, 621–630. doi: 10.1016/j.oneear.2020.10.020
Patrício Silva, A. L., Prata, J. C., Walker, T. R., Duarte, A. C., Ouyang, W., Barceló, D., et al. (2021). Increased plastic pollution due to COVID-19 pandemic: Challenges and recommendations. Chem. Eng. J. 405, 126683. doi: 10.1016/j.cej.2020.126683
Pauly, J. L., Stegmeier, S. J., Allaart, H. A., Cheney, R. T., Zhang, P. J., Mayer, A. G., et al. (1998). Inhaled cellulosic and plastic fibers found in human lung tissue. Cancer Epidemiol. Biomark. Prev. 7, 419–428.
Peng, G., Bellerby, R., Zhang, F., Sun, X., and Li, D. (2020). The ocean's ultimate trashcan: Hadal trenches as major depositories for plastic pollution. Water Res. 168, 115121. doi: 10.1016/j.watres.2019.115121
Rhein, S., and Schmid, M. (2020). Consumers' awareness of plastic packaging: More than just environmental concerns. Resour. Conserv. Recycl. 162, 105063. doi: 10.1016/j.resconrec.2020.105063
Tan, E. C. D., and Lamers, P. (2021). Circular bioeconomy concepts—A perspective. Front. Sustain. 2, 701509. doi: 10.3389/frsus.2021.701509
Walker, T. R., and McKay, D. C. (2021). Comment on “Five Misperceptions Surrounding the Environmental Impacts of Single-Use Plastic”. Environ. Sci. Technol. 55, 1339–1340. doi: 10.1021/acs.est.0c07842
Xanthos, D., and Walker, T. R. (2017). International policies to reduce plastic marine pollution from single-use plastics (plastic bags and microbeads): A review. Marine Poll. Bull. 118, 17–26. doi: 10.1016/j.marpolbul.2017.02.048
Yesaya, M., Mpanang'ombe, W., and Tilley, E. (2021). The cost of plastics in compost. Front. Sustaina. 2, 753413. doi: 10.3389/frsus.2021.753413
Keywords: circular economy, plastics, plastic pollution, marine debris, reuse, refill, disposable, packaging
Citation: Moss E, Gerken K, Youngblood K and Jambeck JR (2022) Global landscape analysis of reuse and refill solutions. Front. Sustain. 3:1006702. doi: 10.3389/frsus.2022.1006702
Received: 29 July 2022; Accepted: 31 October 2022;
Published: 24 November 2022.
Edited by:
Costas Velis, University of Leeds, United KingdomReviewed by:
Md. Shahruk Nur-A-Tomal, Monash University, AustraliaVivek Vasagar, PPG Industries, United States
Copyright © 2022 Moss, Gerken, Youngblood and Jambeck. This is an open-access article distributed under the terms of the Creative Commons Attribution License (CC BY). The use, distribution or reproduction in other forums is permitted, provided the original author(s) and the copyright owner(s) are credited and that the original publication in this journal is cited, in accordance with accepted academic practice. No use, distribution or reproduction is permitted which does not comply with these terms.
*Correspondence: Kristina Gerken, a3Jpc3RpbmFAbW9zc2FuZG1vbGx1c2suY29t
 Ellie Moss
 Kristina Gerken2*
 Kathryn Youngblood
 Jenna R. Jambeck