 Valerie Rodin
 Lukas Zeilerbauer
 Johannes Lindorfer
 Christian Paulik2†
- 1Department of Energy Technology, Energieinstitut an der Johannes Kepler Universität Linz, Linz, Austria
- 2Institute for Chemical Technology of Organic Materials, Department of Chemistry and Polymer Engineering, Faculty of Engineering & Natural Sciences, Johannes Kepler University, Linz, Austria
- 3Department of Engineering, School of Technology, Reykjavik University, Reykjavik, Iceland
Carbon capture and utilization (CCU) technologies support future energy and climate transition goals by recycling carbon dioxide (CO2) emissions. The use of biogenic CO2 from renewable sources, is an avenue for the production of fully renewable products. Fossil-based materials can potentially be replaced in the long term while allowing for the use of so called “waste” streams. To foster the development of a circular economy more insights need to be gained on the life cycle impact of CCU technologies. This study analyzed a CCU process chain, with focus on the utilization of volatile renewable electricity and biogenic CO2. We performed a cradle-to-gate life cycle assessment, evaluating various environmental impact categories (CML 2001 methodology) and primary energy demand (PED) with GaBi LCA software by sphera®. The targeted olefin is ethylene oxide (C2H4O), which is a crucial intermediate chemical for the production of various synthetic materials, such as polyethylene terephthalate (PET). As functional unit, 1 kg ethylene oxide was chosen. In the novel process at first ethylene (C2H4) and hydrogen peroxide (H2O2) are produced from water and CO2 via an electrocatalytic process (Power-to-X process). In a second step, the two intermediates are synthesized to ethylene oxide. The theoretical implementation of a medium-scale process under average European conditions was considered in 12 scenarios that differed in energy supply and CO2 source. Sensitivity analyses were conducted to evaluate the influence of the energy and resource efficiencies of the production steps. The process was compared to its fossil benchmark, an existing conventional EO production chain. Concerning the global warming potential (GWP), negative emissions of up to −0.5 kg CO2 eq./kg product were calculated under optimized process conditions regarding energy and conversion efficiency and using biogenic CO2. In contrast, the GWP exceeded the fossil benchmark when the European grid mix was applied. The PED of 87 MJ/kg product under optimized conditions is comparable to that of other Power-to-X processes, but is high compared to fossil-based ethylene oxide. Based on the results we conclude that the energy efficiency of the electrocatalytic cell and renewable energy as input are the main levers to achieve a low environmental impact.
Introduction
As climate change and environmental pollution take more visible forms, the focus of politics, industry and research is increasingly shifting toward climate change mitigation and environmental action. The European Green Deal foresees climate neutrality until 2050 (European Commission, 2019), in this regard, circular economy is considered a supportive concept (European Commission, 2020). On the other hand, the IPPC reports that CO2 emissions have to be drastically reduced within the next decades, in order to gain realistic chances to limit global warming at 1.5°C maximum in the near (2,040) and long (2,100) term (pp. 14–15/IPCC, 2021b). Technologies to reduce and bind CO2 are Carbon Capture and Utilization (CCU) and Storage (CCS)–both are highly discussed for different reasons. CCS is questioned as sub-earth surface might not be safe. For this reason, some countries have prohibited CCS until the technology is more advanced and risks have been assessed, for example Austria (BMNT, 2019). CCU on the other hand is not capable of long-term carbon sequestration, as its products are potentially short-lived. However, integrated into a circular economy with closed material cycles, CCU might be the puzzle piece which enables the industry to reduce the net CO2 emissions to a minimum. Because of the associated critical aspects and opportunities, CCU and CCS attract increasing interest from academia and industry–as for example polyolefin and plastic manufacturers shift their core business to circular economy, renewable resources and CCU technologies, as they rely on carbon as a feedstock (Global CCS Institute Parsons Brinckerhoff, 2011; Otto, 2015; Ericsson, 2017).
Despite the direct utilization of CO2 (for carbonated drinks, food processing etc.) there are various CCU pathways as can be seen from Figure 1, based on different CO2 sources and chemical conversion techniques. Furthermore, the energy demand is of relevance in regard to environmental impact (Zhang et al., 2020), as well as technoeconomic considerations and flexibility of the conversion technology (e.g., in regard to volatile renewable energy) (Böhm et al., 2020). Technologies such as CO2 conversion to methanol (Fischer-Tropsch-synthesis) are well-known through crude oil and natural gas refining but often connected to environmental impacts that overshadow the effect of CO2 sequestration (Kibria Nabil et al., 2021). The methanation of hydrogen with CO2 (Sabatier process) is also a common process, whereby nowadays green hydrogen is in the spotlight as a raw material (Götz et al., 2016; Bassano et al., 2019; Romeo et al., 2022). Alternatives, such as photochemical, biochemical and electrochemical routes, have different advantages but also disadvantages, such as high cost and low yields due to low efficiencies (Yaashikaa et al., 2019). Also, the targeted chemicals and fuels differ: Considering the direct electrochemical conversion, there was much research on carbon monoxide (Jin et al., 2021), formic acid (Proietto et al., 2021) and methanol production (Liu et al., 2020) in recent years, while electrochemical conversion to C2(+) hydrocarbons is the next step (Pei et al., 2021).
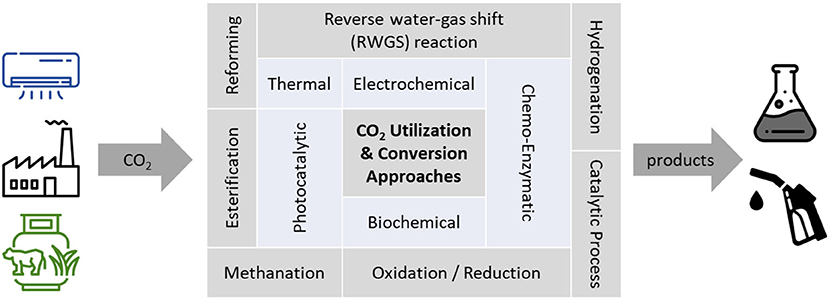
Figure 1. Overview of CO2 utilization and conversion approaches. Fossil and renewable point sources, as well as direct air capture, are possible CO2 sources, the products range from various chemicals to various fuels. Source: illustration redrawn and adapted from (Saravanan et al., 2021).
In this regard, electrochemical CO2 conversion to ethylene (C2H4) is in line with research and industry (Masel et al., 2021), because ethylene is an important base chemical for the chemical and plastics industry as more than 100 Mt are produced annually (IEA, 2013). In addition to the direct electrochemical route, there are various strategies to produce renewable ethylene, such as thermochemical conversion (biomass gasification with subsequent steam-reforming) or fermentation of biomass (via dehydration of ethanol) (Liptow et al., 2015; Alonso-Fariñas et al., 2018; Oliveira et al., 2020). However, these routes are not based on CO2 conversion but depend directly on biomass as a feedstock while electrochemical CO2 reduction allows for a variety of CO2 sources. Furthermore, several conversion steps are needed, which increases plant complexity.
Another important base chemical, which is commonly produced from ethylene, is ethylene oxide (EO). EO has a global production volumes of over 30 Mt per year (Mordor Intelligence, 2020; Statista AgileIntel Research (ChemIntel360), 2021), ethylene even has a production capacity of >200 Mt per year (Statista, 2022). The most common EO processes are based on the direct oxidation of ethylene (C2H4), oxygen (O2), and a recycle gas blended in a catalytic reactor, resulting in the production of EO, carbon dioxide (CO2), and water (H2O) (Zakkour and Cook, 2010). However, in recent years, the research focus shifted to replacing O2 by CO2, (Mobley et al., 2017), which would allow for the production of EO and carbon monoxide (CO) while utilizing CO2. Also, in common industrial processes unwanted side reactions, such as the full oxidation from ethylene to CO2, increase the carbon footprint of EO (Mobley et al., 2017).
Based on the scientific consensus on anthropogenic climate change, as synthesized by the IPCC1 (IPCC, 2014, 2021a), the European Union and A.SPIRE2 have set targets to significantly reduce greenhouse gas (GHG) emissions and energy demand in the coming years: The reduction targets to be achieved by novel electrochemical processes are −30% GHG emissions and −25% energy demand compared to non-electrochemical processes (European Commission, 2016). With regards to energy demands, a reduction of 25 % would lead to maximum primary energy demand (PED) of 53 MJ/kg for ethylene and 44 MJ/kg for EO (Figure 2), which is relatively low considering the lower heating values (LHV) of 47 MJ/kgEthylene and 26 MJ/kgEO (Portz, 2005).
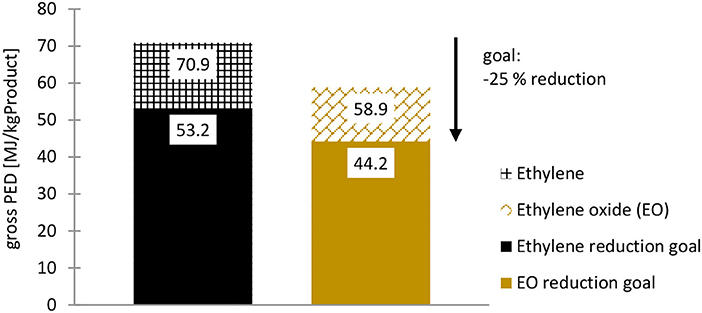
Figure 2. PED of fossil-based ethylene and EO in Germany: Current PED and reduction goal for 1 kg fossil-based ethylene (GaBi sphera, 2020c) and EO (GaBi sphera, 2020g) produced. Source: Own illustration based on LCA data from GaBi sphera.
Fossil benchmarks tend to have low allocated PEDs and GHG emissions considering cradle-to-gate system boundaries, based on the fact that the resource (crude oil) for these chemicals is highly energetic and reactive. In other words, it affords a comparatively low energy input for most conversion steps. Also, modern refineries produce various intermediates and final products in vast amounts and are highly optimized in terms of energy efficiency, e.g., via heat recovery. This leads to a low specific impact per product.
An alternative EO process based on ethylene and hydrogen peroxide (H2O2) was thoroughly assessed by Ghanta et al., with the goal to increase technoeconomic feasibility and decrease the environmental impact of EO production. A key idea by Ghanta et al. was to replace the O2, which is needed as oxidant in the conventional process, with H2O2. However, they consider conventional H2O2, that is, fossil-based H2O2 in their analyses (Ghanta et al., 2013). The common route for H2O2 formation is the anthraquinone process (Goor et al., 2019). In recent years electrochemical oxidation of water to H2O2 was investigated a lot (Mavrikis et al., 2021), also from a historical perspective, electrochemical H2O2 production is of relevance (Goor et al., 2019). We investigate the effects of not only substituting the oxygen with H2O2, we also consider the production of renewable H2O2 via an electrocatalytic process, with the goal to minimize the carbon footprint of the final product EO.
Furthermore, the novelty of the EO process chain presented here lies within the simultaneous electrochemical conversion of CO2 to ethylene and the electrochemical oxidation of water to H2O2, within one electrochemical cell, followed by the subsequent epoxidation of ethylene and H2O2 to EO. It enables a fully renewable EO production, as the process is mainly driven by the electricity input for the electrochemical CO2 reduction and water oxidation. The future objective is that the reduced number of conversion steps gives rise to higher energy efficiency and reduced plant design compared to common EO plants. Also, unreacted CO2 and unwanted side products may be either recycled or further utilized, leading to a high overall conversion rate and a decreased carbon footprint of the intermediates and end-products.
The process could be implemented at sites with fossil-based CO2-rich off-gases as well, such as existing refineries, for the sake of decarbonization, while enhancing production volumes. But this can be only a technological option for transition, as net zero CO2 emissions must be achieved within few decades in order to gain chances to reach the 1.5°C global warming target (IPCC, 2021b), which is contrary to continued fossil resource extraction, namely raw oil. Thus, we favor the utilization of biogenic CO2 for the application of the technology to ensure that the produced EO is as climate-neutral as possible. Consequently, this study focused on the use of already available biogenic CO2 from industrial sources, which can be theoretically defined as being carbon neutral (Koornneef et al., 2011) respectively net CO2 emission reducing, depending on biomass source and technological pathway (Poeschl et al., 2012; Paolini et al., 2018). By utilizing this CO2 (and renewable electricity), the production of fully renewable ethylene and EO is theoretically possible. Also, the utilization of CO2 from direct air capture (DAC) is a possibility, depending on technoeconomic feasibility. However, large-scale DAC is expected to reach capture cost < 100 €/tCO2 in 2040 (Fasihi et al., 2019), which is high compared to today's capture costs from biogas upgrading [up to 9 €/tCO2, see (Reiter and Lindorfer, 2015)] or from ethylene oxide production [12 to 25 €/tCO23, see (Bains et al., 2017)]. Thus, DAC as CO2 source was not considered in this study with focus on 2030 and 2040 scenarios. For a summary on CO2 capture costs refer to Rodin et al. (2020).
As can be seen in Figure 2 the 30% GHG reduction goal demands highly efficient and environmentally friendly processes. On the basis of the stoichiometric reactions, the novel process has a vast GWP reduction potential, as captured CO2 is converted to other products (Figure 3). Compared to the GWPs of fossil alternatives, reductions of up to 245% for ethylene are possible.
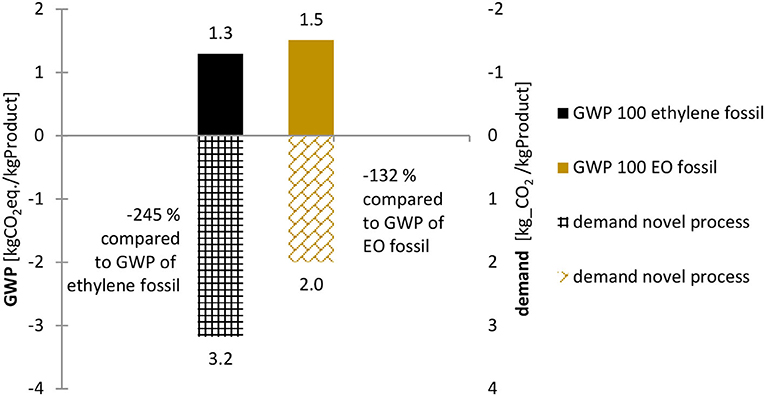
Figure 3. Fossil benchmark's GWP and stoichiometric CO2-demand per 1 kg of product of novel process: Comparison of the average GWP 100 [kg CO2 eq.] of 1 kg ethylene (GaBi sphera, 2020c) and EO (GaBi sphera, 2020g) produced compared to the stoichiometric CO2 demand of the same products generated with the novel process. Sources: Own illustration based on LCA data by GaBi sphera.
Based on these theoretical assumptions, the question arises, how the novel process performs regarding the PED and GWP and other environmental impact categories, when being assessed on a life cycle basis. Thus, a prospective cradle-to-gate LCA is performed to identify hotspots for further R&D activities.
Methods
Carrying out a comprehensive LCA, the environmental impacts of carbon utilization and conversion technology were assessed considering the ISO 14044 standard (ISO, 2006) and the CCU assessment guidelines of the Global CO2 initiative (Müller et al., 2020) as a reference. The LCA-software GaBi ts 10.6 by Sphera (Sphera Solutions Inc., 2021) was used to model the process chain, calculate the impact categories, and carry out a sensitivity analysis. Initially, the process steps, setup, and system boundaries were defined to set the goal and scope of the LCA. This also included the definition of the functional unit (FU), evaluated impact categories, and geographical and time boundaries.
Finally, for the evaluation step of the LCA, specific impact categories were chosen: the PED and the CML-baseline impact categories (Guinée et al., 2002; Acero et al., 2016) were used. Of the latter, specific attention was given to the GWP, including and excluding biogenic CO2 effects, as the most important environmental effects of CCU processes are expected in this impact category.
Goal
The objective of this LCA was to evaluate the environmental impact of a novel electrocatalytic process chain. The results for the main product, EO, were compared to its conventional counterpart, that is, EO produced from steam reforming and oxidation of ethylene via air. From the perspective of the system delimitation an attributional approach is applied for specific data of the electrocatalytic process chain.
Scope definition
System boundaries
The analyzed process consists of three main process steps: (i) the simultaneous electrochemical reduction of CO2 and water to C2H4 and H2O2; (ii) The enrichment of C2H4 and separation of side-products and unreacted CO2; (iii) the chemical synthesis of C2H4 and H2O2 to C2H4O, which is set as the reference flow of the process (see Section Allocation). Regarding upstream processes, the CO2 source, energy generation and water supply are included in the model (see Section Main inputs into the system). The final process step modeled is the C2H4O synthesis. An overview of the system boundaries and flow diagram is given in Figure 4. The process steps are described in detail in section 0.
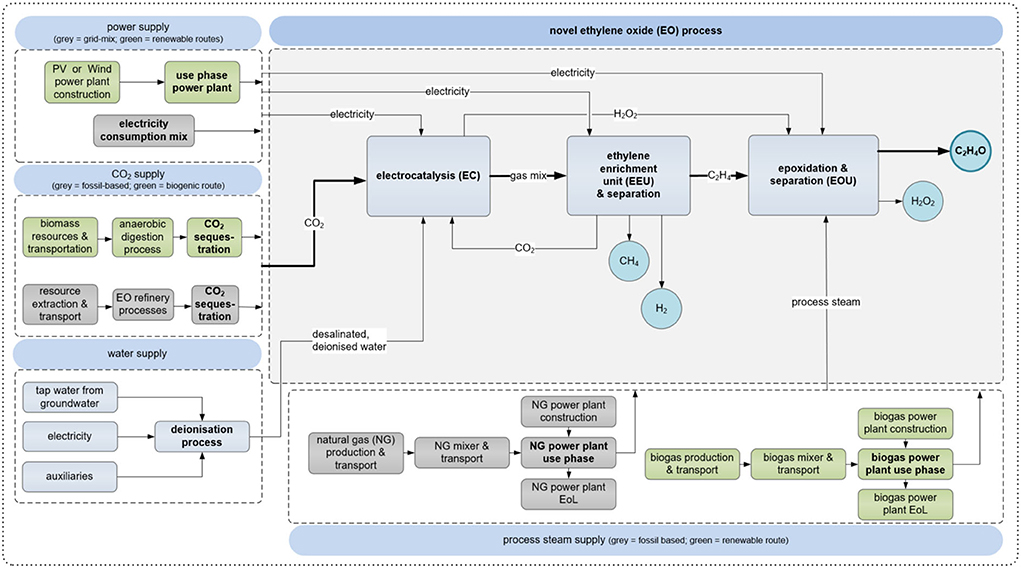
Figure 4. System boundaries and scheme of the assessed process. For electricity generation, CO2 supply and process steam supply conventional (gray) and renewable (green) pathways exist. The electrocatalysis and EEU are modeled based on our data and the epoxidation based on (Ghanta et al., 2013) while the supply processes are taken from GaBi sphera with one exception: the biogas upgrading process (CO2 sequestration) was modeled based on (Zhang et al., 2020). Impact allocation was based on mass. Source: Own illustration based on own data and literature.
A typical LCA starts with the extraction of raw materials, the processing thereof, and an end-of-life (EoL) phase. Although this is a prominent approach, another widely used option is cradle-to-gate, in which the system ends at the production of the analyzed good. This approach is useful for comparing a new manufacturing process to an established process and is frequently applied (Rezvani Ghomi et al., 2021; Zeilerbauer et al., 2022) Furthermore it is suggested for CCU chemicals with the same properties as their reference product by the Global CO2 Initiative CCU assessment guidelines (Cremonese et al., 2020; Müller et al., 2020).
To derive valid results from a scientific point of view, the recommendation of the biotechnology innovation organization can be followed: carbon (resp. CO2) enclosed in a product can only be regarded as sequestered permanently if there is adequate indication that its material will remain unchanged for more than 100 years in a certain product use or end-of-life scenario (Biobased Products Working Group, Biotechnology Industry Organization, 2010). This is in accordance with common life cycle impact assessment methodologies such as CML 2001 (EC-JRC IES, 2010). Thus, in the present study, the GWP 100 years was calculated. The fact that the meaningfulness of this indicator depends fully on the further utilization and EoL treatment of downstream products has to be kept in mind though (see also Section Climate change).
Functional unit
For power-to-gas technologies, the most common reference unit of the FU is Joule (J) or Watt-hours (Wh), that is, the energy content. In the case of other power-to-X (PtX) technologies with a focus on chemicals, kilograms (kg) or tons (t) are more suitable, as the products are predominantly merchandized via mass rather than their energy content. This was also true for ethylene, hydrogen peroxide, and EO. As the technology readiness level (TRL) of the technology and the yearly output of the underlying virtual demonstrator are rather low, 1 kg EO (instead of 1 t) was used as FU and benchmarked with its fossil counterpart.
Allocation
Allocation affects the environmental impacts of all sides and main products generated by multi-purpose processes. ISO 14044 (ISO, 2006) regulates how to solve multifunctional processes. In accordance with ISO, the CCU LCA guidelines (Müller et al., 2020) prefer sub-division and system expansion to allocation.
Quite typically for an electrochemical process, the analyzed technology is a multi-product process. As the analyzed system was reduced to the most important process steps already, further subdivision was not reasonable. System-expansion and substitution were considered too complex in regard to several valuable side-products (CH4, H2, H2O2), also, all products are currently produced via fossil-based process routes, i.e., no suitable substitution/expansion processes are available assuming a fully renewable chemical market as a setting without making extensive assumptions [see also (Heijungs and Guinée, 2007)].
Thus, the best available allocation method was looked for: determining physical relationships is recommended (EC-JRC IES, 2010), but due to the low TRL, insufficient information on the physical relationships was given, as the ratios of the different products depend on a multitude of factors: such as CO2 and water ratios, electrolyte concentration and pH value, geometry of the reactor, catalyst material and design, electrical voltage and current, intermediate reactions or decomposition of products within the process. Alternatively, market-price allocation, followed by allocation connected to economic value (mass, heating value) is appropriate (Guinée et al., 2001). Economic allocation poses the problem of volatile market prices, the results are likely to be not comparable to other studies (Klöpffer and Grahl, 2009). Also, future market values of CO2 (Müller et al., 2020) and the produced (renewable) chemicals are highly uncertain so far, thus, adding more uncertainty to the LCA results.
We used mass-allocation based on deliberation with experts, considering scaled up laboratory results and stoichiometric assessments (CO2EXIDE, 2018): the produced chemicals with the highest share (H2O2, C2H4, C2H4O) are traded based on mass and not used as energy carriers but base chemicals. The CO2 is treated as valuable by-product from previous processes, i.e., attributed with environmental impacts (Müller et al., 2020). As shown in Table 4, emissions and products leave the system boundaries at the EEU and EOU, also the upstream processes are connected with emissions. In regard to sensitivity analysis and as the side products hydrogen and methane are traded based on their energy content, the lower heating value (LHV) was also considered as allocation basis, see Section LHV-based allocation and Table 4.
Time and geographical references
In the LCA, a medium-scale system at European average conditions was evaluated. The energy and conversion efficiencies were chosen in accordance with the experimental work and projections of the underlying research project. Due to the current low TRL (3–4) of the overall process and the electrochemical cell in specific (year 2021), the reference year for the assessment was 2030, in addition to a future scenario considering technological learning, from 2030 to 2040. Regarding the back and foreground data, the latest available data sets for Europe were applied; thus, future changes, for example, in the energy mix, were not considered.
Main inputs into the system
Electricity
The overall system was supplied with electricity, for the modeling, predefined LCA processes were used, such as the average European grid mix (GaBi sphera, 2017c) and –as renewables–the European wind and solar power mixes, based on the EU-28 (GaBi sphera, 2017a,b). The grid-mix process includes not only the generation and transport of electricity, but also the sourcing and manufacturing of energy generation technologies. The wind and solar power mix also include the sourcing and manufacturing of energy generation technologies, however, no transmission, which is considered suitable as locally generated renewable energy is to be utilized by the process.
Carbon dioxide
For CO2, two different sources were considered in the scenarios: for the biogenic scenarios, CO2 from a biomethane upgrading plant was chosen. The underlying biogas process was obtained from the Gabi Sphera database (GaBi sphera, 2020a). I.e., the environmental footprint of CO2 production is fully considered, as environmental impacts are allocated between CO2 and biomethane, as well as the electricity input of the biogas upgrading process. As gas separation process an electrically driven membrane separation system was chosen, with an electric demand of 0.204 kWh/Nm3 biogas, calculated based on (Zhang et al., 2020). The energy demand was mass-allocated to CH4 and CO2, whereas only CO2 was utilized in the subsequent processes. As a consequence of the allocation, the biogenic CO2 used as a resource comes with a negative GWP, that is, GHG credit, considering cradle-to-gate system boundaries. For the gas splitting process, the same electricity source was chosen as for the main process, i.e., wind, PV, grid-mix depending on the scenario.
In the second scenario, the CO2 off-gas from conventional EO production from oxidation via air was considered, that is, fossil CO2 (see Table 2). The integration of CCU in common EO plants was recently analyzed in a previous study (Barecka et al., 2021). The authors found that the CO2 produced on-site could be directly fed into the analyzed electroreduction process (Supplementary Table S4). Hence, in the present study, the same conditions were assumed; that is, no further purification and separation process of the fossil CO2 was considered. A suitable pre-defined process was chosen from the LCA database, which considers the allocation effects occurring at the refinery (GaBi sphera, 2020b).
In both cases, no additional road or similar transport processes were added, as it is assumed that CO2 is supplied by a nearby biogenic/fossil stationary industrial process. This means that a direct pipeline or on-site integration of the process to an existing plant seems viable, thus, CO2 transport is considered negligible at the early assessment stage.
It is worth noting that for other fossil and biogenic CO2 streams (e.g., from flue gases) more or less intense CO2 separation or purification would be needed, which can lead to significant economic and environmental impacts of the overall process (Reiter and Lindorfer, 2015; Rodin et al., 2020).
As the CO2 is only partially converted by single-passing the electrocatalytic unit, the recycling of unreacted CO2, which remains in the product gas stream, is essential. In addition, some CO2 dissolves in the electrolyte solution: due to steady-state modeling, the dissolved CO2 is not considered in the balance. Freshly provided CO2 and the CO2 recycle stream were modeled (see Table 1, streams F1 and F2).
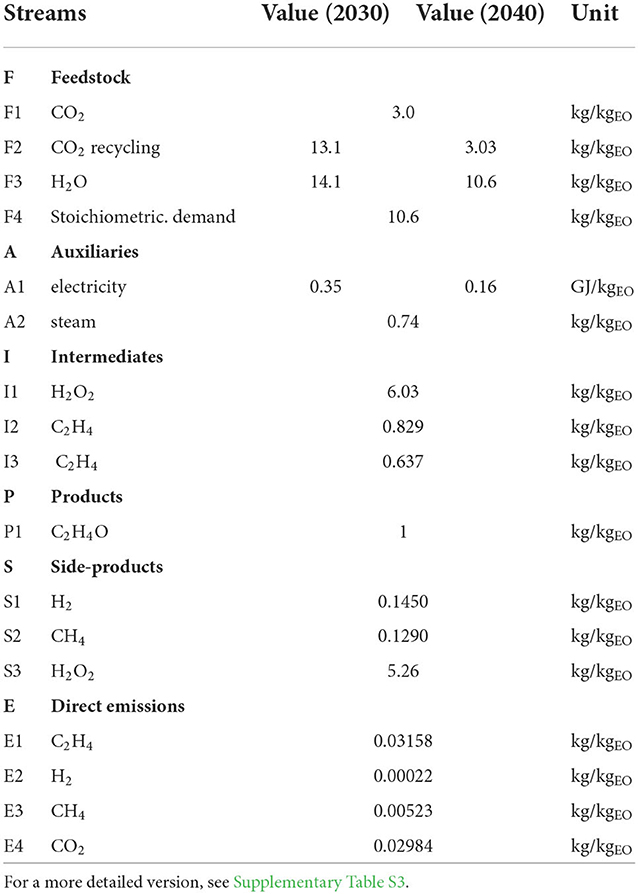
Table 1. LCI of analyzed process (absolute values).
Water
In addition, water was assumed to be supplied over the local network. Depending on the water source, impurities may lead to unwanted chemical reactions or damage to the electrocatalytic unit. Consequently, water treatment (desalination, deionization) was included via a predefined GaBi Sphera process (GaBi spher, 2020h) that models a cradle-to-gate water purification at the plant via ion exchange at the European average level (EU-28).
Background processes
Background processes were obtained from LCI databases, including GaBi (Sphera Solutions Inc., 2022), Plastics Europe (2019), and ecoinvent (2022). These databases were used for the conventional reference process (fossil EO production), as well as for some input processes (e.g., electricity input).
Cut-off criteria
The LCI used for LCA modeling in GaBi ts 10.6 software cuts ~0.6% of mass flows (reflecting CO, a side product of the electrocatalytic process, which is mixed with the intermediate ethylene stream), which is in line with the common LCA methodology. In EN 15804 (DIN, 2020), which assesses the sustainability of buildings, the following rule was observed: no cut-off stream should contribute more than 1% to the total mass balance and the total cut-off mass should not exceed 5%. The ILCD handbook does not give out numbers but also states that cut-offs cannot be avoided in reality (EC-JRC IES, 2010). Moreover, a well-structured methodological approach is needed, so that no important streams are cut-off because they are “overlooked” (PE International, 2010). In the case of this LCA study, flows were cut-off that referred to special chemicals and chemical formulations that could not be traced back in detail, and therefore are not incorporated in LCA databases, such as catalysts (Guinée et al., 2002).
Electrolyte
For the production of ethylene and hydrogen peroxide from water and CO2, as auxiliary material, an electrolyte is needed. This means a specific salt in an aqueous solution, while some water in this solution is also a reactant. Therefore, the amount of fresh water that needs to be supplied for the chemical reaction was modeled, while the electrolyte salts and surplus water (solvent) were neglected, as they are considered as auxiliary materials that remain stable and within the process, which was found to be crucial for electrochemical CO2 reduction systems (Vennekötter et al., 2019).
Membranes
Additionally, the membrane separates the cathodic and anodic chambers of the electrocatalytic reactor. It has to be replaced regularly, depending on the signs of wear and tear. Consequently, the impact on the environmental performance of the overall process is considered to be rather low at a low replacement frequency. The latter assumption was made in this study; thus, the membrane consumption was not modeled in the LCA.
Impact categories
This LCA evaluates in 11 categories the environmental impact of the novel EO process, where primary energy demand (PED) and global warming potential (GWP) with 100-year time horizon are the most discussed. The calculation is conducted based on the calculation method of CML (Guinée et al., 2001; de Bruijn et al., 2002). Supplementary Table S1 (Supplementary material) provides an overview of the CML-midpoint categories determined.
Sensitivity analysis
For a full LCA analysis, ISO 14044 (ISO, 2006) demands a sensitivity analysis. In contrast, uncertainty analysis is an option (Klöpffer and Grahl, 2009). Concerning the starting point and available methodologies, there are various possibilities for conducting an LCA sensitivity analysis, such as parameter variation (Björklund, 2002), varying time horizons for the impact analysis (Guo and Murphy, 2012) and statistical methods (Heijungs and Huijbregts, 2004).
In this study, arbitrary parameter variation was used, since the range and standard deviation of the parameters strongly depended on the future technological development of the novel process. At the time when this study was undertaken, on one hand, no statistical values (e.g., from the literature) were available; on the other hand, the variation of the input parameters seemed more sensible than a variation of the impact categories' time horizon. It is a one-way sensitivity analysis, that is, one parameter is varied at a time while the others remain constant (except for those that directly depend on the varied parameter). Additionally, modeling choices, such as impacts related to varying process energy sources, are examined by different scenarios.
The objectives of the sensitivity analyses are the parameters of electricity demand [of the electrocatalytic reaction unit (ERU)], as well as the CO2 conversion efficiency. The latter influences the CO2 recycling stream and thus directly influences the energy demand of the ethylene enrichment unit (EEU). The chosen parameters varied in the range of −50 to +50%. The range was not representative in terms of realistic increase/decrease of the parameters but allowed for the identification of promising starting points for further improvement of the technology. The sensitivity analysis was carried out for 2040 scenarios with biogenic CO2 input.
The water demand for conversion to H2O2 and other products decreased from 133% (2030 scenario) to 100% (2040 scenario, equals stoichiometric demand). As it was assumed that surplus water (i.e., electrolyte solution) was recycled at the plant, the impact is considered to be rather low. The need for additional water (e.g., to keep H2O2 in viable concentrations for side-product utilization) was not considered in the LCA based on the lack of available data and experience.
Life cycle inventory analysis Figure 4 shows the relevant process steps and flows of the assessed process. Table 1 summarizes the basic LCI of the process; a more detailed version is provided in the Supplementary Table S3. F1 is the conversion of CO2 to ethylene and side products, and F2 is the surplus CO2 being recycled via the EEU. F4 is the amount of water needed for chemical reactions in the ERU; for the 2030 scenario, a higher water demand (e.g., due to wet product streams) was assumed (F3). The water that was cycled in the ERU and the ethylene oxide unit (EOU) system was not modeled. A1 covers the total electricity demand, and A2 is the steam demand of the EOU. I1 and I2 are the intermediates produced by the ERU, I3 is the ethylene separated by the EEU and further transferred to the EOU, while the remaining ethylene is partially lost via side product streams or recycled to the ERU. P1 is the main product of EO, which has an FU of 1 kg. S1 and S2 accumulate in the ERU, whereas S3 is the surplus H2O2 after the epoxidation process. Direct emissions E1 to E4 are considered, especially for gas splitting processes and residues in (side) product streams. If residues (i.e., CO2, C2H4, CH4) in product streams (mainly S1) would not be considered as loss, most emissions accounted for nearly 0. The modeling scenarios are displayed in Table 2.
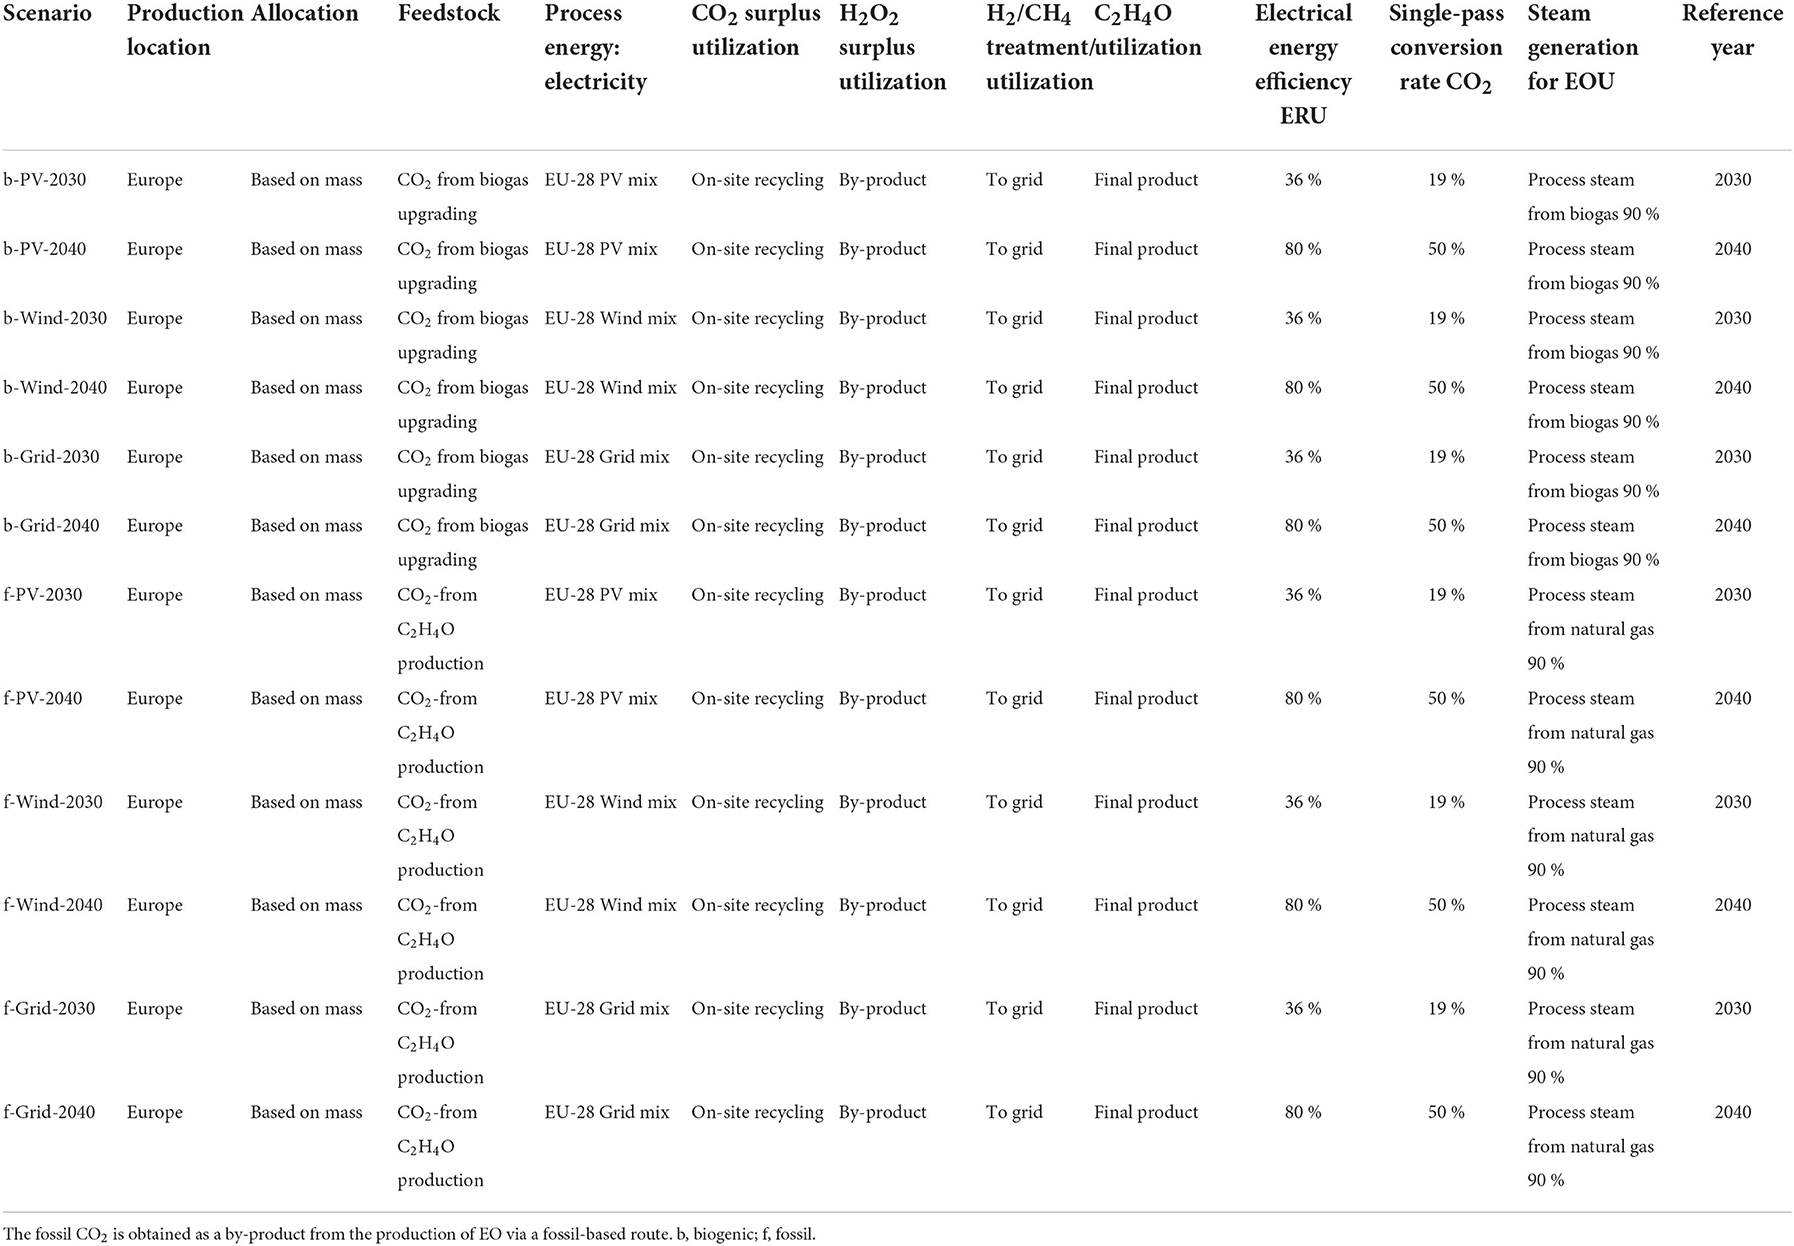
Table 2. Scenarios of the analyzed plant under different conditions using biobased and fossil CO2.
Electrocatalytic production of ethylene and hydrogen peroxide
For the demonstration unit, it was considered that the ERU consists of two parallel half cells, containing the anode chamber (oxidation of water to hydrogen peroxide) and cathode chamber (reduction of CO2 to ethylene). The half-cell reactions took place according to Eq. 1 and Eq. 2 in Table 3, leading to the overall combined reaction (Eq. 3), resulting in C2H4 and H2O2 formation. Furthermore, current densities of 150 to 200 mA/cm2 with an active cell area of 300 cm2 were applied. The applied cell voltage was up to 10 V.

Table 3. Half-cell reactions resulting in C2H4 and H2O2 formation based on CO2 and H2O.
In terms of overall energy efficiency, low voltages and high current densities, in combination with high FEs of the desired products, are determining. Consequently, in the 2030 and 2040 scenarios, lower voltages and higher current densities were assumed for future large-scale applications; however, the key input is the specific energy input, that is, electricity demand over time. For 2030, a voltage efficiency of 36% was assumed (i.e., 4.67 V cell voltage), while in the 2040 scenario, 80% was assumed (i.e., a 2.1 V cell voltage).
Faraday efficiencies of the ERU
For this LCA, a Faraday Efficiency (FE) (a measure for the “selectivity” of an electrochemical reaction) of 48% was assumed for ethylene and hydrogen peroxide in the 2030 and 2040 scenarios. This conservative assumption lies within the wide range of promising laboratory results, which were obtained from the literature [Supplementary Table S4 (ethylene) and Supplementary Table S5 (hydrogen peroxide)] and is congruent with the results of the experimental work conducted within the underlying project of this study (CO2EXIDE, 2018).
CO2 conversion efficiency of the ERU
In addition to the selectivity, the single-pass conversion rate is also important because it affects the overall energy efficiency, as unreacted CO2 has to be separated from the gaseous ethylene and side products and fed back to the cathode (or the CO2 storage system if there is any). CO2 recycling is considered via the EEU and, for the biogenic scenarios, the process integration into a biogas upgrading plant. In the 2030 scenarios, a conservative single-pass conversion rate for CO2 of ~19 % (including conversion to side-products) was considered, based on experimental findings, which is also in the range of ~10 to 50%, as reported in the literature for similar technologies (Kim et al., 2015; Jouny et al., 2018; Jeng and Jiao, 2020). As stated, up to 50% conversion rate (solely to C2H4) could potentially be realized in the future, depending on the electrocatalytic CCU route (Jouny et al., 2018; Jeng and Jiao, 2020). Thus, for the 2040 scenarios, a 50% CO2 conversion rate was assumed, including by-products.
In terms of educt recycling, for the anodic reaction, single-pass conversion is less critical as the overall reactions take place in aqueous solutions. This means that the unreacted water is recycled automatically because of electrolyte cycling. However, for both products, high concentrations are relevant (i.e., C2H4 in the product gas mixture and H2O2 in water) in order to decrease the energy input for product separation and product losses.
Ethylene enrichment unit
For the enrichment of the (intermediate) product ethylene (C2H4), various technologies are available, including physical absorption, pressure swing adsorption (PSA), and membrane separation. In the present study's experimental setup, the EEU was designed as a two-stage membrane separation unit, and the main input was electricity to run the compressors. In the 2030 scenario, ~6 kWh/kg of recovered C2H4 are considered. This specific energy demand also includes the energy demand for CO2 recycling and side product separation. For 2040, this aggregated energy demand was lowered to ~4 kWh/kg of recovered C2H4, as recycled CO2 volumes are lower due to higher single-pass conversion efficiencies. If the specific energy demand is given for CO2 recovered instead of ethylene, it sums up to about 0.3 kWh/kg CO2 (2030 scenario), which is in the range of CO2 gas separation via membrane processes (Gabrielli et al., 2017).
Handling of side products of electrocatalytic reaction
The EEU also separates the unreacted CO2 and other side-products from ethylene. The separated streams can then be recycled on-site (especially CO2), fed into the gas grid (methane and hydrogen to some extent), or sold directly (hydrogen).
Ethylene oxide synthesis
For the production of EO, the anodic intermediate hydrogen peroxide (in aqueous solution) is mixed with the gaseous cathodic intermediate ethylene. In this study, the overall EOU process, including EO sequestration, was modeled as a black-box process.
Ghanta et al. developed and modeled a process chain that converts ethylene and hydrogen peroxide to EO (Ghanta, 2012; Ghanta et al., 2013). According to them, ethylene single-pass conversion rates of +90 and +99% selectivity to EO are possible. We assumed these numbers for the 2030 and 2040 scenarios. Furthermore, unreacted ethylene is recycled in the processes (Ghanta, 2012; Ghanta et al., 2013). Thus, in the present study, a quasi-stoichiometric conversion of ethylene (and hydrogen peroxide) to EO was considered. The specific steam and electricity demands per kg of EO were also based on reported studies (Ghanta, 2012; Ghanta et al., 2013). Lastly, we assumed that any catalyst remains constant and without significant losses in quality in the epoxidation system, that is, no additional processes or flows were modeled that consider auxiliary materials for the epoxidation process.
Reference processes
Considering that ethylene and EO are among the most important chemical intermediates, a variety of production routes have been analyzed previously. Ethylene is predominantly produced from various cracking processes of hydrocarbons of fossil origin (Gao et al., 2019). While there are numerous other production routes for ethylene, such as the Fischer-Tropsch or the methanol-to-olefin (MTO) process, the emphasis should be on the most relevant benchmark, the steam cracker. A comparison of the relevant reference processes of the LCA databases is provided in Figure 5.
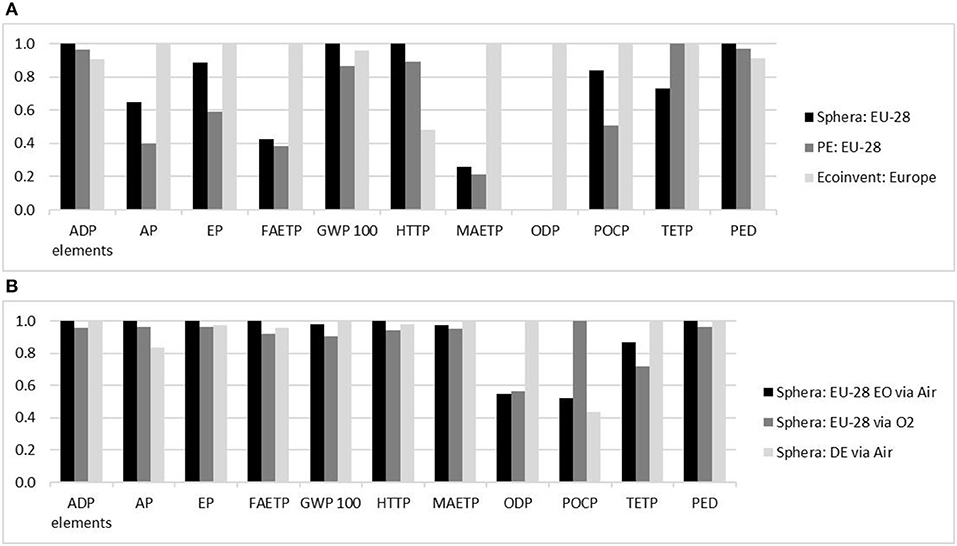
Figure 5. (A) Normalized benchmark for the production of ethylene: Normalized CML results for the production of 1 kg ethylene by processes located in Europe provided by Sphera, PlasticsEurope (PE) and ecoinvent databases. (B) Normalized benchmark for production of ethylene oxide: Normalized CML results for the production of 1 kg EO by processes located in Europe provided by Sphera. Source: Own illustration based on data from (A) (GaBi sphera Plastics Europe, 2008; Hischier, 2010; GaBi sphera, 2020d) and (B) (GaBi sphera, 2020e,f,g).
Results-life cycle impact assessment
Climate change
The CO2 reduction potential (i.e., the GWP of the products) depends mainly on: (1) the amount and type of electricity input (e.g., wind power vs. solar power vs. grid mix); (2) the footprint of the resources used (e.g., fossil CO2 vs. biogenic CO2) and (3) auxiliary materials and other upstream processes. The GWP of EO is shown in Figure 6, wherein the influence of the electricity source used was significant, as becomes even clearer when the detailed GWP is looked into (see stacked diagram in Figures 6, 7). Despite the high PED (Figure 8), negative GWPs can be reached for wind power (2030 and 2040 scenarios) and PV power (2040 scenario). In contrast, if the EU-28 grid-mix is applied, the GWP (2030 scenario) was about 3.6-fold higher than the fossil benchmark. Even with a considerably more energy-efficient process (2040 scenario), the GWP was 1.5-fold higher than that of the fossil benchmark. Considering that ~15 % of the European energy mix is renewable, while the rest is fossil-based or nuclear (Eurostat, 2021), this result is plausible. However, the used EU-28 grid-mix process by GaBi Sphera was a conservative choice, as it results in ~386 g CO2 eq./kWh. In 2019 the EU-27+UK GHG emission factor for electricity was 250 g CO2 eq./kWh and in 2020 about 231 g CO2 eq./kWh for EU-27 (European Energy Agency (ed)., 2021). Thus, the 2019 factor would result in an ~35% less electricity-related GWP of the grid-mix scenarios due to continuous greening of the European grid-mix.
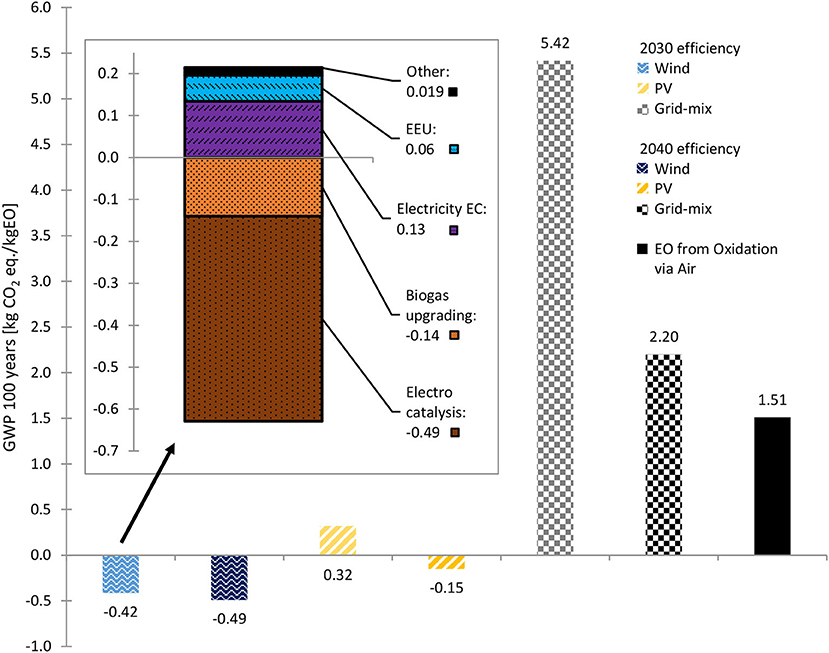
Figure 6. GWP 100 years of 2030 and 2040 biogenic CO2 scenarios with different energy supplies and of conventionally produced EO. Stacked diagram: GWP 100 years share of each process, for 2030 efficiencies, wind power and biogenic CO2. Source: own data and illustration except for data of EO from Oxidation via Air, which are taken from (GaBi sphera, 2020g).
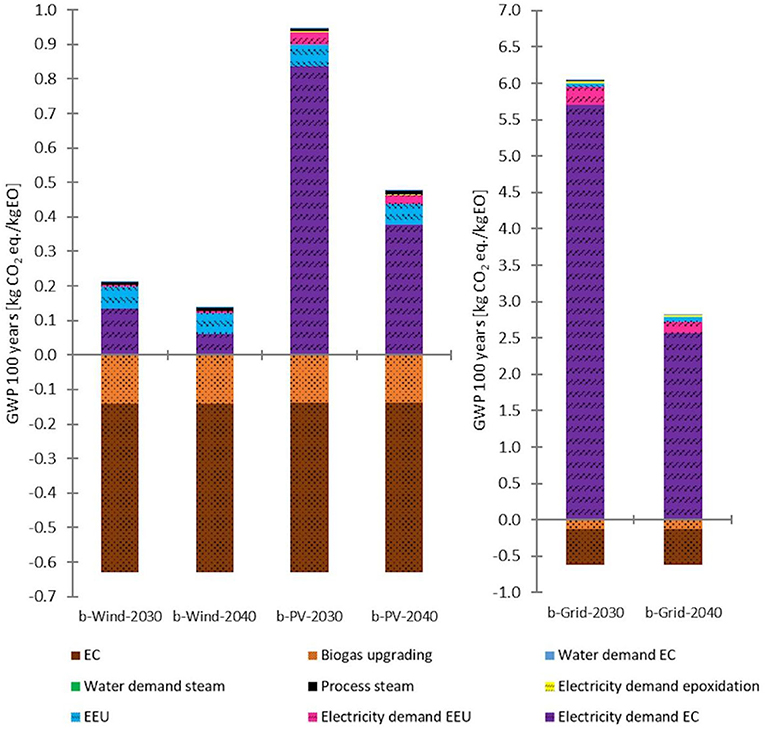
Figure 7. Detailed GWP 100 years of 2030 and 2040 biogenic CO2 (short: b) scenarios with different energy supplies. Left: wind and PV power scenarios. Right: grid-mix scenarios. Source: own data and illustration.
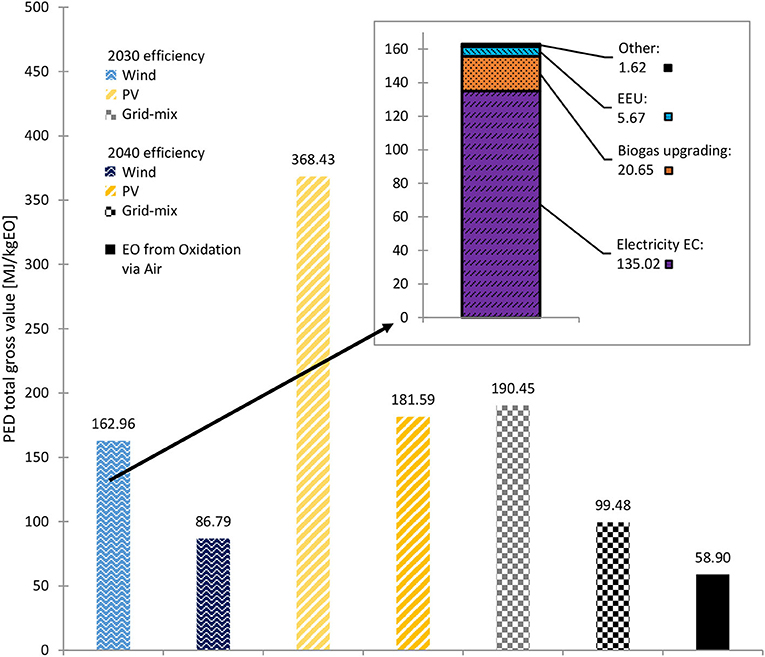
Figure 8. PED of the 2030 and 2040 biogenic CO2 scenarios with different energy supplies and of conventionally produced EO. Stacked diagram: PED share of each process, for 2030 efficiencies, wind power and biogenic CO2. Source: own data and illustration except for data of EO from Oxidation via Air, which are taken from (GaBi sphera, 2020g).
Although wind and solar power generation show no direct GHG emissions, an environmental burden from upstream processing (production and erection of the power plants) is attributed to each kWh produced by wind and PV power plants. This is also valid for all the other environmental impact categories. Concerning the GWP differences of PV and wind power, PV emits an average of 50 g CO2 eq./kWh, depending on the electricity generation capacity and with a wide range from 30 to 80 and higher (Stamford and Azapagic, 2018; Silva and Lerche Raada, 2019). Wind power ranges from 5 to 40 g CO2 eq./kWh, depending on the capacity and onshore/offshore installation (Silva and Lerche Raada, 2019). For both PV and wind power, EU-28 production mixes were used in the LCA (GaBi Sphera processes). The GaBi EU-28 wind power mix resulted in ~9 g CO2 eq./kWh (i.e., in the lower range of the values reported in the literature), while the EU-28 PV power mix resulted in a GWP of 57 g CO2 eq./kWh.
When using CO2 as a side stream from conventional EO production (i.e., fossil CO2) instead of biogenic CO2, the GWP increases by ~0.88 kg CO2 eq./kg EO in each scenario (Supplementary Table S6). However, the impact of the CO2 source is low compared to the type of electricity used.
Figure 7 shows the detailed GWP contribution: the most significant negative impact on the environment has the ERU energy input. However, the overall GWP impact of the wind scenarios results in credits (positive footprint), while for the PV and grid-mix scenarios negative footprints are generated. The GWP credits derive mainly from the bound CO2 within the ethylene/EO, but also due to the carbon credit the biogenic CO2 receives from the allocation of environmental impacts resulting from the biogas production. However, there is no such thing as complete CO2 neutrality or even negativity, especially considering the cradle-to-gate system boundaries. The actual impact on global warming can only be evaluated by full life cycle assessment including EoL treatment or recycling. However, this is only practical with respect to end products-e.g., manufactured from EO-based materials. This means that, at most, a comparative product LCA can be performed, which, however, is out of the scope of this study.
Primary energy demand
The PED of PtX products is likely to be higher than that of their fossil counterparts, as thermodynamically stable chemicals (such as water and carbon dioxide) are converted to other chemicals in endothermic reactions. Additionally, for electrochemically produced products, the desired main reactions compete with other reactions, that is, some of the energy input might be “lost” to unwanted side products. Lastly, economies of scale also play a crucial role. For this LCA, a virtual demonstrator (developed in the underlying research project) was the basis, that is, a plant with a theoretical yearly capacity of ~384 tEO4, which is very low compared to large refineries.
Figure 8 shows the PED of the 2030 and 2040 scenarios with biogenic CO2 input compared to the PED of conventionally produced EO. As can be seen, in the best case (wind 2040), the PED was ~1.47-fold higher than the PED of fossil EO. This is mainly due to the high energy demand of the ERU, which stems partially from a rather low voltage efficiency (36 % referring to all products in 2030, 80% in 2040). A detailed overview of the PED is given in Figure 9.
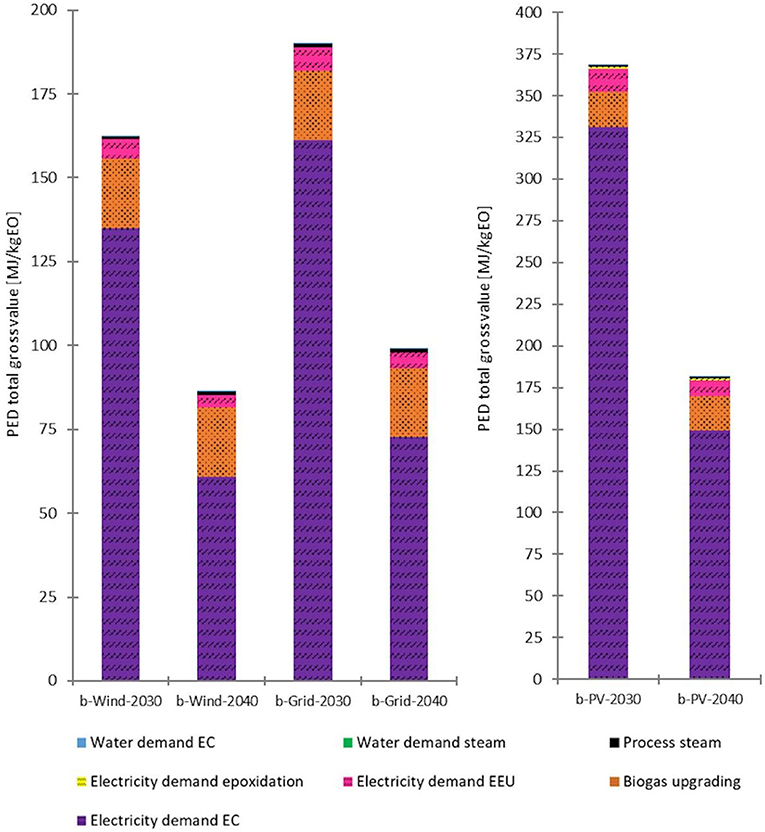
Figure 9. Detailed PED of the 2030 and 2040 biogenic CO2 (short: b) scenarios with different energy supplies. Left: wind power and grid-mix scenarios. Right: PV power scenarios. Source: own data and illustration.
The inset in Figure 8 shows the detailed PED contribution of the 2030 scenario with wind power and biogenic CO2. The most significant impact was the ERU energy input. When PV or grid-mix power are taken into consideration, the results are similar; however, for example, the PED non-renewable accounts for ~3.7% for PV and 62.6% for grid-mix.
CML impact categories
A comparison of the CML impact categories for the 2030 and 2040 biogenic and fossil CO2 scenarios plus the fossil benchmark is provided in the Supplementary material (Supplementary Tables S6, S7). The differences between the scenarios are derived from the type of energy input, steam generation for epoxidation [from biogas or natural gas (GaBi sphera, 2017d,e)], the type of CO2 source, and the efficiencies considered for 2030 and 2040, respectively. The interpretation of each impact category is based on previous studies (Curran, 2012; Acero et al., 2016), as well as case-specific literature.
The abiotic depletion factor of abiotic resources (ADP elements), such as elements and ultimate reserves, is significant for PV power, as the production and installation of common PV plants require various rare elements. As main driver behind this, silver-based metallization pastes have been detected in previous studies (Westaway et al., 2015; Stamford and Azapagic, 2018). In addition to effects in the energy generation chain, the utilization of resources (e.g., water) adds to the ADP elements. Concerning the abiotic depletion potential of fossil resources (ADP fossil), fossil CO2 scenarios (especially grid-mix scenarios), and fossil benchmarks result in significant numbers. This is due to the utilization of fossil sources such as crude oil and derivatives in energy generation, but also as a resource for EO production.
Generally, the impacts of electricity from PV compared to wind power are slightly higher for most indicators. This is likely due to the higher material intensity of PV power plants per MW-installed or kWh-generated compared to wind power plants.
The acidification potential (AP) is mainly related to the emission of SOx, NOx, and NH3 (p. 65/Part 2A/Guinée et al., 2002), which are mainly connected to the production of power plants (PV, wind) and the utilization of fossil fuels (grid mix scenarios) (Bouman, 2020). The higher impact of the biogenic CO2 scenarios compared to the scenarios with fossil CO2 is related to the SOx and NH3 and further trace compounds of biogas (Awe et al., 2017; Paolini et al., 2018), which have a significant impact on acidification. Similar effects have been reported for the eutrophication potential (EP), which is related to biomass production (application of fertilizers, etc.) and biomass storage (Paolini et al., 2018), on the one hand, and NH3 from biogas production on the other hand.
The toxicity potentials (FAETP, MAETP, and HTP) are linked to the emission of toxic substances, such as heavy metals. Related to the location of the plant, these impact categories are less relevant in the overall environmental assessment. The main impact derives from the utilization of fossil fuels, but wind and PV power have some influence as well, which derives from the production and installation phase of the power plants to a great extent. For example, for PV, various metals play a crucial role, such as silver and copper (EC-JRC IES, 2013; Stamford and Azapagic, 2018), as well as chlorine entering fresh water systems (Bouman, 2020). However, the MAETP (and presumably FAETP and HTP) of renewables has not yet been analyzed in detail–for example, for off-shore wind parks, the impact of wind power could be higher in reality (Bouman, 2020). The comparatively low HTP impact of the fossil benchmark is presumably related to its low specific energy demand and allocation effects. Moreover, refineries are one of the most thoroughly optimized production systems available, hence allowing for low emission levels on the overall plant level.
With regards to terrestrial ecotoxicity potential (TETP) (Supplementary Table S6), the credit for the 2030 PV power scenario and all biogenic CO2 2040 scenarios derives from the positive environmental impact of the utilized CO2, which outweighs the negative impact of the energy input of the novel process. For the 2030 wind and grid-mix biogenic CO2 scenarios, the negative impacts of energy generation are dominant, resulting in a TETP footprint. For wind energy, this is presumably related to steel according to other studies (Xu et al., 2018), while for the grid-mix, the impact is assumed to be linked to fossil fuel combustion and waste incineration. The impact of fossil resources is also demonstrated in Supplementary Table S7, as none of the scenarios result in a TETP credit; that is, fossil CO2 is crucial at this point, which is also true for the EO benchmark. Although the latter has a lower impact compared to the fossil CO2 scenarios, this is possibly due to the fact that allocation to various products and the high energy efficiency of refineries results in reduced impacts per kg of product.
The ozone layer depletion potential (ODP) is nearly the same for the fossil and biogenic CO2 scenarios, and the potential nearly fully depends on the type of electricity used, not the type of CO2. The ODP from wind power is based on resins used during production according to other studies (Xu et al., 2018), while for PV fluorine-based compounds considered in the LCA process might play a crucial role (Stamford and Azapagic, 2018).
A significant CML category is the photochemical ozone creation potential (POCP), around 5*10−3 kg ethylene eq. (Supplementary Tables S6, S7). The POCP was significantly higher for the fossil benchmark in all scenarios. The reason for this is the small loss of ethylene caused by the product gas splitting processes (EEU). However, the largest contribution stems from the ethylene produced, which is not separated from the hydrogen side product stream. This means that ethylene leaves the system boundaries. In a conservative assumption, this was considered as loss, which adds to the POCP.
Discussion-life cycle interpretation
Influence of choice of CO2 origin on the environmental impact
The main focus was on available biogenic CO2 to minimize feedstock cost and energy intensity of the novel process, as the effort (energy, cost) for CO2 separation is relatively low for some state-of-the-art processes (e.g., at biogas upgrading plants) (Rodin et al., 2020). In the biogenic scenarios, the CO2 is separated from biogas via membrane separation. The LCA results might be limited, as no further purification of the CO2 was considered at this point. However, previous studies that focused on PtX with biogas as carbon source anticipated no further CO2 gas cleaning as well (Zhang et al., 2020).
In contrast, considering the 2040 energy efficiencies, the novel process leads to a lower GWP of EO based on fossil CO2 than for conventionally produced EO, if solar or wind power are utilized. That is, the process could add to the CO2 reduction goals for refineries while increasing their EO production rates. Despite visible improvements in the environmental impact in several categories for fossil CO2, biogenic CO2 is favored in regard to long-term climate neutrality, as the carbon cycle can be closed.
In short, it was found that the CO2 source itself has a visible impact on the overall performance, leading to the conclusion that biogenic CO2 should be the focus in the long run, also DAC might be an option in the long-term [see (Fasihi et al., 2019)].
Energy efficiency-influence of ERU design
The choice of electricity input has the most significant impact on the environmental performance due to the high energy demand. While all process steps require some electrical input, the by far largest share of electric energy demand is associated with the ERU. The chosen electrodes, catalysts, and electrolytes influence the overall cell potential, as well as the FE of the reaction. In this sense, current density as a metric is of the utmost importance, as it determines the maximum achievable yield of the desired product (Jouny et al., 2018; Na et al., 2019; Anantharaj et al., 2021). Each chamber is supplied with an electrolyte solution.
The demonstrator used for this study has the following specifications: the electrolyte is KHCO3 at different concentrations (Mavrikis et al., 2021). The cathode consists of copper, sputter-deposited on a Freudenberg gas diffusion layer (Cu/GDL) (Bisztyga-Szklarz et al., 2021), while the anode was composed of boron-doped diamond (BDD) (Mavrikis et al., 2020). The chambers are separated by a membrane (e.g., NafionTM), and the overall cell design is comparable to that of commercially available hydrogen PEM cells. The theoretical cell voltage was: 1.760 V−0.064 V = 1.696 V.
Under real conditions, much higher voltages need to be applied because of the cell resistances that must be overcome. Additionally, competitive reactions must be prevented, such as the formation of unwanted hydrocarbons at the cathode or water splitting at the anode. Owing to the temperature sensitivity of the reactions and products (e.g., H2O2 decomposition), the overall cell and the electrolytes need to be kept at a maximum of ~30°C. Further improvements in energy efficiency could reduce cell heating and energy losses.
In short, increasing energy efficiency is the key to achieving environmental and economic feasibility, i.e., meeting or even exceeding the assumptions made for the LCA performed.
Influence of Faraday efficiency
Recent studies have reported an ethylene FE of up to 70% for half-cell assemblies against a reference electrode. Similarly, research on hydrogen peroxide as the final product from the water oxidation reaction has reported selectivities of up to 70% (ZnO @ 3 V vs. RHE), although most catalysts lead to lower FE at the same applied voltage (Kelly et al., 2019). As these results were achieved under laboratory conditions for small-scale cells, often with short-term measurements, lower FEs were assumed for the upscaled demonstrating unit under long-term operation.
Regarding the production of hydrogen peroxide (Supplementary Table S5), a high current density tends to cause low FEs, and vice versa. However, it can be pointed out that a higher current also leads to higher production of hydrogen peroxide. Selected examples of the highest FEs were achieved with K2CO3 as electrolyte, which is too alkaline for hydrogen peroxide and furthers its degradation. An ideal system would employ a high FE, high current density, and therefore high yields.
The FEs of the main and side products (theoretically summing up to a total of 100% for each half cell) depend strongly on future catalyst development. If the FE of ethylene and hydrogen peroxide increases, the FE of the side products decreases. However, the in-/decreases of the individual electrocatalysis products are not necessarily linear but depend on manifold variables, such as cell, catalyst and electrolyte design, which is beyond scope of the current study. Thus, in the analyzed scenarios, the focus was not on FE variation, but other factors, such as energy efficiencies and total conversion rate of CO2 (Section CO2 conversion efficiency of the ERU), especially as most of the side products can be commercialized (hydrogen, methane).
Sensitivity analysis
Parameter variation
Two parameters (electricity demand of ERU; CO2 conversion efficiency) were varied to test their influence on the overall environmental impacts based on the 2040 biogenic CO2 scenarios.
The PED of the ERU was found to have the most significant impact; this was already visible from the differences in the 2030 (36% voltage efficiency) and 2040 (80% voltage efficiency) scenarios. Additionally, the single-pass CO2 conversion rate of the ERU was varied. However, as the unreacted CO2 is recycled, the effects on the environmental impact due to a lower EEU energy demand (due to lower volume flows) is marginal compared to the energy demand of the ERU. Consequently, only the sensitivity analysis hotspot, that is, the effects of the ERU energy demand, are shown in Figure 10.
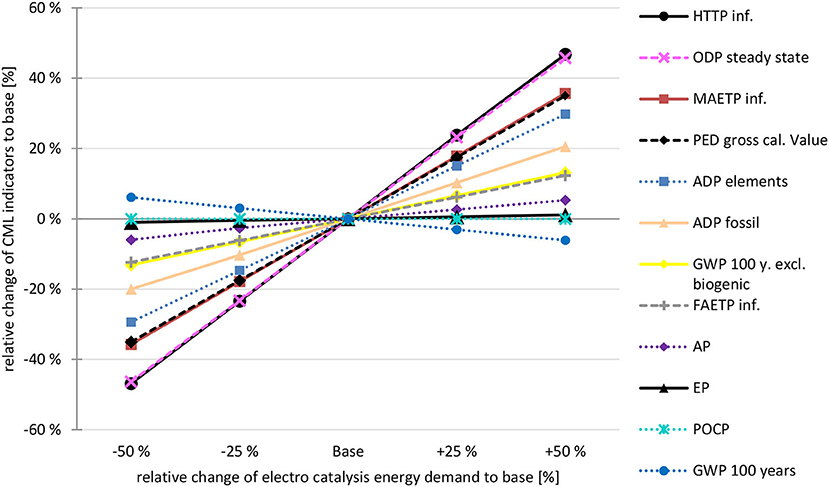
Figure 10. Sensitivity analysis-electro catalysis energy demand Scenario 2040, biogenic CO2, wind power: Influence of decrease / increase of the energy demand of the electro catalysis on the CML categories. Base = scenario 2040, biogenic CO2, wind power. Source: own data and illustration.
The TETP is not shown in Figure 10 as it changes from a credit (−2.56E-03 kg DCB eq. at −50 %) to a burden 1.02E-03 kg DCB eq. at +50 %) as energy demand increases; thus, a calculation of the relative change is not possible. In addition, the relative GWP 100 years indicator shows a decrease with rising energy demand, which is due to reduced GWP credits, that is, the positive environmental effects are reduced. In contrast, GWP excl. biogenic carbon increases, as this indicator is mainly influenced by the energy input, while the credit for the utilized biogenic CO2 is excluded by this indicator.
It is also noteworthy that some indicators showed only a slight change, such as POCP and EP, being mainly influenced by the direct emissions of the novel process to the environment (especially POCP).
Mass allocation
The side products of the ERU amount to < 4 % each in both scenarios, while the ethylene and recycled CO2 carry most of the environmental impacts, see Table 4. As the single-pass conversion rate is increased in the 2040 scenario, the environmental impacts caused at the EEU shift mainly toward the produced ethylene. Thus, the single-pass conversion rate has a significant effect in terms of reduced CO2 storage, venting, and piping systems. As a consequence, the overall size of the plant is reduced, having a direct impact on the material and land use (of the plant itself) as well as economic performance. However, the assessment of these figures was beyond the scope of this study and is an objective for further works.
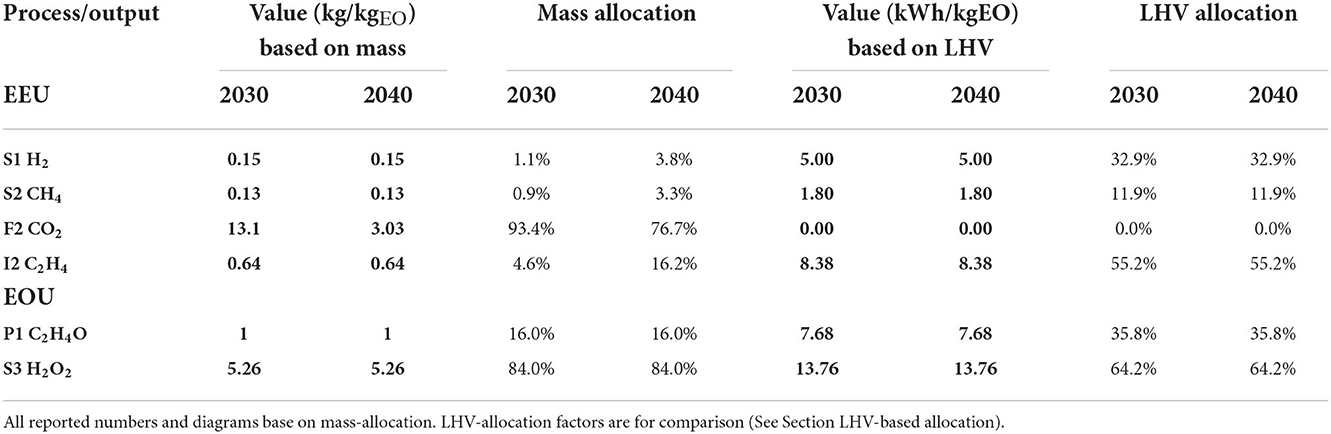
Table 4. Allocation factors for by-product allocation for the scenarios 2030 and 2040.
The EOU performance was the same for both scenarios, as technical development was mainly assumed for the ERU. As can be seen from Table 4, the hydrogen peroxide surplus is more than five times the FU. This means that the intermediate hydrogen peroxide carries the majority (84%) of the EOU emissions, while only 16% of the emissions were attributed to the targeted product. If the ethylene production can be increased, e.g., via optimized cell design that reduces the formation of side products, and hydrogen peroxide production levels are stabilized, the final surplus of hydrogen peroxide could be slightly reduced. This would lead to a higher allocation factor of the EO.
LHV-based allocation
In addition to mass, the impact of the LHV on the allocation factors was assessed. This would lead to a more a balanced allocation between the epoxidation products, i.e., C2H4O and H2O2 surplus (see Table 4). Thus, the specific environmental impact of C2H4O would increase significantly, which would also happen when the amount of H2O2 surplus is reduced due to process optimization (increased TRL). However, when this allocation method is applied to all process steps, this comes with several drawbacks: (i) CO2 has a LHV of 0, thus would not carry any impacts of the upstream-processes, (ii) the impact is shifted to electrocatalytic side products, namely H2 and CH4, which shall be further reduced in their amount with increasing TRL, (iii) C2H4O are traded based on mass, i.e., LHV-based allocation might not be reasonable for environmental product declaration or industry market application, (iv) the recycled CO2 does not carry any impact, thus, the CO2 conversion efficiency has more or less no impact at all.
LCA limitations and future research
Today, LCA is recognized as an important part of environmentally benign process design as its key feature is the holistic approach. As it is a quantitative, data-driven methodology, it is inherently variable due to changing mass and energy balances. Still, the LCA effectively compares different resource alternatives via extensive scenario modeling. Some uncertainties apply to all alternatives (e.g., the carbon footprint of the future electricity mix and changes in CML impacts due to increased recycling quotas of rare elements, as well as the impacts of the agricultural system the CO2 stems from).
Full LCA avoids shifting the environmental impacts between life cycle stages and impact categories, including not only the process, but also the product, supply chains, and even market-mediated effects. Thus, we are aware that the scope of environmental assessment is ideally extended to avoid problem shifting, however, a complete integration of the novel process assessed in the present study is not yet possible for various reasons.
One reason are gaps in reliable LCA data that cannot be accurately closed by prediction models based on the technology status of the subsystems. This includes process parameters on one side, material intensity, and production of the plant parts on the other side. As the process is further refined, more detailed analyses will be possible. In the subsequent sections we highlight some issues that may have a significant impact on the results of future LCAs.
Second, there is a lack of knowledge on the final product applications and pathways of products and by-products. The “cradle-to-gate” approach neglects the product system for which the chemical EO is used. EO can be transferred to hundreds of products. There is no accounting for the EoL of the potential manifold products at which the bound CO2 may be released again. Consequently, the CO2 utilization in the underlying LCA was limited to a certain time frame. CO2 is not released directly, but possibly at a later point in time, for example, when discarded consumer products are thermally valorized. Refer also to Tanzer and Ramírez (2019) on the problem of LCA system boundaries and CO2 negativity. While there is agreement that temporal storage is important and does mitigate climate change on a short scale, it is pointed out that further research on climate models is needed to prove the positive effects on climate change by delaying carbon dioxide emissions for a longer time (Brandão et al., 2013). Therefore, the cradle-to-gate system boundary is appropriate, but challenging in terms of benchmarking, as most renewable products reveal their benefits in the use and EoL phase of their life cycle compared to highly optimized fossil reference products such as EO from refinery side streams.
Finally, the absolute values of some CML categories (such as FAETP, POCP, TETP) (Section CML impact categories and Supplementary Tables S6, S7) are generally very low for the assessed scenarios. Consequently, it is difficult to make a fully reliable distinction and interpretation in relation to the fluctuation range of the primary data.
Tackling CO2 quality issues
It is likely that impurity resistance of the process will be the focus of further research activities, having impact on the ERU and EOU design. Alternatively–or additionally-intensified CO2 purification is likely. In that case, a higher energy demand for the CO2 input flow must be accounted for.
Catalysts, membranes and electrolytes
Stable catalysis is a prerequisite for industrial applications, which was anticipated in this LCA. Ideally, the catalysts required for the electrocatalytic reaction (ERU) and subsequent epoxidation process (EOU) are not used up but remain stable over time. Thus, the catalysts were treated as auxiliary materials and were not modeled in this LCA. In reality, catalysts degenerate of time and further R&D is needed to achieve sensible values for industrial scale production. The fundamentals are partly described by literature (Perry et al., 2020), where the focus is on catalyst development for CO2 reduction. For electrolytes and membranes, the case is similar, a long lifetime of the materials and the type of used chemicals are deciding in terms of economic and environmental performance.
Cooling
Finally, some process steps may afford cooling via air or water. Considering the current TRL (lab-scale experiments, low energy efficiencies), as well as future energy efficiency enhancements, no details on the amounts of waste heat are known from today's point of view. As the reaction temperatures of the electrocatalytic unit are rather low, it is assumed that potential waste heat would be hardly directly utilizable due to the low temperature level. In terms of mass balance, potential cooling media were considered to be not used up, that is, they are neglected in steady-state modeling. Cooling water released to aquatic systems is likely to have an impact due to changes in water temperature (Bloemkolk and van der Schaaf, 1996), a potential impact not covered by the common impact categories.
Side products and intermediates
The valorization of hydrogen and methane should be easily achievable from a technical and economic point of view. In contrary, large amounts of (highly diluted) surplus H2O2 require further R&D activities, which should aim to balance the production rates of ethylene and H2O2 in a way no surplus volumes are generated, which cannot be valorized. If this is not possible via a combined electrocatalytic process, the separate but parallel production of the intermediates in two split half-cells, followed by the epoxidation process, is an option for further developments.
Gas slip
Finally, the ethylene slip must be kept at a minimum level not only for technoeconomic but also environmental reasons (see Section CML impact categories). When the ethylene slip is reduced (or considered “further utilized” in the side product stream), the POCP level is significantly reduced, as shown in Figure 11. Nevertheless, the values were higher than those of the conventionally produced EO. This is due to the high energy demand of the CCU process compared to highly efficient oil refineries, which cause only small burdens per product due to allocation. In addition to ethylene, other volatile organic compounds (VOCs), carbon monoxide (CO), and sulfur dioxide (SO2) are added to POCP (Acero et al., 2016). CO is generated at the ERU; however, it was not further modeled owing to the small amounts being created (cut-off criteria). In addition, the CO created is considered to be recycled within the plant. If CO is emitted to the air, a further increase in the POCP is estimated.
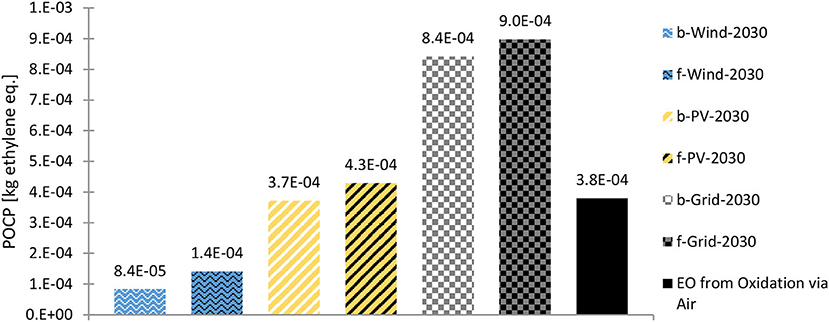
Figure 11. POCP of the 2030 scenarios (biogenic CO2 = b; fossil CO2 = f) with reduced ethylene (and methane) loss and the fossil benchmark. Source: own data and illustration except for data of EO from Oxidation via Air, which are taken from (GaBi sphera, 2020g).
Regulatory framework
In addition to the need for a higher TRL, the regulatory framework at the European level must continue to develop with regard to CCU technologies. In the case of the capture of fossil CO2 and the further use of CO2 in production processes in which CO2 is permanently chemically bound (production of precipitated calcium carbonate), the European Emissions Trading Scheme (European Commission, 2021) provides incentives in that no allowances have to be surrendered for these quantities. On the other hand, an emission factor of zero was set for the biogenic CO2. This means that no certificates must be surrendered for the biogenic CO2 that is emitted. However, if this biogenic CO2 is used further, as described above, there are no further incentives for this. Although from a holistic perspective different effects are achieved for the climate depending on whether biogenic or fossil CO2 is used, in the case of CCU, they are treated in the same way (European Parliament the Council, 2018). This leads to a systemic disadvantage for biogenic CO2 sources, especially in the context of European circular economy and climate goals.
Reference processes
The three benchmarks (see Section Reference processes, Figure 5) all have a similar geographical scope, as they are based on European data. However, the results were significantly different. This may be due to the fact that a refinery affords a very complex LCA model and different decisions on exact system boundaries and cut-off rules influence the final results. For example, the ecoinvent process is also based on the PlasticsEurope ecoprofile and refinery model, but chooses to exclude various inventory items. Sphera's process, on the other hand, is based solely on a steam cracker. These circumstances make exact comparisons difficult. However, despite the ambiguous designs of the reference processes the values deemed more important for this study, GWP and PED, exhibit uniform results with values ranging from 1.43 to 1.49 kg CO2-eq/kg ethylene for the GWP and a PED of 66.9–73.2 MJ/kg ethylene.
Numerous studies have highlighted that ethylene from renewable resources, obtained in processes such as wood gasification (Liptow et al., 2015) or the fermentation of biogenic sugars from sugarcane (van Uytvanck et al., 2014; Oliveira et al., 2020) and subsequent dehydration, have favorable GWP values. Nonetheless, higher values obtained for eutrophication and acidification were a disadvantage. However, an economic process design is difficult to achieve without subsidiaries, even in countries with favorable conditions, such as Brazil. Moreover, these existing plants are also reliant upon first-generation biofuels, which adds another environmental hotspot to the discussion (Mohsenzadeh et al., 2017).
A different approach was reported by Mobley et al. (Mobley et al., 2016, 2017), in which ethylene was oxidized by carbon monoxide, which was obtained by reducing carbon dioxide, catalyzed by mixed-metal oxides. Thus, even negative GWP values per kilogram of EO produced have been reported, albeit on a microreactor scale.
All of the factors discussed are also valid for EO, as they are exclusively produced by the oxidation of ethylene via air or oxygen. Accordingly, a smaller impact for ethylene also implies a smaller impact by EO. A comparison between the selected available EO processes was performed similarly to ethylene, as shown in Figure 5.
The benchmark for the production of EO was much more uniform than that for the production of ethylene. This is due to the fact that the ecoinvent process was excluded, since it did not include any allocation between the byproducts and EO. The processes provided by Sphera include allocation between the EO and the byproduct depending on the process design. The values for the GWP lie between 1.36 and 1.51 kg CO2-eq/ kg EO and the PED ranges from 56.6 to 58.9 MJ/kg EO produced (GaBi sphera, 2020e,f,g).
Another way to reduce the environmental footprint of EO is to avoid oxidation via air or oxygen, as well as unwanted side reactions, with the most important being full oxidation to CO2. Herein, a promising candidate is H2O2, as used in this approach. Ghanta et al. described and simulated a plant in which 200,000 t EO per year are produced using a common approach via oxidation with O2 and an H2O2-based approach. While the traditional approach yielded 3.62 kg CO2-eq/kg EO, the H2O2-based one resulted in 4.11 kg CO2-eq/kg EO. It was concluded that H2O2, commonly produced via the energy-intensive anthraquinone process, needs to come from an environmentally sound alternative (Ghanta et al., 2013; Pangotra et al., 2022), as foreseen in the present study.
Conclusion
Climate change mitigation actions call for the development of carbon reduction and sequestration technologies as well as the development of sustainable substitutes for commonly fossil-based chemicals. In this regard, there is much research on CCU going on. An option is the electrochemical reduction of CO2 to valuable substances, such as ethylene with subsequent synthesis to EO. Thus, our objective was to evaluate the ecological performance, climate change impact, and primary energy demand of a novel electrocatalytic CCU process chain. We performed a cradle-to-gate LCA for this low TRL process to (i) evaluate for the first time its environmental impact compared to its conventional counterpart, i.e., EO produced by steam reforming and oxidation of ethylene with air, and (ii) compare biogenic and fossil CO2 as inputs and (iii) different electricity sources.
The LCA results show that despite the low efficiencies, the novel process can achieve better environmental performance than the conventional process in several categories, if renewable electricity is utilized. With optimized efficiencies, the benefits increase even more. The type of CO2 used has less impact according to this initial assessment. In this regard, it is noteworthy that the circular economy theory balances efficiency vs. (eco-)effectiveness (Borrello et al., 2020). This means, considering the biogenic origin of CO2 and renewable energy input to the processing system, the novel process can be preferable to the conventional process from a circular economy perspective, despite being less energy efficient even under optimized conditions. However, due to technoeconomic limitations of renewable energy production, increased energy efficiency should be in the focus of further R&D activities. Also, various aspects are to be considered in regard to renewable CO2, such as land use and the energy-water-food nexus Thus, further LCAs should focus on different renewable CO2 sources, considering additional impact categories and resource availability over time.
When gray electricity is utilized, the environmental benefits diminish, i.e., the impacts are worse than for the fossil benchmark in most categories. Thus, with respect to the future electricity mix, the analysis shows that a renewable energy mix is out of question, when PtX/CCU technologies shall replace conventional refineries.
Full circularity and a reduction of remaining impacts are not only connected to the upstream production chains of CO2 and renewable energy but also to the optimized plant design and materials. With increasing TRL of the process, LCA practitioners should focus not only on the chemical process chain but also the material expenditure of the electrochemical cell, the enrichment and epoxidation unit.
Finally, the process chain enables decentralized chemical production and an optimized PtX application through matching CO2 and renewable energy sources. In this sense, storage of renewable electricity and full valorization of side products is crucial.
In short, the process can indeed be a carbon sink by concept: basic prerequisites are the full expansion of renewable power generation and optimized process parameters of the electrocatalysis unit.
Data availability statement
The original contributions presented in the study are included in the article/Supplementary material, further inquiries can be directed to the corresponding author.
Author contributions
VR: LCI compilation and LCA development, including modeling, scenarios and result interpretation, literature research and benchmarking, writing, illustration, and revision of the paper. LZ: LCI and LCA review, literature research and benchmarking, writing, and revision of the paper. JL: coordination of the work performed, literature research and guidance on LCI and LCA development, and revision of the paper. CP and DF: discussion and scientific guidance and revision of the paper. All authors contributed to the article and approved the submitted version.
Acknowledgments
This paper is part of the work performed in the EU Horizon 2020 project CO2EXIDE. The authors would like to thank the Energieinstitut an der Johannes Kepler Universität Linz, as well as all direct and indirect contributors to this paper, including all project partners, internal and external reviewers, and all authors, whose work was referenced in this paper. The authors would like to express their gratitude to the European Commission for the financial support of this research within the European Framework Program for Research and Innovation Horizon 2020 (project CO2EXIDE, Grant No. 768789).
Conflict of interest
The authors declare that the research was conducted in the absence of any commercial or financial relationships that could be construed as a potential conflict of interest.
Publisher's note
All claims expressed in this article are solely those of the authors and do not necessarily represent those of their affiliated organizations, or those of the publisher, the editors and the reviewers. Any product that may be evaluated in this article, or claim that may be made by its manufacturer, is not guaranteed or endorsed by the publisher.
Supplementary material
The Supplementary Material for this article can be found online at: https://www.frontiersin.org/articles/10.3389/frsus.2022.799389/full#supplementary-material
Footnotes
1. ^IPCC = Intergovernmental Panel on Climate Change.
2. ^A.SPIRE = Association “Sustainable Process Industry through Resource and Energy Efficiency” (A.SPIRE, 2019).
3. ^1 USD = 0.885 € (EZB, 2022).
4. ^Based on 48 kg/h at 8 000 operating hours per year for 2030 scenario.
References
A.SPIRE (2019). SPIRE | Sustainable Process Industry through Resources an Energy Efficiency. Available online at: https://www.spire2030.eu/ (accessed October 7, 2021).
Acero, A. P., Rodríguez, C., and Ciroth, A. (2016). LCIA Methods-Impact Assessment Methods in Life Cycle Assessment and Their Impact Categories. GreenDelta GmbH Available online at: https://www.openlca.org/wp-content/uploads/2016/08/LCIA-METHODS-v.1.5.5.pdf (accessed July 1, 2021).
Alonso-Fariñas, B., Gallego-Schmid, A., Haro, P., and Azapagic, A. (2018). Environmental assessment of thermo-chemical processes for bio-ethylene production in comparison with bio-chemical and fossil-based ethylene. J. Clean. Prod. 202, 817–829. doi: 10.1016/j.jclepro.2018.08.147
Anantharaj, S., Pitchaimuthu, S., and Noda, S. (2021). A review on recent developments in electrochemical hydrogen peroxide synthesis with a critical assessment of perspectives and strategies. Adv. Colloid Interface Sci. 287, 102331. doi: 10.1016/j.cis.2020.102331
Awe, O. W., Zhao, Y., Nzihou, A., Minh, D. P., and Lyczko, N. (2017). A review of biogas utilisation, purification and upgrading technologies. Waste Biomass Valor. 8, 267–283. doi: 10.1007/s12649-016-9826-4
Bains, P., Psarras, P., and Wilcox, J. (2017). CO2 capture from the industry sector. Prog. Energy Combust. Sci. 63, 146–172. doi: 10.1016/j.pecs.2017.07.001
Barecka, M. H., Ager, J. W., and Lapkin, A. A. (2021). Economically viable CO2 electroreduction embedded within ethylene oxide manufacturing. Energy Environ. Sci. 14, 1530–1543. doi: 10.1039/D0EE03310C
Bassano, C., Deiana, P., Lietti, L., and Visconti, C. G. (2019). P2G movable modular plant operation on synthetic methane production from CO2 and hydrogen from renewables sources. Fuel. 253, 1071–1079. doi: 10.1016/j.fuel.2019.05.074
Biobased Products Working Group Biotechnology Industry Organization. (2010). POSITION PAPER: Principles for the accounting of biogenic carbon in product carbon footprint (PCF) standards. Indust. Biotechnol. 6, 318–320. doi: 10.1089/ind.2010.6.318
Bisztyga-Szklarz, M., Mech, K., Marzec, M., Kalendarev, R., and Szaciłowski, K. (2021). In situ regeneration of copper-coated gas diffusion electrodes for electroreduction of CO2 to ethylene. Materials. 14, 3171. doi: 10.3390/ma14123171
Björklund, A. E. (2002). Survey of approaches to improve reliability in lca. Int. J. LCA. 7, 64. doi: 10.1007/BF02978849
Bloemkolk, J. W., and van der Schaaf, R. J. (1996). Design alternatives for the use of cooling water in the process industry: minimization of the environmental impact from cooling systems. J. Clean. Prod. 4, 21–27. doi: 10.1016/S0959-6526(96)00022-4
BMNT (2019). Long-Term Strategy 2050-Austria. Period through to 2050. Vienna, Austria. Available online at: https://unfccc.int/sites/default/files/resource/LTS1_Austria.pdf (accessed February 4, 2022).
Böhm, H., Zauner, A., Rosenfeld, D. C., and Tichler, R. (2020). Projecting cost development for future large-scale power-to-gas implementations by scaling effects. Appl. Energy. 264, 114780. doi: 10.1016/j.apenergy.2020.114780
Borrello, M., Pascucci, S., and Cembalo, L. (2020). Three propositions to unify circular economy research: a review. Sustainability. 12, 4069. doi: 10.3390/su12104069
Bouman, E. A. (2020). A life cycle perspective on the benefits of renewable electricity generation. European Topic Centre on Climate change mitigation and energy. Available online at: https://www.eionet.europa.eu/etcs/etc-cme/products/etc-cme-reports/etc-cme-report-4-2020-a-life-cycle-perspective-on-the-benefits-of-renewable-electricity-generation (accessed July 1, 2021).
Brandão, M., Levasseur, A., Kirschbaum, M. U. F., Weidema, B. P., Cowie, A. L., Jørgensen, S. V., et al. (2013). Key issues and options in accounting for carbon sequestration and temporary storage in life cycle assessment and carbon footprinting. Int. J. Life Cycle Assess. 18, 230–240. doi: 10.1007/s11367-012-0451-6
CO2EXIDE (2018). CO2EXIDE–CO2-based Electrosynthesis of Ethylene Oxide. Available online at: http://co2exide.eu/ (accessed August 4, 2022).
Cremonese, L., Olfe-Kräutlein, B., Strunge, T., Naims, H., Zimmermann, A., Langhorst, T., et al. (2020). Making Sense of Techno-Economic Assessment and Life Cycle Assessment Studies for CO2 Utilization: A guide on how to commission, understand, and derive decisions from TEA and LCA studies. Global CO2 Initiative, Potsdam, Technical Report, Apr. 2020. doi: 10.3998/2027.42/156039
Curran, M. A. (ed). (2012). Life Cycle Assessment Handbook: a Guide For Environmentally Sustainable Products. Hoboken, NJ: Wiley/Scrivener.
de Bruijn, H., van Duin, R., Huijbregts, M. A. J., Guinee, J. B., Gorree, M., Heijungs, R., et al. (2002). “Main characteristics of LCA,” in Handbook on Life Cycle Assessment Eco-Efficiency in Industry and Science., eds. H. de Bruijn, R. van Duin, M. A. J. Huijbregts, J. B. Guinee, M. Gorree, R. Heijungs, et al. (Dordrecht: Springer Netherlands), 5–10. doi: 10.1007/0-306-48055-7_2
DIN (2020). Sustainability of construction works-Environmental product declarations - Core rules for the product category of construction products. German version EN 15804:2012+A2:2019: Beuth Verlag GmbH.
EC-JRC IES (2010). International Reference Life Cycle Data System (ILCD) Handbook :General Guide For Life Cycle Assessment : Detailed Guidance. LU: Publications Office. Available online at: https://data.europa.eu/doi/10.2788/38479 (accessed September 7, 2021).
EC-JRC IES (2013). Background Analysis of the Quality of the Energy Data to be Considered for the European Reference Life Cycle Database (ELCD). LU: Publications Office. Available online at: https://data.europa.eu/doi/10.2788/5377 (accessed July 1, 2021).
ecoinvent (2022). ecoinvent Database. Available online at: https://ecoinvent.org/the-ecoinvent-database/ (accessed August 5, 2022).
Ericsson, K. (2017). Biogenic Carbon Dioxide as Feedstock For Production of Chemicals and Fuels: A Techno-Economic Assessment With a European Perspective. Lund: Miljö-och energisystem, LTH, Lunds universitet.
European Commission (2016). Horizon 2020 Work Programme 2016-2017 (17. Cross-cutting activities (Focus Areas)). Available online at: https://ec.europa.eu/research/participants/data/ref/h2020/wp/2016_2017/main/h2020-wp1617-focus_en.pdf
European Commission (2019). The European Green Deal. Brussels. Available online at: https://eur-lex.europa.eu/legal-content/EN/ALL/?uri=CELEX:52019DC0640 (accessed February 4, 2022).
European Commission (2020). Circular Economy Action Plan. #EUGreenDeal. Available online at: https://ec.europa.eu/environment/pdf/circular-economy/new_circular_economy_action_plan.pdf (accessed February 4, 2022).
European Commission (2021). European Commission EU Emissions Trading System (EU ETS). Available online at: https://ec.europa.eu/clima/eu-action/eu-emissions-trading-system-eu-ets_en (accessed October 7, 2021).
European Energy Agency (ed). (2021). Greenhouse gas emission intensity of electricity generation in Europe: online data set. Available online at: https://www.eea.europa.eu/ims/greenhouse-gas-emission-intensity-of-1 (accessed February 1, 2022).
European Parliament and the Council (2018). Commission implementing regulation (EU) 2018/2066 on the monitoring and reporting of greenhouse gas emissions pursuant to Directive 2003/87/EC of the European Parliament and of the Council and amending Commission Regulation (EU) No 601/2012 (Text with EEA relevance). Available online at: https://eur-lex.europa.eu/legal-content/EN/TXT/?uri=uriserv:OJ.L_.2018.334.01.0001.01.ENG (accessed July 5, 2021).
Eurostat (2021). Shedding light on energy on the EU: Where does our energy come from? Shedding Light on Energy On the EU. Available online at: https://ec.europa.eu/eurostat/cache/infographs/energy/bloc-2a.html (accessed June 30, 2021).
EZB (2022). Jährliche Entwicklung des Wechselkurses des Euro gegenüber dem US-Dollar von 1999 bis 2021. Statista. Available online at: https://de.statista.com/statistik/daten/studie/200194/umfrage/wechselkurs-des-euro-gegenueber-dem-us-dollar-seit-2001/ (accessed February 18, 2022).
Fasihi, M., Efimova, O., and Breyer, C. (2019). Techno-economic assessment of CO2 direct air capture plants. J. Clean. Prod. 224, 957–980. doi: 10.1016/j.jclepro.2019.03.086
GaBi spher (2020h). Process data set: Water (desalinated; deionised); via ion exchange; single route, at plant; 1000 kg/m3, 18 g/mol (en). Available online at: http://gabi-documentation-2021.gabi-software.com/xml-data/processes/ded83dc7-a169-4de2-af43-ed30a5e2bb00.xml (accessed October 9, 2021).
GaBi sphera (2017a). Process data set: electricity from photovoltaic; AC, technology mix of CIS, CdTE, mono crystalline and multi crystalline; production mix, at plant; 1kV-60kV (en). Available online at: http://gabi-documentation-2021.gabi-software.com/xml-data/processes/d2842400-7718-47e1-8fea-6b35dbce7b80.xml (accessed October 19, 2021).
GaBi sphera (2017b). Process data set: Electricity from wind power; AC, technology mix of onshore and offshore; production mix, at plant; 1kV-60kV (en). Available online at: http://gabi-documentation-2021.gabi-software.com/xml-data/processes/fe1c3d03-072b-4da7-8fff-3505f9b01efc.xml (accessed October 19, 2021).
GaBi sphera (2017c). Process data set: Electricity grid mix; AC, technology mix; consumption mix, to consumer;<1kV (en). Available online at: http://gabi-documentation-2021.gabi-software.com/xml-data/processes/001b3cb7-b868-4061-8a91-3e6d7bcc90c6.xml (accessed October 19, 2021).
GaBi sphera (2017d). Process data set: Process steam from biogas 90%; technology mix regarding firing and flue gas cleaning; production mix, at heat plant; MJ, 90% efficiency (en). Available online at: http://gabi-documentation-2021.gabi-software.com/xml-data/processes/363c5d1c-8797-491f-8234-12b925ea5aa9.xml (accessed October 19, 2021).
GaBi sphera (2017e). Process data set: Process steam from natural gas 90%; technology mix regarding firing and flue gas cleaning; production mix, at heat plant; MJ, 90% efficiency (en). Available online at: http://gabi-documentation-2021.gabi-software.com/xml-data/processes/d8454c30-29f7-4767-a067-978ea0447ca1.xml (accessed October 19, 2021).
GaBi sphera (2020a). Process data set: Biogas from biomass mix for bioenergy (2015); technology mix/ anaerobic fermentation of different organic matter to biogas via wet fermentation; production mix, at plant; 59% methane content, 36 MJ/m3 (en). Available online at: http://gabi-documentation-2021.gabi-software.com/xml-data/processes/2d9aa763-eb16-477d-9bd1-dd1186ec177a.xml (accessed October 4, 2021).
GaBi sphera (2020b). Process data set: Carbon dioxide by-product ethylene oxide (EO) via air; oxidation of ethylene with air; single route, at plant; 1.98 kg/m3, 44.01 g/mol (en). Available online at: http://gabi-documentation-2021.gabi-software.com/xml-data/processes/d7caf71e-2b4f-4c56-9ad7-7b7927dda1ca.xml (accessed October 4, 2021).
GaBi sphera (2020c). Process data set: Ethene (ethylene); steam cracker, from naphtha; production mix, at plant; 1.178 kg/m3, 28 g/mol (en) - DE. Available online at: http://gabi-documentation-2021.gabi-software.com/xml-data/processes/cbb41aae-8015-41ab-9826-a4fe353fddcd.xml (accessed March 3, 2021).
GaBi sphera (2020d). Process data set: Ethene (ethylene); steam cracker, from naphtha; production mix, at plant; 1.178 kg/m3, 28 g/mol (en) - EU-28. Available online at: http://gabi-documentation-2021.gabi-software.com/xml-data/processes/45e41797-e9a1-4ee9-af29-75ae71d1943f.xml (accessed October 19, 2021).
GaBi sphera (2020e). Process data set: Ethylene oxide (EO) by-product carbon dioxide via air; purified, oxidation of ethylene with air; production mix, at plant; 0.882 g/mL, 44 g/mol (en). Available online at: http://gabi-documentation-2021.gabi-software.com/xml-data/processes/c5838109-3872-4c95-9694-45fabd097a94.xml (accessed September 20, 2021).
GaBi sphera (2020f). Process data set: Ethylene oxide (EO) by-product ethylene glycol via O2/methane; oxidation of ethylene with oxygen; production mix, at plant; 1.93 kg/m3, 44.05 g/mol (en). Available online at: http://gabi-documentation-2021.gabi-software.com/xml-data/processes/225067a6-81c6-4734-8332-14fd96df57c3.xml (accessed March 4, 2021).
GaBi sphera (2020g). Process data set: Ethylene oxide (EO) via air; purified, oxidation of ethylene with air; production mix, at plant; 0.882 g/mL, 44 g/mol (en). Available online at: http://gabi-documentation-2021.gabi-software.com/xml-data/processes/44151e57-4978-4c10-9b4c-705dd899a8d7.xml (accessed September 20, 2021).
GaBi sphera and Plastics Europe (2008). Process data set: Ethylene; production mix, at plant; (en). Available online at: http://gabi-documentation-2021.gabi-software.com/xml-data/processes/b748263b-2419-415b-98a1-cd78f7e6fc77.xml (accessed September 20, 2021).
Gabrielli, P., Gazzani, M., and Mazzotti, M. (2017). On the optimal design of membrane-based gas separation processes. J. Membr. Sci. 526, 118–130. doi: 10.1016/j.memsci.2016.11.022
Gao, Y., Neal, L., Ding, D., Wu, W., Baroi, C., Gaffney, A. M., et al. (2019). Recent advances in intensified ethylene production—a review. ACS Catal. 9, 8592–8621. doi: 10.1021/acscatal.9b02922
Ghanta, M. (2012). Development of an economically viable H2O2-based, liquid-phase ethylene oxide technology: reactor engineering and catalyst development studies. Dissertation, University of Kansas, Kansas, USA. p. 258. Available online at: http://hdl.handle.net/1808/11473
Ghanta, M., Ruddy, T., Fahey, D., Busch, D., and Subramaniam, B. (2013). Is the liquid-phase H2O2-based ethylene oxide process more economical and greener than the gas-phase O2-based silver-catalyzed process? Ind. Eng. Chem. Res. 52, 18–29. doi: 10.1021/ie301601y
Global CCS Institute and Parsons Brinckerhoff (2011). Accelerating The Uptake Of CCS: Industrial Use Of Captured Carbon Dioxide. Available online at: https://www.globalccsinstitute.com/archive/hub/publications/14026/accelerating-uptake-ccs-industrial-use-captured-carbon-dioxide.pdf (accessed February 18, 2021).
Goor, G., Glenneberg, J., Jacobi, S., Dadabhoy, J., and Candido, E. (2019). “Hydrogen Peroxide,” in Ullmann's Encyclopedia of Industrial Chemistry (Weinheim, Germany: Wiley-VCH Verlag GmbH and Co. KGaA), 1–40. doi: 10.1002/14356007.a13_443.pub3
Götz, M., Lefebvre, J., Mörs, F., McDaniel Koch, A., Graf, F., Bajohr, S., et al. (2016). Renewable power-to-gas: a technological and economic review. Renew. Energy. 85, 1371–1390. doi: 10.1016/j.renene.2015.07.066
Guinée, J. B., Gorrée, M., Heijungs, R., Huppes, G., Kleijn, R. eds., et al. (2002). Handbook on Life Cycle Assessment: Operational Guide to the ISO Standards. Dordrecht; Boston: Kluwer Academic Publishers.
Guinée, J. B., Huppes, G., and Heijungs, R. (2001). Developing an LCA guide for decision support. Env. Mgmt. Health. 12, 301–311. doi: 10.1108/09566160110392416
Guo, M., and Murphy, R. J. (2012). LCA data quality: sensitivity and uncertainty analysis. Sci. Total Environ. 435–436, 230–243. doi: 10.1016/j.scitotenv.2012.07.006
Heijungs, R., and Guinée, J. B. (2007). Allocation and ‘what-if' scenarios in life cycle assessment of waste management systems. Waste Manag. 27, 997–1005. doi: 10.1016/j.wasman.2007.02.013
Heijungs, R., and Huijbregts, M. A. J. (2004). “A Review of Approaches to Treat Uncertainty in LCA” in Complexity and Integrated Resource Management - International Congress on Environmental Modelling and Software (Osnabrück, Germany), 9. Available online at: https://scholarsarchive.byu.edu/iemssconference/2004/all/197 (accessed May 26, 2021).
IEA ICCA DECHEMA. (2013). Technology Roadmap-Energy and GHG Reductions in the Chemical Industry via Catalytic Processes. Available online at: https://dechema.de/dechema_media/Downloads/Positionspapiere/IndustrialCatalysis/Chemical_Roadmap_2013_Final_WEB.pdf (accessed September 29, 2021).
IPCC (2014). “Contribution of Working Groups I, II and III to the Fifth Assessment Report of the Intergovernmental Panel on Climate Change” in: Climate Change 2014: Synthesis Report, eds. Core Writing Team, R. K. Pachauri, and L. A. Meyer (Geneva, Switzerland: IPCC).
IPCC (2021a). Climate Change 2021: The Physical Science Basis. Contribution of Working Group I to the Sixth Assessment Report of the Intergovernmental Panel on Climate Change. Cambridge University Press: Cambridge University Press. Available online at: https://www.ipcc.ch/report/sixth-assessment-report-working-group-i/ (accessed December 3, 2021).
IPCC (2021b). “Summary for Policymakers: Masson-Delmotte, V., P. Zhai, A. Pirani, S.L Connors, C. Péan, S. Berger, N. Caud, Y. Chen, L. Goldfarb, M.I. Gomis, M. Huang, K. Leitzell, E. Lonnoy, J.B.R. Matthews, T.K. Maycock, T. Waterfield, O. Yelekçi, R. Yu, and B. Zhou (eds.),” in Climate Change 2021: The Physical Science Basis. Contribution of Working Group I to the Sixth Assessment Report of the Intergovernmental Panel on Climate Change, eds. V. Masson-Delmotte, P. Zhai, A. Pirani, S. L. Connors, C. Péan, S. Berger, et al. (Cambridge University Press: Cambridge University Press). Available online at: https://www.ipcc.ch/report/ar6/wg1/downloads/report/IPCC_AR6_WGI_SPM_final.pdf (accessed December 3, 2021).
ISO (2006). ISO14044:2006(en), Environmental management—Life cycle assessment—Requirements and guidelines. Available online at: https://www.iso.org/obp/ui/#iso:std:iso:14044:ed-1:v1:en (accessed March 10, 2021).
Jeng, E., and Jiao, F. (2020). Investigation of CO2 single-pass conversion in a flow electrolyzer. React. Chem. Eng. 5, 1768–1775. doi: 10.1039/D0RE00261E
Jin, S., Hao, Z., Zhang, K., Yan, Z., and Chen, J. (2021). Advances and challenges for the electrochemical reduction of CO2 to CO: from fundamentals to industrialization. Angewandte Chemie Intl Edit. 60, 20627–20648. doi: 10.1002/anie.202101818
Jouny, M., Luc, W., and Jiao, F. (2018). General techno-economic analysis of CO 2 electrolysis systems. Ind. Eng. Chem. Res. 57, 2165–2177. doi: 10.1021/acs.iecr.7b03514
Kelly, S. R., Shi, X., Back, S., Vallez, L., Park, S. Y., Siahrostami, S., et al. (2019). ZnO as an active and selective catalyst for electrochemical water oxidation to hydrogen peroxide. ACS Catal. 9, 4593–4599. doi: 10.1021/acscatal.8b04873
Kibria Nabil, S., McCoy, S., and Kibria, M. G. (2021). Comparative life cycle assessment of electrochemical upgrading of CO2 to fuels and feedstocks. Green Chem. 23, 867–880. doi: 10.1039/D0GC02831B
Kim, B., Ma, S., Molly Jhong, H.-R., and Kenis, P. J. A. (2015). Influence of dilute feed and pH on electrochemical reduction of CO2 to CO on Ag in a continuous flow electrolyzer. Electrochimica Acta. 166, 271–276. doi: 10.1016/j.electacta.2015.03.064
Klöpffer, W., and Grahl, B. (2009). Ökobilanz (LCA): ein Leitfaden für Ausbildung und Beruf. Weinheim: Wiley-VCH.
Koornneef, J., van Breevoort, P., Hendriks, C., Hoogwijk, M., Koop, K., Koper, M., et al. (2011). Potential for Biomass and Carbon Dioxide Capture and Storage. Cheltenham, UK: IEAGHG. Available online at: https://ieaghg.org/docs/General_Docs/Reports/2013-11.pdf (accessed February 18, 2021).
Liptow, C., Tillman, A.-M., and Janssen, M. (2015). Life cycle assessment of biomass-based ethylene production in Sweden—is gasification or fermentation the environmentally preferable route? Int. J. Life Cycle Assess. 20, 632–644. doi: 10.1007/s11367-015-0855-1
Liu, Y., Li, F., Zhang, X., and Ji, X. (2020). Recent progress on electrochemical reduction of CO2 to methanol. Curr. Opin. Green sustain. Chem. 23, 10–17. doi: 10.1016/j.cogsc.2020.03.009
Masel, R. I., Liu, Z., Yang, H., Kaczur, J. J., Carrillo, D., Ren, S., et al. (2021). An industrial perspective on catalysts for low-temperature CO2 electrolysis. Nat. Nanotechnol. 16, 118–128. doi: 10.1038/s41565-020-00823-x
Mavrikis, S., Göltz, M., Rosiwal, S., Wang, L., and Ponce de León, C. (2020). Boron-doped diamond electrocatalyst for enhanced anodic H2O2 production. ACS Appl. Energy Mater. 3, 3169–3173. doi: 10.1021/acsaem.0c00093
Mavrikis, S., Perry, S. C., Leung, P. K., Wang, L., and Ponce de León, C. (2021). Recent advances in electrochemical water oxidation to produce hydrogen peroxide: a mechanistic perspective. ACS Sustainable Chem. Eng. 9, 76–91. doi: 10.1021/acssuschemeng.0c07263
Mobley, P. D., Lail, M., Peters, J. E., Akunuri, N., and Hlebak, J. Climate Change and Emissions Management Corporation. (2016). Captured-CO2 Catalyst for the Production of Ethylene Oxide (C3-PEO): Final Outcomes Report Non-Confidential.
Mobley, P. D., Peters, J. E., Akunuri, N., Hlebak, J., Gupta, V., Zheng, Q., et al. (2017). Utilization of CO2 for ethylene oxide. Energy Procedia. 114, 7154–7161. doi: 10.1016/j.egypro.2017.03.1878
Mohsenzadeh, A., Zamani, A., and Taherzadeh, M. J. (2017). Bioethylene production from ethanol: a review and techno-economical evaluation. ChemBioEng Rev. 4, 75–91. doi: 10.1002/cben.201600025
Mordor Intelligence (2020). Ethylene Oxide Market-Growth, Trends, COVID-19 Impact, and Forecasts (2021-2026). Available online at: https://www.mordorintelligence.com/industry-reports/ethylene-oxide-market (accessed July 7, 2021).
Müller, L. J., Kätelhön, A., Bachmann, M., Zimmermann, A., Sternberg, A., and Bardow, A. (2020). A guideline for life cycle assessment of carbon capture and utilization. Front. Energy Res. 8, 15. doi: 10.3389/fenrg.2020.00015
Na, J., Seo, B., Kim, J., Lee, C. W., Lee, H., Hwang, Y. J., et al. (2019). General technoeconomic analysis for electrochemical coproduction coupling carbon dioxide reduction with organic oxidation. Nat. Commun. 10, 5193. doi: 10.1038/s41467-019-12744-y
Oliveira, C. C. N., Rochedo, P. R. R., Bhardwaj, R., Worrell, E., and Szklo, A. (2020). Bio-ethylene from sugarcane as a competitiveness strategy for the Brazilian chemical industry. Biofuels, Bioprod. Bioref. 14, 286–300. doi: 10.1002/bbb.2069
Otto, A. (2015). Chemische, verfahrenstechnische und ökonomische Bewertung von Kohlendioxid als Rohstoff in der chemischen Industrie. Available online at: https://inis.iaea.org/collection/NCLCollectionStore/_Public/47/088/47088808.pdf?r=1 (accessed February 17, 2022).
Pangotra, D., Csepei, L.-I., Roth, A., Ponce de León, C., Sieber, V., and Vieira, L. (2022). Anodic production of hydrogen peroxide using commercial carbon materials. Appl. Catal. B: Environ. 303, 120848. doi: 10.1016/j.apcatb.2021.120848
Paolini, V., Petracchini, F., Segreto, M., Tomassetti, L., Naja, N., and Cecinato, A. (2018). Environmental impact of biogas: a short review of current knowledge. J Environ Sci Health A. 53, 899–906. doi: 10.1080/10934529.2018.1459076
PE International, GaBi Software, and University of Stuttgart. (2010). GaBi Education-Handbook for Life Cycle Assessment (LCA)-Using the GaBi Education Software Package. Available online at: https://gabi.sphera.com/fileadmin/gabi/tutorials/Paperclip_Tutorial_Handbook_4.4.pdf (accessed September 7, 2021).
Pei, Y., Zhong, H., and Jin, F. (2021). A brief review of electrocatalytic reduction of CO2—Materials, reaction conditions, and devices. Energy Sci. Eng. 9, 1012–1032. doi: 10.1002/ese3.935
Perry, S. C., Leung, P., Wang, L., and Ponce de León, C. (2020). Developments on carbon dioxide reduction: their promise, achievements, and challenges. Curr. Opin. Electrochem. 20, 88–98. doi: 10.1016/j.coelec.2020.04.014
Plastics Europe (2019). Plastics Europe Public LCI Database. Available online at: https://plasticseurope.lca-data.com/selectUILanguage.xhtml (accessed August 5, 2021).
Poeschl, M., Ward, S., and Owende, P. (2012). Environmental impacts of biogas deployment–Part I: life cycle inventory for evaluation of production process emissions to air. J. Clean. Prod. 24, 168–183. doi: 10.1016/j.jclepro.2011.10.039
Portz, H. (2005). Brand- und Explosionsschutz von A-Z. Wiesbaden: Springer Fachmedien Wiesbaden. doi: 10.1007/978-3-322-80197-5
Proietto, F., Patel, U., Galia, A., and Scialdone, O. (2021). Electrochemical conversion of CO2 to formic acid using a Sn based electrode: a critical review on the state-of-the-art technologies and their potential. Electrochimica Acta. 389, 138753. doi: 10.1016/j.electacta.2021.138753
Reiter, G., and Lindorfer, J. (2015). Evaluating CO2 sources for power-to-gas applications–A case study for Austria. J. CO2 Util. 10, 40–49. doi: 10.1016/j.jcou.2015.03.003
Rezvani Ghomi, E. R., Khosravi, F., Saedi Ardahaei, A. S., Dai, Y., Neisiany, R. E., Foroughi, F., et al. (2021). The life cycle assessment for polylactic acid (PLA) to make it a low-carbon material. Polymers. 13, 1854. doi: 10.3390/polym13111854
Rodin, V., Lindorfer, J., Böhm, H., and Vieira, L. (2020). Assessing the potential of carbon dioxide valorisation in Europe with focus on biogenic CO2. J. CO2 Util. 41, 101219. doi: 10.1016/j.jcou.2020.101219
Romeo, L. M., Cavana, M., Bailera, M., Leone, P., Peña, B., and Lisbona, P. (2022). Non-stoichiometric methanation as strategy to overcome the limitations of green hydrogen injection into the natural gas grid. Appl. Energy. 309, 118462. doi: 10.1016/j.apenergy.2021.118462
Saravanan, A., Senthil kumar, P., Vo, D.-V. N., Jeevanantham, S., Bhuvaneswari, V., Anantha Narayanan, V., et al. (2021). A comprehensive review on different approaches for CO2 utilization and conversion pathways. Chem. Eng. Sci. 236, 116515. doi: 10.1016/j.ces.2021.116515
Silva, M., and Lerche Raada, H. (2019). Life cycle GHG emissions of renewable and non-renewable electricity generation technologies. Part of the RE-Invest project. Available at: https://reinvestproject.eu/wp-content/uploads/2019/11/OR_RE-INVEST_Life-cycle-GHG-emissions-of-renewable-and-non-renewable-electricity.pdf (accessed June 30, 2020).
Sphera Solutions Inc. (2021). Life Cycle Assessment LCA Software. Available online at: https://gabi.sphera.com/international/index/ (accessed October 7, 2021).
Sphera Solutions Inc. (2022). GaBi LCA Databases. Available online at: https://gabi.sphera.com/databases/gabi-databases/ (accessed August 5, 2021).
Stamford, L., and Azapagic, A. (2018). Environmental impacts of photovoltaics: the effects of technological improvements and transfer of manufacturing from Europe to China. Energy Technol. 6, 1148–1160. doi: 10.1002/ente.201800037
Statista (2022). Ethylene production capacity globally 2024. Statista. Available online at: https://www.statista.com/statistics/1067372/global-ethylene-production-capacity/ (accessed July 7, 2021).
Statista AgileIntel Research (ChemIntel360) (2021). Ethylene oxide global market volume 2015-2026. Statista. Available online at: https://www.statista.com/statistics/1245260/ethylene-oxide-market-volume-worldwide/ (accessed November 10, 2021).
Tanzer, S. E., and Ramírez, A. (2019). When are negative emissions negative emissions? Energy Environ. Sci. 12, 1210–1218. doi: 10.1039/C8EE03338B
van Uytvanck, P. P., Hallmark, B., Haire, G., Marshall, P. J., and Dennis, J. S. (2014). Impact of biomass on industry: using ethylene derived from bioethanol within the polyester value chain. ACS Sustainable Chem. Eng. 2, 1098–1105. doi: 10.1021/sc5000804
Vennekötter, J.-B., Scheuermann, T., Sengpiel, R., and Wessling, M. (2019). The electrolyte matters: Stable systems for high rate electrochemical CO2 reduction. J. CO2 Util. 32, 202–213. doi: 10.1016/j.jcou.2019.04.007
Westaway, R., Younger, P. L., and Cornelius, C. (2015). Comment on ‘Life cycle environmental impacts of UK shale gas' by L. Stamford and A. Azapagic. Applied Energy, 134, 506–518, 2014. Appl. Energy. 148, 489–495. doi: 10.1016/j.apenergy.2015.03.008
Xu, L., Pang, M., Zhang, L., Poganietz, W.-R., and Marathe, S. D. (2018). Life cycle assessment of onshore wind power systems in China. Resour. Conserv. Recycl. 132, 361–368. doi: 10.1016/j.resconrec.2017.06.014
Yaashikaa, P. R., Senthil Kumar, P., Varjani, S. J., and Saravanan, A. (2019). A review on photochemical, biochemical and electrochemical transformation of CO2 into value-added products. J. CO2 Util. 33, 131–147. doi: 10.1016/j.jcou.2019.05.017
Zakkour, P., and Cook, G. (2010). CCS Roadmap for Industry: High-purity CO2 sources Sectoral Assessment–Final Report. Available online at: http://dx.doi.org/10.13140/RG.2.1.3717.8722 (accessed February 18, 2021).
Zeilerbauer, L., Lindorfer, J., Süss, R., and Kamm, B. (2022). Techno-economic and life-cycle assessment of a wood chips-based organosolv biorefinery concept for production of lignin monomers and oligomers by base-catalyzed depolymerization. Biofuels Bioprod. Bioref. 16, 370–388. doi: 10.1002/bbb.2315
Zhang, X., Witte, J., Schildhauer, T., and Bauer, C. (2020). Life cycle assessment of power-to-gas with biogas as the carbon source. Sustain. Energy Fuels. 4, 1427–1436. doi: 10.1039/C9SE00986H
Abbreviations
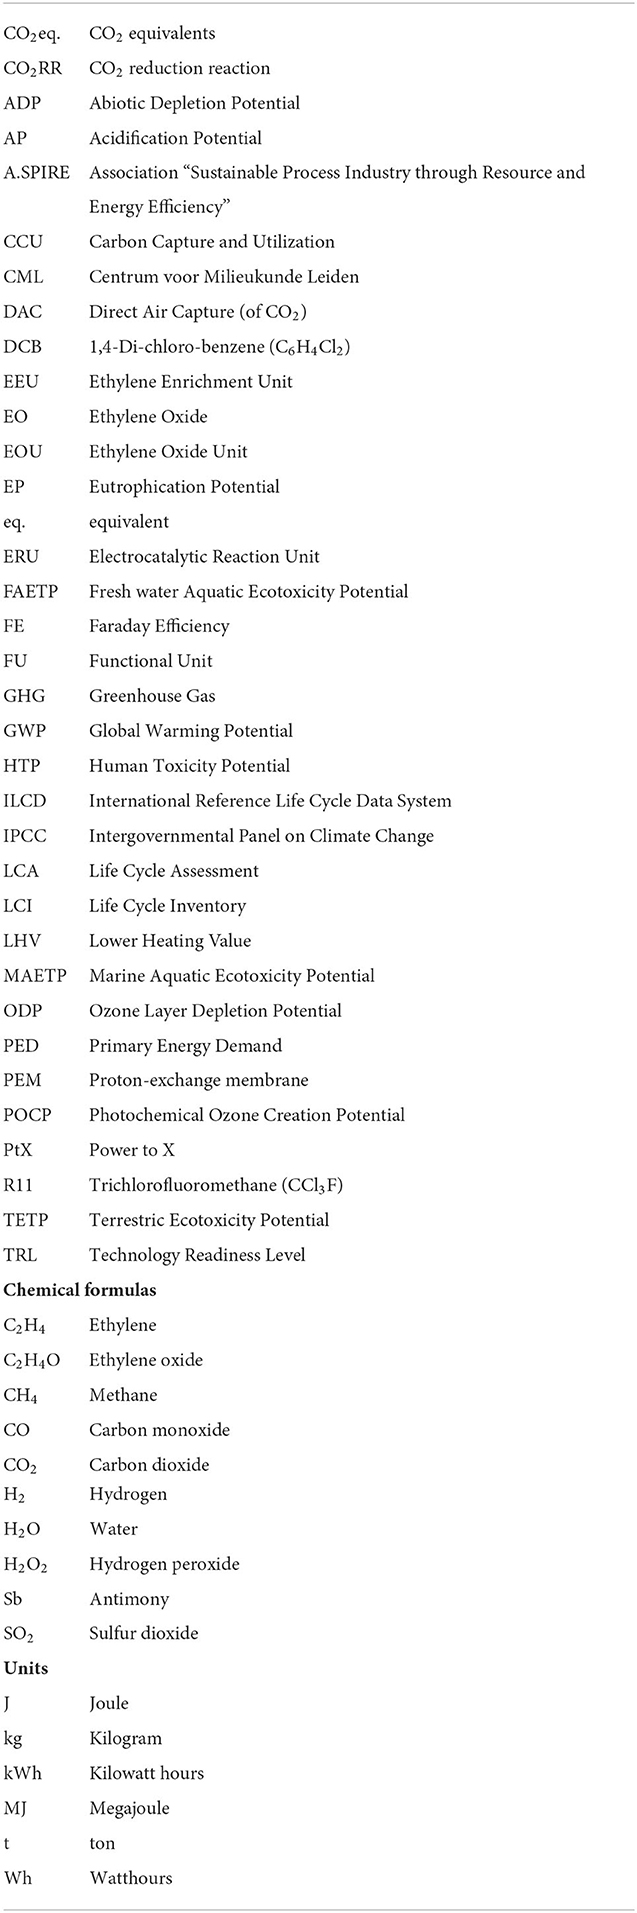
Keywords: carbon capture and utilization, Power to X, ethylene oxide, life cycle assessment, case study, sensitivity analysis, electrocatalysis, biogenic CO2
Citation: Rodin V, Zeilerbauer L, Lindorfer J, Paulik C and Finger D (2022) Life cycle assessment of a novel electrocatalytic process for the production of bulk chemical ethylene oxide from biogenic CO2. Front. Sustain. 3:799389. doi: 10.3389/frsus.2022.799389
Received: 21 October 2021; Accepted: 31 August 2022;
Published: 30 September 2022.
Edited by:
Andrea Lanzini, Politecnico di Torino, ItalyReviewed by:
George Tsalidis, Delft University of Technology, NetherlandsShivali Sahota, Sardar Swaran Singh National Institute of Renewable Energy, India
Copyright © 2022 Rodin, Zeilerbauer, Lindorfer, Paulik and Finger. This is an open-access article distributed under the terms of the Creative Commons Attribution License (CC BY). The use, distribution or reproduction in other forums is permitted, provided the original author(s) and the copyright owner(s) are credited and that the original publication in this journal is cited, in accordance with accepted academic practice. No use, distribution or reproduction is permitted which does not comply with these terms.
*Correspondence: Valerie Rodin, cm9kaW5AZW5lcmdpZWluc3RpdHV0LWxpbnouYXQ=
†These authors share last authorship