 Kate Howe
 Brendan L. Lavy
- Department of Environmental and Sustainability Sciences, Texas Christian University, Fort Worth, TX, United States
The circular economy (CE) provides an operational framework for businesses to reduce environmental impacts and achieve sustainability goals. Businesses are increasingly integrating CE practices into their operations; however, implementation varies by industry, business type, and size. Globally, small and medium sized businesses constitute the majority of all businesses, and their aggregated environmental impacts outweigh those of larger businesses. Small manufacturers, in particular, produce more pollution than other industries, and their shift to more sustainable practices aligned with the CE affects regional-to-local environmental conditions. Despite their significance, less is known about the CE practices of small and medium-sized businesses, particularly those of small manufacturers. We distributed a survey to small manufacturers across Dallas-Fort Worth and received 69 valid responses from an initial list of 4,320 contacts for a survey response rate of 1.6%. We documented their use of CE practices and assessed the extent to which their leadership’s motivation toward the environment and company characteristics influence the adoption of practices. Our resu.lts showed the adoption of CE practices by small manufacturers increased with stronger leadership motivation and was influenced by company characteristics. We found that disadvantaged manufacturers implemented more resource optimization practices than their non-disadvantaged counterparts, potentially reflecting social responsibility, supply chain pressures, or differentiation strategies. Environmental certifications were the most consistent indicator of broader CE adoption, particularly in product design, material sourcing, and waste management. Manufacturers with annual sales revenue above $10 M also demonstrated higher adoption of CE practices related to waste reduction, resource efficiency, and product design compared to firms with lower sales. Similarly, higher-revenue firms showed stronger internal pressure to adopt CE practices. Yet difficult-to-implement practices, such as waste-to-energy initiatives, were often overlooked in favor of easy-to-implement practices, such as recycling initiatives, unless leadership demonstrated high motivation. These results highlight the need for more guidance, enhanced leadership self-determination, and supportive policies to improve broader CE adoption among small manufacturers.
1 Introduction
The circular economy (CE) is increasingly recognized as a framework for achieving sustainability (Suarez-Eiroa et al., 2019). The public and private sectors of the economy think the CE has the potential to address global, national, and local sustainability goals (Barreiro-Gen and Lozano, 2020; Pieroni et al., 2019). Businesses, in particular, have identified the CE as a pathway to implement more resource-efficient and regenerative practices (Govindan and Hasanagic, 2018; Moktadir et al., 2018) and have been attracted to the CE because of its emphasis on optimizing system performance, reducing waste, and enhancing industrial symbiosis (Stumpf et al., 2021). CE principles provide the conceptual foundation for transitioning from a linear economy to a circular economy, focusing on resource efficiency, waste elimination, product longevity, and knowledge sharing (Suarez-Eiroa et al., 2019). CE practices, in contrast, refer to the actions businesses implement to operationalize these principles, such as using recycled materials in manufacturing, refurbishing electronics for resale, and repurposing industrial waste into new products.
Researchers have developed varying conceptual models of the CE (Ellen MacArthur Foundation, 2019; Velenturf et al., 2019) and have started to evaluate how to administer CE practices within industry (Gusmerotti et al., 2019; Hultberg and Pal, 2021). Yet research and case studies that examine sustainable, green, or CE practices mostly favor larger companies (García-Quevedo et al., 2020). Research addressing the use of CE practices within small and medium sized businesses is limited, and there are even fewer studies documenting CE practices, characteristics, and decision making of small manufacturers (Ashton et al., 2017). Moreover, environmental sustainability studies of small and medium sized businesses have not focused on small or industry specific firms in the United States (Bakos et al., 2020). Understanding the factors that lead small businesses to implement CE practices is important to achieving broader sustainability goals.
Globally, there are approximately 400 million small and medium sized businesses, representing approximately 90% of all businesses and more than 50% of employment (The World Bank, n.d.). Together small and medium sized businesses provide significant contributions to national, regional, and local economies; however, their aggregated environmental impacts outweigh those of larger companies (Bakos et al., 2020; Hillary, 2017). While large companies often have more resources to address sustainability issues, small businesses face unique sustainability challenges that warrant targeted study. Unlike large companies, small businesses often lack dedicated environmental or sustainability teams, financial resources, and access to advanced CE technologies (Revell and Blackburn, 2007). Their reliance on local supply chains, smaller operational scales, and regulatory pressures further affects their ability to adopt CE practices (Johnson and Schaltegger, 2016).
In particular, manufacturing has been found to produce more pollution than other industries (Zeng et al., 2010) due to their frequent use of large quantities of freshwater, hazardous chemicals, and toxic substances (Quintero-Angel and Peña-Montoya, 2020). The manufacturing industry, however, is critical to the supply chain, playing a significant role in the design, material use, assembly, and deconstruction of products (Ashton et al., 2017; Ellen MacArthur Foundation, 2014). Small manufacturers, despite their resource constraints, play an important role in these processes. Their ability to implement CE strategies at the production level can influence the broader supply chain’s sustainability, yet many face barriers, such as limited capital for new technologies, lack of sustainability expertise, and difficulties navigating complex environmental regulations (Williams and Schaefer, 2013).
Given this, the adoption of CE practices by manufacturers is important to CE growth (Giurco et al., 2014). For example, sustainable practices, such as material reduction and life cycle analyses, can reduce raw material use and decrease waste (Mendoza et al., 2019). Manufacturers may also implement energy and environmental optimization strategies to lessen their environmental impacts across the supply chain (Peng et al., 2018). By adopting such practices, manufacturers help their industry transition to a more circular economy. While the potential for CE adoption among small manufacturers is clear, the extent to which they engage in sustainability practices varies. Understanding why some manufacturers successfully integrate CE principles while others do not require an examination of the factors that influence adoption.
A variety of factors, however, influence the extent to which manufacturers adopt CE practices. Research has found that company decisions are related to business characteristics and owner motivations. Business characteristics, such as business size, age, ownership structure, industry type, and location, are unique to a company but some of these characteristics influence sustainability decision making (Balasubramanian et al., 2021). Less is known, however, about the sustainability practices of disadvantaged-owned businesses and how this characteristic might influence the adoption of pro-environmental practices. Disadvantaged businesses in the United States include those owned by individuals from historically marginalized groups, such as racial and ethnic minorities, women, veterans, and LGBTQ+ individuals. The U. S. Small Business Administration classifies these businesses based on social and economic disadvantage, recognizing their unique challenges and contributions to industry (SBA, 2022).
The implementation of CE practices by small businesses are also related to owners’ and managers’ motivations. For example, research has shown that company leadership’s motivation toward the environment, whether internally or externally driven, affect implementation of environmentally benign practices (Gagné and Deci, 2005; Yacob et al., 2019). Additionally, studies have examined how intrinsic and extrinsic motivations affect small businesses sustainability practices (Testa et al., 2016; Tafvelin and Stenling, 2021). These studies found that leadership’s self-determination is important for implementing CE practices. Moreover, additional research has found a link between leadership driven motivation and strategic environmental decision making (Sawe et al., 2021). Therefore, studies of sustainability in small businesses should focus on not only how leadership’s motivations (Battisti and Perry, 2011) but also how business characteristics influence the implementation of sustainable practices (Gusmerotti et al., 2019). The results of these inquiries should help inform what CE efforts businesses are implementing and the extent to which company leadership or business characteristics influence these practices.
The purpose of this research is to add to the growing body of literature on the interplay between CE practices, company characteristics, and leadership’s motivations for small manufacturers. Specifically, we surveyed small manufacturers in the Dallas-Fort Worth (DFW) region, a major U. S. manufacturing hub experiencing rapid industrial growth, to understand how business characteristics and business owners’ or managers’ motivations affect the implementation of CE practices. As such, we ask: (1) what types of practices are small manufacturers implementing that align with CE principles and (2) to what extent are company characteristics and company leadership’s motivations related to the implementation of CE practices and principles? Understanding the answers to these questions will not only help small manufacturers transition to CE practices that benefit sustainability goals but also provide researchers with information on characteristics that contribute to CE practices.
2 Literature review
2.1 The circular economy
The CE provides an alternative to the current linear system of production and consumption (Das et al., 2022). Linear systems are a take-make-dispose structure (Hultberg and Pal, 2021). In comparison, the CE is underpinned by three principles: eliminate waste and pollution, keep products and materials in use, and regenerate natural systems (Ellen MacArthur Foundation, 2021). The CE is regularly defined as a model that is “restorative and regenerative” (Millar et al., 2019, p. 7), meaning that designing products to retain a circular, closed loop system is imperative. By doing so, the model prevents consumption that exceeds planetary limits and natural systems. Thus, proponents often refer to the CE as closing the loop in industrial ecosystems (Ellen MacArthur Foundation, 2013; Tomić and Schneider, 2018). A more recent interpretation redefined the CE as a regenerative production-consumption system with a goal to keep rates of resource extraction, waste generation, and emissions within the limits of the planetary boundaries (Suarez-Eiroa et al., 2019). These elements are key to designing a system that is both restorative and regenerative for the planet’s natural systems on which humans rely.
Research has started to investigate the relevance of the CE in achieving the United Nations Sustainable Development Goals (SDGs), with studies analyzing which United Nations SDGs align with the CE (Schroeder et al., 2019). Research suggests that the CE has a major contribution in meeting the aims of SDG 12 (Responsible Consumption and Production), SDG 7 (Affordable and Clean Energy), SDG 6 (Clean Water and Sanitation), and SDG 8 (Decent Work and Economic Growth), but could also contribute to SDG 11 (Sustainable Cities and Communities), SDG 15 (Life on Land), and SDG 9 (Industry, Innovation and Infrastructure) (e.g., Panchal et al., 2021; Rodriguez-Anton et al., 2019; Khairul Akter et al., 2022; Dantas et al., 2021; Valverde and Aviles-Palacios, 2021; Ellen MacArthur Foundation, 2021). In particular, Suarez-Eiroa et al. (2019) proposed seven operational principles of the CE that align with the three dimensions of sustainability. The CE principles were created under a sustainable development framework with an intent to disconnect economic development from the extraction of finite resources. As such, the CE principles aim to keep extraction and generation rates within planetary and natural systems limits. Moreover, the seven principles illustrate practices that could be implemented to achieve each CE principle. Therefore, adoption of the principles offers a method to meet sustainability goals.
Despite its sustainability-oriented framework, CE models are not always aligned with environmental, social, and economic sustainability goals (Suarez-Eiroa et al., 2019). Many CE models focus primarily on the three R’s—reduce, re-use, recycle—without a clear connection to broader sustainability goals (Pan and Li, 2016). For example, the textile industry has identified recycling and reuse as key strategies for reducing textile waste (Shirvanimoghaddam et al., 2020), leading to numerous textile waste applications, such as its use in the construction sector as thermal insulation or in the design of light weight concrete or bricks (Ahmad et al., 2016; Briga-Sá et al., 2013). While these efforts contribute to circularity, they do not necessarily address larger sustainability concerns such as ethical labor practices or material toxicity.
The lack of a unified CE framework has resulted in diverse interpretations. Some CE models expand beyond the traditional three R’s to include remanufacturing and repair (Barreiro-Gen and Lozano, 2020), while others focus on recovery, such as the recovery of metals from electronic waste (Isildar et al., 2018) or the recovery of minerals within wastewater treatment systems (Lin et al., 2016). Reike et al. (2018) identified 38 different combinations of R-imperatives within the CE literature, showing the inconsistencies in how circularity is defined. Additionally, some CE models consider material input and output management, such as substituting nonrenewable inputs with renewable resources and optimizing material recovery (Piezer et al., 2019). Yet without clear sustainability criteria, these models can fail to demonstrate their contributions to social and environmental goals. Indeed, models that poorly demonstrate how they contribute to sustainability may make it more difficult to convince businesses or policymakers to adopt a CE approach, especially as examples proliferate that are not harmonized with SDGs (Korhonen et al., 2018; Millar et al., 2019).
2.2 Company characteristics
Studies have shown that company characteristics influence the implementation of CE and similar environmental practices (Bakos et al., 2020; Brammer et al., 2012). Common company characteristics studied in relation to the uptake of such practices include company age, size, industry type, revenue, and location (Balasubramanian et al., 2021). Research suggests that larger and more financially stable companies often have a higher adoption rate of environmental or CE-related practices. For example, small U. S. manufacturing firms implementing environmental practices tend to be older, have higher annual sales, employ more workers, and are more likely to hold environmental certifications (Ashton et al., 2017). Similarly, a study of 800 Italian manufacturers found that companies with high annual turnovers and poor client trends had lower CE performance, whereas companies that reported increases in employee numbers and low turnovers exhibited stronger CE performance (Gusmerotti et al., 2019). These findings demonstrate that financial constraints can be a barrier to CE implementation. Businesses with low revenue and low or intermittent demand may lack the resources to invest in the adoption of CE practices. While these studies highlight the role of financial health and company size in CE adoption, smaller businesses often face disproportionate challenges due to limited access to financing for CE initiatives. Research has shown that CE adoption requires investments in new technologies, process optimization, and workforce training, all of which pose a greater burden on smaller companies with fewer financial reserves (Dev et al., 2020).
Company ownership can also influence the implementation of sustainability practices (Gundry et al., 2014). Most studies that examine company ownership, however, focus narrowly on the economic dimension of sustainability within a linear system, such as business growth and competitiveness (Adebayo et al., 2021). Yet research related to social and environmental aspects of CE adoption and their relationship to business ownership characteristics is important but understudied (Esa et al., 2018; Wang et al., 2014). In particular, it is useful to understand if certain ownership characteristics, such as disadvantaged-owned businesses, including woman- or minority-owned businesses, impact CE implementation specifically or sustainability practices in general.
From the limited number of studies available, research suggests ownership type may shape CE decision-making. Studies have shown that there are fewer Black-owned manufacturing businesses in the United States (Sharpe, 2019), and Black woman-owned small businesses, in particular, face obstacles that limit their growth and access to capital (Jarriett, 2020). These challenges could potentially hinder the ability of minority-owned businesses to implement CE practices. Research directly comparing the barriers faced by minority-owned and women-owned businesses to non-disadvantaged-owned businesses is limited. Yet understanding this is important to identifying policies that support CE adoption across diverse ownership types.
Further, less is known about the status of other disadvantaged businesses’ CE practices, including LGBTQ+ owned, veteran-owned, and service-disabled veteran-owned businesses, especially within the United States. While research suggests that small businesses led by underrepresented groups often prioritize social responsibility and community engagement (Kassinis et al., 2016; Glass et al., 2016), it remains unclear whether these priorities extend to the adoption of environmental and CE practices. Financial constraints, industry-specific barriers, and lack of regulatory incentives have been identified as limiting factors, preventing some disadvantaged-owned businesses from implementing CE strategies despite their commitment to ethical and socially responsible business practices (Balasubramanian et al., 2021).
Internationally, studies have found that women-owned enterprises in developing countries often face structural barriers such as limited access to financing, lower levels of formal education, and social norms that restrict business expansion, all of which could impact CE implementation (Akter et al. 2023). Similarly, a review of research on small and medium-sized businesses in Latin America found that firms run by underrepresented groups were more likely to engage in community-oriented sustainability initiatives but had lower levels of CE adoption due to financial constraints, technological limitations, and lack of regulatory support (Gallego-Schmid et al., 2024). These findings suggest that while disadvantaged-owned businesses may have strong commitments to social sustainability, financial and structural barriers often limit their ability to implement CE practices. Given these challenges, further research is needed to understand how disadvantaged-owned businesses balance social, economic, and environmental sustainability goals within CE frameworks.
2.3 Motivation toward the environment
Within businesses, leadership’s motivation toward the environment can affect the uptake of environmental practices (Sawe et al., 2021; Govindan and Hasanagic, 2018). Level of motivation is often measured using the Motivation Toward the Environment Scale (MTES). MTES consists of a 24-item questionnaire where participants rate how often their reasoning for an environmental behavior corresponds with a prescribed set of statements. The statements correspond with levels of motivation defined on the self-determination continuum (Pelletier et al., 1998; Villacorta et al., 2003). Amotivation and intrinsic motivation lay on either end of the self-determination continuum. The continuum includes the source of motivation and the level of self-determination, which ranges from motivation that is impersonal (or non-self-determined) to motivation that is internally sourced (or self-determined). Extrinsic motivation exists between amotivation and intrinsic motivation (Figure 1; Deci and Ryan, 1985; Ryan and Deci, 2000).
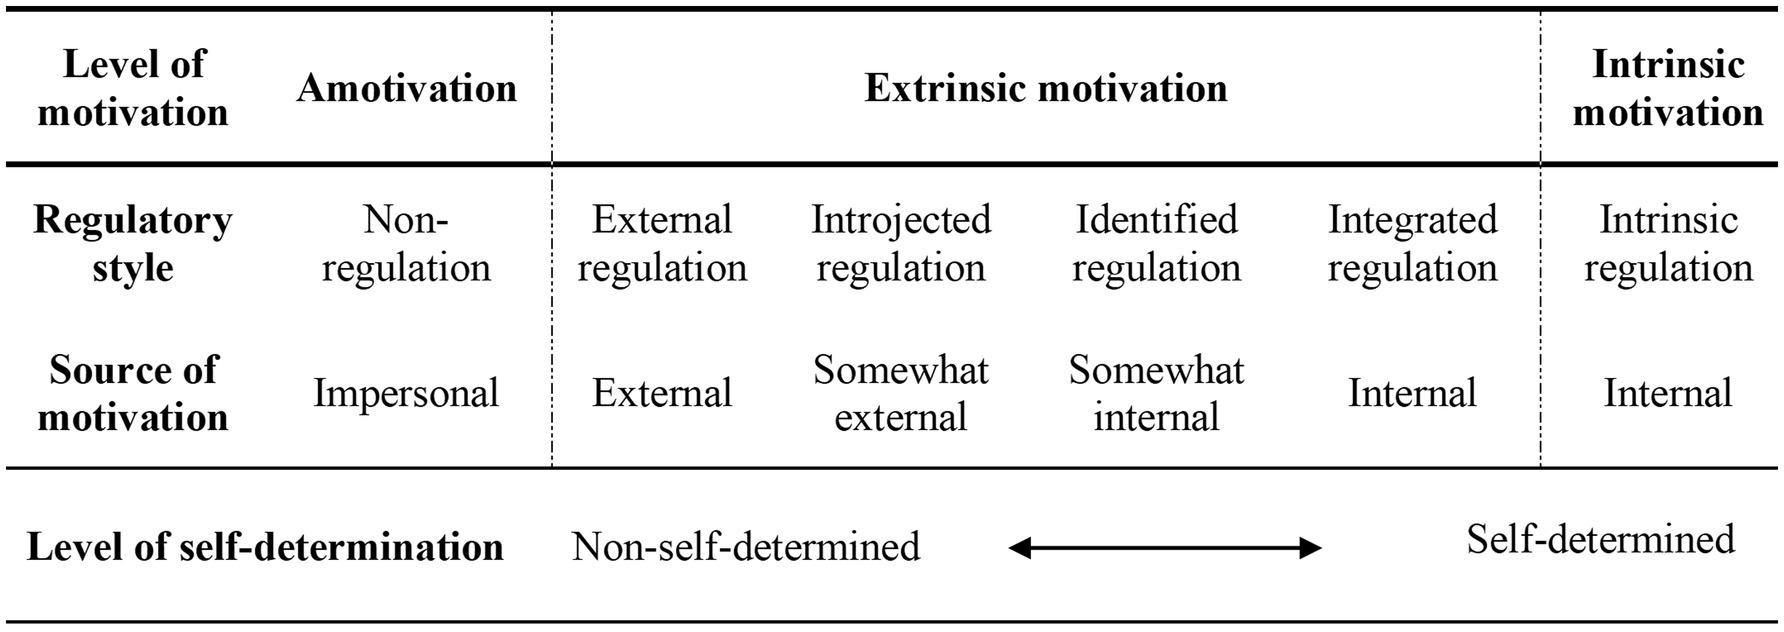
Figure 1. The self-determination continuum, and its relationship with motivation and regulatory style, as defined by Ryan and Deci (2000).
Understanding whether intrinsic or extrinsic motivation influences the implementation of CE is critical to advancing sustainability goals (Lewis and Cassells, 2010; Testa et al., 2016). For example, regulatory compliance is an externally sourced motivation for the CE (Battisti and Perry, 2011) because it is motivated by the desire for an external reward, or through the fear of punishment of noncompliance (Deci and Ryan, 1985; Stern, 2018), and as such, it would reduce the level of self-determination.
While regulatory frameworks can initiate CE adoption, they rarely facilitate comprehensive, long-term integration of CE principles across industries. Many regulations focus on specific environmental impacts, such as emissions reductions, hazardous waste management, or recycling targets, rather than systemic circular transitions (OECD, 2019; Park et al., 2018). As a result, compliance-driven CE adoption often leads to incremental adjustments rather than transformative change, with businesses meeting minimum requirements to avoid penalties rather than fundamentally altering their business models (García-Quevedo et al., 2020). Research suggests that companies are more likely to engage in CE when regulatory compliance is combined with economic incentives, voluntary sustainability initiatives, and leadership-driven commitments (Gusmerotti et al., 2019). Without these complementary factors, regulatory compliance tends to produce reactive environmental management strategies rather than encouraging firms to integrate CE principles as part of their core business strategies. Thus, even though regulations may lead to the enforcement of minimum environmental standards, they do not ensure long-term commitment to CE. Instead, intrinsic motivation plays an important role in the implementation of CE practices.
Regulatory policies have influenced CE adoption in some industries, particularly when connected to financial incentives. For example, Yacob et al. (2019) examined the motivations of Malaysian small manufacturers implementing sustainable practices, such as energy efficiency, water conservation, and waste reduction. They found that extrinsic motivation, particularly financial incentives, played a dominant role, with companies frequently adopting energy management and monitoring systems due to government-funded return-on-investment programs. Similarly, high penalties for illegal dumping drove waste management practices, whereas water conservation received the least attention due to the absence of regulatory or economic pressures. These findings illustrate how financial and regulatory drivers act as extrinsic motivators, shaping business engagement with sustainability practices.
A similar pattern emerged in Bangladesh’s leather industry, where companies’ motivations for CE adoption were influenced by knowledge about CE, customer awareness, leadership commitment, and government support (Moktadir et al., 2018). While larger companies were driven by an intrinsic understanding of CE benefits, smaller firms were largely motivated by government regulations and financial incentives, aligning with findings from García‐Quevedo et al. (2020) on European small and medium-sized businesses. These cases reinforce the role of external motivators—such as cost savings, regulatory pressures, and market demand—as important factors driving small manufacturers to implement CE practices.
Comparatively, intrinsic motivation stems from leadership’s personal commitment to the environment. Leadership that prioritizes environmental responsibility is more likely to integrate CE practices into long-term business strategy, rather than viewing them as compliance obligations (Lewis and Cassells, 2010; Hart and Dowell, 2011) because the practices align with their internal values or goals (Pelletier et al., 1998). When internal sources drive motivation, individuals within company leadership, such as owners or managers, may feel self-directed and autonomously motivated. A higher level of autonomy results in external drivers affirming competence, as when individuals feel they have the skills for success, they are more likely to achieve their goals. This can lead to intrinsic motivation which improves self-determination.
Motivation driven by external sources, may result in a higher level of control, which can undermine intrinsic motivation, and result in leadership being non-self-determined. Leadership may feel incompetent, non-valuing, or feel a lack of control (Tafvelin and Stenling, 2021; Gagné and Deci, 2005). For example, regulatory compliance facilitates a non-strategic, reactive response, where small businesses act to meet the basic level of compliance or perceive the punishment for noncompliance is less burdensome than implementation costs (Revell and Blackburn, 2007).
This type of motivation illustrates non-self-determination through amotivation. Financial benefits related to business practices, through either cost savings or return on investment practices, are perceived by company leadership as factors that motivate them; however, these factors regularly lead to the use of waste practices within a linear system to gain quick profits and are perceived as quick rewards (Ashton et al., 2017; Millar and Russell, 2011). Businesses engage in these practices because they require fewer operational changes and lower upfront costs. For example, linear waste practices such as landfill disposal and incineration often require fewer operational changes than circular alternatives, making them more appealing in the short term (Gusmerotti et al., 2019). For example, in the U. S. construction sector, landfill tipping fees remain lower than the costs of sorting and processing materials for reuse, disincentivizing circular approaches (EREF, 2021). Similarly, the textile industry frequently defaults to overproduction and disposal rather than implementing garment repair or resale models, as resale infrastructure requires significant upfront investment (Shirvanimoghaddam et al., 2020). These examples illustrate how businesses often default to waste practices because they require fewer investments in logistics, technology, and workforce training, despite their long-term environmental costs.
This is an example of extrinsic motivation from a source that is somewhat internal; it relies on cost–benefit analyses and reduces self-determination. Intrinsic motivations, on the other hand, include actions that demonstrate a commitment to environmental stewardship as a matter of personal importance, which will improve self-determination and lead to the use of practices that are harder to implement (Pelletier et al., 1998; Vihma and Moora, 2020). This research highlights the importance of distinguishing whether a motivation that influences the uptake of a CE principle is internally or externally driven (Ashton et al., 2017; Lewis and Cassells, 2010; Testa et al., 2016) and can help distinguish the level of self-determination within company leadership.
The existing literature highlights the importance of business characteristics and leadership’s motivation toward the environment to the adoption of environmentally benign business practices. Yet, research on how these factors influence small manufacturers’ adoption of CE practices aligned with CE principles remains limited. This research addresses this gap by documenting the types of practices manufacturers are implementing that align with CE principles and considers the role of business characteristics and leadership’s motivation on the adoption of these practices.
3 Materials and methods
For this study, we focused on small manufacturers in the Dallas-Fort Worth (DFW), Texas, metroplex. We selected the DFW metroplex due to its rapid economic and population growth, diverse manufacturing sector, and significant presence of small businesses. This diversity ensures that the results of our research are likely to be relevant to other similar metropolitan regions.
The DFW metroplex is the largest Metropolitan Statistical Area (MSA) in Texas, spanning 11 counties in the state’s north central region. The area had the largest numeric population gain since 2010 of any MSA, and Tarrant, Dallas, and Collin counties (home to the cities of Fort Worth, Dallas, and Plano, respectively) were listed in the top 10 U. S. counties to increase in population between 2010 and 2019 (United States Census Bureau, 2022). Furthermore, the City of Fort Worth was the fastest growing city in the United States between 2000 to 2016 and had the largest population increase of any U. S. city in 2022 (United States Census Bureau, 2021; City of Fort Worth, 2022).
Statewide, the U. S. Small Business Administration (2020) reported 2.8 million small businesses, with 50,669 of these in the manufacturing industry. Texas ranks second in the United States for number of manufacturing firms, with a high diversity of manufacturing industries, from petroleum and chemical, to computer and technology manufacturing, and the automotive sector (Texas Economic Development and Tourism Office, 2023). The Texas economy is dependent on these manufacturing firms (Wright, 2018), and Texas manufacturers are expanding at a rate far quicker than the rest of the United States (Cañas and Kerr, 2014). United States Census Bureau (2017) reported a total of 130,881 small businesses within DFW, with 4,859 of these small businesses within the manufacturing sector, and over 50% consisting of less than 10 employees.
Moreover, as of 2022, the DFW area had a total labor force of approximately 4.26 million people, with the manufacturing sector employing around 299,600 workers, accounting for roughly 7% of total employment. Between 2019 and 2023, DFW’s manufacturing sector grew by 6.4%, adding approximately 18,500 jobs (FRED, 2024). The DFW metroplex also hosts more manufacturing firms than other highly populated urban areas in Texas, including the greater Houston area (Hooper, 2018). Given DFW’s growing manufacturing workforce, strong small business presence, and expanding industrial base, it serves as an ideal location to study CE adoption among small manufacturers.
3.1 Data collection
To examine how business characteristics and business owners’ or managers’ motivations affect the implementation of CE practices in the manufacturing industry, we surveyed senior leadership (i.e., business owners and managers, as well as professionals directly involved in manufacturing systems and processes) of DFW-area small manufacturers. We define small manufacturers as firms with less than 500 employees, equivalent to the definition of “small business” by the U. S. Small Business Administration (SBA). It is important to note that the definition used for a small business varies throughout the United States, across industries, and globally (Hryhorash et al., 2018; Hegstad, 2020; Raczyńska, 2019); however, this study used the SBA standard for manufacturing as did similar research conducted within the United States (e.g., Ashton et al., 2017). We sent the survey via an online survey platform (Qualtrics, Provo, Utah) to a list of contacts (4,320 email addresses) retrieved from Dun & Bradstreet (2022), an American based company providing business analytics and insights to clients. We also shared the survey through social media and with local Chambers of Commerce. The TCU Institutional Review Board approved the research design on 13 November 2021 (Approval #2021–227).
3.1.1 Survey design
We divided the survey into three sections. Each section included a mix of closed and open response questions. Section 1 included questions related to company characteristics, such as number of employees, annual gross sales, company age, and whether the company identified as a disadvantaged business. Section 2 contained questions on CE practices that corresponded to one of the seven CE principles proposed by Suarez-Eiroa et al. (2019). These questions were derived from a variety of similar research that investigated topics such as energy use, resource efficiency measures, waste reduction and recycling, and environmental stewardship (e.g., Brammer et al., 2012; Williams and Schaefer, 2013; Ashton et al., 2017; Gusmerotti et al., 2019; Hitchens et al., 2003; Millar and Russell, 2011). Section 3 asked questions about leadership’s motivation toward the environment. We used a modified MTES design to shorten survey response time and improve the response rate. Specifically, we asked respondents to express how often they felt that company leadership identified with each of the 12 sub-section statements with two statements per regulatory style associated with the corresponding motivation level rather than four statements in MTES. Similar to MTES questionnaires, we used a five-point Likert scale to measure motivation responses (Pelletier et al., 1998) and randomized the order of the statements to improve objectivity of the results. Finally, section 3 also asked respondents to identify and rank challenges and opportunities that affect the adoption of CE practices. We trialed the survey within the manufacturing industry, including with business owners, directors, managers, and consultants, and refined questions based on their suggestions. The complete survey used in this study is available in Supplementary material.
3.2 Analysis
We analyzed all survey responses using descriptive statistics and statistical analyses with SPSS (Version 27; IBM Corp, 2020). First, we quantified the CE practices each respondent indicated their business had adopted to determine the overall frequency and percentage of CE implementation. Next, we categorized the levels of implementation for each CE principle based on the number of CE practices adopted by each firm. From this, we assigned each firm to a category that corresponded to one of four levels of CE implementation: (1) zero implementation, (2) limited implementation, (3) transition phase, and (4) circular implementation. For example, if a respondent indicated their business adopted three or more CE practices for CE principle 1, they were categorized as having achieved “circular implementation” for CE principle 1. If they adopted two practices, the firm was given the “transition phase” status; if they adopted only one practice, they were assigned a “limited implementation” status and so on. The assignment of these levels allowed us to ascertain which CE principles businesses were implementing, where CE implementation could be improved, and which might require further exploration.
To examine the extent to which company characteristics and leadership’s motivations were associated with the adoption of CE principles, we conducted a Spearman’s rank-order correlation analysis (Spearman, 1904). Spearman’s correlation assesses relationships between ordinal or non-normally distributed continuous variables by ranking data and evaluating the correlation of these ranks. The correlation coefficient and associated significance levels were calculated following procedures described by Siegel (1956) and detailed in SPSS documentation (IBM Corp, 2016). We selected this method of bivariate correlation analysis because the data showed a non-normal distribution and the variables contained ordinal ranked data. Additionally, the exploratory nature of our research and the sample size made Spearman’s correlation the most appropriate method for identifying relationships between variables without overinterpreting the results. We used pairwise deletion to maximize valid responses across all answered questions. To validate the strength of observed correlations, we conducted Mann–Whitney U tests to examine differences in CE adoption based on key company characteristics, adoption of CE principles, and motivation levels. Mann–Whitney U tests evaluate differences between two independent groups without assuming a normal distribution. The test ranks data from both groups to understand whether their distributions differ significantly. Test statistics and significance levels were calculated following methods described by Dineen and Blakesley (1973) and detailed in SPSS documentation (SPSS Corp., 2016). Full computational details and formulas for both statistical tests are available in the IBM SPSS Statistics 24 Algorithms manual (2016).
4 Results
We received 81 survey responses. Twelve of the responses were considered invalid because the responses were from manufacturers with more than 500 employees or the firm was located outside of the study area. Results include responses from 69 manufacturers in the DFW metroplex with a majority of respondents (97%) completing at least 70% of the survey questions. Respondents held either a senior level role (91.3%) or worked directly with the manufacturing systems and processes (8.6%).
Because of the small number of respondents, we assessed the representativeness of our sample by comparing key characteristics of the responding businesses with publicly available statewide data. We found that the sample includes firms with varying characteristics that reflect the broader small business sector in Texas. More than half of respondents’ companies (65.2%) had less than 100 employees. This aligns with statewide trends, where the majority of businesses are small, including businesses in the manufacturing sector (United States Census Bureau, 2017; SBA, 2022). Additionally, our sample includes manufacturers of varying ages. About half of the companies (49.3%) were less than 4 years old, and the other half ranged from greater than 4 to more than 20 years old. This ensures a balanced representation of both new and experienced manufacturers. Similarly, almost half of the firms (49.3%) reported annual sales less than $5 million USD. This is a common range for small businesses, including manufacturers (SBA, 2022). A small number of manufacturers reported annual sales above $5 million USD with one reporting annual sales in excess of $100 million USD. This range ensures a broader view of CE adoption across manufacturers with varying financial capacities. Only eight respondents (18%) indicated that their company held an environmental certification or received an environmental award. Finally, approximately one-third of respondents (29%) identified as a disadvantaged business. This reflects the broader presence of minority-owned, woman-owned, and veteran-owned businesses in Texas, as highlighted by the SBA (2022). Disadvantaged-owned businesses are an important but often underrepresented group in sustainability research and allowed us to explore how this ownership characteristic influences CE adoption (Table 1).
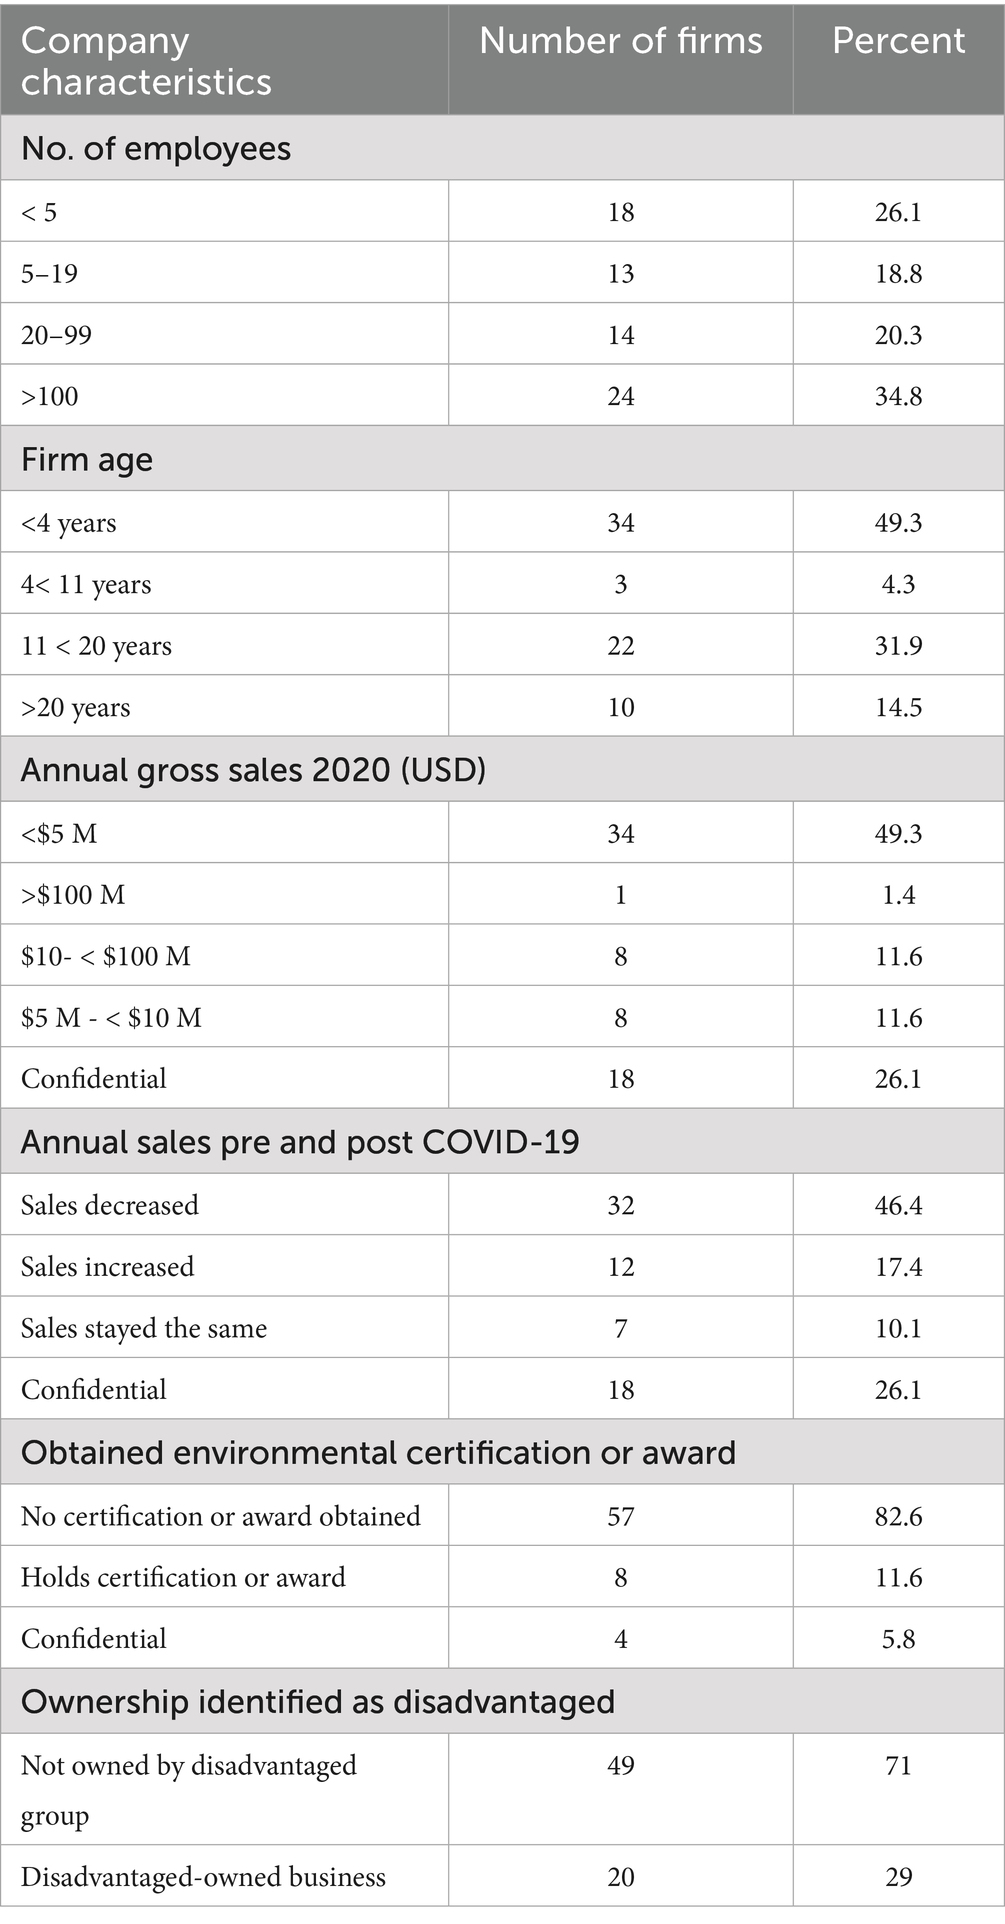
Table 1. Company characteristics of firms (N = 69) that took part in the survey, displaying the number of firms and the corresponding percentage.
4.1 Circular economy practices and principles
The implementation of CE practices within each CE principle varied (Table 2). On average, manufacturers adopted more practices within CE principles 3, 4, and 5, respectively. Practices with the least adoption included principles 6 and 7. The most widespread practice adopted by respondents for CE principle 1 was reducing toxicity of inputs (39.1%), and fostering energy efficient transport was the least adopted practice within CE principle 1 (10.1%). For principle 2, most respondents considered output emissions when deciding on material inputs (52.2%). Within principle 3, most respondents indicated that they implemented waste management activities (87%). This was also the most adopted CE practice overall (87%). Recycling was also a highly adopted practice (63.8%) within principle 3. Energy recovery from waste was the least used practice overall, with only two respondents indicating implementation of energy recovery practices. For principle 4, most respondents indicated adopting two practices: reducing software obsolescence (84.1%) and performing preventative maintenance (85.5%). Manufacturing on demand (69.6%) was the most used practice within principle 5, but few companies were making green purchasing decisions (27.5%). Packaging design for recycling (56.5%) and re-use (50.7%) were the most adopted practices within principle 6, whilst the least deployed practice was discussing business strategies (23.2%). Finally, practices within principle 7 had lowest levels of adoption, including knowledge sharing (4.3%).
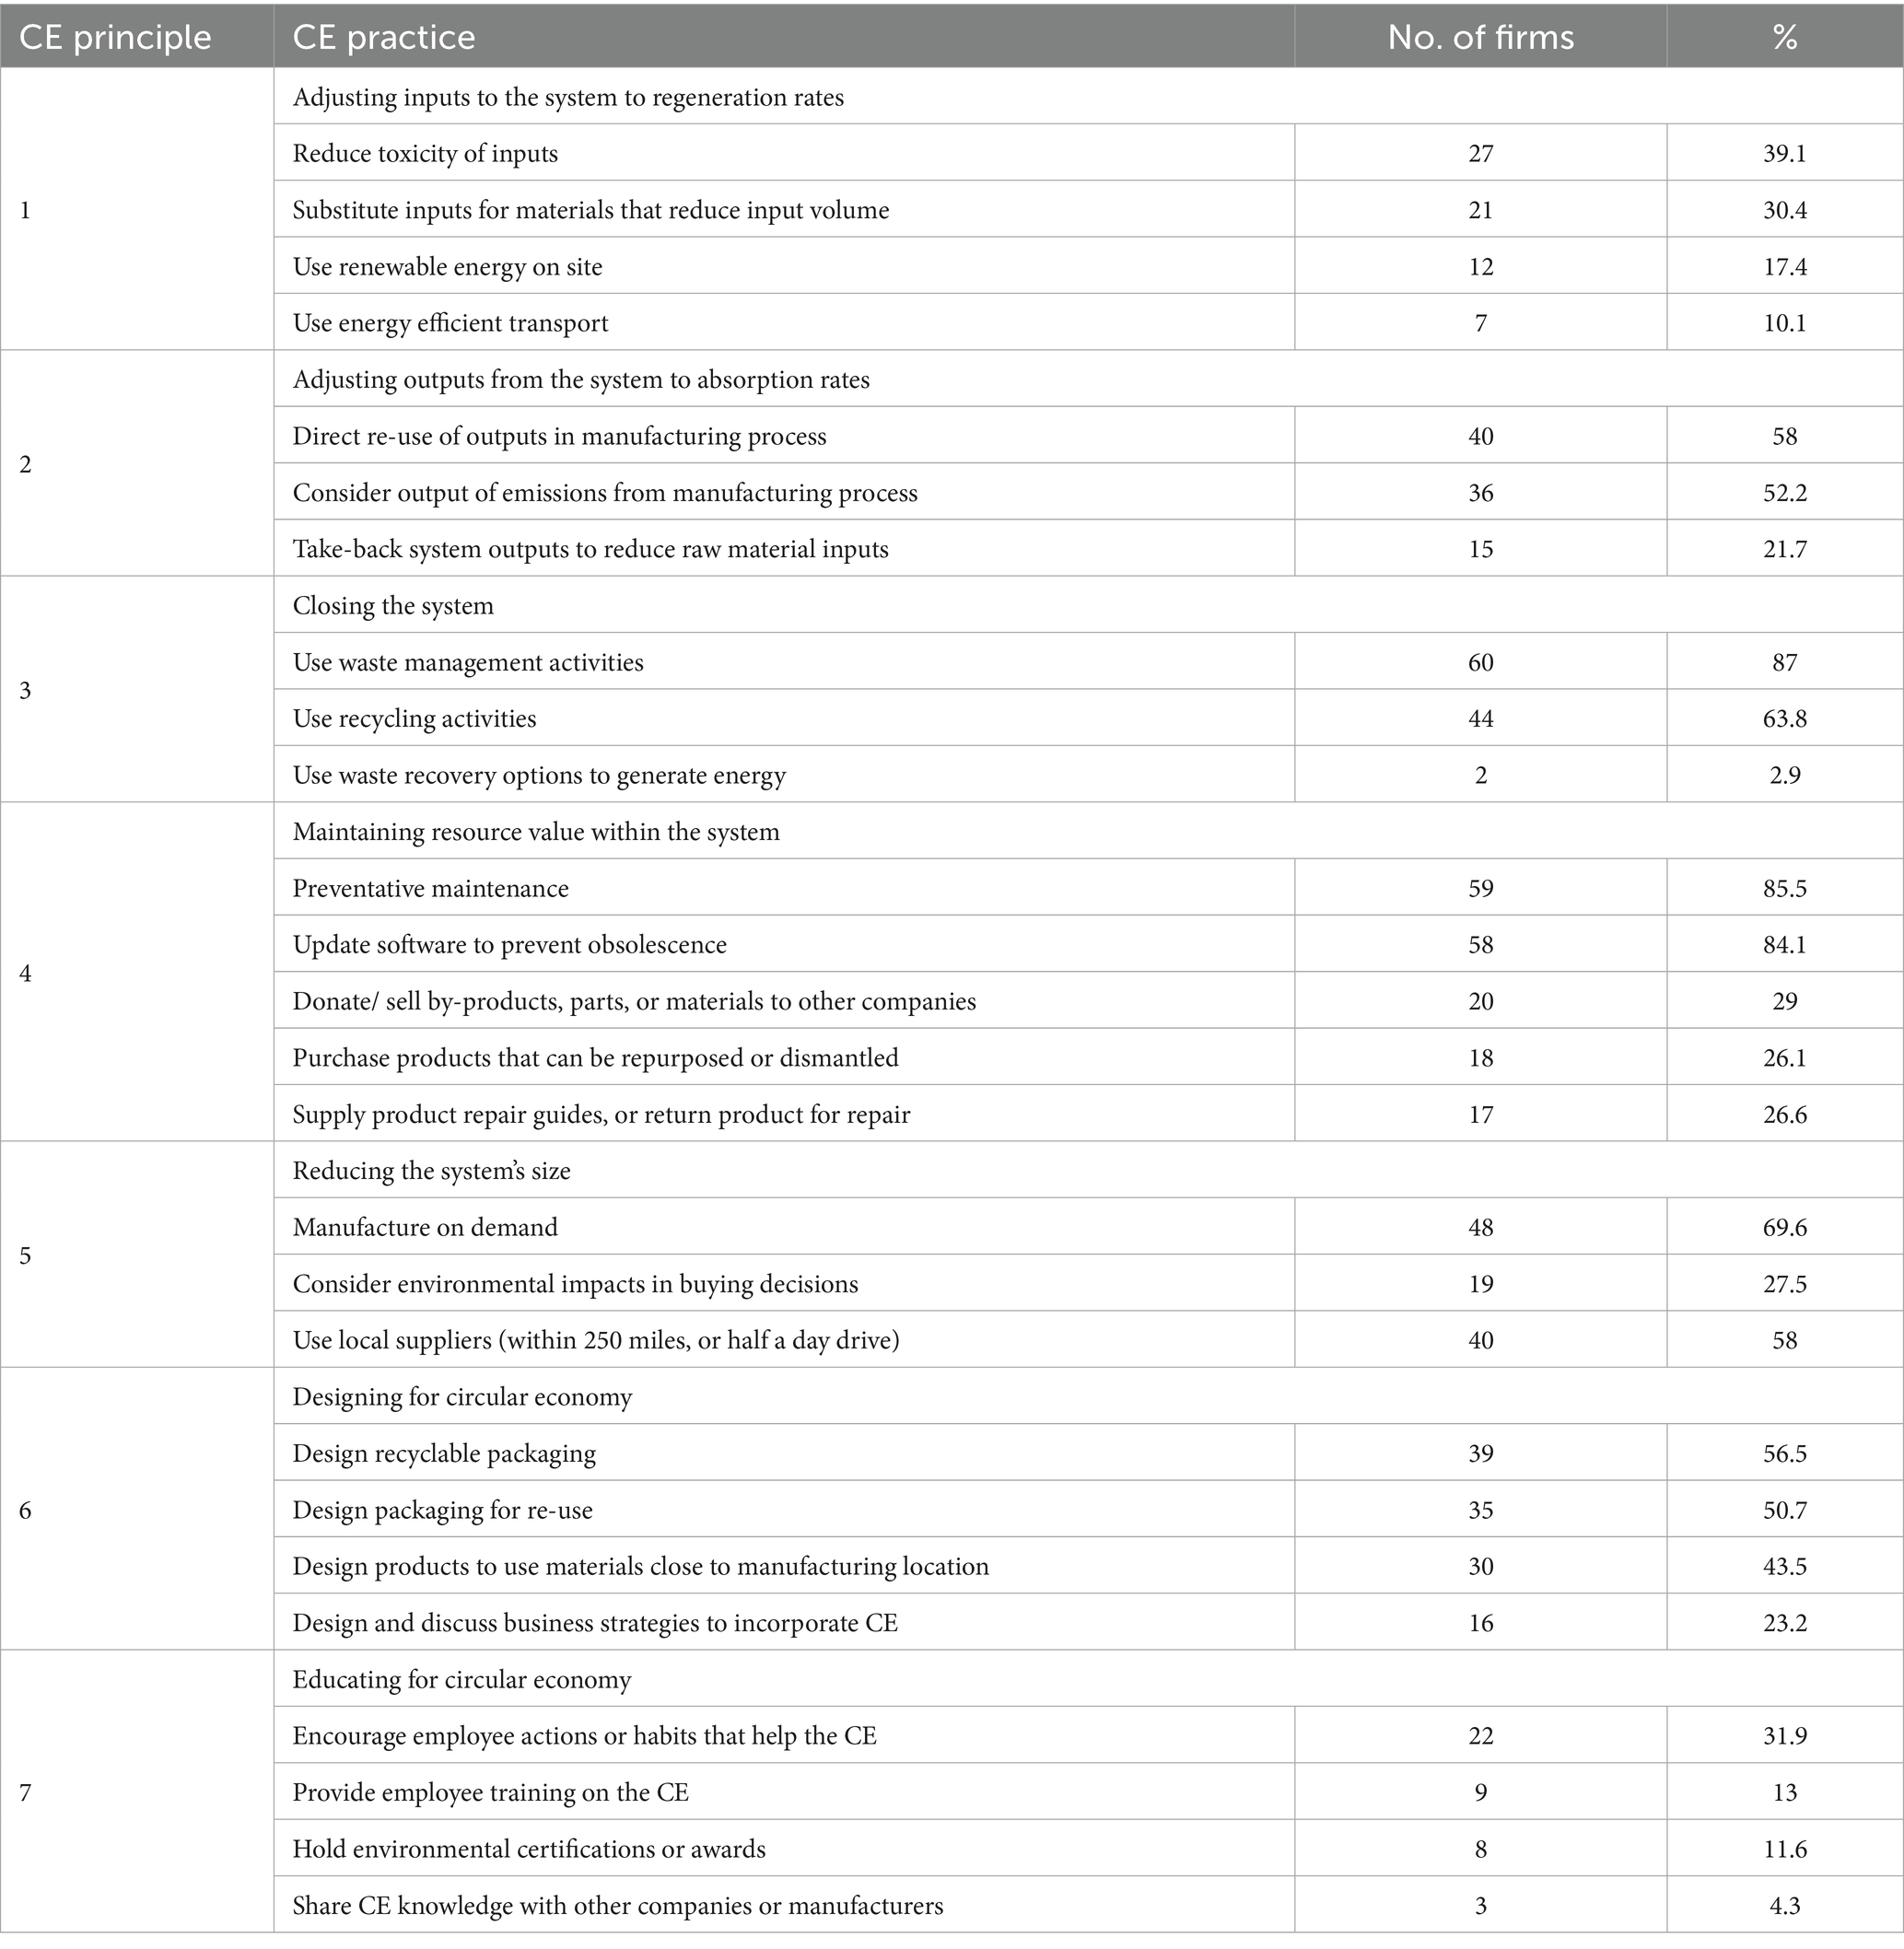
Table 2. Number and percentage of firms adopting CE practices grouped by CE principles (N = 69).
Examining the levels of CE implementation for each principle, we found that few respondents (10.3%) were at or beyond the transition phase for principle 7 (Figure 2). In contrast, all respondents had implemented at least one practice for principle 4, and many had reached circular implementation (43.5%). While most respondents were at the transition phase for principle 3 (59.4%), only one firm had reached circular implementation. Finally, principles 4, 5, and 6 were the only ones to have 10 or more firms meeting circular implementation.
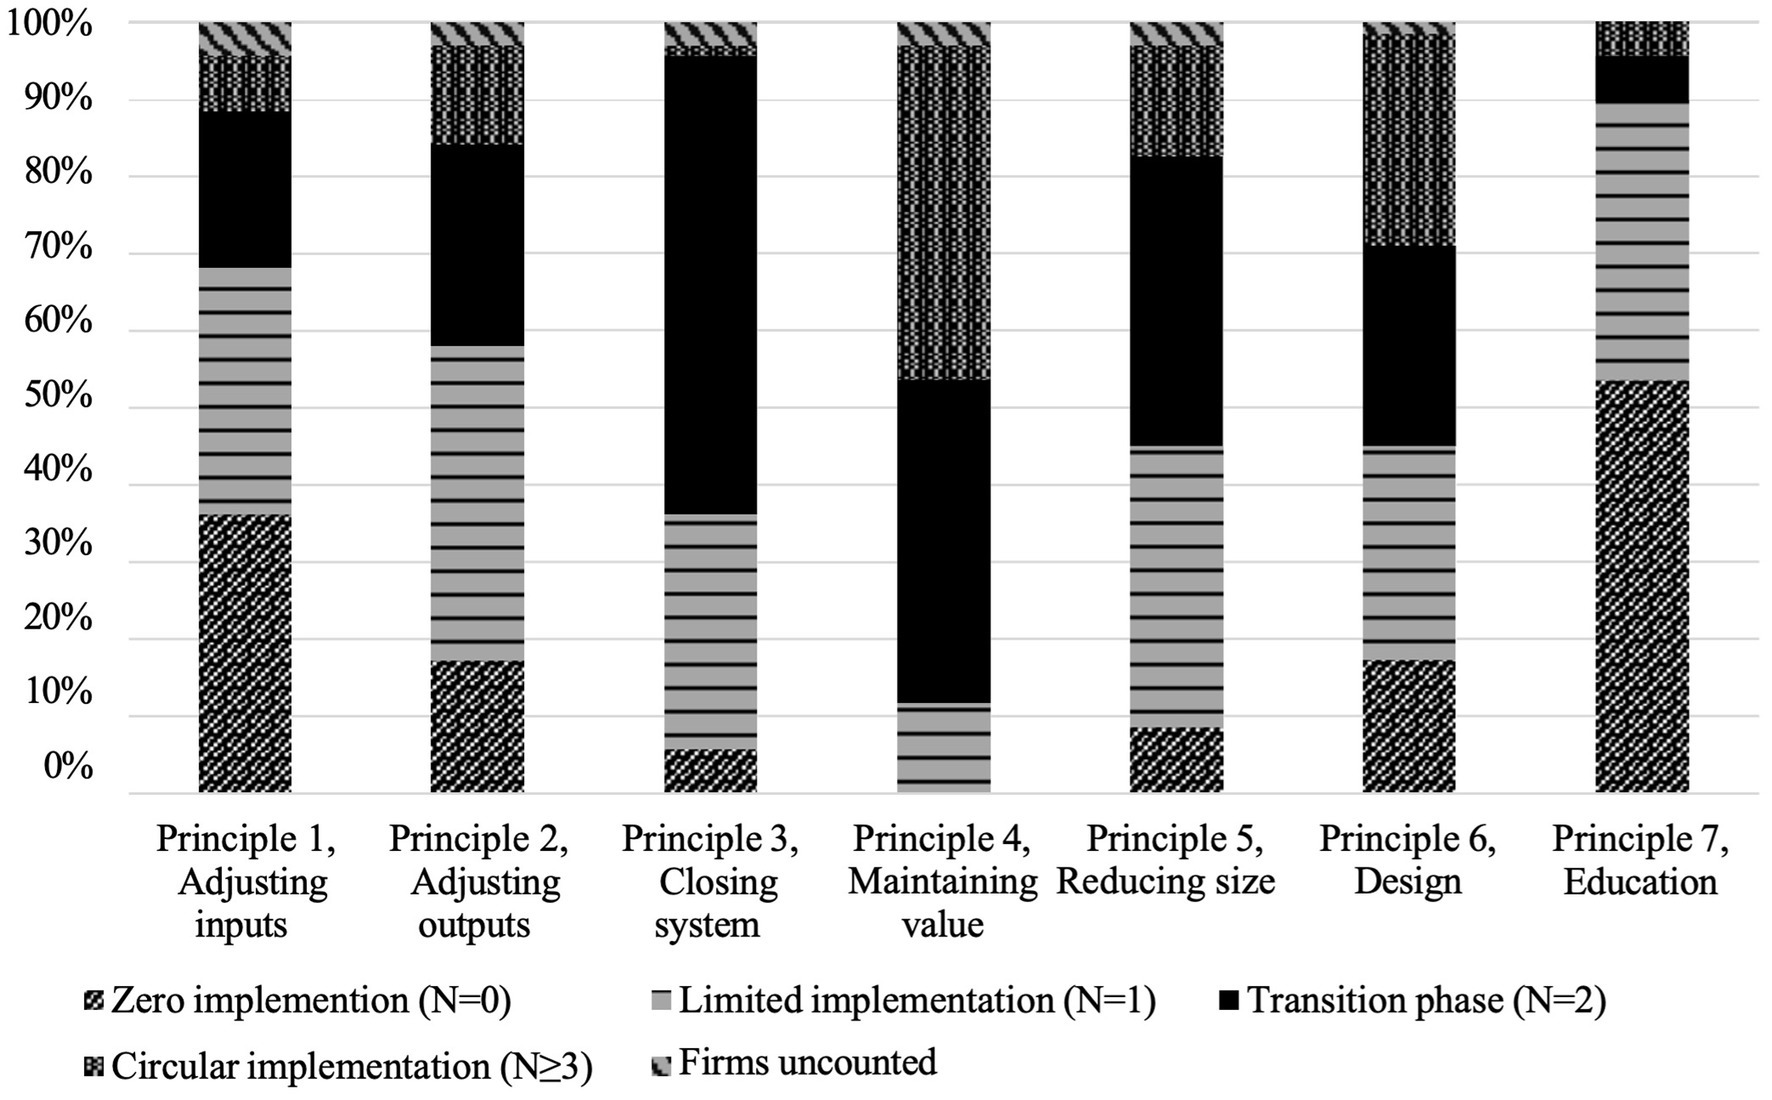
Figure 2. Implementation of the seven circular economy principles (P1–7), and the percentage of firms meeting each level of implementation (N = 69).
4.2 Relationships between company characteristics, motivation levels, and the adoption of circular economy principles
We found several significant relationships between company characteristics and CE principles (Table 3). Results showed a significant positive relationship between environmental certifications or awards and principles 1, 3, and 6 (95% confidence level) and between disadvantaged businesses and principle 5 (99% confidence level). The results also indicated significant positive relationships between annual gross sales and principle 3 (95% confidence level), and between company size and principle 1 (95% confidence level).
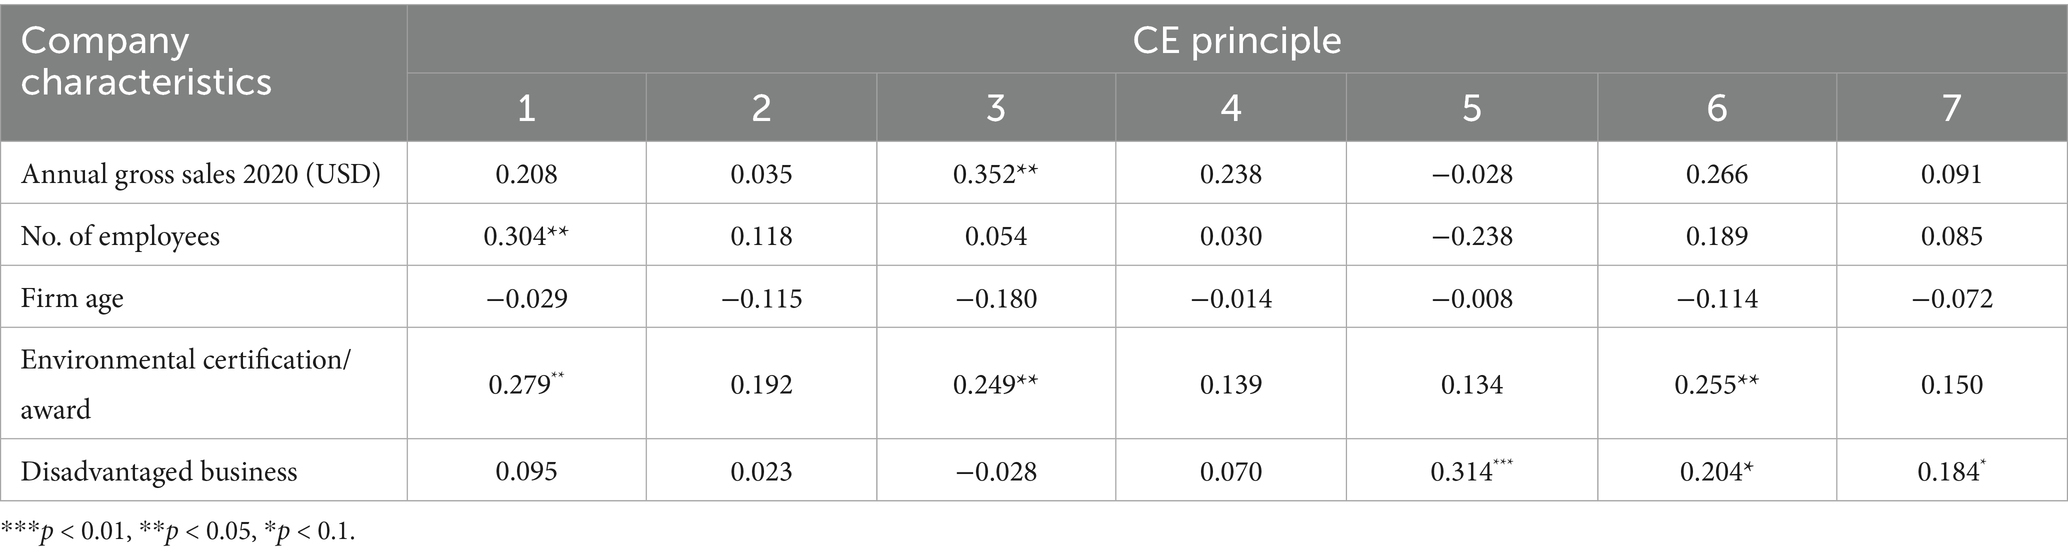
Table 3. Spearman’s rank correlation coefficient for the CE principles and their relationship with company characteristics.
We also found several significant relationships between levels of motivation and CE principles (Table 4). Results showed significant positive relationships between intrinsic motivation and principles 2, 5, 6, and 7 (95% confidence level). Results also showed a relationship between extrinsic motivation and principles 1, 2, 3, 6, and 7 with both questions related to integrated regulation positively correlated with principles 2 and 7, and both questions related to introjected regulation positively related to principle 2 (95% confidence level). The two questions related to amotivation showed a significant negative relationship between non-regulation and principle 7 (95% confidence level). Overall, our results show that as the level of motivation moves from intrinsic motivation (i.e., self-determined and internal) toward amotivation (i.e., non-self-determined and impersonal), their relationships with CE principles move from positive to negative.
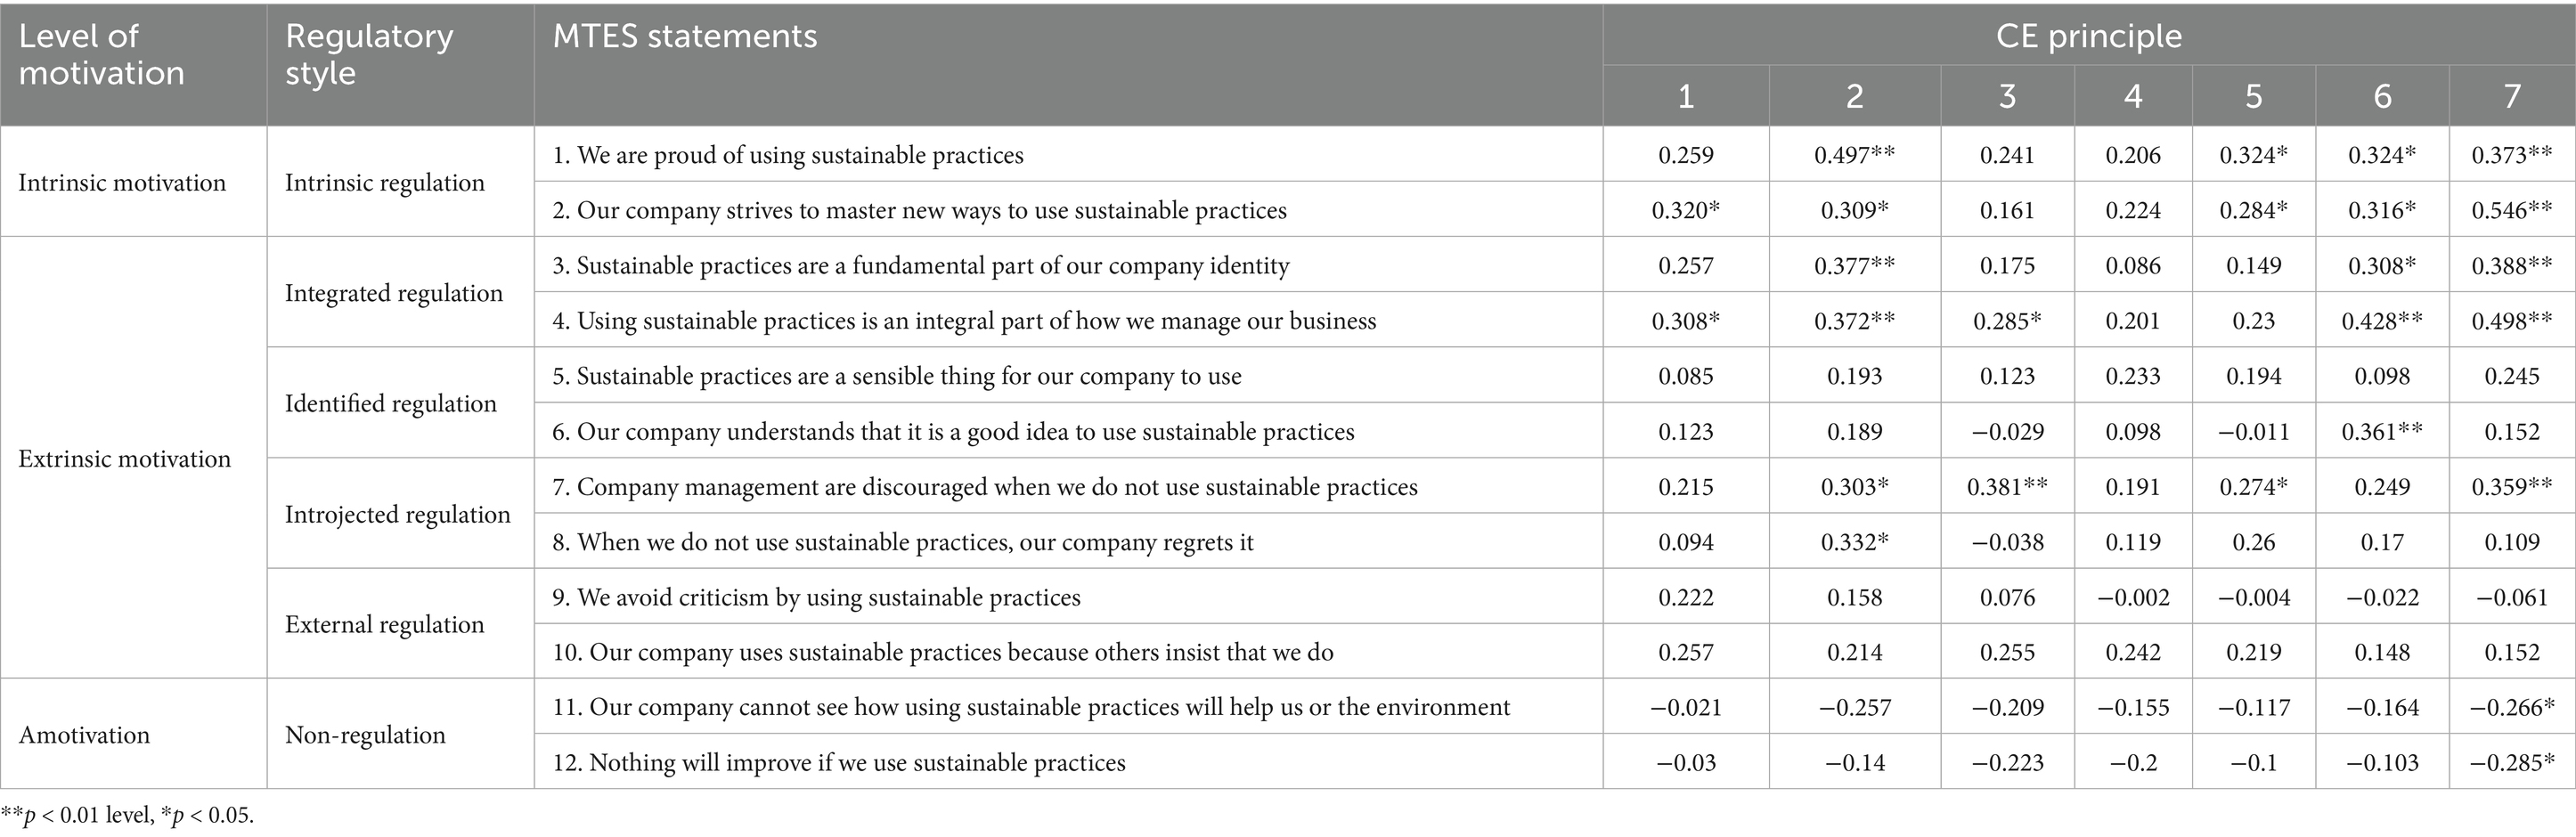
Table 4. Spearman’s rank correlation coefficients for MTES statements by CE principles and their relationship with leadership’s motivation.
Finally, we compared company characteristics to levels of motivation (Table 5). We found that some company characteristics showed significant relationships with intrinsic and integrated motivation. A significant relationship was reported between intrinsic and integrated motivation and companies who held an environmental certification or award. Relationships were noted between disadvantaged businesses and different regulatory styles. Intrinsic regulation resulted in a significant positive relationship (95% confidence level) and introjected regulation (99% confidence level). Negative correlations were apparent between all company characteristics and amotivation.
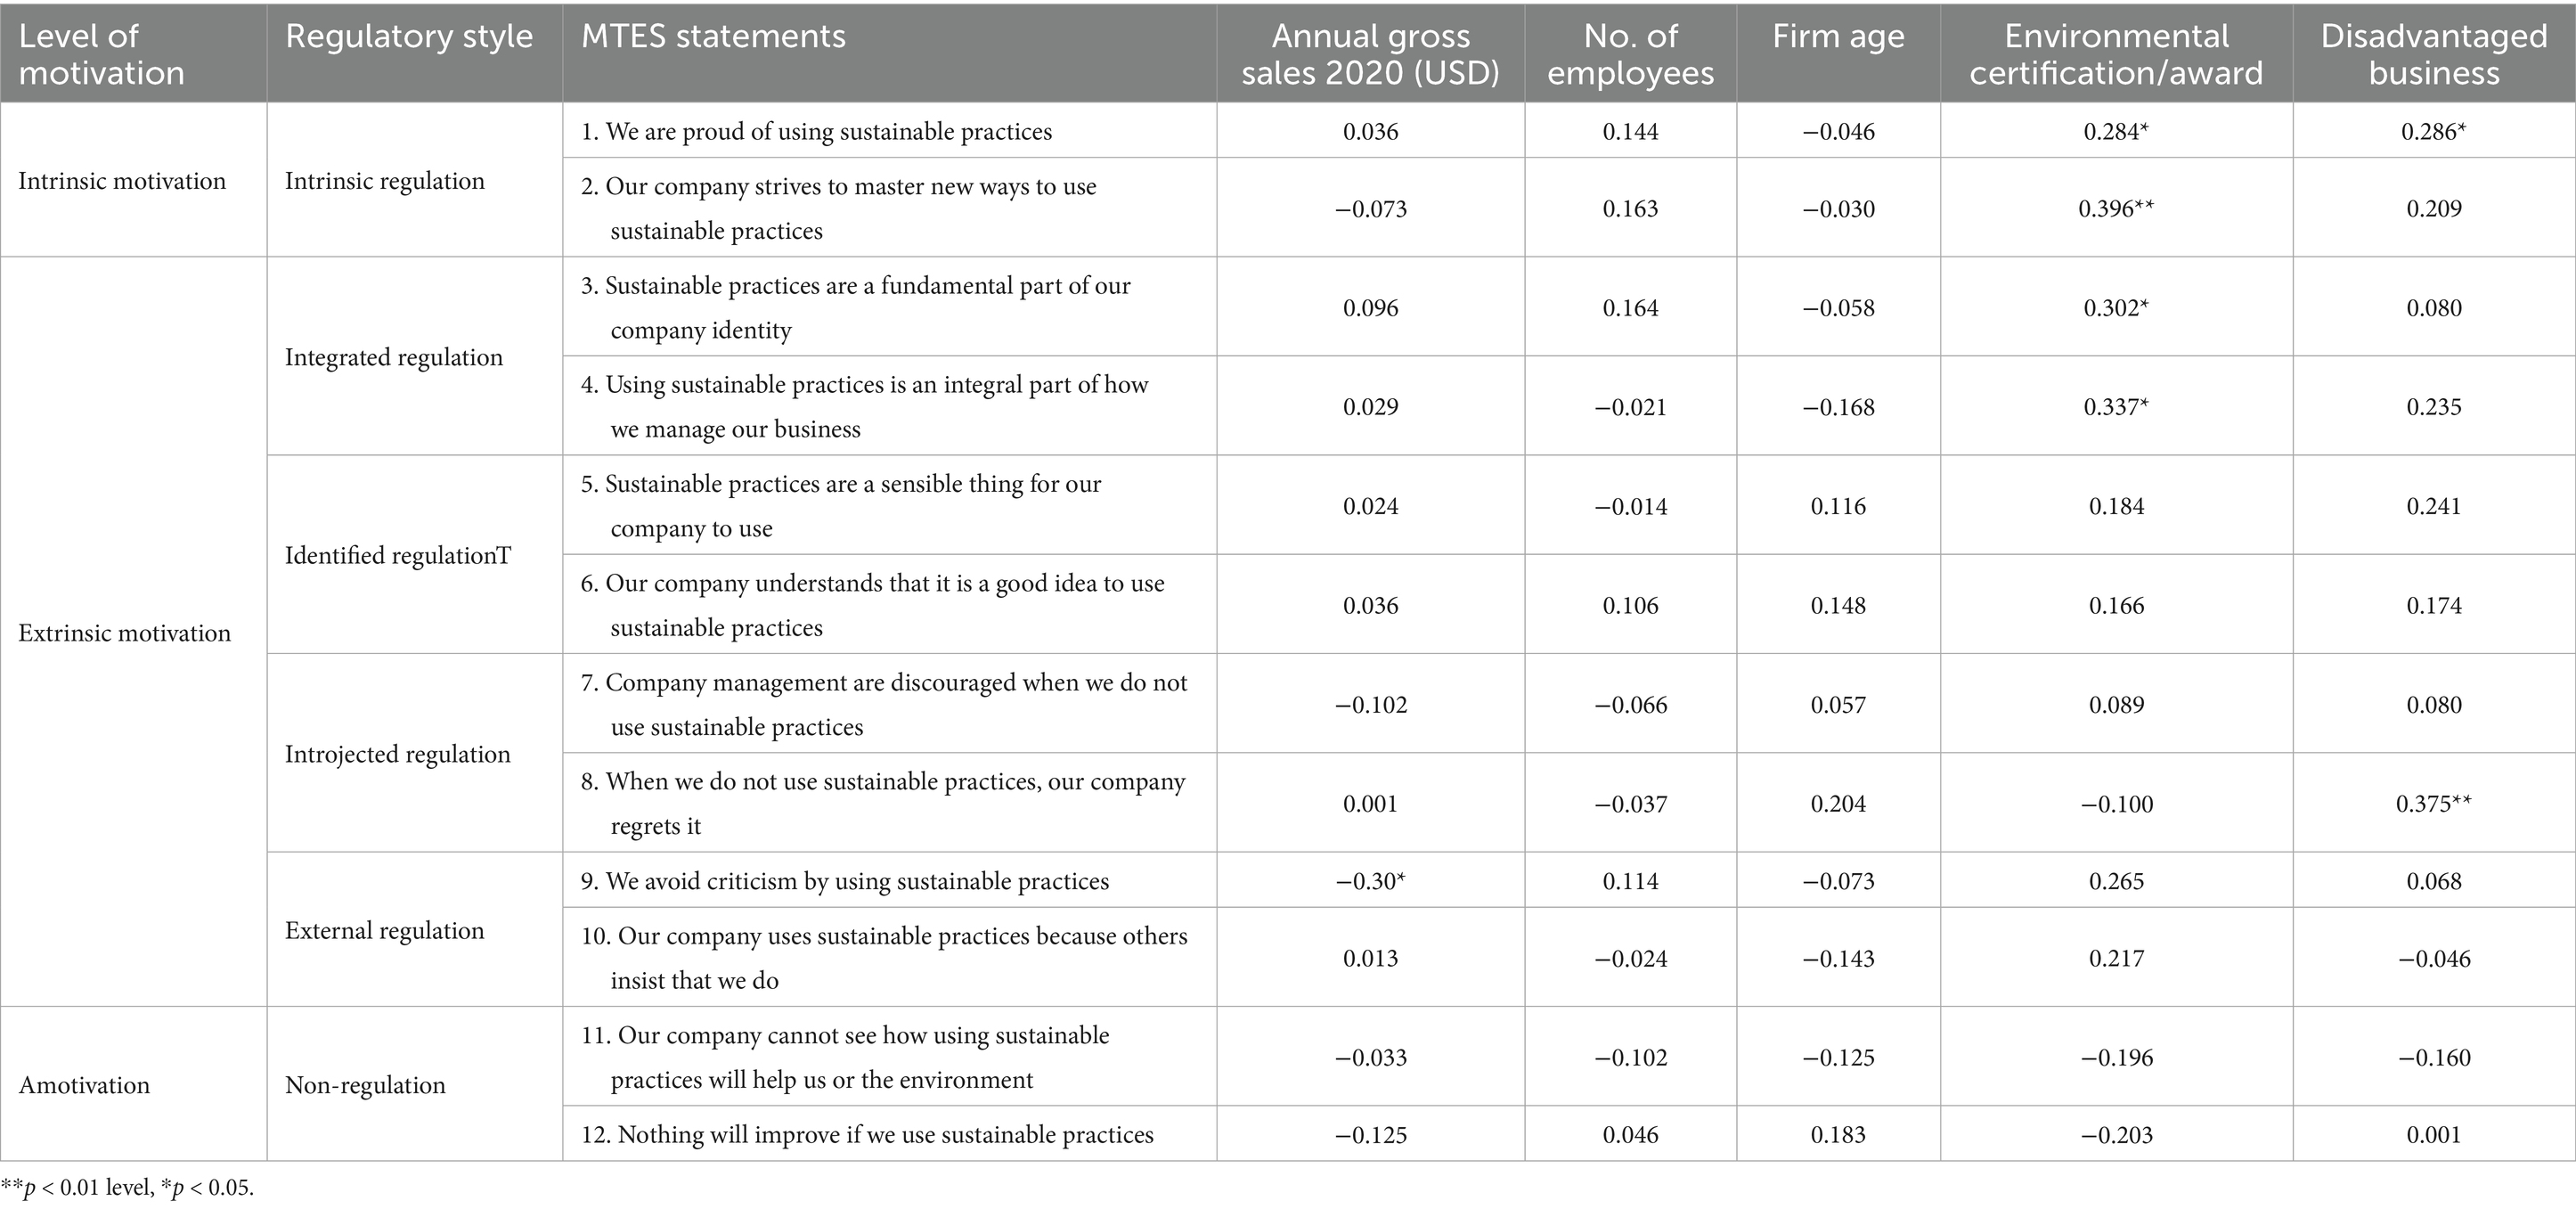
Table 5. Spearman’s rank correlation coefficients for MTES statements by company characteristics and their relationship with leadership’s motivation.
Based on the correlation results, we conducted Mann–Whitney U tests to examine differences in CE principle adoption (Table 6) and MTES motivation scores (Table 7) among companies grouped by key characteristics. We focused specifically on disadvantaged versus non-disadvantaged businesses, businesses with environmental certifications versus those without, and those with annual sales below or above $10 million USD. First, results showed disadvantaged-owned businesses reported significantly higher adoption of principle 5 (Reducing the system’s size; U = 295.0, 95% confidence level). Marginally significant differences were identified for principle 6 (Designing for circular economy; U = 360.0, 90% confidence level) and principle 7 (Educating for circular economy; U = 378.0, 90% confidence level). No significant differences were found for principles 1, 2, 3, or 4 (all p-values > 0.10). We further examined motivational differences using MTES. Disadvantaged-owned businesses scored significantly higher on intrinsic motivation (MTES 1: personal satisfaction; U = 196.0, 95% confidence level) and extrinsic motivation (MTES 8: regulatory compliance; U = 150.5, 99% confidence level). MTES 4 (personal responsibility) was marginally higher among disadvantaged-owned businesses (U = 201.0, 90% confidence level).
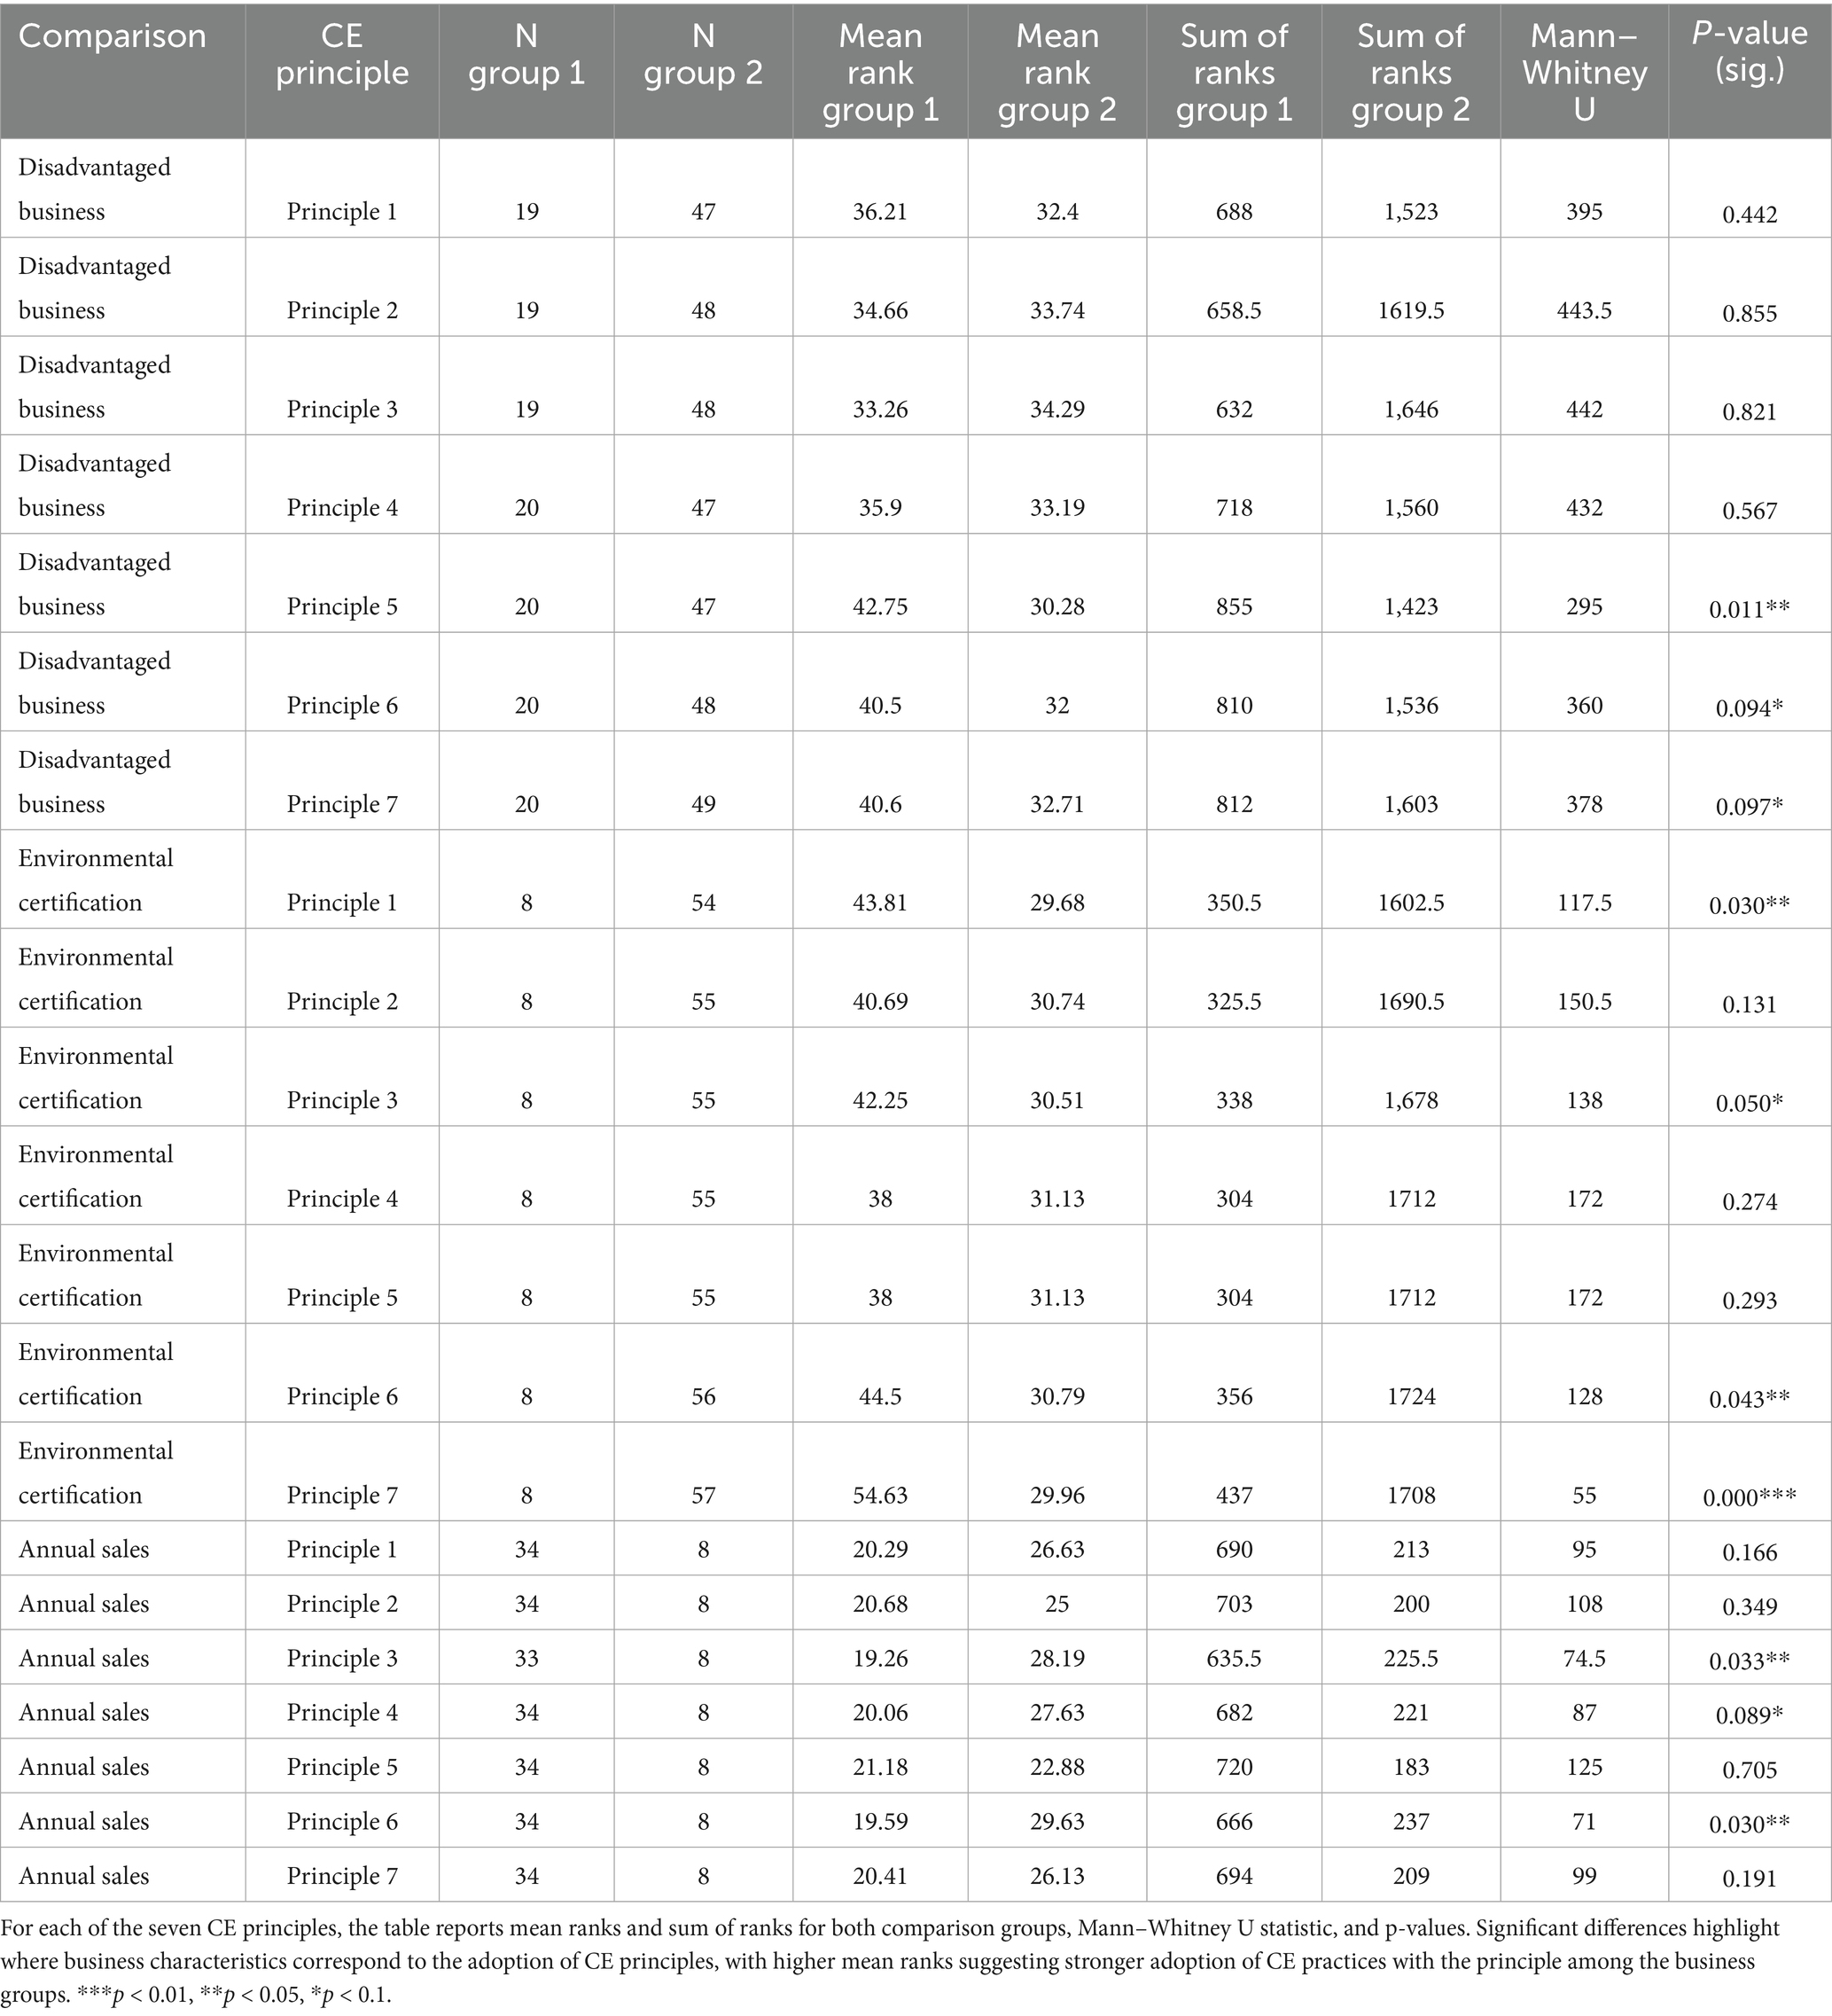
Table 6. Mann–Whitney U test results for CE principles across three comparison groups: disadvantaged versus non-disadvantaged businesses, environmental certification versus no certification, and annual sales (below $10 M USD versus above $10 M USD) categories.
Table 7. Mann–Whitney U test results for the Motivation Toward the Environment Scale (MTES) items across three comparison groups: disadvantaged versus non-disadvantaged businesses, environmental certification versus no certification, and annual sales categories.
Environmental certifications also influenced CE principle adoption. Businesses with an environmental certification reported higher adoption for principle 1 (Adjusting inputs; U = 117.5, 95% confidence level), principle 3 (Closing the system; U = 138.0, 95% confidence level), principle 6 (Designing for circular economy; U = 128.0, 95% confidence level), and principle 7 (Educating for circular economy; U = 55.0, 99% confidence level). Principles 2, 4, and 5 showed no significant differences by environmental certification status. Businesses with environmental certifications also displayed significantly higher motivation scores, including intrinsic motivation (MTES 1: U = 100.0, 95% confidence level), integrated motivation aligned with core values (MTES 2: U = 54.0, 99% confidence level), and identified regulation (MTES 3: U = 81.0, 95% confidence level; MTES 4: U = 71.0, 95% confidence level). Extrinsic motivation through external recognition was marginally significant (MTES 9: U = 89.5, 90% confidence level).
Finally, we compared manufacturers with higher annual sales ($10 to <$100 million) to those earning under $10 million. Businesses with higher annual sales adopted principle 3 (Closing the system; U = 74.5, 95% confidence level), principle 4 (Maintaining resource value; U = 87.0, 90% confidence level), and principle 6 (Designing for circular economy; U = 71.0, 95% confidence level) at higher levels than firms with lower annual sales. Only MTES item 10 (regret over inaction) significantly differed, with businesses with higher annual sales reporting stronger agreement (U = 97.5, 95% confidence level).
4.3 Rankings of motivations and barriers
To further examine factors influencing CE adoption, we asked respondents to rank motivations and barriers to implementing CE practices (Figures 3, 4, respectively). Results indicated that financial and cost-related benefits were the most frequently cited motivations, with nearly half of respondents (48%) identifying financial factors as their highest-ranked motivation (Rank 1). Other motivations frequently ranked as important included regulatory compliance, company reputation, and a desire to help the environment. Cost emerged as the most cited impediment to CE adoption with 18 respondents ranking it as the top barrier. Additionally, knowledge and understanding barriers were also cited; specifically, 23 respondents cited uncertainty regarding their practicality and effectiveness of CE practices.
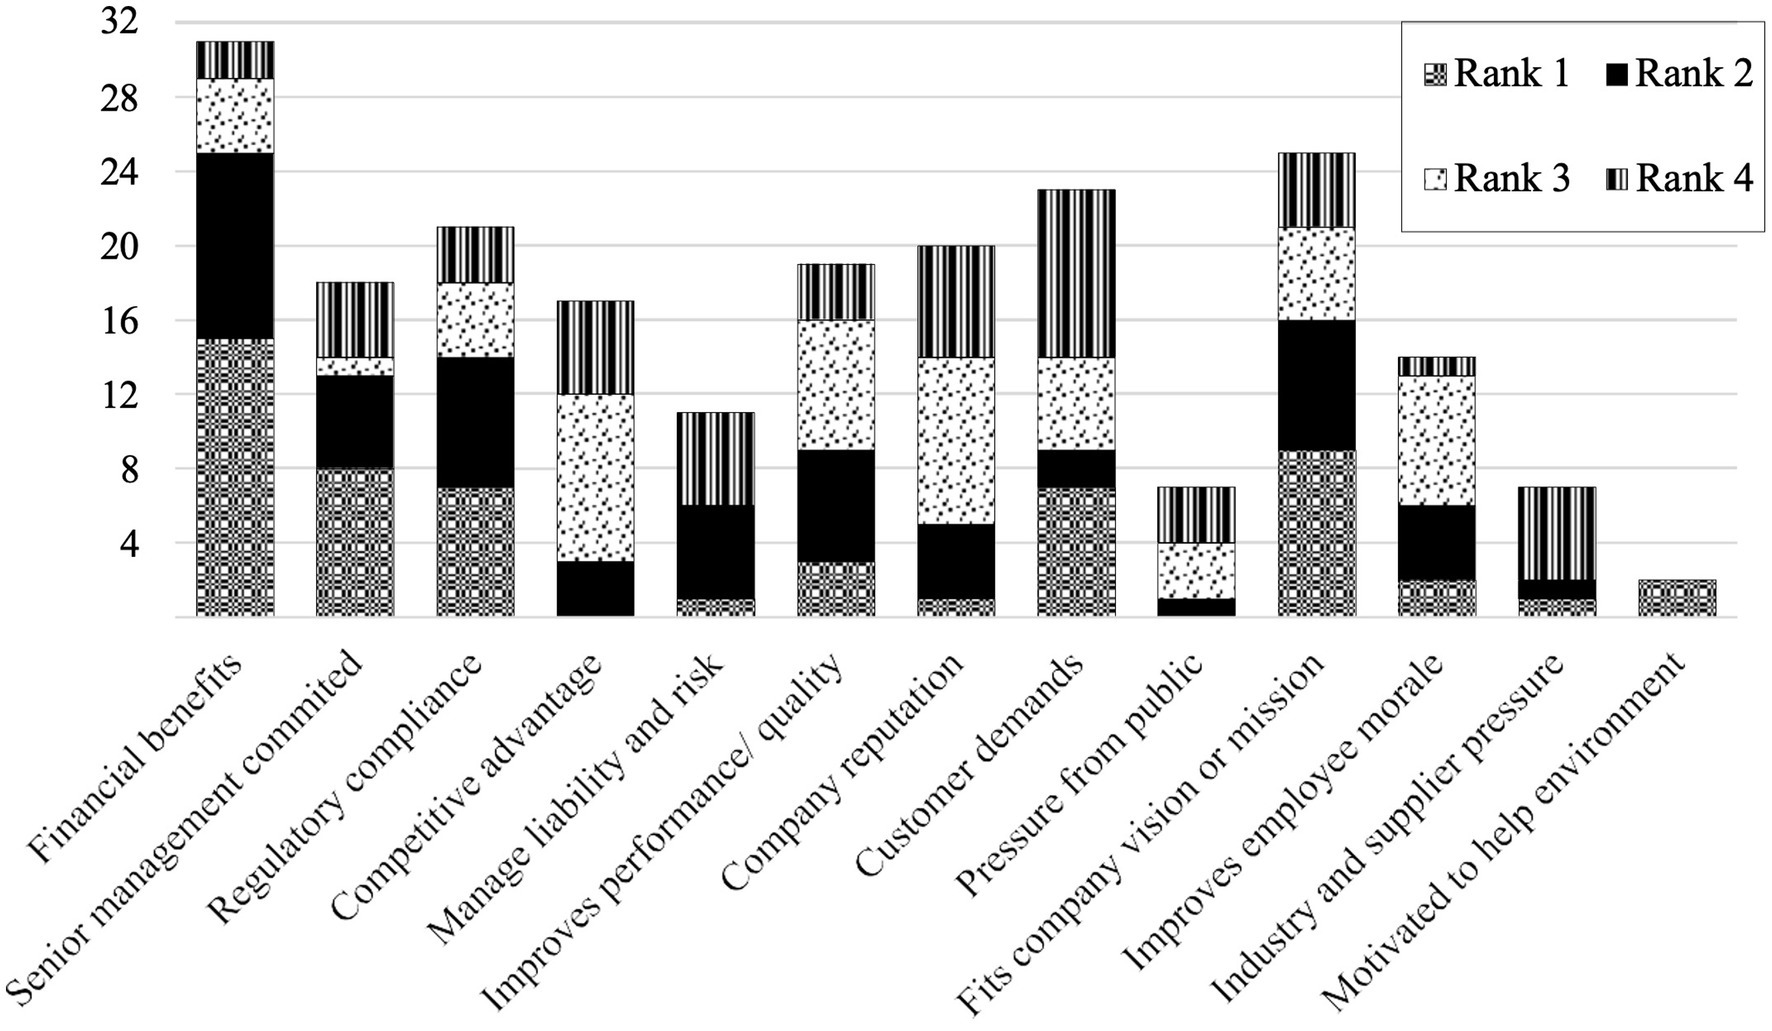
Figure 3. Frequency distribution of factors motivating circular economy (CE) implementation based on company leadership’s aggregated rankings (Rank 1 = most important; Rank 4 = least important).
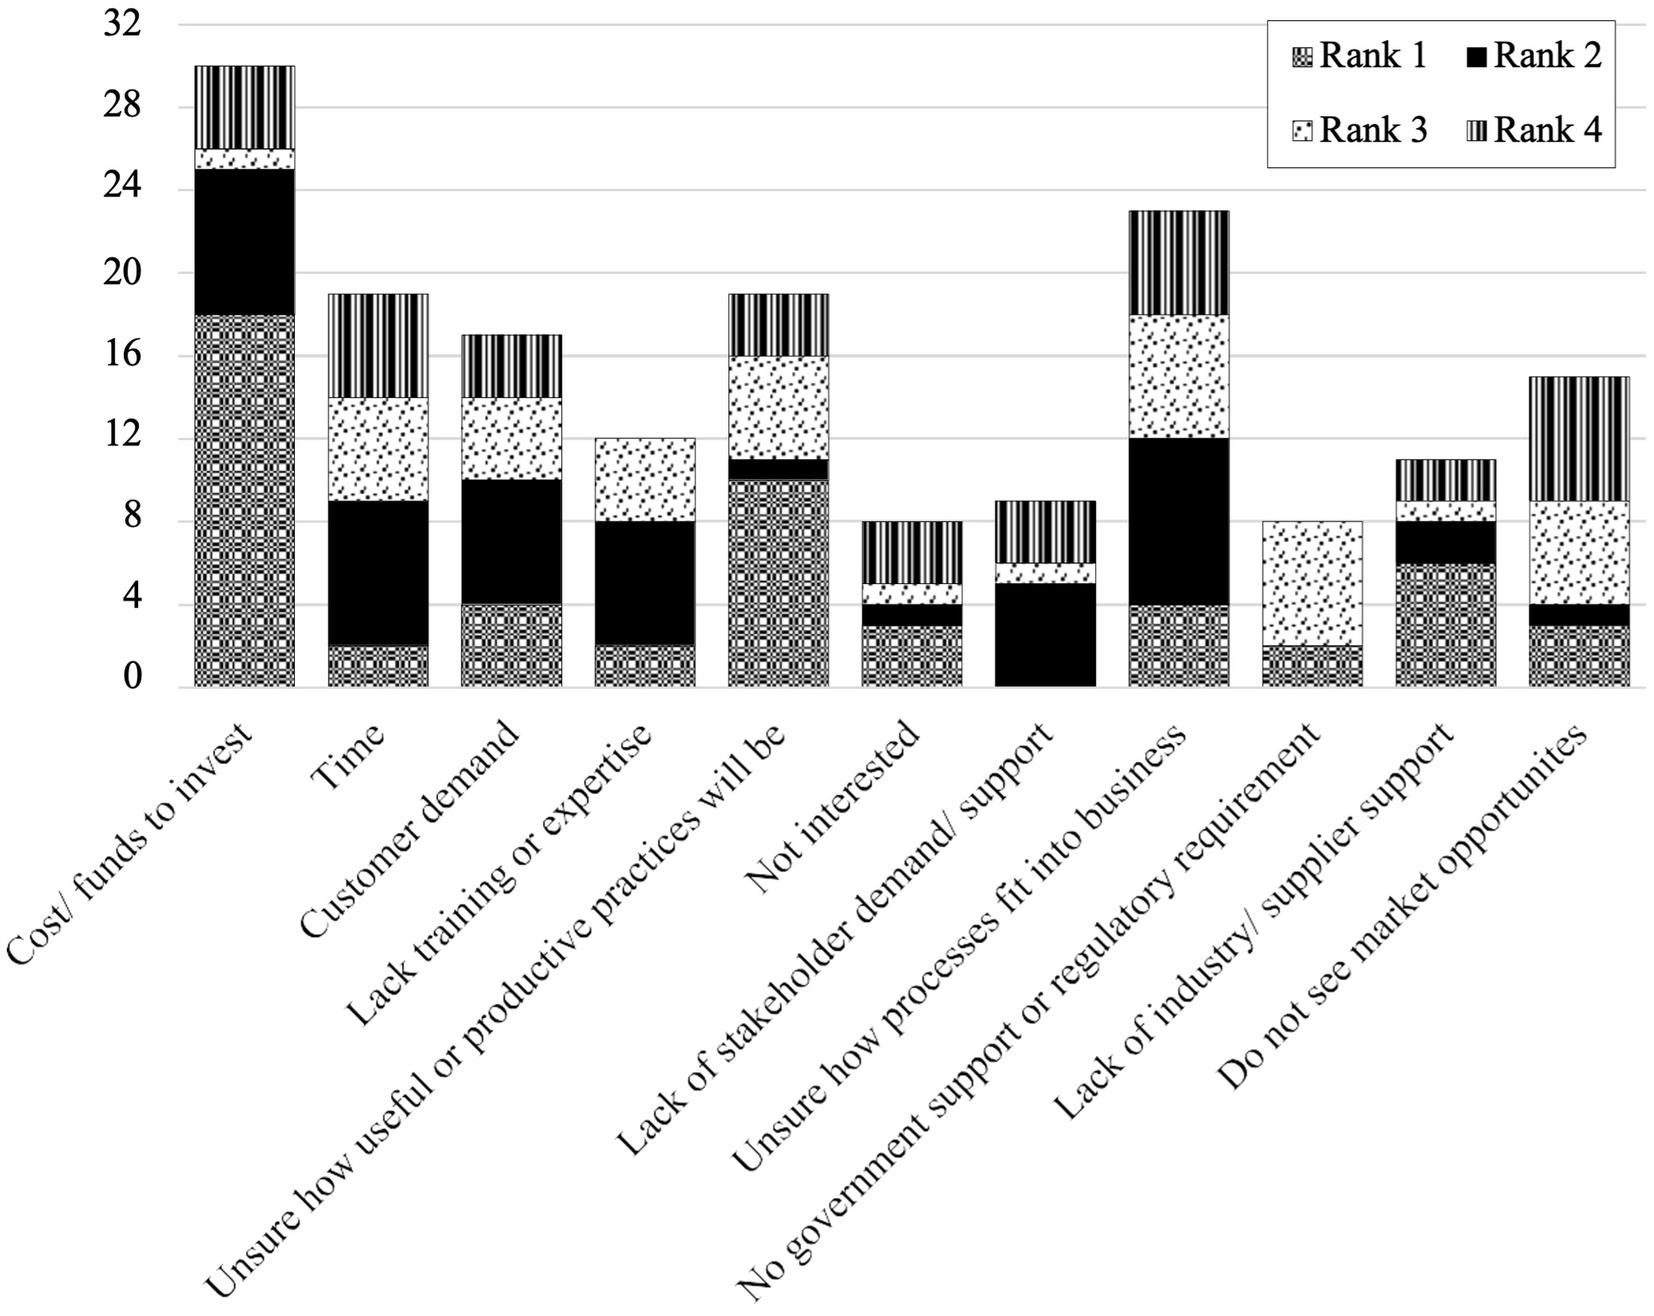
Figure 4. Frequency distribution of factors preventing circular economy (CE) implementation based on company leadership’s aggregated rankings (Rank 1 = most important; Rank 4 = least important).
5 Discussion
The business practices of small manufacturers provide important contributions as economies shift from linear-based processes to regenerative, circular systems. Transitioning to a circular economy requires manufacturers to adopt practices aligned with principles designed to achieve circular implementation. Yet the practices that manufacturers implement are shaped by businesses’ characteristics and by leadership’s motivations. In this research, we documented the CE practices and principles adopted by manufacturers in the DFW metroplex and assessed the extent to which company characteristics and leadership’s motivations affected their uptake. We found that characteristics and motivations affect implementation of CE practices and principles to differing degrees. We discuss our results within the context of the broader literature and provide additional nuance based on comments left by survey respondents. We begin with a discussion on the linkages between business characteristics and the adoption of CE principles and conclude by differentiating the relationships between leadership motivations and CE principles.
5.1 Company characteristics and the adoption of CE principles
Our results show several company characteristics affected the adoption of CE principles, and affected levels of motivation. Company characteristics were related to four of the seven principles. Based on previous research, we expected to find that company characteristics are related to different CE principles (Bakos et al., 2020). Environmental certifications influenced the uptake of principles 1, 3, and 6, and it proved to be the strongest characteristic influencing CE implementation overall. Some respondents provided details on their businesses’ environmental certifications. Respondents reported that their companies held Six Sigma, ISO14001, and Forest Stewardship Chain of Custody certifications. Companies who held certifications were more intrinsically motivated, which may be due to the voluntary requirements firms adhere to when obtaining these certifications. For example, ISO14001 strives for companies to adopt continuous improvement for environmental management. When companies adopt these internal business operations, they may see how fundamental sustainability is to their business, and they may also begin to feel proud about the impact theses operations have on the environment. This may aid the development of more intrinsic motivation and result in the implementation of more CE practices. This result is similar to Ashton et al. (2017), who found that companies with certifications were more likely to use environmental practices.
We also found when companies held certifications or received environmental awards their level of implementation tended to move beyond the “zero implementation” to “limited implantation” and “transition phase.” Moreover, manufacturers that held certifications or received awards reported higher adoption of CE principles 1, 3, 6, and 7. These findings suggest that certifications lead not only to implementation of CE practices but to increases in strategic business thinking and improvements to business operations (Brouwer and van Koppen, 2008; Ni et al., 2019). Moreover, certifications require firms to find and reduce environmental impacts and regularly evaluate their performance. For example, to assess environmental improvements, businesses often begin by recording and reporting waste reduction and energy conservation metrics to meet certification criteria (Singh et al., 2015). It makes sense then that the pursuit and accrual of environmental certifications are related to these CE principles because continual improvement is a key feature of environmental certifications. The accrual of certifications most likely explains their relationship with principle 6 as well, which requires businesses to discuss strategies and make improvements to company operations, processes, product and packaging design, and the supply chain (Mendoza et al., 2017). Because of this, environmental certifications and awards enable companies to transition toward CE implementation (Brammer et al., 2012; Hoogendoorn et al., 2015).
Results also show that an increase in annual sales was correlated with the adoption of principle 3 practices. Similar to previous research, we found that when companies reported annual sales over $10 million (USD) they were less likely to have no principle 3 practices in use, compared to companies who reported less than $10 million (USD) (Ashton et al., 2017). This suggests that larger manufacturers may have greater financial capacity to implement waste management and recycling activities. Yet principle 3 practices could easily be adopted by manufacturers earning less than $10 million (USD) because there is ample evidence in the literature that waste management activities, such as minimizing, recycling, and re-using wastes, greatly reduces the costs associated with traditional waste disposal techniques (Ellen MacArthur Foundation, 2013; Geyer and Doctori Blass, 2009). In fact, the most used practice was the implementation of waste management activities, which is a non-strategic practice and easily implemented. Further, manufacturers waste practices are often linked to regulatory requirements. Because of the elevated level of waste management activities, most respondents were within the transition phase for principle 3. Waste practices of DFW manufacturers included waste segregation of general garbage from recyclables, hazardous waste separation, baling of recyclables on site, zero waste to landfill measures, and sending waste materials to be recycled or recovered off-site; yet, most respondents had not implemented any energy recovery practices. Energy recovery options require technical and economic feasibility studies for sound integration within a system and require a more strategic, self-determined approach (Peiry et al., 2012). Companies with high annual sales most likely have the funds to explore and implement energy recovery practices; however, our results indicate that other implementation barriers exist and require further exploration. While we found no significant correlation between principle 4 and company characteristics, group comparisons showed that firms with higher annual sales were marginally more likely to adopt principle 4 practices, such as preventative maintenance and software updates, and principle 6 practice, such as designing recyclable packaging. This suggests that, although widespread among manufacturers, financial capacity may still play a role in the extent of implementation, particularly for more resource-intensive maintenance strategies. Companies commonly maintain and update software to enhance their operations and processes (Bonilla et al., 2018; Ellen MacArthur Foundation, 2015). Similarly, manufacturers often opt for preventative maintenance as it prolongs the lifespan of their equipment and machinery. This suggests that businesses recognize the benefits of maintaining performance and competitiveness through the practices of principle 4 (Lazim et al., 2019; Zhou et al., 2020).
Finally, the role of disadvantaged businesses and the implementation of CE principles are understudied within the literature. We received responses from 20 DFW-area disadvantaged businesses, which formed 29% of all respondents. The respondents from disadvantaged businesses comprised of woman-owned, minority-owned, LGBTQIA+ owned, and veteran-owned businesses. We found a relationship between these businesses and their adherence to principle 5, specifically, their tendency toward green purchasing decisions. We also found that disadvantaged manufacturers had higher adoption of principle 5 (Reducing the system’s size) and marginally higher adoption of principles 6 (Designing for CE) and 7 (Educating for CE) than non-disadvantaged manufacturers. This could be due to their efforts to meet client expectations and enhance competitiveness. Alternatively, their heightened social responsibility and awareness of the linkage between social issues and environmental sustainability, attributed to their life experiences, could also play a part (Thornton et al., 2013). Supply chain contractual obligations might be another driver, as other tiers might prefer working with disadvantaged manufacturers due to their own social responsibility commitments, influencing disadvantaged-owned manufacturers to make sustainable purchasing decisions. Due to the limited number of respondents, we could not ascertain if any specific disadvantaged business category had a more significant influence on CE implementation. Further research is required for a more comprehensive understanding of their impact on CE practices.
Overall, our results show that disadvantaged businesses contribute to advancing CE principles. Decisionmakers and industry leaders could support their efforts by providing grants or subsidies that encourage green purchasing decisions. Moreover, procurement strategies that strengthen partnerships between disadvantaged businesses and larger firms may amplify their impact on CE implementation. Additionally, programs that highlight leadership in sustainability and training opportunities tailored to the unique needs of disadvantaged businesses may further enhance their contributions. Addressing both barriers and opportunities faced by disadvantaged businesses would better align environmental sustainability with social equity goals and ensure a more inclusive transition to the circular economy.
5.2 Leadership motivation and the adoption of CE principles
Our study also revealed regulatory styles as the top sources of motivation impacting the adoption of CE practices. First, our analysis showed a positive relationship between principle 2 and the regulatory styles linked to both intrinsic and extrinsic motivation. These styles typically stem from a degree of internal motivation. This relationship was expected since adopting practices of principle 2, such as direct reuse and emissions reduction, necessitates additional effort and planning (Revell et al., 2010). Additionally, respondents identified cost savings and return-on-investment considerations as factors influencing their decisions, as well as motivations related to regulatory compliance and company reputation. The emphasis respondents placed on these financial incentives aligns with previous findings (Lewis and Cassells, 2010; Ashton et al., 2017). This suggests the influence of extrinsic motivations, especially when perceived as internally beneficial through cost–benefit analyses. These results also reinforce that although extrinsic motivations can be effective, they mostly encourage the adoption of simpler, cost-effective CE practices rather than mores strategic ones.
Interestingly, consideration of output emissions was tied to intrinsic motivation, implying that businesses adopting this practice often have a deep-seated environmental commitment driving improvements to their manufacturing processes. This insight provides information on how motivation can influence the implementation of more complex CE practices and could potentially guide CE advocates in promoting sustainable emission levels within planetary boundaries (Hansen et al., 2013; Persson et al., 2022).
We also observed that higher self-determination levels might promote the adoption of more challenging CE practices. However, perceptions of motivation can shift, especially with increasing pressures around emerging environmental, social, and governance (ESG) factors and achieving carbon neutrality. It is important to highlight that respondents’ views of perceived motivations could vary over time, especially as pressure around ESG and carbon net-zero heightens within supply chains.
Respondents’ rankings of perceived barriers further illustrate challenges small manufacturers face related to financial constraints. Cost-related concerns, specifically the available funds for initial investments, were the highest ranked barrier among respondents. Additionally, manufacturers reported uncertainty regarding how CE practices fit into existing business models and whether these practices would yield productive outcomes. These barriers highlight the need for educational programs and technical assistance to show the benefits of CE implementation. Addressing these barriers could mitigate amotivation resulting from uncertainty and enhance leaderships’ confidence and intrinsic motivation toward adopting more CE practices.
Notably, adoption of several CE principles, especially principles 6 and 7, could improve with increased environmental self-determination among firm leadership. Principle 6 adoption was moderately associated with environmental certifications, but more strongly correlated with self-determination and intrinsic motivation. The integration of these principles, encompassing innovation, design, employee actions, and training, could overcome various perceived barriers, including uncertainty about process fit, productivity, lack of training, and stakeholder demand. This suggests that efforts to improve self-determination and transition toward intrinsic motivation would strengthen uptake of principles 6 and 7 across all firms regardless of company characteristics. Our results align with other studies, showing that “circular companies” with internalized CE implementation achieve superior performance, highlighting the importance of leadership motivation in recognizing the usefulness of CE adoption (Gusmerotti et al., 2019). Moreover, adoption of principle 7 practices would expand knowledge sharing opportunities and supply educational routes to bridge the perception of these barriers.
Our results also suggest that amotivation prevents CE uptake across all seven principles. Research has shown that non-regulation or external regulation, such as governments enacting stricter legislation, leads to amotivation within firms, which limits knowledge sharing and education (Masurel, 2007). Although some firms may believe that legislation, and other external regulators, motivates businesses to implement CE (Lewis and Cassells, 2010), our results show that non-regulation and external regulation only go so far. For example, regulatory compliance, an externally regulated motivation style, has been found to not truly improve self-determination, and therefore, lead to businesses only implementing practices that are easy to adopt (Ashton et al., 2017; Revell et al., 2010). To transform businesses into circular implementation, there is a need to understand how leadership cultivates the motivation needed to support the CE. While company characteristics have some influence on specific CE practices, intrinsic environmental motivation appears critical in fostering CE adoption. Therefore, enhancing leadership’s self-determination will further facilitate uptake of CE practices across all principles.
Indeed, our analysis of motivation by company characteristics indicates that disadvantaged-owned businesses exhibited significantly higher intrinsic motivation and extrinsic motivation linked to regulatory compliance and personal responsibility. This suggests that these businesses may be adopting CE practices due to a sense of obligation or alignment with broader sustainability goals. Similarly, businesses with environmental certifications displayed stronger intrinsic and integrated motivation. This might indicate that firms that voluntarily commit to sustainability frameworks may also internalize CE-related values more deeply. In contrast, businesses with higher annual sales showed limited differences in motivation, except for a stronger concern for avoiding future regret over inaction. This could suggest that these firms, while capable of implementing CE practices, may be driven more by external pressures or risk aversion rather than an internally driven environmental commitment.
Taken together, our results suggest that decisionmakers and industry leaders should focus on enhancing leadership’s intrinsic motivation to spur CE adoption across businesses. This could involve developing training programs that emphasize the long-term benefits of CE and providing incentives for leaders who go beyond regulatory compliance. Additionally, flexible policies such as innovation grants, tax credits for exceeding sustainability benchmarks, and voluntary certification programs that reward leadership in CE practices could help improve self-determined motivation. Supporting initiatives that promote organizational culture shifts, such as embedding CE principles into business education or encouraging collaborative networks for knowledge sharing, could also further equip leaders to adopt and implement CE practices. Furthermore, addressing financial constraints through incentives, alongside providing technical guidance and knowledge sharing opportunities, could reduce barriers to CE adoption. These, in particular, could bolster intrinsic and extrinsic motivation toward more comprehensive CE implementation.
6 Conclusion
This research examined the implementation of CE principles and practices among small manufacturers in DFW, focusing on the influence of company characteristics and leadership’s level of motivation. Using a modified MTES, we assessed leadership’s self-determination and motivations and the effect of company attributes on CE adoption, specifically highlighting the role of disadvantaged businesses - an unexplored aspect in current CE literature. Our findings show diverse adoption of CE practices among DFW manufacturers, with principle 3 practices, including ad-hoc waste management, being most common. Our analyses showed that manufacturers with higher annual sales ($10 to <$100 million) were more likely to adopt principle 3 (Closing the system), principle 4 (Maintaining resource value), and principle 6 (Designing for circular economy) compared to to those with lower annual sales (<$10 million). This suggest that financial capacity plays a role in the adoption of more resource-intensive and strategic CE practices.
Overall, our results suggest that to advance from limited to full circular implementation, manufacturers require guidance, increased self-determination, and enhanced environmental motivation. Financial incentives, technical assistance programs, and industry-led knowledge-sharing initiatives could help small manufacturers overcome barriers to CE adoption. Additionally, leadership training programs that emphasize long-term CE benefits, skills in circular design practices, and the business case for sustainability could help shift firms toward higher CE adoption. These mechanisms are particularly important for adopting strategic approaches that go beyond simpler, ad-hoc methods.
While company characteristics had a less pronounced influence than leadership’s motivation, our analysis revealed a relationship between self-determination and the adoption of design and education practices of CE principles 6 and 7, underscoring the significance of motivation in implementing more demanding practices. Environmental certifications were also a strong predictor of CE adoption, with certified firms displaying significantly higher uptake of principles 1, 3, 6, and 7. This suggests that firms with formal sustainability commitments are more likely to pursue CE strategies beyond compliance, incorporating both operational and educational practices.
Disadvantaged-owned manufacturers, in particular, displayed a higher uptake of principle 5, emphasizing green purchasing decisions, as well as principles 6 and 7, suggesting their potential to adopt CE practices more extensively. Additionally, disadvantaged-owned firms demonstrated stronger intrinsic motivation and extrinsic motivation linked to regulatory compliance and personal responsibility, distinguishing their motivational drivers from non-disadvantaged businesses. These results indicate that external pressures and internal commitment may intersect in unique ways for disadvantaged-owned businesses, shaping their CE adoption strategies. Yet further research is needed to understand why disadvantaged-owned businesses adopt these practices, particularly in examining whether their motivations for CE adoption stem from strategic business decisions, external pressures, or intrinsic values. Additionally, future research could examine whether small disadvantaged-owned businesses improve their competitiveness in the public sector by adopting CE practices, as well as assess the extent to which disadvantaged-owned businesses from different sectors have adopted CE practices.
Finally, this study is not without limitations. Small manufacturing firms vary widely in their characteristics, and findings may differ based on location and industry type. We acknowledge the low response rate limits the generalizability of our results; however, our sample of respondents closely aligns with regional industry demographics in relation to company size, age, and revenue, suggesting that the results are relevant to the larger population of small manufacturers in the DFW metroplex. Given the similarities in small manufacturing challenges across urban areas, these results may also offer insights for other large conurbations with diverse industries. Future research with larger samples across diverse regions could help validate and expand on these results. Additionally, as with any survey-based study, self-reported data may be subject to social desirability bias or misreporting. Future studies could incorporate qualitative interviews or third-party data sources to triangulate findings. Our inclusion of disadvantaged businesses and their adoption of CE practices highlights the need for further research on this underrepresented group. Moreover, we grouped disadvantaged-owned businesses together; yet, separating these categories (e.g., minority-owned, woman-owned, LGBTQIA+ owned, veteran-owned) in future studies could provide more nuanced insights into how different groups adopt and implement CE practices. More broadly, future research is needed to explore the relationships between motivation and CE adoption across diverse industry types currently underrepresented in CE literature and could compare the adoption of CE practices across different policy environments to assess best practices for scaling CE transitions. Understanding these relationships are important to expand CE practices and achieve sustainability.
Data availability statement
The datasets presented in this article are not readily available because the dataset consists of confidential survey responses and cannot be shared due to ethical or legal restrictions. The data is subject to a retention policy requiring destruction after a specified time to ensure participant privacy and comply with IRB guidelines. Requests to access the datasets should be directed to Brendan Lavy, Yi5sYXZ5QHRjdS5lZHU=.
Ethics statement
The TCU Institutional Review Board approved the research design on 13 November 2021 (Approval #2021–227). The studies were conducted in accordance with the local legislation and institutional requirements. The ethics committee/institutional review board waived the requirement of written informed consent for participation from the participants or the participants’ legal guardians/next of kin because written informed consent was waived because the study met the criteria outlined in 45 CFR 46.117(c)(1). Specifically: (1) The only record linking the participant to the research would be the consent document, and the principal risk involved in the study was the potential for harm resulting from a breach of confidentiality if a signed consent form were required. Waiving the requirement for written consent reduced this risk and protected participant privacy. (2) The study involved an online survey that posed minimal risk to participants. Participation was entirely voluntary, and participants provided implied consent by completing the survey after reviewing an introductory statement detailing the purpose of the study, procedures, potential risks, and their rights. (3) The waiver was essential to the feasibility of the study, as requiring signed consent would have created an unnecessary record linking participants to their responses, which would have contradicted the confidentiality protections of the study.
Author contributions
KH: Conceptualization, Formal analysis, Methodology, Visualization, Writing – original draft, Writing – review & editing, Funding acquisition. BL: Conceptualization, Formal analysis, Methodology, Writing – original draft, Writing – review & editing.
Funding
The author(s) declare that financial support was received for the research and/or publication of this article. This research was supported by TCU’s College of Science and Engineering (grant no. GR 210313, 2021).
Acknowledgments
We thank the journal editors and reviewers for their constructive, helpful comments and suggestions. We also thank the small DFW manufacturing community for taking time to respond to the survey. This study refines findings originally presented in Howe (2022) master’s thesis research, focusing on the role of company characteristics and leadership motivation in CE adoption.
Conflict of interest
The authors declare that the research was conducted in the absence of any commercial or financial relationships that could be construed as a potential conflict of interest.
Generative AI statement
The authors declare that no Gen AI was used in the creation of this manuscript.
Publisher’s note
All claims expressed in this article are solely those of the authors and do not necessarily represent those of their affiliated organizations, or those of the publisher, the editors and the reviewers. Any product that may be evaluated in this article, or claim that may be made by its manufacturer, is not guaranteed or endorsed by the publisher.
Supplementary material
The Supplementary material for this article can be found online at: https://www.frontiersin.org/articles/10.3389/frsus.2025.1568099/full#supplementary-material
Supplementary File 1 | Survey questionnaire administered to study participants.
References
Adebayo, A. O., Onikoyi, I. A., Kareem, T. A., and Lamidi, W. A. (2021). Influence of board characteristics and ownership concentration on corporate sustainability growth among listed manufacturing companies in Nigeria. Acta Univ. Danubius. 17, 52–66.
Ashton, W., Russell, S., and Futch, E. (2017). The adoption of green business practices among small US Midwestern manufacturing enterprises. J. Environ. Plan. Manag. 60, 2133–2149. doi: 10.1080/09640568.2017.1281107
Akter, M., Akter, S., Rahman, M., and Priporas, C. V. (2023). Mapping the barriers to socio‑economic freedom in internationalisation of women‑owned SMEs: Evidence from a developing country. Journal of International Management, 29, 101067. doi: 10.1016/j.intman.2023.101067
Bakos, J., Siu, M., Orengo, A., and Kasiri, N. (2020). An analysis of environmental sustainability in small & medium-sized enterprises: patterns and trends. Bus. Strateg. Environ. 29, 1285–1296. doi: 10.1002/bse.2433
Balasubramanian, S., Shukla, V., Mangla, S., and Chanchaichujit, J. (2021). Do firm characteristics affect environmental sustainability? A literature review-based assessment. Bus. Strateg. Environ. 30, 1389–1416. doi: 10.1002/bse.2692
Barreiro-Gen, M., and Lozano, R. (2020). How circular is the circular economy? Analysing the implementation of circular economy in organisations. Bus. Strat. Environ. 29, 3484–3494. doi: 10.1002/bse.2590
Battisti, M., and Perry, M. (2011). Walking the talk? Environmental responsibility from the perspective of small-business owners. Corp. Soc. Responsib. Environ. Manag. 18, 172–185. doi: 10.1002/csr.266
Bonilla, S. H., Silva, H. R. O., da Silva, M. T., Gonçalves, R. F., and Sacomano, J. B. (2018). Industry 4.0 and sustainability implications: a scenario-based analysis of the impacts and challenges. Sustain. For. 10:3740. doi: 10.3390/su10103740
Brammer, S., Hoejmose, S., and Marchant, K. (2012). Environmental management in SMEs in the UK: practices, pressures and perceived benefits. Bus. Strat. Environ. 21, 423–434. doi: 10.1002/bse.717
Briga-Sá, A., Nascimento, D., Teixeira, N., Pinto, J., Caldeira, F., Varum, H., et al. (2013). Textile waste as an alternative thermal insulation building material solution. Construction and Building Materials, 38, 155–160. doi: 10.1016/j.conbuildmat.2012.08.037
Brouwer, M. A. C., and van Koppen, C. S. A. (2008). The soul of the machine: continual improvement in ISO 14001. J. Clean. Prod. 16, 450–457. doi: 10.1016/j.jclepro.2006.08.022
Cañas, J., and Kerr, E. (2014). Texas Manufacturing Outlook Survey: Survey methodology and performance (Working Paper). Federal Reserve Bank of Dallas. Availabl at: https://www.dallasfed.org/-/media/documents/research/papers/2014/wp1416.pdf
City of Fort Worth (2022) Population. Available online at: https://www.fortworthtexas.gov/about/population
Dantas, T. E. T., de-Souza, E. D., Destro, I. R., Hammes, G., Rodriguez, C. M. T., and Soares, S. R. (2021). How the combination of circular economy and industry 4.0 can contribute towards achieving the sustainable development goals. Sustain. Prod. Consum. 26, 213–227. doi: 10.1016/j.spc.2020.10.005
Das, A., Konietzko, J., and Bocken, N. (2022). How do companies measure and forecast environmental impacts when experimenting with circular business models? Sustain. Prod. Consum. 29, 273–285. doi: 10.1016/j.spc.2021.10.009
Deci, E. L., and Ryan, R. M. (1985). The general causality orientations scale: self-determination in personality. J. Res. Pers. 19, 109–134. doi: 10.1016/0092-6566(85)90023-6
Dev, N. K., Shankar, R., and Qaiser, F. H. (2020). Industry 4.0 and circular economy: operational excellence for sustainable reverse supply chain performance. Resour. Conserv. Recycl. 153:104583. doi: 10.1016/j.resconrec.2019.104583
Dineen, L. C., and Blakesley, B. C. (1973). Algorithm AS 62: generator for the sampling distribution of the Mann-Whitney U statistic. Appl. Stat. 22, 269–273.
Dun & Bradstreet (2022). Our company. Available online at: https://www.dnb.com/about-us.html
Ellen MacArthur Foundation. (2014). Upstream innovation: a guide to packaging solutions. Ellen Macarthur Foundation. Available online at: https://emf.thirdlight.com/link/agyt3es34kjy-k2qe8a/@/preview/1?o.
Ellen MacArthur Foundation (2015). Delivering the circular economy: a toolkit for policymakers : Ellen MacArthur Foundation. Available at: https://content.ellenmacarthurfoundation.org/m/2a4cfc55ea5af914/original/A-toolkit-for-policymakers.pdf
Ellen MacArthur Foundation (2019). Completing the picture: how the circular economy tackles climate change. Ellen MacArthur Foundation. Available online at: https://emf.thirdlight.com/link/w750u7vysuy1-5a5i6n/@/preview/1?o
Ellen MacArthur Foundation (2021). Universal circular economy policy goals : Ellen MacArthur Foundation. Available at: https://content.ellenmacarthurfoundation.org/m/99036b9257aee53/original/Universal-circular-economy-policy-goals.pdf
Esa, E., Zahari, A. R., and Nawang, D. (2018). Corporate sustainability reporting, ownership structure and brand equity. Glob Bus Manag Res 10:120.
Federal Reserve Economic Data (FRED). (2024). All employees: Manufacturing in Dallas-Fort Worth-Arlington, TX (MSA). Federal Reserve Bank of St. Louis.
Gallego-Schmid, A., López Eccher, C., Muñoz, E., Salvador, R., Cano Londoño, N. A., and Barros, M. V. (2024). Circular economy in Latin America and the Caribbean: Drivers, opportunities, barriers and strategies. Sustainable Production and Consumption, 51, 118–136. doi: 10.1016/j.spc.2024.09.006
Gagné, M., and Deci, E. L. (2005). Self-determination theory and work motivation. J. Organ. Behav. 26, 331–362. doi: 10.1002/job.322
García-Quevedo, J., Jové-Llopis, E., and Martínez-Ros, E. (2020). Barriers to the circular economy in European small and medium-sized firms. Bus. Strat. Environ. 29, 2450–2464. doi: 10.1002/bse.2513
Geyer, R., and Doctori Blass, V. (2009). The economics of cell phone reuse and recycling. Int. J. Adv. Manuf. Technol. 47, 515–525. doi: 10.1007/s00170-009-2228-z
Giurco, D., Littleboy, A., Boyle, T., Fyfe, J., and White, S. (2014). Circular economy: questions for responsible minerals, additive manufacturing and recycling of metals. Resources 3, 432–453. doi: 10.3390/resources3020432
Glass, C., Cook, A., and Ingersoll, A. R. (2016). Do women leaders promote sustainability? Analyzing the effect of corporate governance composition on environmental performance. Bus. Strateg. Environ. 25, 495–511. doi: 10.1002/bse.1879
Govindan, K., and Hasanagic, M. (2018). A systematic review on drivers, barriers, and practices towards circular economy: a supply chain perspective. Int. J. Prod. Res. 56, 278–311. doi: 10.1080/00207543.2017.1402141
Gundry, L. K., Kickul, J. R., Iakovleva, T., and Carsrud, A. L. (2014). Women-owned family businesses in transitional economies: key influences on firm innovativeness and sustainability. J. Innovation Entrepreneurship 3:8. doi: 10.1186/2192-5372-3-8
Gusmerotti, N. M., Testa, F., Corsini, F., Pretner, G., and Iraldo, F. (2019). Drivers and approaches to the circular economy in manufacturing firms. J. Clean. Prod. 230, 314–327. doi: 10.1016/j.jclepro.2019.05.044
Hansen, J., Kharecha, P., Sato, M., Masson-Delmotte, V., Ackerman, F., Beerling, D. J., et al. (2013). Assessing “dangerous climate change”: required reduction of carbon emissions to protect young people, future generations and nature. PLoS One 8:e81648. doi: 10.1371/journal.pone.0081648
Hart, S. L., and Dowell, G. (2011). Invited editorial: a natural-resource-based view of the firm. J. Manag. 37, 1464–1479. doi: 10.1177/0149206310390219
Hegstad, M. (2020). EPA poised to unveil TSCA 2020 CDR but 'small' business definition lags. Inside EPAs Risk Policy Rep. 27, 8–9.
Hillary, R. (2017). Small and medium-sized enterprises and the environment: business imperatives. London: Taylor & Francis.
Hitchens, D., Clausen, J., Trainor, M., Keil, M., and Thankappan, S. (2003). Competitiveness, environmental performance and management of SMEs. Greener Manag. Int. 2003, 44–57. doi: 10.9774/GLEAF.3062.2003.wi.00006
Hoogendoorn, B., Guerra, D., and van der Zwan, P. (2015). What drives environmental practices of SMEs? Small Bus. Econ. 44, 759–781. doi: 10.1007/s11187-014-9618-9
Howe, K. (2022) The influence of company characteristics and leadership motivations on the circular economy of small manufacturers. Master’s thesis, Texas Christian University. Available online at: https://repository.tcu.edu/handle/116099117/56645
Hryhorash, O., Korneyev, M., Leheza, Y., Zolotukhina, L., and Hryhorash, T. (2018). The development of small business as a source of formation of local budget revenues in Ukraine. Invest. Manag. Financ. Innov. 15, 132–140. doi: 10.21511/imfi.15(1).2018.12
Hultberg, E., and Pal, R. (2021). Lessons on business model scalability for circular economy in the fashion retail value chain: towards a conceptual model. Sustain. Prod. Consum. 28, 686–698. doi: 10.1016/j.spc.2021.06.033
Isildar, A., Rene, E. R., van Hullebusch, E. D., and Lens, P. N. L. (2018). Electronic waste as a secondary source of critical metals: Management and recovery technologies. Resources, Conservation and Recycling, 135, 296–312. doi: 10.1016/j.resconrec.2017.07.031
Jarriett, R.. (2020). Exploring African American women small business owners’ sustainability strategies in Chicago: a qualitative study. ProQuest Dissertations Publishing (Dissertation/Thesis). Available online at: https://go.exlibris.link/Br1R280J
Johnson, M. P.and Schaltegger, S. (2016). Two decades of sustainability management tools for SMEs: How far have we come? Journal of Small Business Management, 54, 481–505. doi: 10.1111/jsbm.12154
Kassinis, G., Panayiotou, A., Dimou, A., and Katsifaraki, G. (2016). Gender and environmental sustainability: a longitudinal analysis. Corp. Soc. Responsib. Environ. Manage. 23, 399–412. doi: 10.1002/csr.1386
Khairul Akter,, Md, M., Nasrin Haq, U., Islam, M. M., and Uddin, M. A. (2022). Textile-apparel manufacturing and material waste management in the circular economy: a conceptual model to achieve sustainable development goal (SDG) 12 for Bangladesh. Cleaner Environ. Syst. 4:100070. doi: 10.1016/j.cesys.2022.100070
Korhonen, J., Nuur, C., Feldmann, A., and Birkie, S. E. (2018). Circular economy as an essentially contested concept. Journal of Cleaner Production, 175, 544–552. doi: 10.1016/j.jclepro.2017.12.111
Lazim, H. M., Sasitharan, D., Taib, C. A., Lamsali, H., and Salleh, M. N. (2019). An empirical investigation of preventive maintenance practices among manufacturing organizations: does cost and quality matter? Glob. Bus. Manag. Res. 11, 120–129.
Lewis, K., and Cassells, S. (2010). Barriers and drivers for environmental practice uptake in SMEs: a New Zealand perspective. Int. J. Bus. Stud. 18, 7–21.
Lin, Y., Guo, M., Shah, N., and Stuckey, D. C. (2016). Economic and environmental evaluation of nitrogen removal and recovery methods from wastewater. Bioresource Technology, 215, 227–238. doi: 10.1016/j.biortech.2016.03.064
Masurel, E. (2007). Why SMEs invest in environmental measures: sustainability evidence from small and medium-sized printing firms. Bus. Strat. Environ. 16, 190–201. doi: 10.1002/bse.478
Mendoza, J. M. F., Sharmina, M., Gallego-Schmid, A., Heyes, G., and Azapagic, A. (2017). Integrating backcasting and eco-design for the circular economy: the BECE framework. J. Ind. Ecol. 21, 526–544. doi: 10.1111/jiec.12590
Mendoza, J. M. F., Popa, S. A., D'Aponte, F., Gualtieri, D., and Azapagic, A. (2019). Improving resource efficiency and environmental impacts through novel design and manufacturing of disposable baby diapers. J. Clean. Prod. 210, 916–928. doi: 10.1016/j.jclepro.2018.11.046
Millar, N., McLaughlin, E., and Borger, T. (2019). The circular economy: swings and roundabouts? Ecol. Econ. 158, 11–19. doi: 10.1016/j.ecolecon.2018.12.012
Millar, H. H., and Russell, S. N. (2011). The adoption of sustainable manufacturing practices in the Caribbean. Bus. Strat. Environ. 20, 512–526. doi: 10.1002/bse.707
Moktadir, M. A., Rahman, T., Rahman, M. H., Ali, S. M., and Paul, S. K. (2018). Drivers to sustainable manufacturing practices and circular economy: a perspective of leather industries in Bangladesh. J. Clean. Prod. 174, 1366–1380. doi: 10.1016/j.jclepro.2017.11.063
Ni, B., Tamechika, H., Otsuki, T., and Honda, K. (2019). Does ISO14001 raise firms' awareness of environmental protection? The case of Vietnam. Environ. Dev. Econ. 24, 47–66. doi: 10.1017/S1355770X18000396
OECD. (2019). Business models for the circular economy: Opportunities and challenges for policy. Paris: OECD Publishing.
Piezer, K., Petit-Boix, A., Sanjuan-Delmás, D., Briese, E., Celik, I., Rieradevall, J., et al. (2019). Ecological network analysis of growing tomatoes in an urban rooftop greenhouse. Science of The Total Environment, 651, 1495–1504. doi: 10.1016/j.scitotenv.2018.09.293
Park, J., Díaz Posada, N., and Mejía Dugand, S. (2018). Challenges in implementing the extended producer responsibility in an emerging economy: The end-of-life tire management in Colombia. Journal of Cleaner Production, 189, 754–762. doi: 10.1016/j.jclepro.2018.04.058
Panchal, R., Singh, A., and Diwan, H. (2021). Does circular economy performance lead to sustainable development? – a systematic literature review. J. Environ. Manag. 293:112811. doi: 10.1016/j.jenvman.2021.112811
Peiry, K. K., Khanna, R., and Sahajwalla, V. (2012). Resource and energy recovery from wastes-perspectives for a Green economy. Environ. Policy Law 42, 344–349.
Pelletier, L. G., Tuson, K. M., Green-Demers, I., Noels, K., and Beaton, A. M. (1998). Why are you doing things for the environment? The motivation toward the environment scale (MTES). J. Appl. Soc. Psychol. 28, 437–468. doi: 10.1111/j.1559-1816.1998.tb01714.x
Peng, T., Kellens, K., Tang, R., Chen, C., and Chen, G. (2018). Sustainability of additive manufacturing: an overview on its energy demand and environmental impact. Addit. Manuf. 21, 694–704. doi: 10.1016/j.addma.2018.04.022
Persson, L., Carney Almroth, B. M., Collins, C. D., Cornell, S., de Wit, C. A., Diamond, M. L., et al. (2022). Outside the safe operating space of the planetary boundary for novel entities. Environ. Sci. Technol. 56, 1510–1521. doi: 10.1021/acs.est.1c04158
Pieroni, M. P. P., McAloone, T. C., and Pigosso, D. C. A. (2019). Business model innovation for circular economy and sustainability: a review of approaches. J. Clean. Prod. 215, 198–216. doi: 10.1016/j.jclepro.2019.01.036
Pan, Y., and Li, H. (2016). Sustainability evaluation of end-of-life vehicle recycling based on emergy analysis: A case study of an end-of-life vehicle recycling enterprise in China. Journal of Cleaner Production, 131, 219–227. doi: 10.1016/j.jclepro.2016.05.045
Quintero-Angel, M., and Peña-Montoya, C. C. (2020). Managing the environmental impacts of small businesses manufacturing women’s leather dress footwear in Colombia. Fashion Pract. 12, 394–420. doi: 10.1080/17569370.2020.1804149
Raczyńska, M. (2019). Definition of micro, small and medium enterprise under the guidelines of the European Union. Rev. Econ. Bus. Stud. 12, 165–190. doi: 10.1515/rebs-2019-0098
Revell, A., and Blackburn, R. (2007). The business case for sustainability? An examination of small firms in the UK'S construction and restaurant sectors. Bus. Strateg. Environ. 16, 404–420. doi: 10.1002/bse.499
Reike, D., Vermeulen, W. J. V., and Witjes, S. (2018). The circular economy: New or refurbished as CE 3.0? — Exploring controversies in the conceptualization of the circular economy through a focus on history and resource value retention options. Resources, Conservation and Recycling, 135, 246–264. doi: 10.1016/j.resconrec.2017.08.027
Revell, A., Stokes, D., and Chen, H. (2010). Small businesses and the environment: turning over a new leaf? Bus. Strat. Environ. 19, 273–288. doi: 10.1002/bse.628
Rodriguez-Anton, J. M., Rubio-Andrada, L., Celemín-Pedroche, M. S., and Alonso-Almeida, M. D. M. (2019). Analysis of the relations between circular economy and sustainable development goals. Int. J. Sustain. Dev. World Ecol. 26, 708–720. doi: 10.1080/13504509.2019.1666754
Ryan, R. M., and Deci, E. L. (2000). Self-determination theory and the facilitation of intrinsic motivation, social development, and well-being. Am. Psychol. 55, 68–78. doi: 10.1037/0003-066X.55.1.68
Sawe, F. B., Kumar, A., Garza-Reyes, J. A., and Agrawal, R. (2021). Assessing people-driven factors for circular economy practices in small and medium-sized enterprise supply chains: business strategies and environmental perspectives. Bus. Strat. Environ. 30, 2951–2965. doi: 10.1002/bse.2781
Schroeder, P., Anggraeni, K., and Weber, U. (2019). The relevance of circular economy practices to the sustainable development goals. J. Ind. Ecol. 23, 77–95. doi: 10.1111/jiec.12732
Sharpe, D. (2019). The sustainability of Black-owned companies that manufacture and distribute hair care products in the United States. Phoenix, AZ: D.B.A., Grand Canyon University.
Shirvanimoghaddam, K., Motamed, B., Ramakrishna, S., and Naebe, M. (2020). Death by waste: Fashion and textile circular economy case. Science of the Total Environment, 718, 137317. doi: 10.1016/j.scitotenv.2020.137317
Singh, M., Brueckner, M., and Padhy, P. K. (2015). Environmental management system ISO 14001: effective waste minimisation in small and medium enterprises in India. J. Clean. Prod. 102, 285–301. doi: 10.1016/j.jclepro.2015.04.028
Spearman, C. (1904). The proof and measurement of association between two things. Am. J. Psychol. 15, 72–101. doi: 10.2307/1412159
Stern, M. (2018). Social science theory for environmental sustainability: A practical guide. Oxford, UK: Oxford University Press.
Stumpf, L., Schöggl, J.-P., and Baumgartner, R. J. (2021). Climbing up the circularity ladder? – a mixed-methods analysis of circular economy in business practice. J. Clean. Prod. 316:128158. doi: 10.1016/j.jclepro.2021.128158
Suarez-Eiroa, B., Fernandez, E., Mendez-Martinez, G., and Soto-Onate, D. (2019). Operational principles of circular economy for sustainable development: linking theory and practice. J. Clean. Prod. 214, 952–961. doi: 10.1016/j.jclepro.2018.12.271
Tafvelin, S., and Stenling, A. (2021). A self-determination theory perspective on transfer of leadership training: the role of leader motivation. J. Leadersh. Organ. Stud. 28, 60–75. doi: 10.1177/1548051820962504
Testa, F., Gusmerottia, N. M., Corsini, F., Passetti, E., and Iraldo, F. (2016). Factors affecting environmental management by small and micro firms: the importance of entrepreneurs’ attitudes and environmental investment. Corp. Soc. Responsib. Environ. Manag. 23, 373–385. doi: 10.1002/csr.1382
Texas Economic Development and Tourism Office. (2023). Manufacturing industry. Office of Governor Greg Abbott, State of Texas. Availabl at: https://gov.texas.gov/uploads/files/business/Manufacturing_Snapshot.pdf
Thornton, L. M., Autry, C. W., Gligor, D. M., and Brik, A. B. (2013). Does socially responsible supplier selection pay off for customer firms? A cross-cultural comparison. J. Supply Chain Manag. 49:66–89. doi: 10.1111/jscm.12014
Tomić, T., and Schneider, D. R. (2018). The role of energy from waste in circular economy and closing the loop concept – energy analysis approach. Renew. Sust. Energ. Rev. 98, 268–287. doi: 10.1016/j.rser.2018.09.029
The World Bank. (n.d.). Small and medium enterprises (SMEs) finance: Improving SMEs’ access to finance and finding innovative solutions to unlock sources of capital. The World Bank. Available at: https://www.worldbank.org/en/topic/smefinance
U.S. Small Business Administration. (2020). 2020 small business profile: Texas. Available at: https://advocacy.sba.gov/wp-content/uploads/2020/06/2020-Small-Business-Economic-Profile-TX.pdf
United States Census Bureau (2017) Small Manufacturers Play a Big Role in the U.S. Economy. Available online at: https://www.census.gov/newsroom/blogs/random-samplings/2017/11/small_manufacturers.html
United States Census Bureau (2021). American community survey data. Available online at: https://www.census.gov/programs-surveys/acs/data.html
United States Census Bureau (2022). County business patterns data. Available online at: https://www.census.gov/programs-surveys/cbp/data.html
Valverde, J.-M., and Aviles-Palacios, C. (2021). Circular economy as a catalyst for progress towards the sustainable development goals: a positive relationship between two self-sufficient variables. Sustain. For. 13:12652. doi: 10.3390/su132212652
Velenturf, A. P. M., Jensen, P. D., Purnell, P., Jopson, J., and Ebner, N. (2019). A call to integrate economic, social and environmental motives into guidance for business support for the transition to a circular economy. Admin. Sci. 9:92. doi: 10.3390/admsci9040092
Vihma, M., and Moora, H. (2020). Potential of circular design in Estonian SMEs and their capacity to push it. Environ. Clim. Technol. 24, 94–103. doi: 10.2478/rtuect-2020-0088
Villacorta, M., Koestner, R., and Lekes, N. (2003). Further validation of the motivation toward the environment scale. Environ. Behav. 35, 486–505. doi: 10.1177/0013916503035004003
Wang, P. C., Che, F., Fan, S. S., and Gu, C. (2014). Ownership governance, institutional pressures and circular economy accounting information disclosure an institutional theory and corporate governance theory perspective. Chin. Manag. Stud. 8, 487–501. doi: 10.1108/CMS-10-2013-0192
Williams, S., and Schaefer, A. (2013). Small and medium-sized enterprises and sustainability: managers' values and engagement with environmental and climate change issues. Bus. Strat. Environ. 22, 173–186. doi: 10.1002/bse.1740
Wright, B. (2018). March. Texas manufacturing. Fiscal Notes. Texas Comptroller of Public Accounts. Available at: https://comptroller.texas.gov/economy/fiscal-notes/archive/2018/march/manufacturing.php
Yacob, P., Wong, L. S., and Khor, S. C. (2019). An empirical investigation of green initiatives and environmental sustainability for manufacturing SMEs. Journal of Manufacturing Technology Management, 30, 2–25. doi: 10.1108/JMTM-08-2017-0153
Zeng, S. X., Meng, X. H., Yin, H. T., Tam, C. M., and Sun, L. (2010). Impact of cleaner production on business performance. J. Clean. Prod. 18, 975–983. doi: 10.1016/j.jclepro.2010.02.019
Keywords: manufacturing industry, motivation toward the environment scale, sustainability, sustainable development, small businesses
Citation: Howe K and Lavy BL (2025) Business characteristics and leadership motivation in circular economy practices: a case study of small manufacturers in Dallas-Fort Worth. Front. Sustain. 6:1568099. doi: 10.3389/frsus.2025.1568099
Edited by:
Muhammad Asif, Jiangsu University, ChinaReviewed by:
Souryabrata Mohapatra, The University of Auckland, New ZealandSérgio Murilo Petri, Federal University of Santa Catarina, Brazil
Boonsub Panichakarn, Naresuan University, Thailand
Copyright © 2025 Howe and Lavy. This is an open-access article distributed under the terms of the Creative Commons Attribution License (CC BY). The use, distribution or reproduction in other forums is permitted, provided the original author(s) and the copyright owner(s) are credited and that the original publication in this journal is cited, in accordance with accepted academic practice. No use, distribution or reproduction is permitted which does not comply with these terms.
*Correspondence: Brendan L. Lavy, Yi5sYXZ5QHRjdS5lZHU=