 Lorenzo Marzini
 Michele Pio Papasidero1
 Massimiliano Schwarz
 Leonardo Disperati
- 1Department of Physical Sciences, Earth and Environment (DSFTA), University of Siena, Siena, Italy
- 2HAFL, Bern University of Applied Sciences, Zollikofen, Switzerland
Soil hydraulic conductivity and root distribution represent two important parameters toward the engineering applications, ranging from quantification of hydrological and geotechnical processes (e.g., water runoff, shallow landslides) to agricultural management and forestry practices. To investigate the relationship among these soil parameters, two study areas located in Italy (Garfagnana, Tuscany) and Switzerland (Zollikofen, Bern) were selected. Root Area Ratio (RAR) and soil saturated hydraulic conductivity (Ks) data were collected through the application of the trench method and the constant hydraulic head (Aardwark permeameter) and falling-head methods, respectively. Results highlight that Root Area Ratio concentrates in the first soil layers and decreases sharply following deeper layers. Root Area Ratio and soil saturated hydraulic conductivity show positive linear correlation that depends on the forest station. Our results support the hypothesis that the presence of roots represent a key factor in preferential infiltration and, therefore, hydrological models applied for the runoff modelling, slope stability and soil erosion can be improved considering the spatial distribution of roots derived by field measurement and/or remote sensing data.
1 Introduction
Soil saturated hydraulic conductivity (Ks) plays a relevant role toward hydrological and geotechnical processes. Focusing on the first one, saturated hydraulic conductivity affects surface water cycle and influences groundwater recharge (Pandey and Pandey, 1982; Liu et al., 2019; Ledford et al., 2020). Indeed, saturated hydraulic conductivity represent a fundamental input for any groundwater–land surface model, playing a crucial role in accurately simulating groundwater–land surface interactions and constituting a component in the equations governing water and energy balances (Kendrick et al., 2023; Lu et al., 2024; Banwart et al., 2019). It is also a crucial parameter in geotechnical or geological engineering due to their influence on slope stability and flood protection.
While the correlation between slope deposits features and saturated hydraulic conductivity (Ks) is well established (Archer et al., 2002), the effect exerted by vegetation and related products (organic matter input, litter quality, decomposition rates, and biogeochemical interactions) on Ks is still under debate (Hao et al., 2019). Indeed, soil organic matter input produced by degraded vegetation influences hydraulic conductivity in contrasting ways. It can improve Ks by enhancing soil structure, aggregation, and pore formation, boosting water infiltration and reducing runoff (Colombi et al., 2018). On the other hand, high organic matter concentrations may clog pores, reduce porosity, and form compacted layers, hindering water flow—especially in clay-rich soils (Gupta et al., 2024). Biogeochemical interactions carried out by microbial activity can selectively reduce Ks through the clogging of high permeability soil layers with the production of a biofilm (the so-called Bio-clogging effect) (Chen et al., 2021; Gupta et al., 2024). The positive correlation between litter layer thickness and saturated hydraulic conductivity implies that the litter layer may preserve favorable surface and microclimatic conditions (e.g., humidity and temperature). These conditions likely help sustain soil pore functionality, thereby enhancing water conduction (Basile et al., 2003; Marín-Castro et al., 2017).
Focusing on roots, below-ground vegetation influences Ks through physical and biological pathways. Physical mechanisms include the physical modification of the soil structure through the macropore formation [root growth creates macropores (> 30 μm diameter)], enhancing saturated hydraulic conductivity (Lipiec et al., 2012; Ma et al., 2024) and the root-shrink-swell cycles, in which modifications of radial pressures of roots produce cracking of clay soils, resulting in an increase of soil porosity during wet and dry cycles (Carminati et al., 2013). Regarding biological action, root exudates (a gel-like secretion called mucilage) can alter pore connectivity through a surfactant action that improves water retention in dry soils (Kroener et al., 2018; Lucas et al., 2019) and a pore-clogging effect (Benard et al., 2016). Even the microbial interactions with mycorrhizal fungi must be considered due to the stabilizing effects toward aggregates (Rillig and Mummey, 2006). On the other hand, dead roots can either increase Ks by forming preferential flow paths (Ghestem et al., 2014; Lu et al., 2020) and decrease Ks if residues occupy pores (Chen et al., 2021; Lu et al., 2020).
The study of the relationship between root and saturated hydraulic conductivity has several implications and applications, ranging from climate studies to agricultural management agroforestry practices can optimize root-induced Ks (Basche and DeLonge, 2019; Shao et al., 2017) and modeling challenges. Focusing on the last point, often the hydrological models adopted do not consider rhizosphere processes (Vereecken et al., 2022). These uncertainties are compounded also by the fact that Ks represents one of the most spatially variable soil parameters (Fodor et al., 2011; Das gupta et al., 2006; Eynard et al., 2004). Indeed, the measurement of this parameter into the field is difficult and always involves a certain degree of uncertainty due to the scale (volume of the investigated soil) and the techniques adopted. Same consideration can be extended for the below-ground structures of vegetation. In this context, also the comparison between different permeability tests still represents a challenging topic due to the different costs in terms of time, equipment and/or laboratory availability. Indeed, several different approaches can be taken into consideration in order to determine the soil hydraulic conductivity. Each method yields different estimates of this soil property that can be combined with the knowledge of soil moisture retention curves, from which predictions can then be made for the water flow under transient unsaturated conditions. For what is stated above, it is necessary to carry out research specifically aimed at investigating the relationship between root distribution and saturated hydraulic conductivity. Indeed, while vegetation roots are recognized for their role in slope stability (Deljouei et al., 2023; Giadrossich et al., 2017; Keybondori et al., 2025; Cislaghi et al., 2017), their influence on hydraulic conductivity remains poorly understood, with limited studies addressing this gap (Hao et al., 2019; Vergani and Graf, 2016; Xiao et al., 2024). Since Ks exhibits high spatial variability in slope deposits due to methodological and scale-related uncertainties (Fodor et al., 2011), our research employs a stand-scale data collection strategy, ensuring the sampled volume reflects the representative elementary volume (REV) of rooted slope deposits (Bagarello and Iovino, 2010). Therefore, the objectives of this work are to test: (1) whether differences in root distribution affect soil saturated hydraulic conductivity (Ks) across different soil depths and (2) how changes in soil Ks and root distribution might be associated with the distance from a tree. To answer these questions an intensive field survey was carried out in the Garfagnana basin (Northern Tuscany, Italy) and in the HAFL forest in Zollikofen (Bern, Switzerland) in which root distribution analysis (carried out through the application of the trench method and soil sampling) and hydraulic conductivity tests [falling-head and constant head (Aardwark permeameter) tests] were applied.
2 Materials and methods
2.1 Study areas
Study areas correspond to the Garfagnana valley located in Northern Tuscany (Italy) (Figure 1) and the HAFL forest (Zollikofen, Switzerland, Figure 2). Garfagnana study area extends for about 240 km2 along the Serchio River valley, parallel to the eastern margin of the Alpi Apuane and the Northern Apennines Ridge. About 81% of the study area is covered by forests, which are mainly represented by the chestnut forests (Vacchiano et al., 2017; Marzini et al., 2023). Due to the shielding action provided by the Alpi Apuane, heavy rainy events are frequent within the study area: as an example, on 19 June 1996 an extreme rainy event (474 mm/12 h, with maximum peaks of 158 mm/1 h) triggered many shallow landslides in the regional catchment area of the Versilia River and the Garfagnana area (Preti et al., 2025). Such study area has been extensively studied in terms of roots and shallow landslides distribution (D’Addario, 2022; Marzini et al., 2023b) and, in this context, Garfagnana valley includes a variety of soils, reflecting in turn the geological complexity that includes all the tectonic units that make up the Northern Apennines (Puccinelli et al., 2014). The table included into the Supplementary material shows the textural features, porosity, and depth classification (slope deposit-SD classes with a depth range equal to 30 cm) related to measurement sites. Moreover, a simplified classification system based on USCS guidelines has been applied. This classification system can be described as follows:
• Class G: gravelly SD (> 50% retained at 0.075 mm sieve), % gravel > % sand (GC-GM, GW, GC, GM, GP-GC, and GP-GM USCS classes);
• Class S: sandy SD (> 50% at 0.075 mm sieve), % gravel ≤ % sand (SC-SM, SM-SC, SM, and SW-SM USCS classes);
• Class F: fine grained SD (≤ 50% at 0.075 mm sieve) (MH, CH, ML, and CL USCS classes);
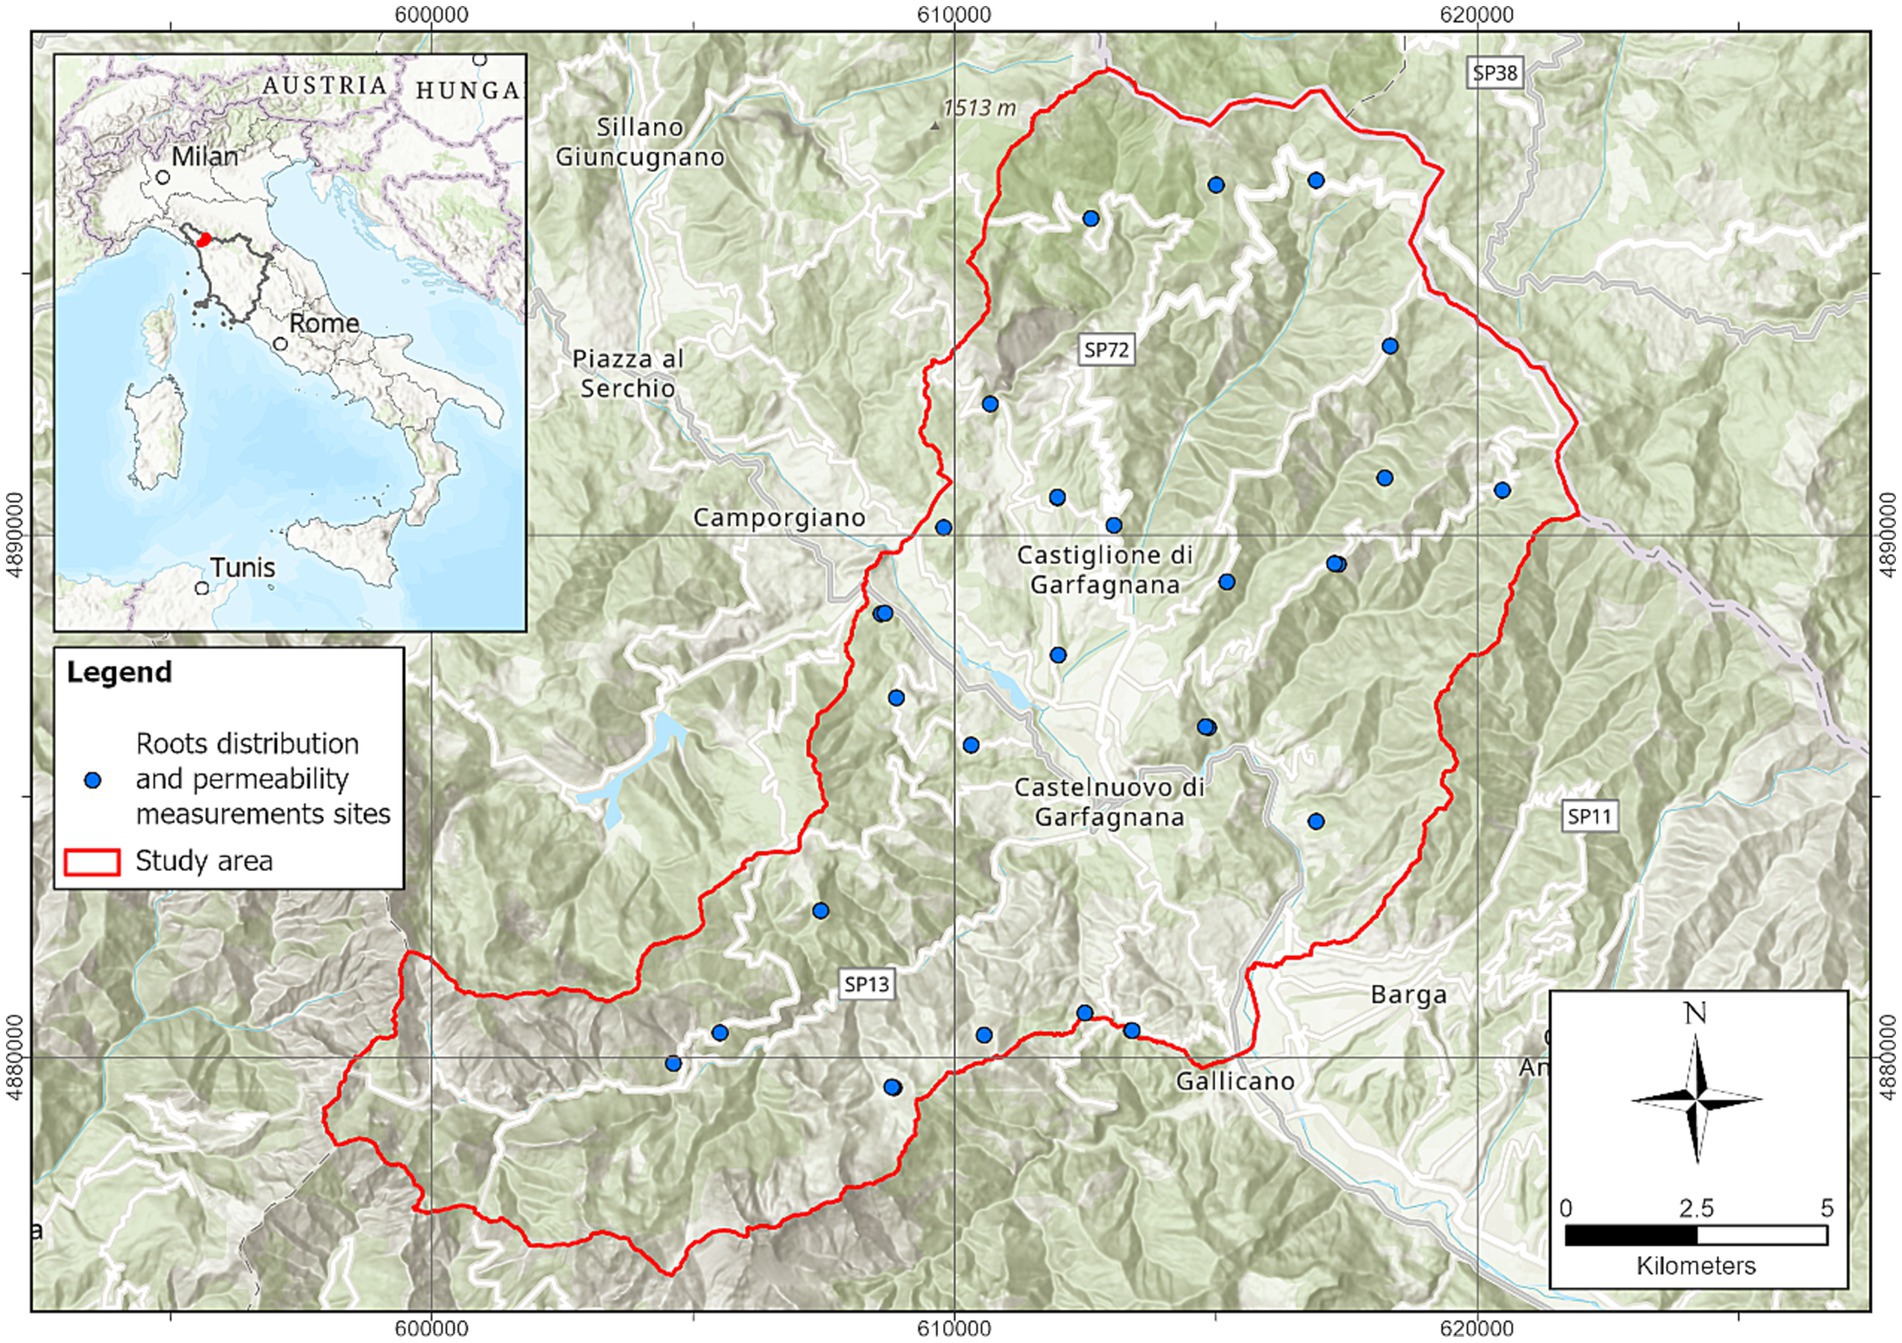
Figure 1. Measurement sites distribution in the Garfagnana study area (coordinate system: WGS84 UTM 32 N).
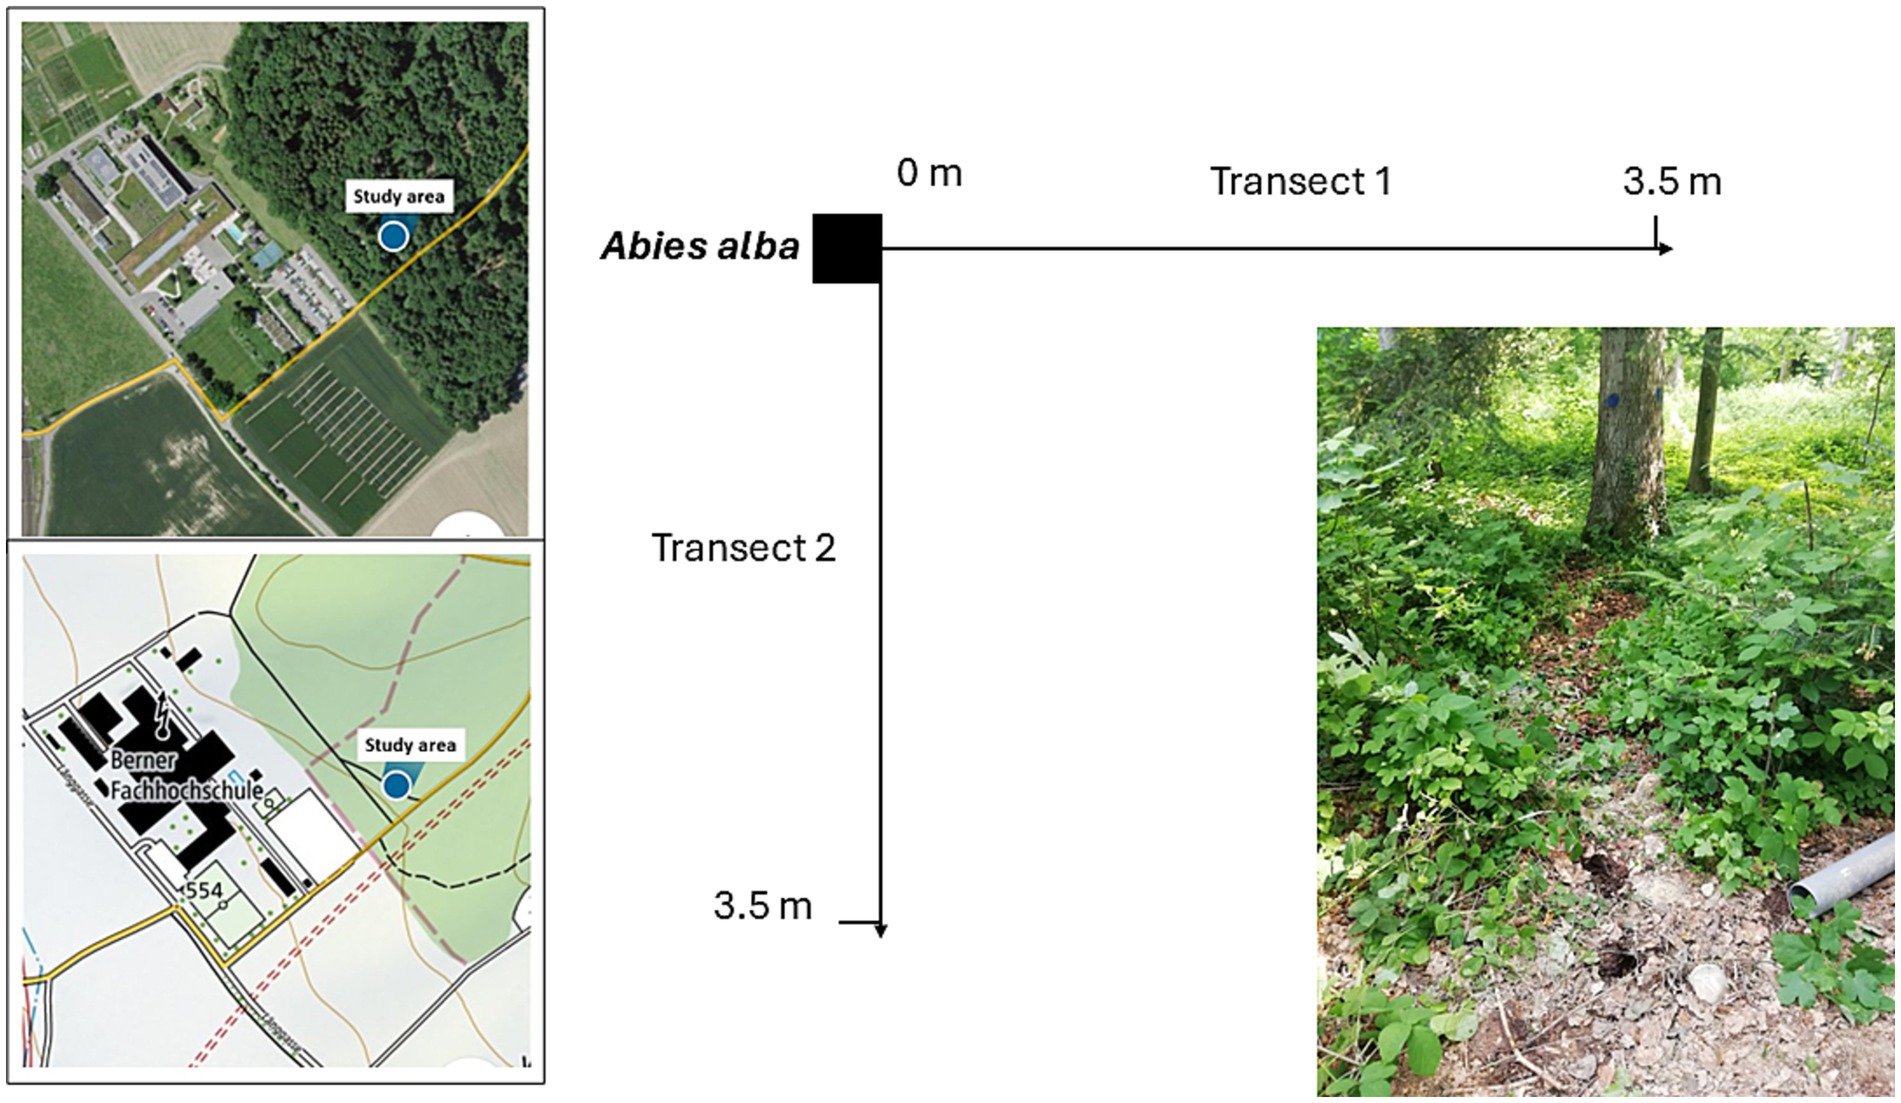
Figure 2. Acquisition data strategy scheme related to root distribution and Ks measurement tests carried out in the HAFL forest study area.
The HAFL study area is situated at the transition between the pre-alpine hills and the Swiss plateau. The climate is strongly influenced by both the Alps together with the Atlantic Ocean, with the average temperature and cumulated precipitation recorded in the Bern region (553 m a.s.l) equal to 8.6°C and 986 mm, respectively (MeteoSwiss, 2024). Field investigations were carried out in May 2024.
In the HAFL study area, root distribution and hydraulic conductivity tests were carried out along two perpendicular transects that started from a tree (Fir, Abies alba) at HAFL forest (mainly composed by Norway spruce [Picea abies (L.) H. Karst.)], behind the School of Agricultural, Forest and Food Sciences (BFH-HAFL) (Figure 2). The tree has a diameter at breast height (DBH) equal to 0.4 m and is approximately 50 years old. This data acquisition strategy was selected in order to study the relationship between soil hydraulic conductivity and root distribution at a stand level. The fir tree was selected due to the isolated distance toward other trees (i.e., absence of roots overlapping), absence of pathogens and similar slope deposit characteristics. The soil in the study area is Alisol (WRB-System) derived from tertiary deposits of fluvial sediments and characterized by high-activity clays and low base saturation with pH values between 3.5 and 4.5 in the upper 45 cm of the soil profile, and pH values between 4.5 and 4.8 in the bottom part of the soil profile down to 1.1 m depth. The soil texture in the first 45 cm of soil is composed of about 15% clay, 30% silt, and 55% sand, whereas at the depth of 110 cm is composed of about 23% clay, 19% silt, and 58% sand. Ks and RAR measurements were carried out for each transect on 10 boreholes (about 10 cm depth), spaced about 30 cm apart, with the initial borehole located at about 70 cm from the tree stem (Figure 2).
2.2 Saturated hydraulic conductivity tests
Saturated hydraulic conductivity (Ks) was measured in the Garfagnana and HAFL study area through the application of the constant hydraulic head (Aardwark permeameter) and falling-head methods (Theron et al., 2010; Corporation, 2016). Both methods consist on the imposition of a stable hydraulic head to the top of the boreholes that were realized at each of the slope deposit trenches, which were saturated with water prior to the measurement (steady-state condition) (Figure 3). In order to limit the soil moisture influence, before the execution of each test each borehole was subjected to saturation procedures by pouring different amounts of water (1–30 liters) into it. This procedure makes it possible to estimate the field-saturated hydraulic conductivity for each borehole depth class (depth range equal to 30 cm), eliminating the effect of matrix suction, and facilitating the establishment of the steady state regime (steady state flow rate) in which the rate of water lowering in the borehole (in the case of falling-head method) and the flow rate (constant-head permeameter) should be constant and independent from time (Figure 4).
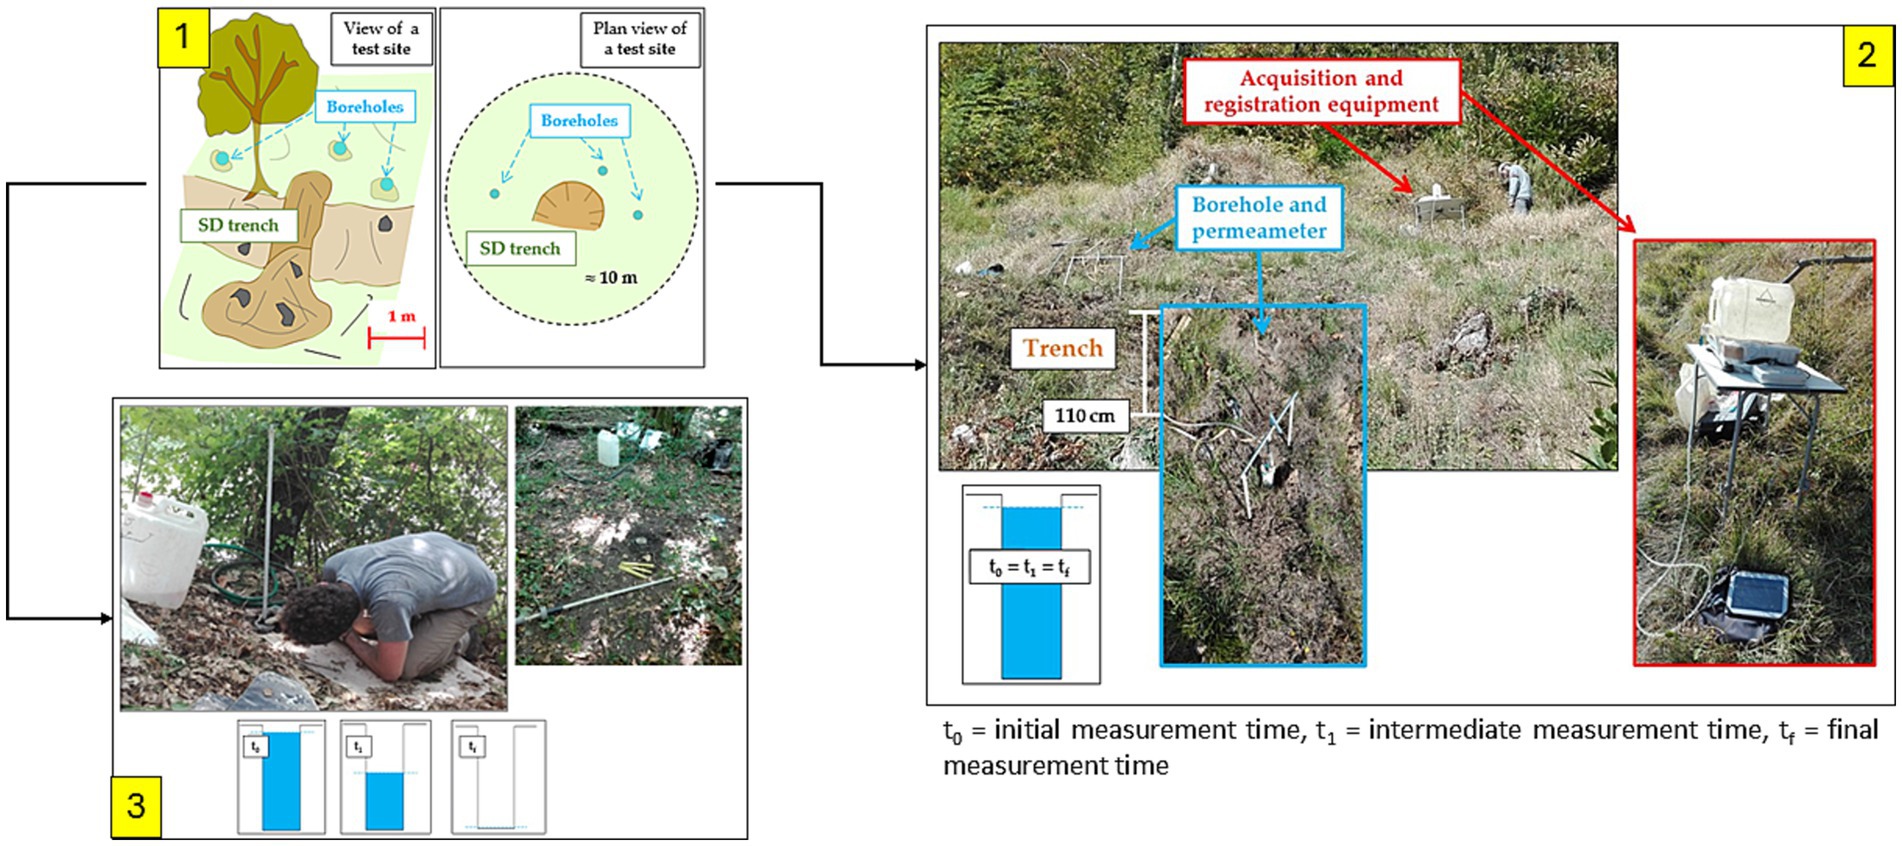
Figure 3. Hydraulic conductivity acquisition strategy: (1) KS measurements sites scheme (2) constant head method (Aardwark permeameter); (3) falling head method (consent was obtained for people in the image).
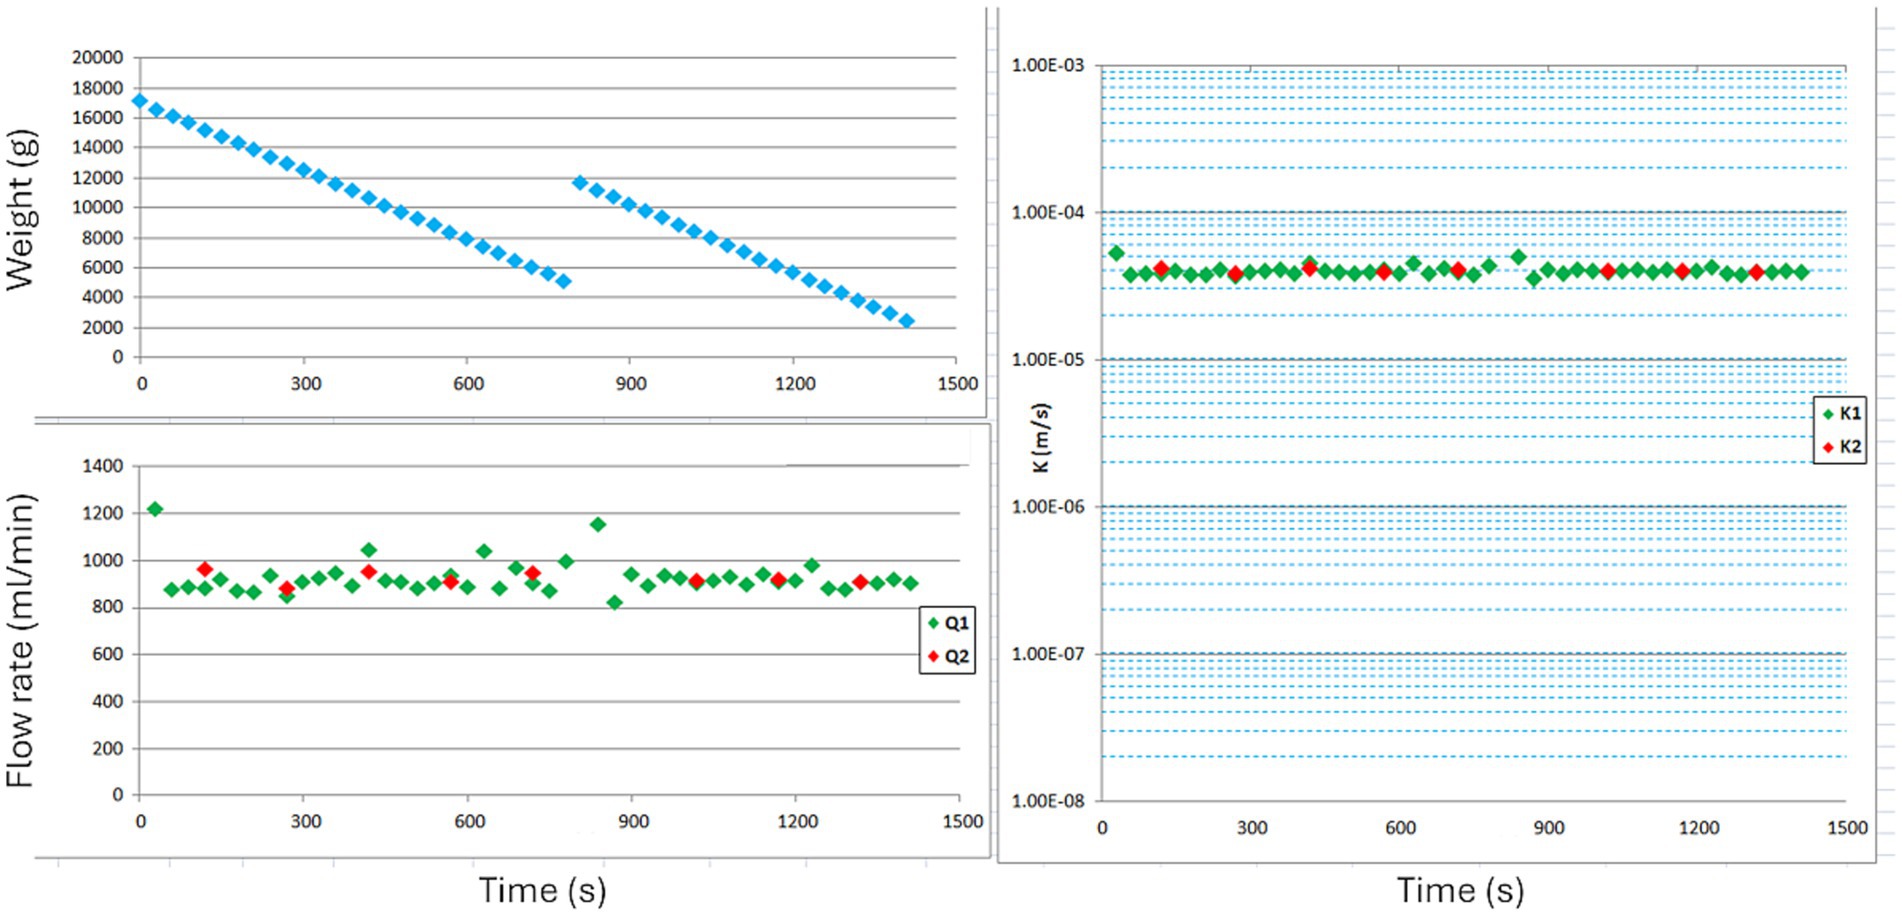
Figure 4. Example of a steady state flow rate during the application of the Constant head method: green dots indicate measurements of flow rate (left side) and Ks (right side) acquired every 30 s; red dots represent the mean values obtained from five sequential measurements.
The constant head permeameter is based on the direct application of Darcy’s Law and the steady-state flow rate of water under constant head at the bottom of a cylindrical hole of radius is measured. In the original procedure this method took a few days and required a considerable amount of equipment and large quantities of water. However, due to the development of equipment (e.g., Corporation, 2016), and modifications of the field procedure in the last 20 years, steady-state flow rate from a small diameter cylindrical hole under a constant depth of water can now be reached with a few liters of water within 20–40 min (Amoozegar, 1989). Instrumentation is composed of a water reservoir, a digital scale (KERN DS 36 K0.2 L model), a tube and the constant-head permeameter (Figure 3). It means that the depth of water in boreholes does not change during the time. As a result, the measurement conditions remain constant during the measurement time (Figure 4). The rate of water supplied corresponds to soil infiltration rate from the bottom and side surfaces of the testing borehole.
Saturated hydraulic conductivity was calculated using the following formula (USBR7300-89, 1990) (Equation 1):
Where “r” represents the radius of the borehole (m), “Q” is the steady-state flow rate (m3/s) and “HW” represents the water column height.
The falling-head method consists of a millimeter rod at the base of which there is a float that allows the user to follow the borehole water level drop at predetermined time intervals (Head and Epps, 1980) (Figure 3).
For this method, saturated hydraulic conductivity was calculated using the following formula (Hvorslev, 1951) (Equation 2):
Where h1 (m) and h2 (m) represent the water height related to t1 (s) and t2 (s) respectively, “r” represents the radius of the borehole (m).
According to Klute and Dirksen (1986) findings, constant-head permeameter method provides better results in slope deposits characterized by a saturated hydraulic conductivity between 10−2 and 10−7 m/s, whereas falling-head method provides better results with saturated hydraulic conductivity values within the range 10−5–10−9 m/s. For each trench, both methods were carried out at different slope deposit depth, so as to assess the relationship between slope deposit depth, Ks and below-ground vegetation distribution (see next sub paragraph). It is highlighted that, comparing with samples laboratory tests, in situ hydraulic conductivity measurements provide robust outcomes in terms of definition of the complexity and conditions of the slope deposits (Ciollaro and Romano, 1995; Schaap et al., 1998; Vieira and Fernandes, 2004).
2.3 Root analysis
In the Garfagnana study area roots features were assessed within soil by digging vertical trenches (already carried out for the hydraulic conductivity tests) (Böhm, 1979; van Noordwijk et al., 2000) (Figure 3). Root data [in terms of Root Area Ratio-RAR, defined as the root total area per unit area of soil (Bischetti et al., 2005; Preti et al., 2022)] were estimated through the direct application of the trench method, in which a grid of cells of 100 cm2 was overlapped on each trench profile covering the depth ranges involved during the conductivity tests (Marzini et al., 2023b). For each cell, roots were counted and grouped into different diameter classes, then RARi was calculated by using the following formula (Equation 3):
Where “i” represents the root diameter class, “n” indicates the number of analyzed root features, and “N” indicates the number of diameter classes. For each profile grid (referring to the depth horizon investigated), the corresponding RARm was calculated using the following formula (Equation 4):
Where “RARi” is related to a single cell and “p” indicates the number of cells within the grid.
Finally, the RAR related to a single measurement site and to the depth horizon analyzed by conductivity tests (RARs) was determined with the following formula (Equation 5):
Where “p” represents the portions of the profile: left side, frontal and right side (Figure 3).
Therefore, the root data in this study area refers to different soil depths analyzed (see Supplementary material). Regarding the Zollikofen study area, samples for the root distribution analysis were taken with a specifically designed and produced cylindrical steel tool characterized by 10 cm height and 10 cm diameter. A plastic tube and a plastic sheet were placed inside the tool to allow the removal of the superficial soil sample without damaging it. Therefore, a superficial soil sample for each measurement site was taken to the laboratory, in which roots were cleaned, spread out in a water-filled transparent plastic container and analyzed. Root properties (root count, root length and diameter) were determined using a centesimal caliper. Root Area Ratio (RAR) (Bischetti et al., 2005; Preti et al., 2022), Root Volume Ratio (RVR, defined as the total volume of roots per unit volume of soil) (Lascurain et al., 2021) and soil-root contact surface were used as an indicator for the distribution of roots. In detail, Root Volume Ratio-RVR was calculated assuming a root cylindrical shape and taking as root diameter a constant root diameter (equal to the maximum diameter measured along the entire root length). Assumption related to the root cylindrical shape was also made for the Soil-root contact surface calculation, obtained by multiplying, for each root sample detected, the root length and the average root diameter.
2.4 Statistical analysis
The Chi-square test was applied to verify the normal distribution of roots features and Ks datasets relative to the two study areas; it showed the absence of normal distributions. Significant statistical differences between datasets were determined by the non-parametric Kruskal–Wallis test. Statistical analyses were performed using Origin 2018 (Origin Lab Corporation, Northampton, MA, USA, 2018). Correlation tests among the different datasets considered were applied with a 0.05 reference value.
3 Results
To evaluate the reliability of the Ks measurements, we have selected a test site in which three different boreholes were executed. For each borehole, hydraulic conductivity tests were repeated several times under the same conditions: same measuring depth and employing the same type of permeameter (Aardvark permeameter). In Figure 5 and Table 1 are reported the Ks values obtained from the reliability assessment. Due to the coefficient of variation values obtained (CV, defined as the ratio of the standard deviation to the mean, < 3%) (Table 1), Ks acquisition strategy for each measurement site was set to one test for each horizon depth of the borehole.
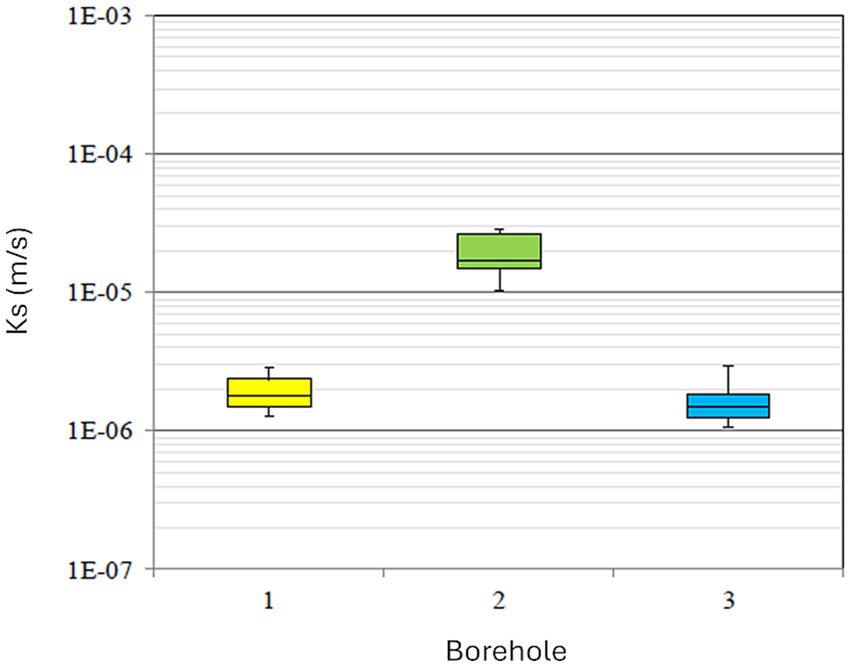
Figure 5. Saturated hydraulic conductivity boxplots for each borehole within the test site selected for the Ks reliability assessment.
Table 1. Ks statistical indexes related to the reliability assessment.
In Figure 6 the HAFL forest results are shown in terms of relationship between hydraulic conductivity and root distribution (quantified as root area ratio (RAR), root volume ratio (RVR), root-soil surface area). Transect 1 measurements (green dots) toward Ks and RAR and Ks and RVR highlight a strong Pearson correlation coefficient (equal to 0.86 and 0.69 respectively, with p-values of 0.004 and 0.06, respectively). Same consideration can be extended to Transect 2 measurements (blue dots), in which Ks and RAR, Ks and RVR and Ks and root-soil surface area highlight strong Pearson correlation coefficient (equal to 0.90, 0.90, and 0.79, with p = 0.02 for all the cases respectively).
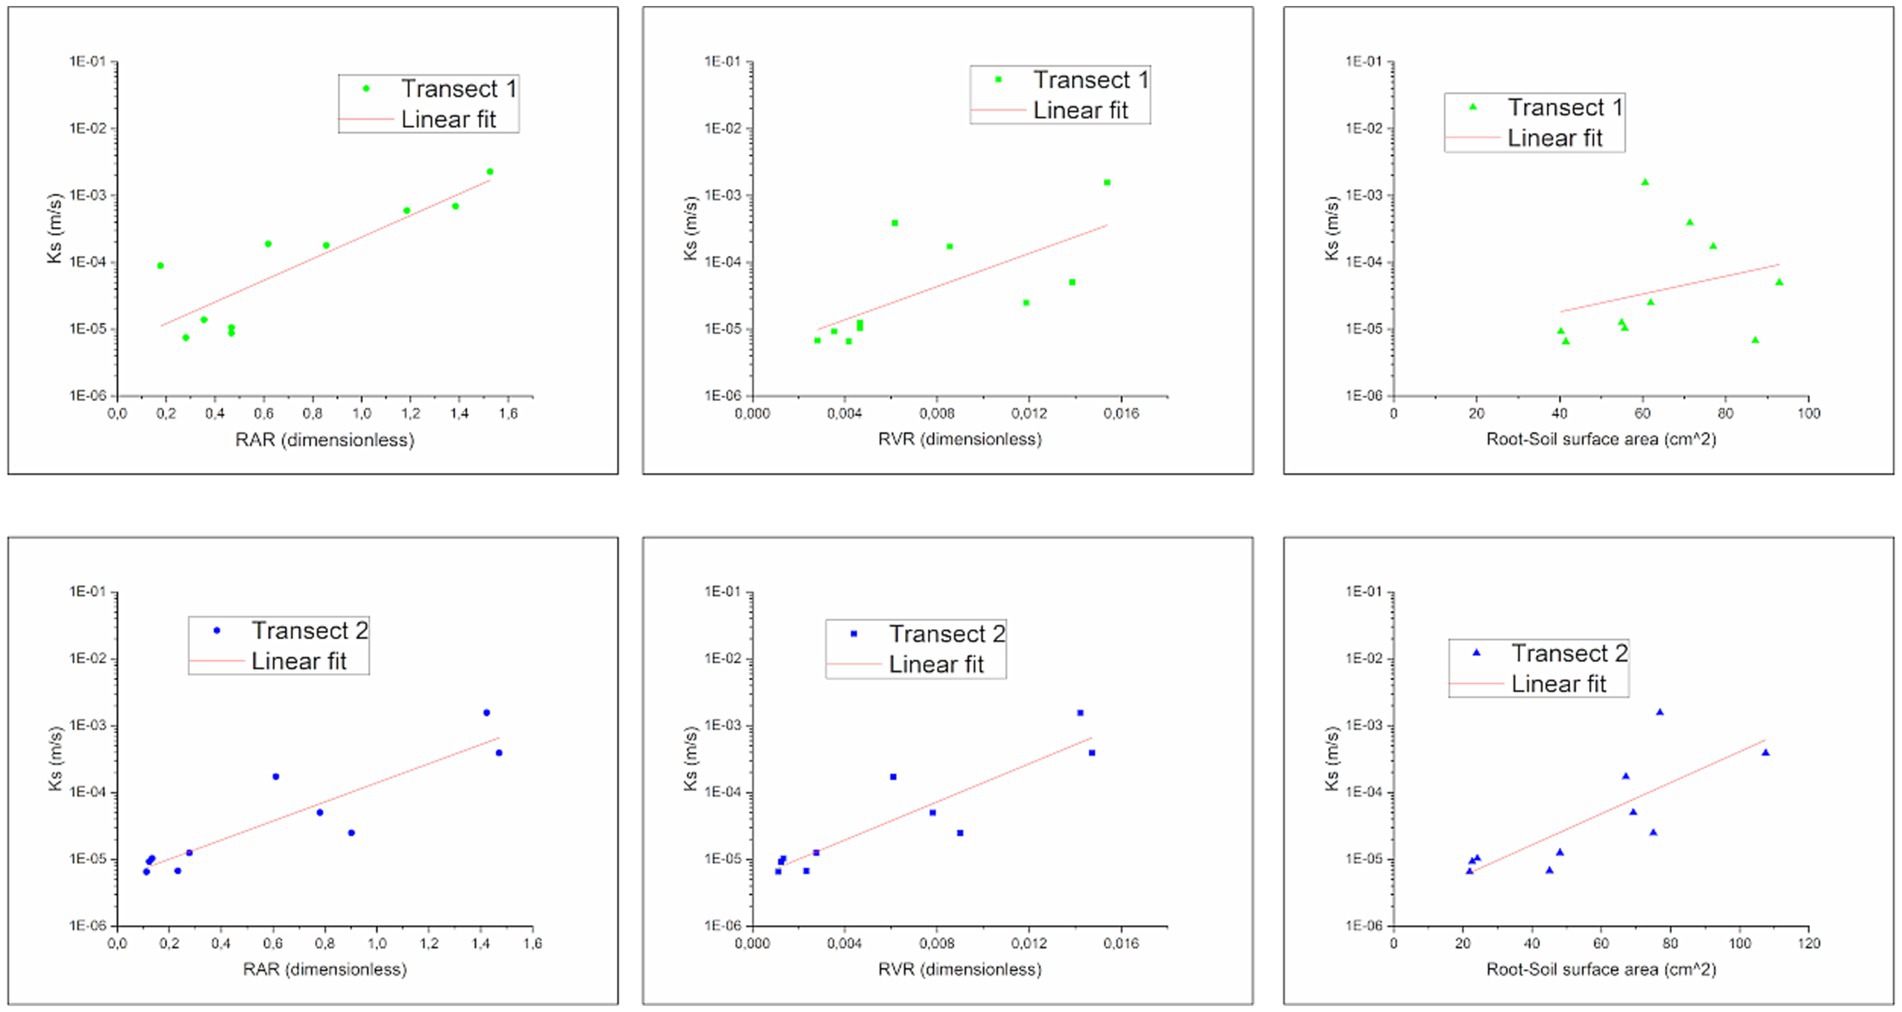
Figure 6. Relationship among Hydraulic conductivity (Ks), Root Area Ratio (RAR), Root Volume Ratio (RVR) and Root-soil surface area related to Transect 1 (green spots) and Transect 2 (blue spots).
Figure 7 highlights the variation of Ks and RAR toward the distance from the fir tree. It can be observed for both transects a decrease in root density and saturated hydraulic conductivity as the distance from the tree increases, with the main decrease located at 1.5–2 m from the stem. In contrast to the Garfagnana measurement sites (Figure 1), HAFL data refer to homogeneity situation in terms of soil texture, soil depth (about 10 cm) and porosity and, therefore, the relationship found between root distribution and Ks is not influenced by the soil density gradient or heterogeneity (absent in the stand plot).
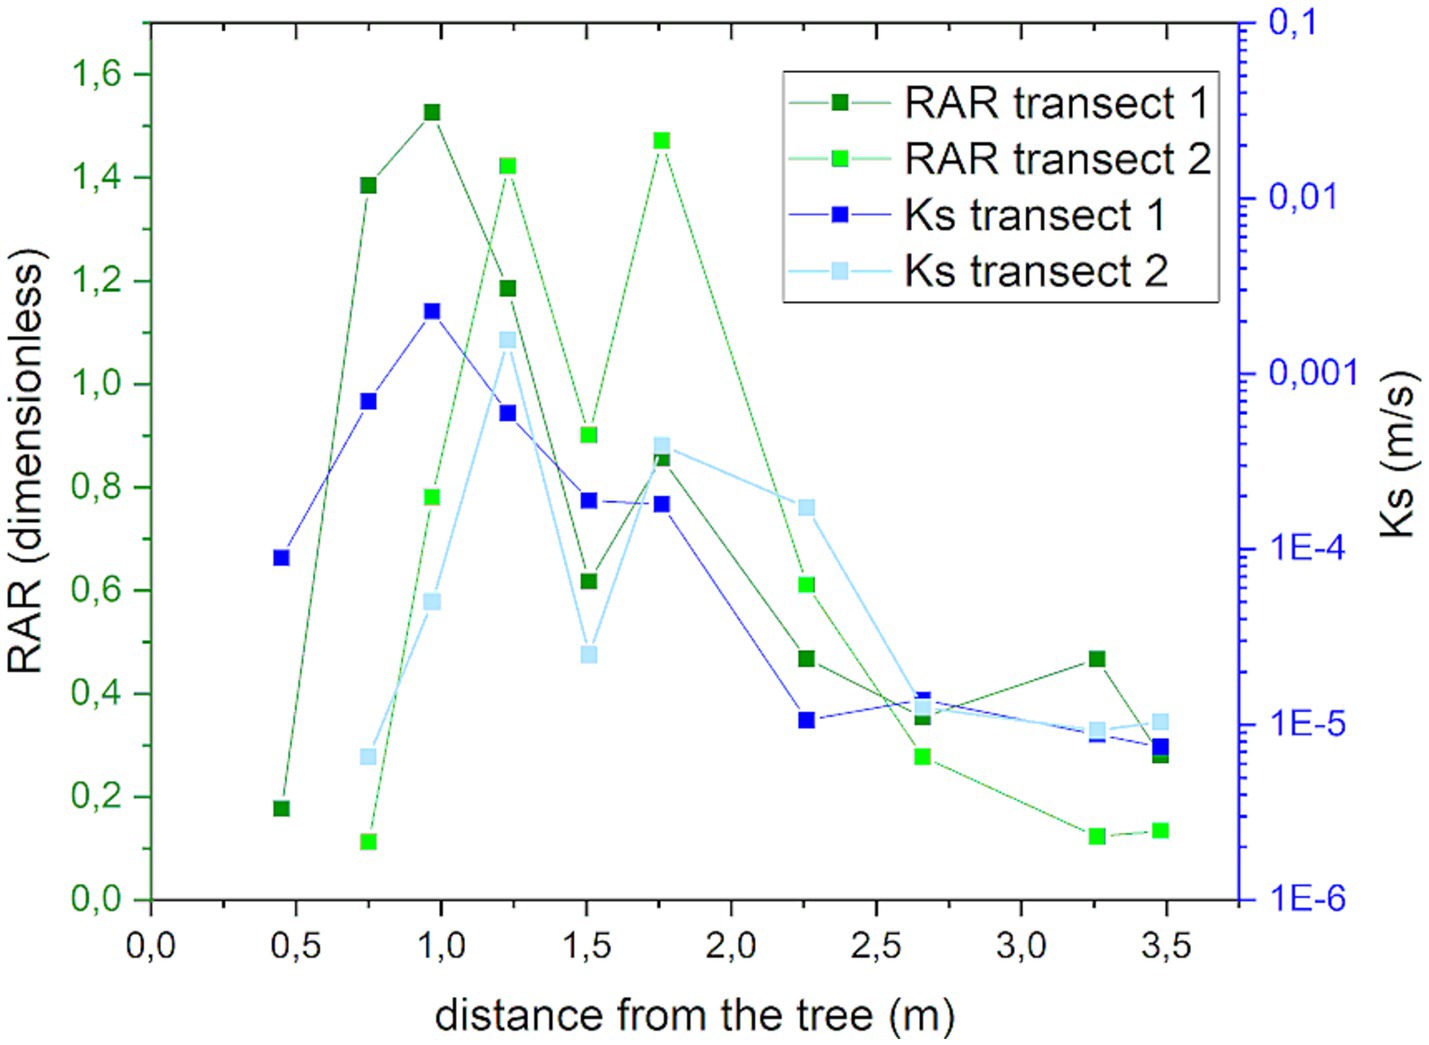
Figure 7. Relationship among hydraulic conductivity (Ks), Root Area Ratio (RAR) and distance from the tree data related to Transect 1 (green dots and green line-RAR; blue dots and blue line-Ks) and Transect 2 (light green dots and light green line-RAR; light blue dots and light blue line-Ks).
The application of the Kruskall-Wallis Test highlights the presence of two statistically different data populations for both Ks (p = 0.002) and RAR (p = 0.008) (Figure 8).
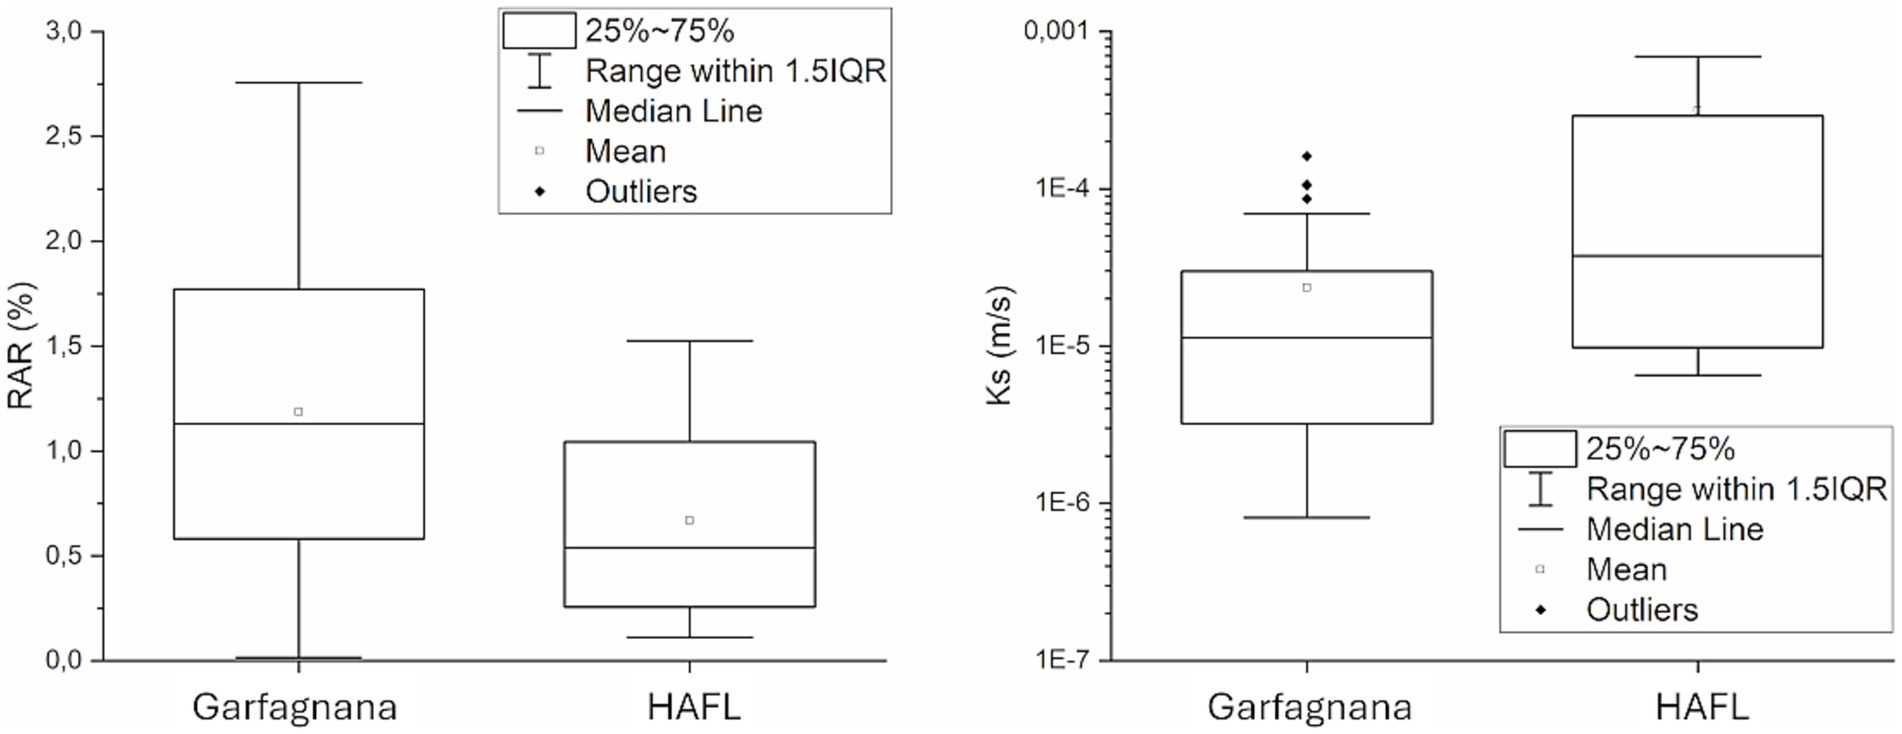
Figure 8. Boxplots of RAR and Ks data related to the two study areas. The box represents data within the first and the third quartile, white dot symbol represents the mean value, black dots indicates outliers, lines extending parallel from the box are the whiskers in the 25–75 range.
Focusing on the Garfagnana study area, Ks and RAR data showed a moderate positive linear correlation (Pearson’s r equal to 0.75 with a p-value of 89E-06, Figure 9). The linear correlation increases (Pearson’s r equal to 0.88 with a p-value of 59E-05, Figure 9) considering the HAFL dataset. The visual assessment of the scatter plot confirms the datasets differentiation obtained from the application of the Kruskall-Wallis Test. Such differentiation comes up for Ks values > 1E-04 m/s and RAR data > 0.5%.
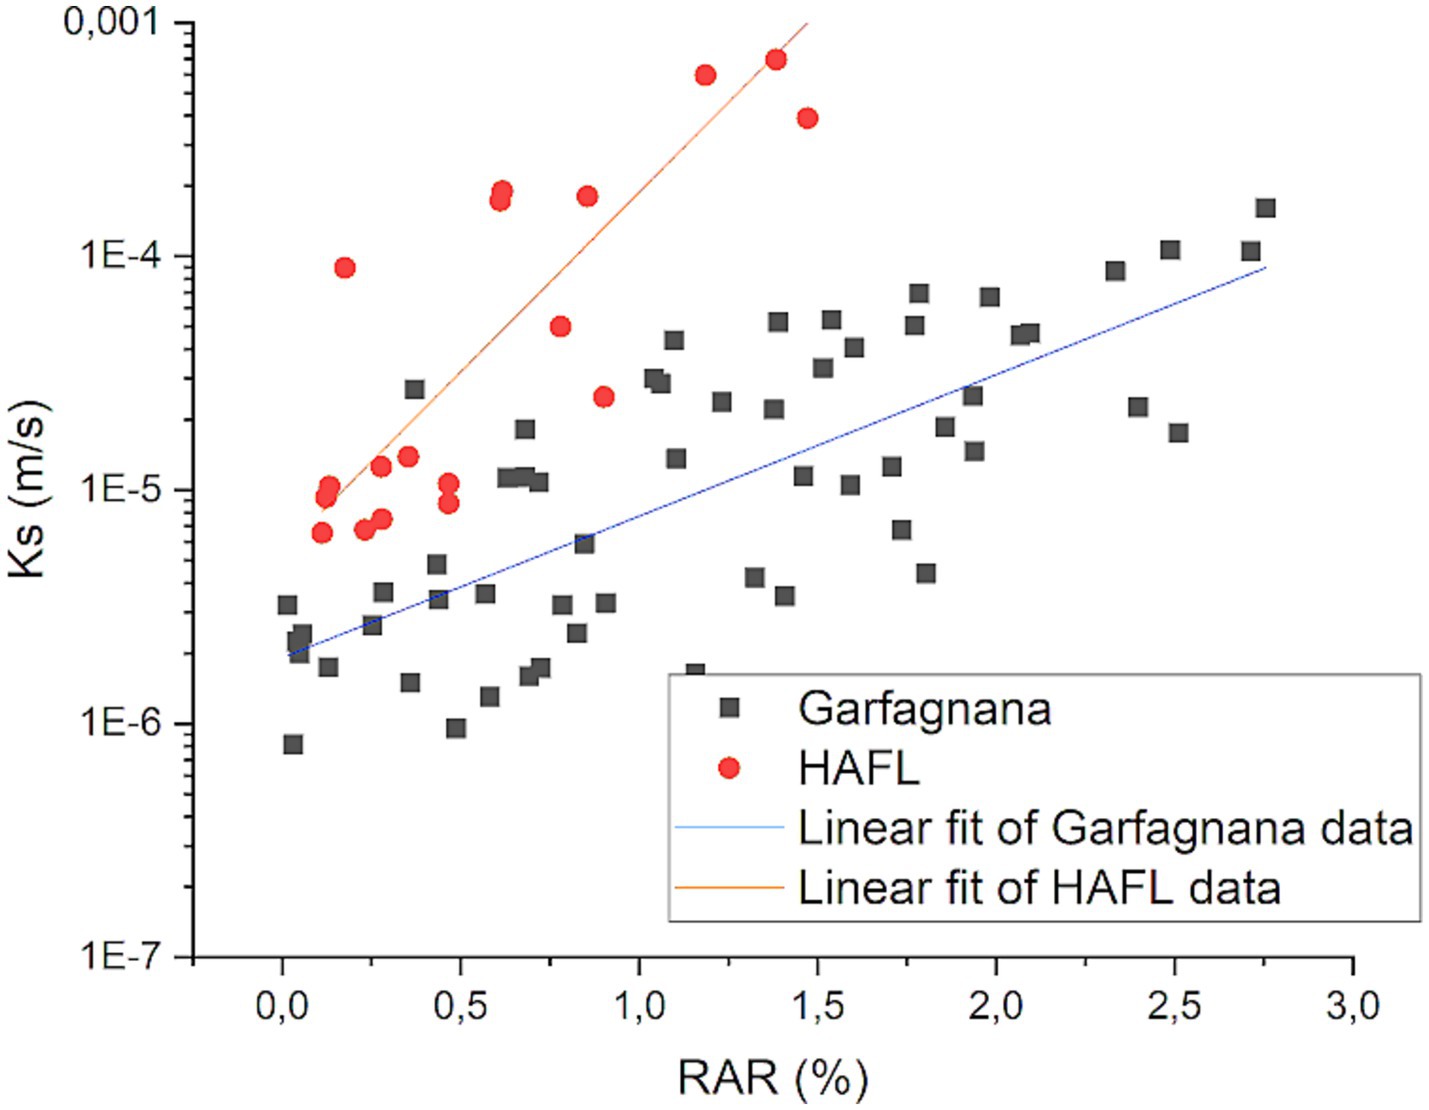
Figure 9. Relationship among hydraulic conductivity (Ks) and Root Area Ratio (RAR) data for the Garfagnana (black squares) and HAFL (red dots) study areas.
Considering the modified USCS classes and the soil depth classes (Figure 10), only class “B” data (soil depth in the range 30–60 cm) showed a moderate positive linear correlation (Pearson’s r equal to 0.74 with a p-value of 406E-04). Data within the other classes do not show similar results, due to the limitation of available data (see for example class “F”).
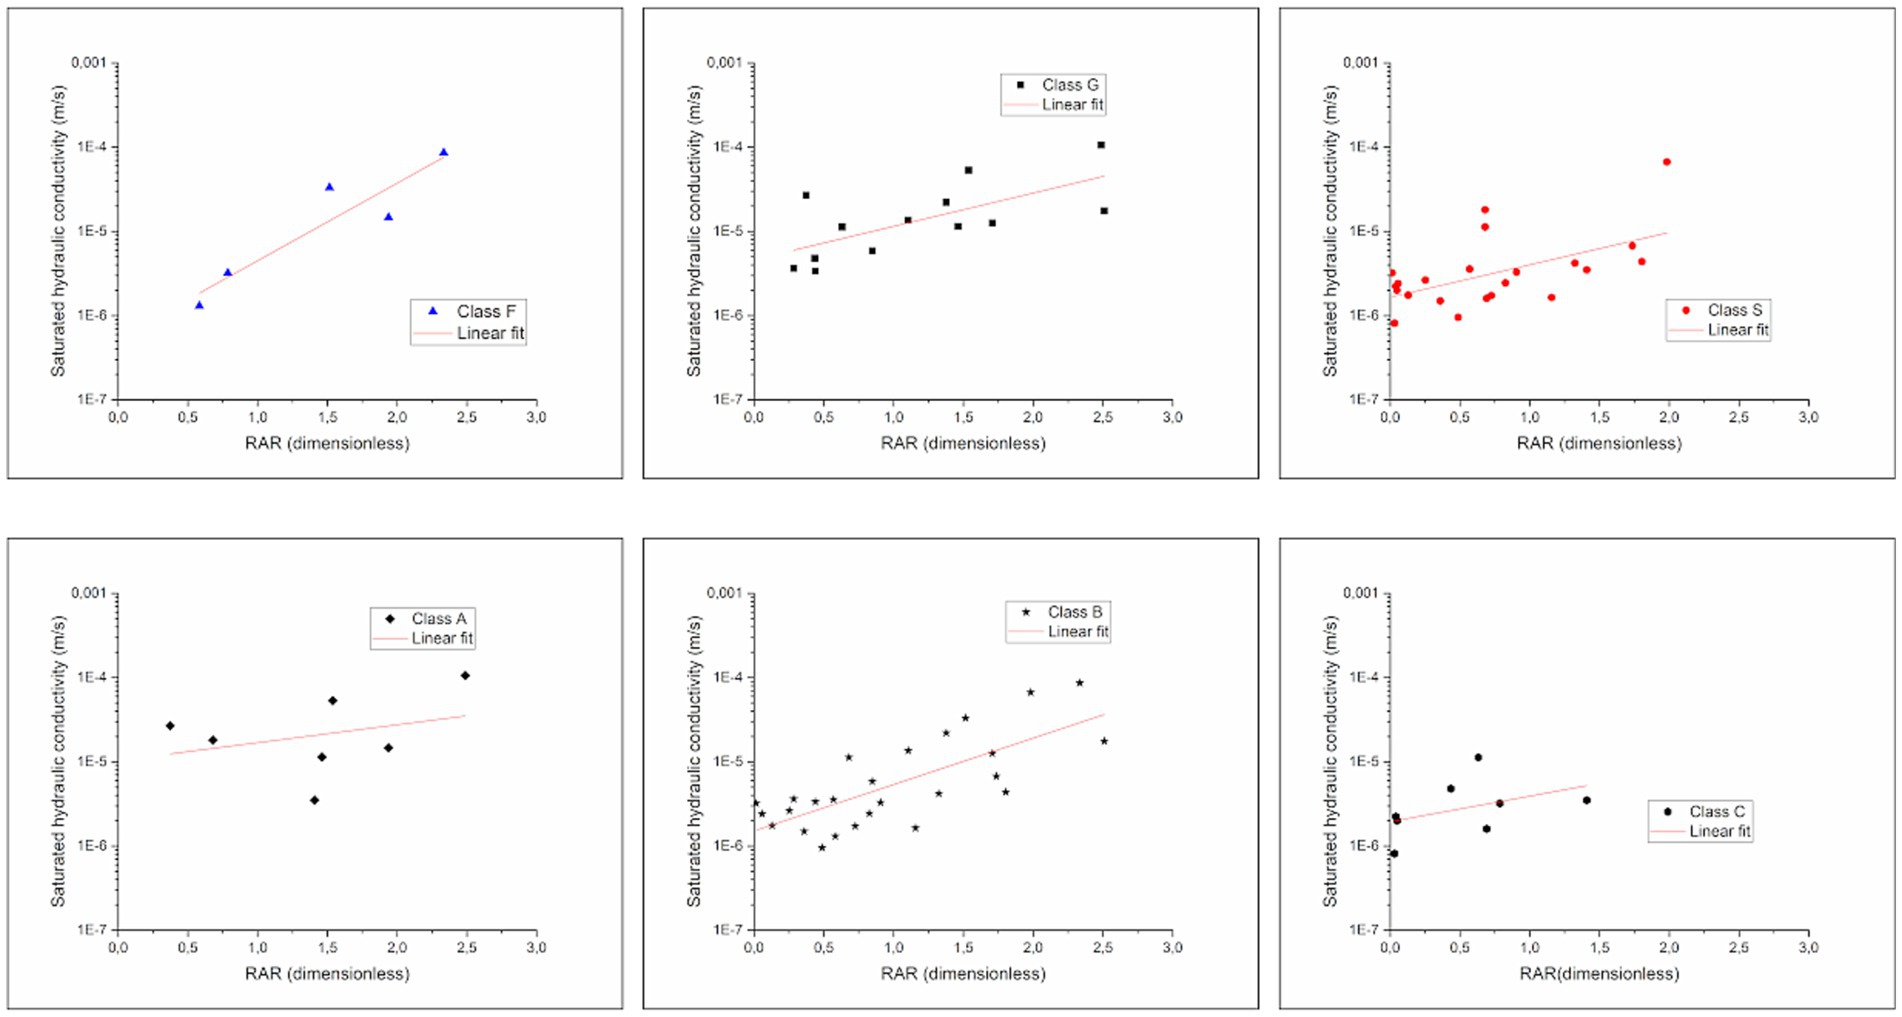
Figure 10. Relationship among hydraulic conductivity (Ks) and Root Area Ratio (RAR) data for the Garfagnana study area according to the modified USCS classes (first row) and the soil depth classes (second row).
In Figure 11 is reported the variation of root density (RAR) and the saturated hydraulic conductivity (Ks) mean values with the slope deposit depth. Based on the results, most of the root density concentrates in the first soil layers and decreases sharply following deeper layers. Saturated hydraulic conductivity changes from about 1E-04 m/s (values within the “sand” soil class following the Coduto (1999) soil classification) in the first soil layers to 1E-06 m/s (“silt” class) around 80 cm of soil depth. The Ks distribution data shows a decrease that follows the RAR data, with a decrease of the slope of the Ks-depth data distribution located around 70 cm of soil depth (1.7E-06 m/s) (Figure 11).
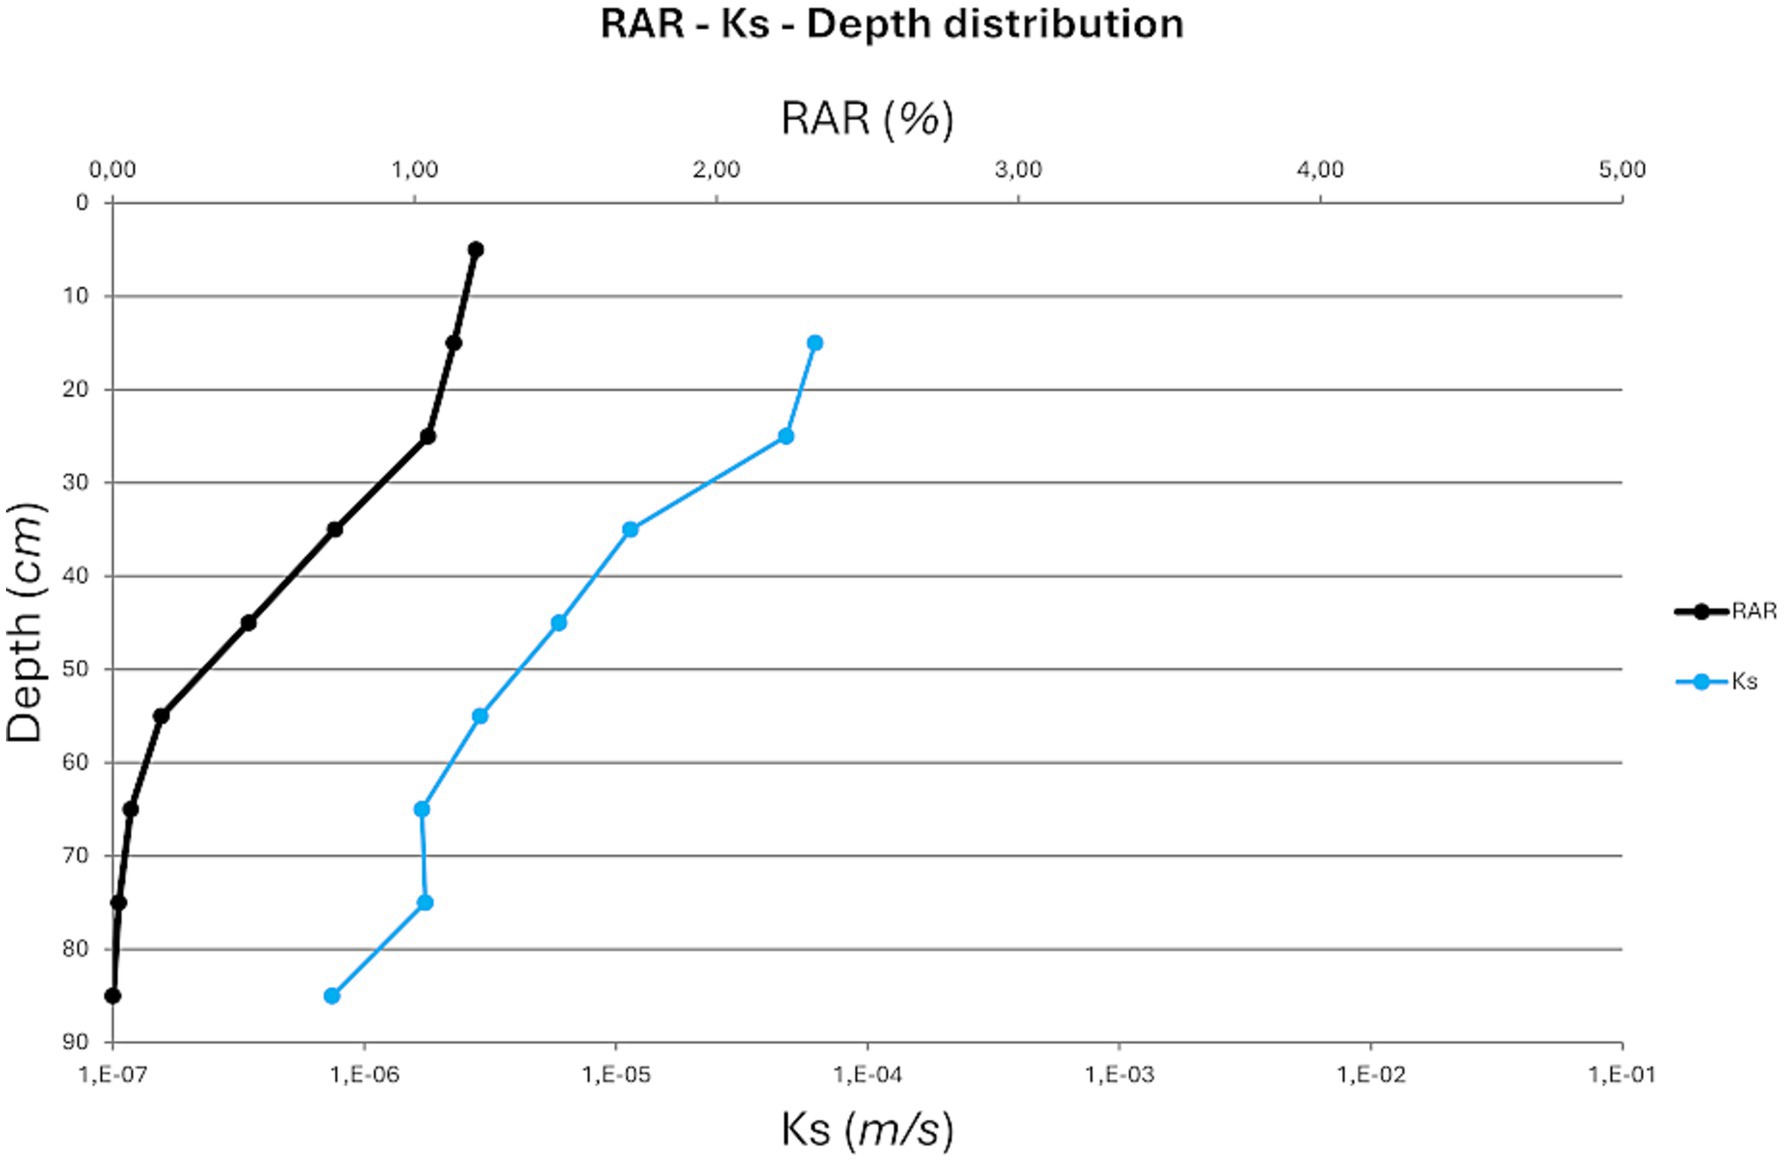
Figure 11. Root area ratio (RAR) and hydraulic conductivity (Ks) mean values distribution with slope deposit depth (Garfagnana study area).
4 Discussion
In this research we have adopted a data collection strategy at a stand scale, representing the same conditions of the rooted slope deposit (i.e., representative elementary volume) (Bagarello and Iovino, 2010). This measurement strategy has some advantages (absence of small core samples, no roots and macropore network cutting) and shortcomings (absence of controlled conditions), characteristic of field measurements (Fodor et al., 2011; Rienzner and Gandolfi, 2014). Our results in terms of relationship between vegetation below-ground features (expressed as Root Area Ratio-RAR, Root Volume Ratio-RVR and root-soil surface area) and saturated hydraulic conductivity Ks highlight the presence of a trend, showing an improvement of Ks by the presence of a well-developed root system. Our results do not show the presence of a threshold toward the increase of Ks as root density increase, in contrast with Vergani and Graf (2016) and Lange et al. (2009) results. However, the range of RAR measured in our samples seems to be much lower than the ones measured by the above-mentioned authors. Moreover, our data suggest that an increase of root density has a good correlation to an increase of slope deposit hydraulic conductivity.
The work of Lange et al. (2009) shows that an increase in root density in stagnic soils resulted in an increase in contact length, and also a decrease in film thickness, that results in an increased hydraulic conductivity for a root density of about 1 cm/cm3, and it decreases for lower or higher root densities. Our results support the hypothesis that the presence of tree roots represents a key factor in preferential infiltration. As highlighted by many authors, root morphology and soil structure depend on one another and on many mechanisms and, particularly, it is impossible to specify all preferential flow paths by means of root measurements. The work of Noguchi et al. (1997) showed the fact that at least 70 and 55% of the macropores (≥ 2 mm) located, respectively, in the topsoil and the subsoil of forests of Japan are associated with roots. Our results agree with the work of Webb et al. (2022), in which, despite a limited representativeness of the data acquired through the use of Minidisk infiltrometers with a diameter equal to 0.045 m (Meter Group, Pullman, USA) a nuanced relationship between live root morphological variables, macro-porosity and Ks, root biomass is described as the best predictor of Ks, suggesting that root turnover has an important role in soil hydraulic function. In detail, Webb et al. (2022) findings explained the variation of Ks for sub-surface slope deposits (0–0.2 m of depth) with the variation of the tree root morphological traits. However, deeper in the slope deposit profile, where the density of roots is lower (Figure 11), soil texture had a greater influence on soil hydraulic conductivity (Webb et al., 2022). Generally, root density decreases as the depth increases, and this is due to changes in nutrients and moisture availability. In agreement with the literature (Preti et al., 2022; Marzini et al., 2023; Preti et al., 2025), in this study a RAR reduction with the increment of slope deposit depth was observed, with higher RAR values (above 1%) concentrated in the first soil layer (0–0.25 m) (Figure 11). Namely, the RAR tends toward nil values when approaching to depth of ca. 0.70–0.80 m. Root depths are lower than what is reported in the literature (Preti et al., 2022; Arnone et al., 2016; Tron et al., 2014). The shallower depths could be explained by the data collection strategy used during the adopted field survey: in the Garfagnana study area the trench method was applied away from the trees so as to collect RAR data in areas less favorable toward root reinforcement, where root density is lower and, consequently, stability conditions are poorer in terms of additional cohesion (Marzini et al., 2023b).
Below-ground vegetation and saturated hydraulic conductivity data acquired into the HAFL study area refer to homogeneous situation in terms of soil texture, soil depth (about 10 cm) and porosity, in contrast to the spatially distributed measurement sites of the Garfagnana study area. Such differentiation is reflected in the data highlighted in Figures 8, 9, in which both RAR and Ks data population are statistically separated. Despite this differentiation in terms of homogeneity of soil characteristics and data acquisition strategy, both datasets showed a strong relationship between RAR and Ks, with Pearson’s r > 0.75 (Figure 9). We assume that the position of the trenches executed in the Garfagnana valley also exerted a role toward this datasets separation and, in our opinion, even the weak (or absent) relationship among the RAR and Ks considering the modified USCS classes and the soil depth classes turns out to be affected by this data acquisition strategy. Another issue to be considered when analyzing the results of our research is represented by the spatio-temporal heterogeneity of forest stand properties. The data acquisition strategy carried out in this work do not consider the variation of the relationship between RAR and Ks with time and, therefore, do not consider the temporal dynamics (i.e., how do roots and Ks vary seasonally). In detail, the temporal variation of the below-ground vegetation may depend on the seasonal dynamics of root distribution and the long-term dynamics of both tree and stand (Ngo et al., 2023). Moreover, the assumptions made for the RVR and soil-root contact surface calculation significantly overestimate the influence of these parameters. Indeed, regarding the accurate determination of these parameters four broad approaches are currently adopted for the in situ three-dimensional analysis of roots within soil: X-ray computed tomography, magnetic resonance imaging (MRI), positron emission tomography (PET), and neutron computed tomography (Hou et al., 2022). Further insights will be dedicated to the assessment of RVR and soil-root contact surface with such methods. Regarding the saturated hydraulic conductivity tests, constant hydraulic head (Aardwark permeameter) and falling-head apparatus are lightweight and simple to install requiring one person. All the necessary field data can be collected within 1–2 h per measurement. Possible drawbacks are represented by the difficulty of executing deep boreholes close to trees (due to the presence of a well-developed root architecture) and the amounts of water that must be available to carried out tests.
Results of the present study suggest that improvement could be made to the parameterization of hydrological models based on the below-ground features of vegetation. These observations show the importance of root systems for the formation of preferential flow paths and, in this context, forest management planning actions (i.e., selection of suitable tree species, tree densities and/or forest age structures) can influence directly roots distribution and, consequently, infiltration properties (Lange et al., 2009). The vertical distribution of Ks must be considered in hydrological models, and, in this context, several approaches are reported in the literature toward this issue. For example, Wang et al. (2012) simply assumed a decrease of Ks with increasing the slope deposit depth and used a decay rate as a parameter; Chen and Hu (2004) assumed an exponentially decrease of Ks with slope deposit depth; Fu et al. (2015) represent the variation of Ks with slope deposit depth for forestland in karst catchments as a parabola function. Our results in terms of root density (RAR) and Ks showed a decreasing trend with respect to depth (Figure 11), in agreement with Papasidero (2019) work, which explain the linear trend between slope deposit depth and Ks in terms of variation of slope deposit characteristics (porosity, granulometry, etc.).
5 Conclusion
This study provides new insights into the correlation between root distribution (RAR, RVR and root-soil surface area) and saturated hydraulic conductivity (Ks). Ks [through the use of constant and falling head methods (Aardwark permeameter)] and root distribution (through the application of the trench method) data were collected across different study sites: Garfagnana (Tuscany, Italy) and HAFL forest (Zollikofen, Switzerland). Our results show that root density influences significantly Ks, with both parameters influenced in turn by the soil depth and the distances from tree stem. Further insights will be dedicated to the assessment of the influence of above-ground vegetation in the water dynamics of slope deposit and to evaluate the role of different vegetation types toward the Ks.
Data availability statement
The raw data supporting the conclusions of this article will be made available by the authors, without undue reservation.
Author contributions
LM: Data curation, Formal analysis, Investigation, Methodology, Software, Validation, Visualization, Writing – original draft, Writing – review & editing. MP: Formal analysis, Investigation, Methodology, Validation, Writing – review & editing. ED'A: Formal analysis, Investigation, Validation, Writing – review & editing. MS: Conceptualization, Methodology, Supervision, Visualization, Writing – original draft, Writing – review & editing. LD: Conceptualization, Funding acquisition, Project administration, Resources, Supervision, Writing – review & editing.
Funding
The author(s) declare that financial support was received for the research and/or publication of this article. This research was funded by Università di Siena -Dipartimento di Scienze Fisiche, della Terra e dell’Ambiente within the projects: “Accordo di collaborazione scientifica cofinanziato da Consorzio LaMMA e Università di Siena” (Project leader: LD), under grant agreement no. B53C22005240002.
Acknowledgments
The authors wish to thank Liv Anna Kellermann, Dominik May, and Kim von Wattenwyl for logistic support during fieldwork.
Conflict of interest
The authors declare that the research was conducted in the absence of any commercial or financial relationships that could be construed as a potential conflict of interest.
Generative AI statement
The authors declare that no Gen AI was used in the creation of this manuscript.
Publisher’s note
All claims expressed in this article are solely those of the authors and do not necessarily represent those of their affiliated organizations, or those of the publisher, the editors and the reviewers. Any product that may be evaluated in this article, or claim that may be made by its manufacturer, is not guaranteed or endorsed by the publisher.
Supplementary material
The Supplementary material for this article can be found online at: https://www.frontiersin.org/articles/10.3389/frsus.2025.1631482/full#supplementary-material
References
Amoozegar, A. (1989). Comparison of the glover solution with the simultaneous-equations approach for measuring hydraulic conductivity. Soil Sci. Soc. Am. J. 53, 1362–1367. doi: 10.2136/sssaj1989.03615995005300050010x
Archer, N. A. L., Quinton, J. N., and Hess, T. M. (2002). Below-ground relationships of soil texture, roots and hydraulic conductivity in two-phase mosaic vegetation in south-East Spain. J. Arid Environ. 52, 535–553. doi: 10.1006/jare.2002.1011
Arnone, E., Caracciolo, D., Noto, L. V., Preti, F., and Bras, L. R. (2016). Modeling the hydrological and mechanical effect of roots on shallow landslides. Water Resour. Res. 52, 8590–8612. doi: 10.1002/2015WR018227
Bagarello, V., and Iovino, M. (2010). Conducibilità idraulica del suolo: Metodi di misura nelle applicazioni idrologiche. Hoepli: Milano.
Banwart, S., Nikolaidis, N. P., Zhu, Y. G., Peacock, C. L., and Sparks, D. L. (2019). Soil functions: connecting earth's critical zone. Annu. Rev. Earth Planet. Sci. 47, 333–359. doi: 10.1146/annurev-earth-063016-020544
Basche, A. D., and DeLonge, M. S. (2019). Comparing infiltration rates in soils managed with conventional and alternative farming methods: a meta-analysis. PLoS One 14:e0215702. doi: 10.1371/journal.pone.0215702
Basile, A., Ciollaro, G., and Coppola, A. (2003). Hysteresis in soil water characteristics as a key to interpreting comparisons of laboratory and field measured hydraulic properties. Water Resour. Res. 39:2432. doi: 10.1029/2003WR002432
Benard, P., Kroener, E., Vontobel, P., Kaestner, A., and Carminati, A. (2016). Water percolation through the root-soil interface. Adv. Water Resour. 95, 190–198. doi: 10.1016/j.advwatres.2015.09.014
Bischetti, G. B., Chiaradia, E. A., Simonato, T., Spaziali, B., Vitali, B., Vullo, P., et al. (2005). Root strength and root area ratio of forest species in Lombardy (northern Italy). Plant Soil 278, 11–22. doi: 10.1007/s11104-005-0605-4
Carminati, A., Vetterlein, D., Koebernick, N., Blaser, S., and Weller, U. (2013). Do roots mind the gap? Plant Soil 367, 651–661. doi: 10.1007/s11104-012-1496-9
Chen, X., and Hu, Q. (2004). Groundwater influences on soil moisture and surface evaporation. J. Hydrol. 297, 285–300. doi: 10.1016/j.jhydrol.2004.04.019
Chen, C., Zou, X., Singh, A. K., Zhu, X., Zhang, W., Yang, B., et al. (2021). Effects of hillslope position on soil water infiltration and preferential flow in tropical forest in Southwest China. J. Environ. Manag. 299:113672. doi: 10.1016/j.jenvman.2021.113672
Ciollaro, G., and Romano, N. (1995). Spatial variability of the soil hydraulic properties of a volcanic soil. Geoderma 65, 263–282.
Cislaghi, A., Bordoni, M., Meisina, C., and Bischetti, G. B. (2017). Soil reinforcement provided by the root system of grapevines: quantification and spatial variability. Ecol. Eng. 109, 169–185. doi: 10.1016/j.ecoleng.2017.04.034
Coduto, D. P. (1999). Geotechnical engineering principles and practices. Englewood Cliffs, NJ: Prentice-Hall.
Colombi, T., Chagas Torres, L., Walter, A., and Keller, T. (2018). Feedbacks between soil penetration resistance, root architecture and water uptake limit water accessibility and crop growth – a vicious circle. Sci. Total Environ. 626, 1026–1035. doi: 10.1016/j.scitotenv.2018.01.129
D’Addario, E. (2022). A new approach to assess susceptibility to shallow landslides at regional scale as influenced by bedrock geo-mechanical properties (Ph.D. Thesis). Siena: University of Siena.
Das Gupta, S., Mohanty, B. P., and Köhne, J. M. (2006). Soil hydraulic conductivities and their spatial and temporal variations in a vertisol. Soil Sci. Soc. Am. J. 70, 1872–1881. doi: 10.2136/sssaj2006.0201
Deljouei, A., Cislaghi, A., Abdi, E., Borz, S. A., Majnourian, B., and Hales, T. C. (2023). Implications of hornbeam and beech root systems on slope stability: from field and laboratory measurements to modelling methods. Plant Soil 483, 547–572. doi: 10.1007/s11104-022-05764-z
Eynard, A., Schumacher, T. E., Lindstrom, M. J., and Malo, D. D. (2004). Porosity and pore-size distribution in cultivated Ustolls and Usterts. Soil Sci. Soc. Am. J. 68, 1927–1934. doi: 10.2136/sssaj2004.1927
Fodor, N., Sándor, R., Orfanus, T., Lichner, L., and Rajkai, K. (2011). Evaluation method dependency of measured saturated hydraulic conductivity. Geoderma 165, 60–68. doi: 10.1016/j.geoderma.2011.07.004
Fu, T., Chen, H., Zhang, W., Nie, Y., Gao, P., and Wang, K. (2015). Spatial variability of surface soil saturated hydraulic conductivity in a small karst catchment of Southwest China. Environ. Earth Sci. 74, 2381–2391. doi: 10.1007/s12665-015-4238-5
Ghestem, M., Veylon, G., Bernard, A., Vanel, Q., and Stokes, A. (2014). Influence of plant root system morphology and architectural traits on soil shear resistance. Plant Soil 377, 43–61. Available at: https://www.jstor.org/stable/44244607
Giadrossich, F., Schwarz, M., Cohen, D., Cislaghi, A., Vergani, C., Hubble, T., et al. (2017). Methods to measure the mechanical behavior of tree roots: a review. Ecol. Eng. 109, 256–271. doi: 10.1016/j.ecoleng.2017.08.032
Gupta, S. K., Kumar, M., and Srivastava, A. K. (2024). Hydraulic conductivity of soils: a comprehensive review of the impacts of chemicals, soil salinity, organic matter, and land use. IOP Conf. Ser.: Earth Environ. Sci 1327:012032. doi: 10.1088/1755-1315/1327/1/012032
Hao, M., Zhang, J., Meng, M., Chen, H. Y. H., Guo, X., Liu, S., et al. (2019). Impacts of changes in vegetation on saturated hydraulic conductivity of soil in subtropical forests. Sci. Rep. 9:8372. doi: 10.1038/s41598-019-44921-w
Hou, L. H., Gao, W., der Bom, F., Weng, Z. H., Doolette, C. L., Maksimenko, A., et al. (2022). Use of X-ray tomography for examining root architecture in soils. Geoderma 405:115405. doi: 10.1016/j.geoderma.2021.115405
Hvorslev, M. (1951). Time lag and soil permeability in ground-water observations. Vicksburg, MI: Waterways Experiment Station, Corps of Engineers, US Army.
Kendrick, A. K., Knight, R., Johnson, C. D., Liu, G., Hart, D. J., Butler, J. J., et al. (2023). Evaluation of models for estimating hydraulic conductivity in glacial aquifers with NMR logging. Groundwater 61, 778–792. doi: 10.1111/gwat.13318
Keybondori, S., Abdi, E., Deljouei, A., Cislaghi, A., Shakeri, Z., and Etemad, V. (2025). Soil-bioengineering to stabilize gravel roadside slopes in the steep Hyrcanian forests of northern Iran. Ecol. Eng. 214:107569. doi: 10.1016/j.ecoleng.2025.107569
Klute, A., and Dirksen, C. (1986). Hydraulic conductivity and diffusivity: laboratory methods. Methods Soil Anal. Part 1 Phys. Mineral. Methods 1, 687–734. doi: 10.2136/sssabookser5.1.2ed.c28
Kroener, E., Holz, M., Zarebanadkouki, M., Ahmed, M., and Carminati, A. (2018). Effects of mucilage on rhizosphere hydraulic functions depend on soil particle size. Vadose Zone J. 17:170056. doi: 10.2136/vzj2017.03.0056
Lange, B., Lüescher, P., and Germann, P. F. (2009). Significance of tree roots for preferential infiltration in stagnic soils. Hydrol. Earth Syst. Sci. 13, 1809–1821. doi: 10.5194/hess-13-1809-2009
Lascurain, T., Angelidakis, V., Luli, S., and Nadimi, S. (2021). Imaging the root–rhizosphere interface using micro computed tomography: quantifying void ratio and root volume ratio profiles. EPJ Web Conf. Volume 249, Powders and Grains 2021 – 9th International Conference on Micromechanics on Granular Media. doi: 10.1051/epjconf/202124911005
Ledford, S. H., Zimmer, M., and Payan, D. (2020). Anthropogenic and biophysical controls on low flow hydrology in the southeastern United States. Water Resour. Res. 56:e2020WR027098. doi: 10.1029/2020WR027098
Lipiec, J., Hajnos, M., and Świeboda, R. (2012). Estimating effects of compaction on pore size distribution of soil aggregates by mercury porosimeter. Geoderma 179-180, 20–27. doi: 10.1016/j.geoderma.2012.02.014
Liu, Y., Cui, Z., Huang, Z., and López-Vicente, M. (2019). Gao-Lin Wu, influence of soil moisture and plant roots on the soil infiltration capacity at different stages in arid grasslands of China. Catena 182:104147. doi: 10.1016/j.catena.2019.104147
Lu, Z., Wei, J., and Yang, X. (2024). (2024) effects of hydraulic conductivity on simulating groundwater–land surface interactions over a typical endorheic river basin. J. Hydrol. 638:131542. doi: 10.1016/j.jhydrol.2024.131542
Lu, J., Zhang, Q., Werner, A. D., Li, Y., Jiang, S., and Tan, Z. (2020). Root-induced changes of soil hydraulic properties – a review. J. Hydrol. 589:125203. doi: 10.1016/j.jhydrol.2020.125203
Lucas, M., Schlüter, S., Vogel, H. J., and Vetterlein, D. (2019). Soil structure formation along an agricultural chronosequence. Geoderma 350, 61–72. doi: 10.1016/j.geoderma.2019.04.041
Ma, J., Li, Z., Li, P., Ma, B., Xiao, L., Cui, Z., et al. (2024). Effect of mixed plant roots on saturated hydraulic conductivity and saturated water content of soil in the loess region. Agric. Water Manag. 295:108784. doi: 10.1016/j.agwat.2024.108784
Marín-Castro, B. E., Negrete-Yankelevich, S., and Geissert, D. (2017). Litter thickness, but not root biomass, explains the average and spatial structure of soil hydraulic conductivity in secondary forests and coffee agroecosystems in Veracruz, Mexico. Sci. Total Environ. 608, 1357–1366. doi: 10.1016/j.scitotenv.2017.07.064
Marzini, L., Ciofini, D., Agresti, J., Ciaccheri, L., D’Addario, E., Disperati, L., et al. (2023). Exploring the potential of portable spectroscopic techniques for the biochemical characterization of roots in shallow landslides. Forests 14:825. doi: 10.3390/f14040825
Marzini, L., D’Addario, E., Papasidero, M. P., Chianucci, F., and Disperati, L. (2023b). Influence of root reinforcement on shallow landslide distribution: a case study in Garfagnana (northern Tuscany, Italy). Geosciences 13:326. doi: 10.3390/geosciences13110326
MeteoSwiss (2024). Available online at: https://www.meteoswiss.admin.ch/services-and-publications/publications.html#order=date-desc&page=1&pageGroup=publication&tenant=mchweb (Accessed July, 04, 2025).
Ngo, H. M., van Zadelhoff, F. B., Gasparini, I., Plaschy, J., Flepp, G., Dorren, L., et al. (2023). Analysis of poplar’s (Populus nigra ita.) root Systems for Quantifying bio-Engineering Measures in New Zealand Pastoral Hill country. Forests 14:1240. doi: 10.3390/f14061240
Noguchi, S., Tsuboyama, Y., Sidle, R. C., and Hosoda, I. (1997). Spatially distributed morphological characteristics of macropores in forest soil of Hitachi Ohta experimental watershed, Japan. J. For. Res. 2, 115–120. doi: 10.1007/BF02348479
Pandey, R. N., and Pandey, R. S. (1982). Estimation of effective infiltration rates in cracked soils. J. Agric. Sci. 99, 659–660. doi: 10.1017/S0021859600031348
Papasidero, M. P. (2019). Caratterizzazione, modellazione predittiva e studio della variabilità locale e regionale delle proprietà idrologiche dei depositi di versante (PhD thesis). Siena: University of Siena.
Preti, F., Dani, A., Giambastiani, Y., and Giachi, E. (2025). Slope stability time evolution of a shallow landslide restored by soil and water bioengineering (SWBE) techniques: a case study in Northwest Tuscany (Italy). Ecol. Eng. 214:107570. doi: 10.1016/j.ecoleng.2025.107570
Preti, F., Dani, A., Noto, L. V., and Arnone, E. (2022). On the Leonardo's rule for the assessment of root profile. Ecol. Eng. 179:106620. doi: 10.1016/j.ecoleng.2022.106620
Puccinelli, A., D’Amato Avanzi, G., and Perilli, N. (2014). Note illustrative della carta geologica d’Italia alla scala 1:50.000. Pisa: The university of Pisa.
Rienzner, M., and Gandolfi, C. (2014). Investigation of spatial and temporal variability of saturated soil hydraulic conductivity at the field-scale. Soil Tillage Res. 135, 28–40. doi: 10.1016/j.still.2013.08.012
Rillig, M. C., and Mummey, D. L. (2006). Mycorrhizas and soil structure. New Phytol. 171, 41–53. doi: 10.1111/j.1469-8137.2006.01750.x
Schaap, M. G., Leij, F. J., and van Genuchten, M. T. (1998). Neural network analysis for hierarchical prediction of soil hydraulic properties. Soil Sci. Soc. Am. J. 62, 847–855. doi: 10.2136/sssaj1998.03615995006200040001x
Shao, W., Ni, J., Leung, A. K., Su, Y., and Ng, C. W. W. (2017). Analysis of plant root–induced preferential flow and pore-water pressure variation by a dual-permeability model. Can. Geotech. J. 54, 1537–1552. doi: 10.1139/cgj-2016-0629
Theron, E., Le Roux, P., Hensley, M., and Van Rensburg, L. (2010). Evaluation of the aardvark constant head soil permeameter to predict saturated hydraulic conductivity. WIT Trans. Ecol. Environ. 134, 153–162.
Tron, S., Dani, A., Laio, F., Preti, F., and Ridolfi, L. (2014). Mean root depth estimation at landslide slopes. Ecol. Eng. 69, 118–125. doi: 10.1016/j.ecoleng.2014.03.019
USBR7300-89 (1990). Procedure for performing field permeability testing by the well permeameter. Earth manual: Part 2. Denver, CO: U.S. Department of the Interior, Bureau of Reclamation, 1234–1235.
Vacchiano, G., Garbarino, M., Lingua, E., and Motta, R. (2017). Forest dynamics and disturbance regimes in the Italian Apennines. For. Ecol. Manag. 388, 57–66. doi: 10.1016/j.foreco.2016.10.033
van Noordwijk, M., Brouwer, G., Meijboom, F., do Rosario, M., Oliveria, G., and Bengough, A. G. (2000). “Trench profile techniques and core break methods” in Root methods a handbook. eds. A. L. Smit, A. G. Bengough, C. Engels, M. Van Noordwijk, S. Pellerin, and S. C. Van de Geijn (Berlin: Springer), 211–233.
Vereecken, H., Amelung, W., Bauke, S. L., Bogena, H., Brüggemann, N., Montzka, C., et al. (2022). Soil hydrology in the earth system. Nat. Rev. Earth Environ. 3, 573–587. doi: 10.1038/s43017-022-00324-6
Vergani, C., and Graf, F. (2016). Soil permeability, aggregate stability and root growth: a pot experiment from a soil bioengineering perspective. Ecohydrol. 9, 830–842. doi: 10.1002/eco.1686
Vieira, B. C., and Fernandes, N. F. (2004). Landslides in Rio deJaneiro: the role played by variations in soil hydraulic con-ductivity. – Hydrol. PRO 18, 791–805. doi: 10.1002/hyp.1363
Wang, Y. Q., Shao, M. A., and Liu, Z. P. (2012). Pedotransfer functions for predicting soil hydraulic properties of the Chinese loess plateau. Soil Sci. 177, 424–432. doi: 10.1097/SS.0b013e318255a449
Webb, B., Robinson, D. A., Marshall, M. R., Ford, H., Pagella, T., Healey, J. R., et al. (2022). Variation in root morphology amongst tree species influences soil hydraulic conductivity and macroporosity. Geoderma 425:116057. doi: 10.1016/j.geoderma.2022.116057
Keywords: soil permeability, root distribution, hydraulic conductivity, root density, soil hydraulic properties
Citation: Marzini L, Papasidero MP, D’Addario E, Schwarz M and Disperati L (2025) Exploring the relationship between saturated hydraulic conductivity and roots distribution: two case studies in Garfagnana (Northern Tuscany, Italy) and Zollikofen (Bern, Switzerland). Front. Sustain. 6:1631482. doi: 10.3389/frsus.2025.1631482
Edited by:
Alessio Cislaghi, University of Milan, ItalyReviewed by:
Anna Ilek, Poznan University of Life Sciences, PolandYafan Zuo, Shanxi Agricultural University, China
Copyright © 2025 Marzini, Papasidero, D’Addario, Schwarz and Disperati. This is an open-access article distributed under the terms of the Creative Commons Attribution License (CC BY). The use, distribution or reproduction in other forums is permitted, provided the original author(s) and the copyright owner(s) are credited and that the original publication in this journal is cited, in accordance with accepted academic practice. No use, distribution or reproduction is permitted which does not comply with these terms.
*Correspondence: Lorenzo Marzini, bC5tYXJ6aW5pQGlmYWMuY25yLml0; Massimiliano Schwarz, bWFzc2ltaWxpYW5vLnNjaHdhcnpAYmZoLmNo; Leonardo Disperati, ZGlzcGVyYXRpQHVuaXNpLml0