 S. M. Balashov1*
 J. A. L. Prestes
 S. A. Moshkalev
- 1Infrastructure Division of Microsystems, Information Technology Center Renato Archer, Campinas, Brazil
- 2Facti - Fundação de Apoio à Capacitação em Tecnologia da Informação, Unique Village Offices, Campinas, Brazil
- 3Companhia Energética de Brasília –CEB-D, SIA, Brasília, Brazil
- 4Center for Semiconductor Components and Nanotechnologies, University of Campinas, Campinas, Brazil
Surface Acoustic Waves (SAW) sensors are known to be an excellent choice for the measurement of a small concentration of analytes in gas mixtures. The use of this type of sensor has been limited until now in the industrial environment due to the sensitivity of its response to temperature variations. To overcome this problem, thermal stabilization of equipment is normally used. We propose here a simple procedure of compensation of thermal drift in SAW sensors, allowing the measurements to be performed in temperature intervals of up to 20 degrees without any thermal stabilization of the sensitive element of a sensor. By monitoring the temperature of the key points of the sensor and applying the proposed polynomial compensation, it is possible to reduce the influence of thermal instabilities of the ambient temperature to the response more than four times. The method is illustrated by a temperature compensated SAW humidity sensor with a graphene oxide nanofilm as water molecules’ sensitive element. The results show enhanced performance of the sensor over a large temperature interval.
Introduction
Surface Acoustic Wave (SAW) nanosensors for various types of gases with sensitive elements made of nanofilms, such as graphene oxide (Balashov et al., 2013; Xuan et al., 2015), carbon nanotubes decorated with nanoparticles (Sivaramakrishnan et al., 2008), or nanorods of zinc oxide (Wen et al., 2011), present excellent sensitivity and a short response time. The sensitive elements in such sensors are the thin films with thickness on the order of nanometers that guarantee the short response and recovery times of the device. The high sensitivity of these devices makes them ideal candidates for monitoring low levels of impurities in various types of gaseous mixtures in industrial environments. Their sensitivity, which can reach the level of ppb of the analyte, can be explained by the fact that SAW elements are actually high-frequency acoustic resonators or delay lines. Being incorporated into the feedback of a wide band amplifier, they turn a circuit into an RF oscillator with the surface of the SAW element (delay line or resonator) covered with a sensitive nanofilm. As is well known, SAW velocity V is a function of film density, which, in the case of a sensor, changes if a sensitive film captures some molecules of an analyte. SAW velocity directly affects oscillator frequency, turning it into a gravimetric sensor. Details of functioning of these sensors are discussed elsewhere (Parker and Montress, 1988; Schmitt et al., 2001; Wen et al., 2006).
The drawback of typical highly sensitive SAW sensor architecture is its high sensitivity to external factors such as temperature variations, components tolerance, and ambient pressure. Although a typical SAW sensor has a reference channel (Mujahid and Dickert, 2017; Zhang et al., 2017) to cancel out the influence of these factors, the cancellation does not resolve the problem completely (He et al., 2009). A typical example of the practical situation is the influence of temperature on the sensor response. Due to its influence, the use of SAW sensors usually requires precise temperature stabilization as the only way to maintain reasonable accuracy (Wang et al., 2015). Without the use of the thermostabilized chamber, the repetitive measurements of the sensor response for the same concentration of the analyte often present the slow drift of the signal (Wang et al., 2020), which can be attributed to the temperature change. Thermostabilization is not always an acceptable solution, especially when a sensor works in the industrial environment, being subjected to all temperature changes of the technological process.
Here, we present the algorithm for digital compensation of the temperature contribution to a SAW sensor response, which opens the possibility to use these devices in various environments when temperatures change during the process of measurements. The proposed method is illustrated by the analysis of the SAW nanosensor with graphene oxide sensitive films designed for humidity monitoring.
Temperature Compensation Algorithm
The typical SAW nanosensor consists of two channels, each of which is a SAW delay-line stabilized oscillator (Parker and Montress, 1988) (Figure 1). The oscillation frequency of each channel is stabilized by a correspondent delay line (1,2) and, in the first approximation, is determined by the phase increment Δφ, which occurs during propagation of the SAW on the surface of the crystal (Wen et al., 2006). Oscillation frequency F is determined by a standard condition (Schmitt et al., 2001):
where L–is the effective length of the delay line and i is the channel number. Details of the theory of this type of sensor can be found elsewhere (Parker and Montress, 1988; Schmitt et al., 2001; Wen et al., 2006). Note that, due to the adsorption of analyte molecules in the measurement channel, V1 change causes the change of the oscillation frequency.
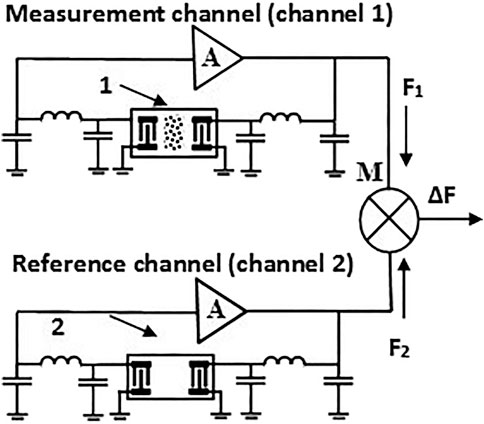
FIGURE 1. Simplified electric circuit of the SAW sensor. A–wideband RF amplifier; M–RF mixer; 1–delay line with the sensitive film deposited on its surface; ΔF–resulting signal; 2delay line without nanofilm; F1–frequency of oscillation of the measurement channel, which depends on the analyte density; F2–frequency of oscillation of the reference channel. Capacitances and inductances are the elements of impedance matching circuits.
Differential frequency ΔF = F1−F2 is used as a response of the sensor (Figure 1). Considering that, normally, both channels are made identical, in the first approximation the temperature change produces equal changes of frequencies in each channel, making ΔF insensitive to it. However, this simple approach gives reasonable results only in a few degrees temperature interval. For a larger interval, this simple Eq. 1 is not valid and the frequency generation condition should be written in a more detailed form:
where T–is the ambient temperature. The term φi corresponds to the temperature dependent part of the phase contribution of all electronic components and a piezoelectric crystal. Note that normally the electronic components, PCB and quartz crystals, have different operational temperatures not equal to the ambient temperature due to different thermal properties and thermal convection from different parts of the sensor. This is reflected by adding into (2) the additional term ΔTi which is specific for each channel. Using Eq. 2 for the experimentally measurable sensor response, we come to:
The first term of the last equation inEq. 3 corresponds to the ideal response of the sensor, which we finally want to extract. This term does not depend on temperature and, thus, will give a constant contribution to ΔF if temperature is the only varying factor. The additional term ψ, which contains contributions of all factors but mass loading, should be evaluated separately and subtracted from ΔF to have the desirable sensor response. Note that, in practice, temperature shifts ΔTi depends on T because they are determined by heat exchange with ambient temperature in the case of the sensor being in thermal equilibrium. Thus, ψ is a complex function of the ambient temperature, which can be determined only experimentally.
There are two different contributions to the term ψ. The first one is determined by the temperature coefficient of delay in the piezoelectric SAW delay line and, partially, by mounting process (die bonding, residual mechanical stress, etc.). The differential architecture of the sensor with the additional reference channel is supposed to cancel this type of drift, caused by the difference in the propagation of acoustic signal in each channel. To improve the drift cancellation, two channels can be placed in the same crystal and special geometry of the SAW elements can be used (Lim et al., 2011; Xu et al., 2015). The electronic part of such setups normally consists of thermostable high precision equipment, such as a network analyzer, which means that it has practically absolute thermostability of electronics and the resulting temperature drift of an acoustic nature should be considered as the maximum possible stability of the proposed sensor architecture.
The second type of contribution to ψ, which is much less studied, starts to play a dominant role if cheap and simple electronics, like those shown in Figure 1, are used. In such devices, temperature dependence of the phase of the feedback signal starts to depend strongly on the temperature characteristics of amplifiers and all passive elements, which work in slightly different temperature regimes due to different currents that pass through them. The importance of such a contribution can be illustrated by a simple experiment, when in the device, like that shown in Figure 1, the matching circuit is changed simultaneously in both channels. This change of the matching circuit causes not only the change in absolute value of differential frequency but also in the turn-over point and general shape of the frequency drift curve. Experiments show that for oscillators in the range of 160–200 MHz this change can have the value of several kHz in ten degree intervals, which is much higher than the contribution of the first type. In the present paper we propose the method of practical evaluation of the sum of both contributions.
To evaluate ψ experimentally the following procedure was applied:
(1) The sensor is assembled with both channels stabilized with equal delay lines without a sensitive film. It means that for this case
(2) The response of such a device is measured in the temperature interval of interest and the obtained result is interpolated by a suitable polynomial Pn(T) (n–is the polynomial order).
(3) The delay line in the measurement channel is removed and substituted with the delay line of the same type but covered with a sensitive nanofilm.
(4) The sensor starts to measure ΔF, which corresponds to the change of the concentration of the analyte, and the previously obtained polynomial is subtracted from the obtained result. The resultant value is accepted as the sensor response.
This approach is based on the fact that, when two equivalent delay lines without sensitive film are used, the desirable response should be equal to zero. Thus, the first step corresponds to the case when V1 = V2 and L1 = L2, which means that the response, obtained in step 2, is
Note, that, according to the procedure described above, after approximation
The use of Eq. 4 requires the simultaneous measurement of the temperature and frequency response of the sensor.
Experimental
In order to test the proposed algorithm, a special chamber with adjustable pressure and humidity was used (Figure 2). The chamber 1) can be filled with the gas to be analyzed in a controllable way. The PCB with the SAW sensor 4) was directly attached to the chamber to ensure good thermal contact with it. SAW delay lines of both channels 5) and the temperature sensor 6) were placed inside the chamber. The temperature sensor was mounted near to SAW elements. All electronic components were mounted on the opposite side of the PCB. The total energy consumption of the sensor, determined mainly by the consumption of RF amplifiers, was about 80 mW. The PCB with ARDUINO controller 3) for frequency and temperature measurements (temperature step is equal to 0.3 degree) and all necessary electronic components were placed near to the SAW sensor, which generated additional heat flow. A special locking system 2) was designed to allow for rapid changes of the humidity level by introducing into the chamber humidity standards in the form of saturated solutions of different salts (Balashov et al., 2015). The entire system mimics the functioning of a typical industrial sensor in the environment where the necessity to maintain the conditions of the industrial process leads to temperature and pressure gradients, which cannot be eliminated.
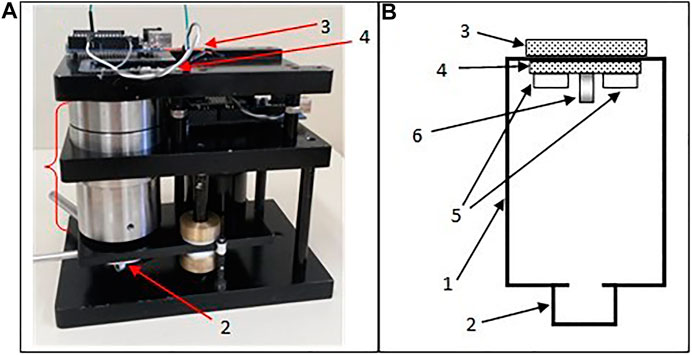
FIGURE 2. (A)- System for SAW sensors testing in the controlled atmosphere and its block diagram (B). 1–gas chamber; 2–locking system; 3–ARDUINO; 4–PCB of the SAW sensor; 5–SAW delay lines; 6–temperature sensor. Homemade lever setup used for tests of sensor performance. 1–polyvinylchloride (PVC) base, 2–PTFE axis, 3–Al beam, 4 –PTFE indenter, 5–moving PTFE load, 6–sensor, 7–connection to a stepper motor.
During all tests, the device was put into a climatic chamber and the temperature was recorded together with the frequency response of the SAW sensor in real-time. All tests were done in the interval of ambient temperature from 10 to 40oC. Measurements of temperature of the two sensor channels with an infrared thermometer gave the values of ΔT1 = 10oC, ΔT2 = 8oC at the points of fixation of crystals, which remained constant for the entire interval of ambient temperature. It means that the function
Measurements of the temperature response of the sensor with equal delay lines (step 1 of the procedure described in the previous section) were done for the case of air with very low humidity (air in the chamber was desiccated by a silica gel). Time dependences of ΔF and PCB temperature for this case are shown in Figure 3A. The clear correlation of curves confirms that the chosen point of temperature measurement is adequate to monitor changes in ΔF. Note that the PCB temperature is 10°degrees higher (ΔT1 = 10oC) than the ambient one. Experimentally measured ΔF for this case is equal to
with A0 = 67,065, A1 = 495.48, A2 = 2.2427, and A3 = −0.1457 are shown in Figure 3B. The residual frequency instability (the difference between ΔF and
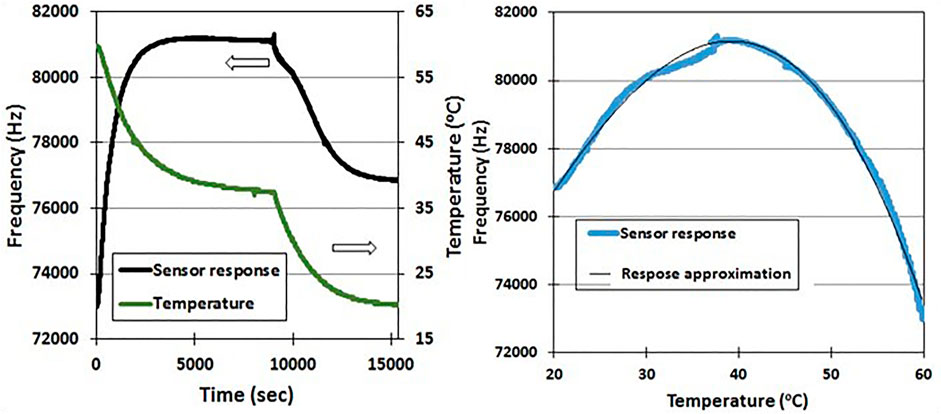
FIGURE 3. (A)- Time dependence of experimentally measured ΔF (black curve) and PCB temperature (green curve). (B)–Temperature dependence of ΔF. The black curve is the approximation by polynomial.
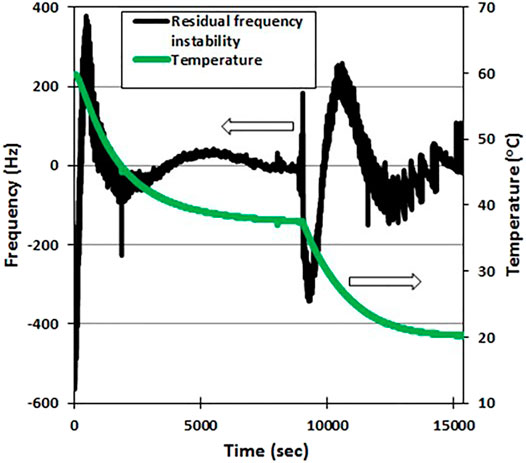
FIGURE 4. Time dependence of the residual frequency instability (black curve) for the case of two SAW delay lines without GO film.
Note that the use of the proposed polynomial approximation reduced the 8 kHz frequency drift (Figure 3A) of the sensor response to a much lower value (Figure 4). This frequency drift in the device without a deposited sensitive film characterizes the asymmetry in the electronic parts of feedback loops in channels, as was discussed above. Figure 3 with the peak-to-peak oscillation in the range of 650 Hz characterizes the stability of the frequency reference point and corresponds to the precision of the sensor in a wide temperature range after applying the proposed method of compensation. Cyclic repetition of the heating and cooling procedures and extraction of the polynomial (3) from the obtained results always give slightly different curves, but the peak-to-peak value of the resultant curve always stays in the range of 500–700 Hz, which is a significant improvement. Considering that two channels oscillate at a frequency of around 260 MHz, relative stability is equal to 2.5 × 10⁻⁶.
Results and Discussion
At the next step, the sensitive film of graphene oxide (GO) was deposited on the surface of one of the channels. GO is known to be a highly hydrophilic substance, thus the delay line with such a film turns into a sensitive element of the SAW sensor. The sensitivity of such a film was evaluated to be approximately 300Hz/RH% (Balashov et al., 2015). Two types of experiments were performed to test the sensor:
(1) The chamber was desiccated by the silica gel and put into the climatic chamber. After the equilibrium inside the chamber was reached, the temperature was gradually increased and the sensor response was measured and treated by the proposed algorithm.
(2) The chamber was desiccated and the saturated NaCl solution was inserted into the chamber, producing 75% relative humidity inside. The relation between the volumes of introduced salt and the chamber was around 0.01, which resulted in a very slow process of the saturation of the chamber with the water molecules. This situation corresponds to the process of long-time monitoring of the sensor parameters. The resulting measurements were treated by the proposed algorithm.
The results of measurements of ΔF for the first case are shown in Figure 5. Initially the ambient temperature was kept constant but, after ∼1,000 s, it started to rise linearly (green curve). The sensor frequency drift (black curve), which corresponds to this frequency shift, is approximately 1.3 kHz. After applying the compensation algorithm, it is reduced to approximately 450 Hz. Analysis of the behavior of the sensor during the change of temperature (Figure 5) shows that the proposed algorithms remove the parasitic contribution of the electronic part of the sensor to the response and allows one to use it in 10°degree temperature intervals without any thermal stabilization. The remaining change of the sensor response in the curve with the compensation algorithm applied can be attributed to real increase of the partial pressure of the water molecules due to heating of the silica gel.
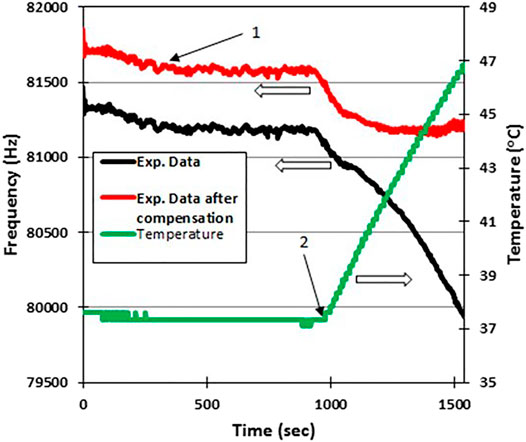
FIGURE 5. Results of the evaluation of temperature stability of the SAW humidity sensor. Black curve–experimentally measured response ΔF of the sensor with GO film for the case of very low humidity (air was desiccated with silica gel). Red curve–the same experimental results with
The results of measurements for the second case are shown in Figure 6. The monitoring of the process of a slow analyte density change with final saturation corresponds to the typical situation, which takes place in industry, where the process is assumed to be stable and continuous over time. The sensor in this case is used to monitor the process parameters. Figure 6, which corresponds to results of the second type of the test, shows the process, where the saturation should occur approximately after 40,000 s, thus after this time the response of the sensor is supposed to become constant. In contrast to this expectation, it presents a slow drift with an amplitude of approximately 1.0 kHz (black curve in Figure 6). Although small inevitable changes in temperature (green curve in Figure 6) over the long period of time might be acceptable by conditions of the process, they produce 1.0 kHz deviation in the sensor response. After applying the proposed algorithm to the experimental curve, the result (red curve in Figure 6) corresponds to a typical saturation curve of adsorption of gas molecules to the sensitive film surface and clearly shows the saturation. Drift of the frequency, which starts from approximately 40,000 s (black curve), repeats the shape of the temperature curve and can be clearly attributed to the parasitic effect of the electronic part of the sensor. It was completely eliminated by the proposed algorithm (red curve). Note that ripples on the compensated red curve in Figure 6 are caused by the digital temperature sensor temperature step and could be removed if resolution is increased.
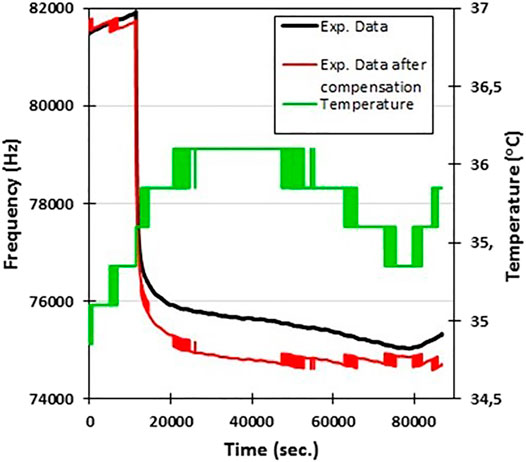
FIGURE 6. Monitoring of the process of the saturation of the chamber with the water vapor. Approximately after 10,000 s the supersaturated salt of NaCl was inserted into the chamber. Experimental data (black curve) present distortions caused by temperature drift (green curve), which are compensated, using proposed approach (red curve). The steps on the final compensated curved are caused by the discrete values of temperature measured by the digital temperature sensor.
During the search of parameters responsible for the drift of the SAW filter response, it became clear that PCB temperature plays the most important role in it. Measurements with the IR thermometer showed that the hottest place on the PCB is the RF amplifier. It is placed near to SAW delay lines to ensure the smallest RF loop and generation stability. The SAW delay lines are the second hottest places on the PCB. It is the air convection and heat transfer in the metal parts that ensure thermal equilibrium between PCB and ambient temperature, which means that there exists a time delay between PCB temperature and ambient temperature change. Taking this into account, IC thermistor MCP9701 A (see Figure 2B) was placed on the backside of the PCB below matched RF amplifier MGVA-62+. The SAW delay line of the first channel (Figure 1) was mounted near to it (Figure 2B). Temperature measured at this point appeared to be directly connected to the differential frequency of oscillation (Figure 3A) and, thus, it was taken as the main parameter for the temperature compensation procedure.
The proposed procedure of temperature compensation assumes that if two equivalent SAW delay lines are used, then the nonzero value of ΔF is determined solely by differences in electronic components and some aspects of mounting of crystal on PCB, which are normally out of control but are stable over time. Figure 3B shows the temperature dependence of this value and its approximation by the polynomial. It works as a calibration curve for a given sensor. The real response of the sensor with the sensitive film is assumed to be this curve plus a contribution of mass loading, which is characteristic of the ideal sensor to be extracted. The precision of the calibration curve can be estimated by analyzing Figure 4. Averaging of the curve shown in Figure 4 gives discrepancies no higher than +/-100 Hz, which is enough for precise estimation of the analyte concentration.
Conclusion
The proposed algorithm of compensation of thermal shift of SAW sensors response allows one to use this type of sensor in conditions of changing temperature without the use of thermostabilization of the sensitive element. This is especially important when it is necessary to measure small changes of the analyte concentration, when temperature change gives a comparable or bigger contribution to the sensor response. The proposed approach opens the possibility to use SAW sensors in an industrial environment without applying thermostabilization equipment.
Data Availability Statement
The raw data supporting the conclusion of this article will be made available by the authors, without undue reservation.
Author Contributions
SB designed all experiments and characterizations, JR, MH, JP, and AC. realized sensor fabrication and characterization. SB, AC, and SM participated in discussing the data and writing the article.
Funding
The authors would like to thank Energy Company of Brasilia CEB for financial support of the work within the project P&D ANEEL PD-05160-1708/2017.
Conflict of Interest
Authors JR, MH, and JP were employed by the company Facti - Fundação de Apoio à Capacitação em Tecnologia da Informação. Author AC was employed by the company Companhia Energética de Brasília –CEB-D.
The remaining authors declare that the research was conducted in the absence of any commercial or financial relationships that could be construed as a potential conflict of interest.
Acknowledgments
The authors thank the CTI staff for technical assistance.
References
Balashov, S. M., Balachova, O. V., Braga, A. V. U., Bazetto, M. C. Q., Pavani Filho, A., and Moshkalev, S. (2013). “Kinetic Characteristics of the SAW Humidity Sensor Partially Coated with Graphene Oxide Thin Film,” inSBMicro 2013: 28th Symp. Microelectr. Technol. Devices, 2013. Curitiba, Brazil, September 2–6, 2013 (Curitiba, Brazil: IEEE). doi:10.1109/sbmicro.2013.6676163
Balashov, S. M., Balachova, O. V., Braga, A. V. U., Filho, A. P., and Moshkalev, S. (2015). Influence of the Deposition Parameters of Graphene Oxide Nanofilms on the Kinetic Characteristics of the SAW Humidity Sensor. Sens. Actuators B: Chem. 217, 88–91. doi:10.1016/j.snb.2014.11.050
He, S., Wang, W., Li, S., Pan, Y., and Liu, M. (2009). High-frequency Stability Oscillator for Surface Acoustic Wave Gas Sensor. Acoust. Sci. Tech. 30 (1), 7–12. doi:10.1250/ast.30.7
Lim, C., Wang, W., Yang, S., and Lee, K. (2011). Development of SAW-Based Multi-Gas Sensor for Simultaneous Detection of CO2 and NO2. Sens. Actuators B: Chem. 154, 9–16. doi:10.1016/j.snb.2010.02.057
Mujahid, A., and Dickert, F. L. (2017). Surface Acoustic Wave (SAW) for Chemical Sensing Applications of Recognition Layers. Sensors 17, 2716. doi:10.3390/s17122716
Parker, T. E., and Montress, G. K. (1988). Precision Surface-Acoustic-Wave (SAW) Oscillators. IEEE Trans. Ultrason. Ferroelect., Freq. Contr. 35, 342–364. doi:10.1109/58.20455
Schmitt, R. F., Allen, J. W., and Wright, R. (2001). Rapid Design of SAW Oscillator Electronics for Sensor Applications. Sens. Actuators B: Chem. 76, 80–85. doi:10.1016/s0925-4005(01)00576-7
Sivaramakrishnan, S., Rajamani, R., Smith, C. S., McGee, K. A., Mann, K. R., and Yamashita, N. (2008). Carbon Nanotube-Coated Surface Acoustic Wave Sensor for Carbon Dioxide Sensing. Sens. Actuators B: Chem. 132, 296–304. doi:10.1016/j.snb.2008.01.041
Wang, F., Jian, J., Geng, X., Gou, G., Cui, W., Cui, J., et al. (2020). A Miniaturized Integrated SAW Sensing System for Relative Humidity Based on Graphene Oxide Film. IEEE Sens. J. 20, 9733–9739. doi:10.1109/jsen.2020.2989787
Wang, S.-H., Shen, C.-Y., Su, J.-M., and Chang, S.-W. (2015). A Room Temperature Nitric Oxide Gas Sensor Based on a Copper-Ion-Doped Polyaniline/Tungsten Oxide Nanocomposite. Sensors 15, 7084–7095. doi:10.3390/s150407084
Wen, C. B., Ju, Y. F., Li, W. L., Sun, W. Z., Xu, X., Shao, Y., et al. (2011). Carbon Dioxide Gas Sensor Using SAW Device Based on ZnO Film. Appl. Mech. Mater 135-136, 347–352. doi:10.4028/www.scientific.net/amm.135-136.347
Wen, W., Shitang, H., Shunzhou, L., and Yong, P. (2006). High Frequency Stability Oscillator for Surface Acoustic Wave-Based Gas Sensor. Smart Mater. Struct. 15, 1525–1530. doi:10.1088/0964-1726/15/4/006
Xu, F.-Q., Wang, W., Xue, X.-F., Hu, H.-L., Liu, X.-L., and Pan, Y. (2015). Development of a Wireless and Passive SAW-Based, 2015 SAW-Based Chemical Sensor for Organophosphorous Compound Detection. Sensors 15, 30187–30198. doi:10.3390/s151229793
Xuan, W., He, X., Chen, J., Wang, W., Wang, X., Xu, Y., et al. (2015). High Sensitivity Flexible Lamb-Wave Humidity Sensor with Graphene Oxide Sensing Layer. Nanoscale 7, 7430–7436. doi:10.1039/c5nr00040h
Keywords: surface acoustic waves, sensor, graphene oxide, temperature compensation, thin films
Citation: Balashov SM, Rocha JM, Hurtado MRF, Prestes JAL, de Campos AFM and Moshkalev SA (2021) Improved Stability and Performance of Surface Acoustic Wave Nanosensors Using a Digital Temperature Compensation. Front. Sens. 2:617484. doi: 10.3389/fsens.2021.617484
Received: 14 October 2020; Accepted: 04 May 2021;
Published: 14 June 2021.
Edited by:
Huanyu Cheng, Pennsylvania State University (PSU), United StatesReviewed by:
Jan Mitrovics, Independent researcher, Tübingen, GermanyZhenhua Tian, Mississippi State University, United States
Copyright © 2021 Balashov, Rocha, Hurtado, Prestes, de Campos and Moshkalev. This is an open-access article distributed under the terms of the Creative Commons Attribution License (CC BY). The use, distribution or reproduction in other forums is permitted, provided the original author(s) and the copyright owner(s) are credited and that the original publication in this journal is cited, in accordance with accepted academic practice. No use, distribution or reproduction is permitted which does not comply with these terms.
*Correspondence: S. M. Balashov, c2VyZ2V5LmJhbGFzaG92QGdtYWlsLmNvbQ==; S. A. Moshkalev, c3RhbmlzbGFAdW5pY2FtcC5icg==