 Renske M. Verweij1,2*
 Melinda C. Mills3
 Gert Stulp1Ilja M. Nolte4
 Nicola Barban5
 Felix C. Tropf6,7
 Douglas T. Carrell8
 Kenneth I. Aston8Krina T. Zondervan9Nilufer Rahmioglu9
 Marlene Dalgaard10,11Carina Skaarup10
 M. Geoffrey Hayes12,13,14Andrea Dunaif15
 Guang Guo16
 Harold Snieder4
- 1Department of Sociology and ICS, University of Groningen, Groningen, Netherlands
- 2Department of Public Administration and Sociology, Erasmus University Rotterdam, Rotterdam, Netherlands
- 3Department of Sociology and Nuffield College, University of Oxford, Oxford, United Kingdom
- 4Department of Epidemiology, University of Groningen, University Medical Center Groningen, Groningen, Netherlands
- 5Institute of Social and Economic Research, University of Essex, Essex, United Kingdom
- 6École Nationale de la Statistique et de L'administration Économique (ENSAE), Paris, France
- 7Center for Research in Economics and Statistics (CREST), Paris, France
- 8Department of Surgery, University of Utah, Salt Lake City, UT, United States
- 9Wellcome Centre for Human Genetics, University of Oxford, Oxford, United Kingdom
- 10Department of Bio and Health Informatics, Technical University of Denmark, Lyngby, Denmark
- 11Department of Growth and Reproduction, Rigshospitalet, Copenhagen, Denmark
- 12Division of Endocrinology, Metabolism, and Molecular Medicine, Department of Medicine, Northwestern University Feinberg School of Medicine, Chicago, IL, United States
- 13Center for Genetic Medicine, Northwestern University Feinberg School of Medicine, Chicago, IL, United States
- 14Department of Anthropology, Northwestern University, Evanston, IL, United States
- 15Department of Endocrinology, Diabetes and Bone Disease, Icahn School of Medicine at Mount Sinai, New York, NY, United States
- 16Department of Sociology, University of North Carolina at Chapel Hill, Chapel Hill, NC, United States
Biological, genetic, and socio-demographic factors are all important in explaining reproductive behavior, yet these factors are typically studied in isolation. In this study, we explore an innovative sociogenomic approach, which entails including key socio-demographic (marriage, education, occupation, religion, cohort) and genetic factors related to both behavioral [age at first birth (AFB), number of children ever born (NEB)] and biological fecundity-related outcomes (endometriosis, age at menopause and menarche, polycystic ovary syndrome, azoospermia, testicular dysgenesis syndrome) to explain childlessness. We examine the association of all sets of factors with childlessness as well as the interplay between them. We derive polygenic scores (PGS) from recent genome-wide association studies (GWAS) and apply these in the Health and Retirement Study (N = 10,686) and Wisconsin Longitudinal Study (N = 8,284). Both socio-demographic and genetic factors were associated with childlessness. Whilst socio-demographic factors explain 19–46% in childlessness, the current PGS explains <1% of the variance, and only PGSs from large GWASs are related to childlessness. Our findings also indicate that genetic and socio-demographic factors are not independent, with PGSs for AFB and NEB related to education and age at marriage. The explained variance by polygenic scores on childlessness is limited since it is largely a behavioral trait, with genetic explanations expected to increase somewhat in the future with better-powered GWASs. As genotyping of individuals in social science surveys becomes more prevalent, the method described in this study can be applied to other outcomes.
Introduction
Childlessness has increased in many Western countries, from 10% in the 1970s to currently 15% in the US (Frejka, 2017). Childlessness can have far reaching consequences, including changing the age composition of the population and lower well-being among the involuntary childless (Sleebos, 2003; Hansen et al., 2009).
Three parallel strands of research have examined reproductive behavior. Firstly, the social sciences examined socio-demographic factors such as educational attainment, occupational behavior, religiosity, marital status, and birth cohort (Balbo et al., 2013). Secondly, medical research has focused on fecundity, infertility or the biological ability to conceive such as sperm defects and ovulatory, cervical, fallopian tube and uterine problems (Blundell, 2007). Thirdly, a growing body of research focuses on the genetics of fertility outcomes, such as age at first birth (AFB), number of children born (NEB) and childlessness, with twin and family studies showing that genetics may explain up to 50% of the variation in AFB, NEB and childlessness (Mills and Tropf, 2015; Tropf et al., 2015; Verweij et al., 2017). Recent Genome-wide Association Study (GWAS) discoveries have isolated genetic markers for reproductive behavior such as the timing and number of children (Barban et al., 2016) and more biologically based infertility traits related to sperm defects or the timing of menopause (Painter et al., 2011; Day et al., 2015), allowing us for the first time to include an individual's genetic propensity as predictors in our statistical models.
Until now, these three strands of research have existed in isolation (Mills and Tropf, 2015), largely due to absence of data, training or realization of the importance of adopting a combined sociogenomic approach. The result is a lack of understanding of the relationship between biological, genetic and socio-demographic factors in association with childlessness. We also do not know whether estimates based solely on socio-demographic factors are biased due to their correlation with an individual's genetic propensity (Tropf and Mandemakers, 2017) or if genetic propensities interact with socio-demographic factors to be more influential in particular groups. Using known socio-demographic measures and results from recent GWAS discoveries, we apply a novel design in which polygenic scores (PGSs) are created for a variety of behavioral and infertility-related reproductive outcomes. Due to the novelty of our design, we use two independent datasets to replicate our results, namely the two US-based Health and Retirement Study (HRS, N = 10,686) and the Wisconsin Longitudinal Study (WLS, N = 8,284). Both include individuals born between 1920 and 1960, where childlessness rose from 6% among women born in 1935 to 16% around 1950 (Human Fertility Database, 2017) (see Figure SM1). We first introduce our conceptual model, followed by an explanation of the data and methods, main results and implications for future research related to childlessness and beyond.
Conceptual Model and Expectations
Figure 1 provides an overview of our conceptual model. Unfortunately, we are not able to distinguish between voluntary and involuntary childlessness, so all childless individuals are combined into one group. We first assess the relationship of (1) socio-demographic factors, (2) genetic factors related to biological reproductive traits (e.g., menarche, sperm defects), and (3) genetic factors related to reproductive behavior (timing, number of children) with childlessness. We acknowledge that this trichotomy is not entirely mutually exclusive, given that some of the socio-demographic factors have been shown to have at least a partial genetic basis (e.g., educational attainment, religiosity). Furthermore, pathways through which the PGSs relate to childlessness might operate via the socio-environment. However, we use this clustering since it reflects the divisions and representations in the literature.
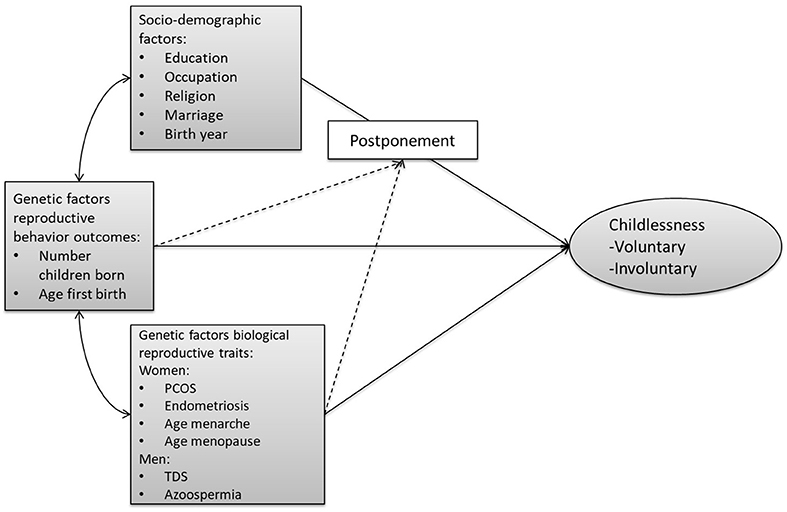
Figure 1. Conceptual model on the pathways from the three sets of factors leading to (both voluntary and involuntary) childlessness. The arrows from the three sets of factors (socio-demographic, genetic reproductive behavior, genetic biological reproductive traits) to childlessness represent the expected main effects. The dashed lines represent the expected interaction between PGSs and socio-demographic factors. The double-sided arrows represent the expected correlations and the single-headed arrows the flow of causality. PCOS, polycystic ovary syndrome; TDS, testicular dysgenesis syndrome.
The central socio-demographic factors that we study are education, work, religion, marriage, and birth year (Balbo et al., 2013). Previous studies showed that higher education and full-time work are associated with higher chances of childlessness among women, but not among men (Keizer et al., 2008; Balbo et al., 2013; Tropf and Mandemakers, 2017). More religious individuals are less likely to remain childless (Frejka and Westoff, 2008). Furthermore, in the US most childbearing happened within marriage and therefore men and women who got married younger are less likely to remain childless (Ventura and Bachrach, 2000). Birth year is also important, as childlessness is more prevalent among individuals born in 1960 (15%) than in 1940 (8%) (Human Fertility Database, 2019).
We include PGS for biological reproductive traits on which GWAS studies have been conducted. For women, ovulatory, cervical, fallopian tube, and uterine problems are most likely to cause infertility (Blundell, 2007) and therefore we include genetic scores for polycystic ovary syndrome (PCOS) (Hayes et al., 2015) (which mainly cause ovulatory problems), endometriosis (Painter et al., 2011) (which influences the ovaries and fallopian tubes), age at menarche (Day et al., 2017), and age at menopause (Day et al., 2015) (which determine women's reproductive life span). For men, sperm defects are the most likely cause for infertility, therefore we include PGSs for azoospermia (a condition in which the semen contains no sperm) and oligiozoospermia (low sperm count) (Aston and Carrell, 2009) and testicular dysgenesis syndrome (TDS) (Dalgaard et al., 2012).
We also include genetic scores for reproductive behavior, namely the age at first birth (AFB) and number of children ever born (NEB) (Barban et al., 2016). These genetic scores likely capture both social pathways leading to childlessness, such as desires for a certain family size and educational attainment, but also biological pathways, such as sperm defects or ovulatory functioning.
We further study the interaction between these socio-demographic and genetic factors. We hypothesize a birth cohort by genetic score interaction based on studies that demonstrate that there are differences in the relationship between genes and reproductive outcomes over time (Kohler et al., 2002; Briley et al., 2015; Tropf et al., 2015, 2017). We also hypothesize that genetic factors are more important for men and women who get married, and thus start attempts to have children, at higher ages, because the biological ability to conceive decreases with age, especially for women (Menken et al., 1986).
Finally, we assess genetic (G-G) and gene by socio-demographic (G-E) correlations and mediation. We expect a shared genetic basis reflected in correlations between the genetic scores for the biological reproductive traits and genetic scores for reproductive behavior (G-G correlation) (Barban et al., 2016), as well as between education and age at marriage with the genetic scores for age at first birth and number of children born(G-E correlation) (Briley et al., 2017). We examine if the effects of genetic scores for reproductive behavior are mediated by socio-demographic factors and genetic scores for the biological reproductive traits. Due to biological differences between men and women, we likewise examine sex differences (Verweij et al., 2017), and also explore differences by ethnic groups (Ware et al., 2017).
Methods and Materials
Data, Genotyping, and Samples
We use two broadly comparable datasets from the US, namely the Health and Retirement Survey and the Wisconsin Longitudinal Study.
Health and Retirement Survey (HRS)
The HRS is a nationally representative sample of men and women born between ~1920 and 1960 living in the US. This survey started in 1992 with a sample of men and women aged 51–61 and their partners, interviewed every 2 years. Extra cohorts have been added to create a representative sample of Americans over 50 years of age (Sonnega et al., 2014), resulting in over 27,000 respondents in 2010 (Health Retirement Study, 2017).
In 2006, the HRS started genotyping respondents, with data from 15,445 individuals currently available. In 2006, half of the entire living sample was asked to provide saliva samples for genotyping, of which 83% gave saliva, in 2008 the other half of the sample was asked of which 84% gave saliva and in 2010 half of the newly added HRS sample was asked of which 80% gave saliva (Weir, 2013; HRS, 2017). Genotyping of the 2006–2008 samples was done by the Illumina HumanOmni-2.5 Quad BeadChip, with coverage of ~2.5 million single nucleotide polymorphisms (SNPs). Genotyping of the 2010 sample was done with the Illumina HumanOmni2.5-8v1 BeadChip (HRS, 2017). This chip covers common, rare, and exonic SNP content from the 1,000 Genomes Project. Based on self-reported ethnicity we selected only the white non-Hispanic sample (N = 10,686), and we conducted separate analyses on the black non-Hispanic sample (N = 2,433) (we removed the Hispanic sample and people with other ethnicities).
Wisconsin Longitudinal Study (WLS)
The WLS is a random sample of one third of all men and women who graduated from Wisconsin high schools in 1957 (N = 10,317 graduates), and one of their siblings (N = 8,734 siblings). It is broadly representative of white, non-Hispanic Americans who at least finished high school (Herd et al., 2014). Respondents filled in questionnaires across six waves (1957, 1964, 1975, 1993, 2004, 2011).
Between 2007 and 2011, 9,012 of the WLS respondents were genotyped. From the total of 10,317 graduates in the sample 5,967 gave DNA and consent, 2,394 refused, 1,657 already deceased and 298 were not found (68.9% of the living samples gave DNA) (WLS, 2011). From the siblings, 3,440 gave DNA and consent, 1,415 refused, 1,514 already deceased, and 2,412 were not found (42.7% living respondents gave DNA). Genotyping was done using the Illumina HumanOmniExpress-24-v1-1 BeadChip that includes 713,014 SNPs (Herd, 2016). The SNPs on this chip were optimized to tag content from all three HapMap phases, which combine both rare as common genetic variation (Altshuler et al., 2010). We select only those individuals who provided information about their number of children after they finished their reproductive period (age 45 for women or 50 for men), resulting in 8,284 individuals.
In both samples, there were no individuals with missing call rates of over 2%. In the HRS we removed all genetically related individuals, for this we used the kinship coefficient table that is provided by HRS which is based on SNP similarity between individuals, removing individuals with similarity >0.125 (Weir, 2013). In the WLS we used multilevel models to deal with related individuals. The reason is that the inclusion of related individuals could result in an inflated significance of the SNP effects. We did not impute genetic data but only used raw genotyped information. Further information on quality control is provided in the quality control reports for both samples (Weir, 2013; Herd, 2016).
Measurements
Childlessness is measured from a direct question regarding the number of biological children after reaching the end of their reproductive period.
Birth year of respondent is the birthdate reported in the first non-missing wave and is standardized [(value-mean)/SD] for ease of comparison.
Years of education is the number of years of education and is calculated based of the highest degree (asked at least once after the age of 30) and is also standardized.
Occupational field is measured in the HRS by job asking respondents about their job previous to their current occupation distinguishing between “professionals,” “managers,” “clerks,” “sales,” “mechanics/production,” “services,” “operators,” “farming,” and “army.” In the WLS, it is measured by the first job they had after completing the highest level of schooling, distinguishing between “professional/technical,” “administrators/managers,” “sales,” “clerks,” “manufacturing/construction,” “service,” “farming,” and “no first job.” In both datasets clerks were used as reference groups.
Age at first marriage is measured in both datasets using information from the total number of marriages at each wave, using the answer at the last interview. It is dichotomized into never and ever married and for those who had been ever married, the age of their first marriage, categorized into “before 21,” “21–25,” “26–30,” “31–35,” “36–40,” and “older than 41” years. In this time period most childbearing occurred within marriage, from 98% (1940–1960), to 94% in 1970, 90% in 1980, and 80% in 1990 (Ventura and Bachrach, 2000).
Religion in the HRS respondents were asked their religious preference at each wave: “Protestant,” “Roman Catholic,” “Jewish,” “something else,” or “non-religious.” The answer from the first wave with non-missing information was used. In several waves of the WLS, respondents were asked about their current religious preference and could choose between 76 religions, which we collapsed into Roman Catholic, Protestant, other, and not religious. The answer from the first wave with non-missing information was used.
Ethnicity in the WLS we used self-reported ethnicity, removing non-white respondents. In the HRS, respondents were asked: “Do you consider yourself primarily: ‘White or Caucasian,’ ‘Black or African American,’ ‘American Indian,’ or ‘Asian’?” Respondents were also asked if they identified as Hispanic, and the Hispanic respondents were removed from the sample. Since the HRS oversampled black individuals, we were able to create a white and black sample.
GWASs Used to Create PGSs
We used single nucleotide polymorphisms (SNPs) and their summary statistics for NEB and AFB, which were obtained from a recent GWAS that used 251,151 European ancestry individuals for AFB and 343,072 individuals for NEB (Barban et al., 2016). For endometriosis a GWAS of 3,194 surgically confirmed endometriosis cases (of which 1,364 moderate-severe) and 7,060 controls from Australia and the United Kingdom was used (Painter et al., 2011). The PCOS GWAS consisted of 984 PCOS cases and 2,946 controls, all of European ancestry (Hayes et al., 2015). For age at menarche, defined by age at first menstrual period, we used the GWAS of 329,345 women from European ancestry (Day et al., 2017). For age at menopause, defined as the age at which a woman had her last menstrual period, data from the GWAS that included 69,360 women of European ancestry were used (Day et al., 2015). Azoospermia and oligozoospremia data stem from a GWAS of 80 controls, 52 oligozoospermia cases and 40 azoospermia cases, including white individuals primarily of northern European descent (Aston and Carrell, 2009). For TDS results were used of a GWAS, that included 488 cases and 439 controls from Denmark (Dalgaard et al., 2012). Of these cases 107 were infertile with sperm count below 15 million per milliliter (ml) in the semen and testis volume below 15 ml, 212 with testicular germ cell tumors (TGCC), 138 with cryptorchidism, and 31 with hypospadias.
Creation of PGS
To examine the impact of the genetic factors on childlessness we created separate PGSs, using GWAS summary statistics by calculating the sum of all risk alleles, weighted by their reported effect sizes. A PGS thus can be seen as the summary measure of the genetic propensity for a trait (Wray et al., 2007). PGSs were created with the PRSice tool (Euesden et al., 2015) in PLINK. We use linkage disequilibrium (LD) clumping, for which an r2 threshold of 0.1 and a distance threshold of 250 kb were used, indicating that if two SNPs have a squared correlation of 0.1 or greater, or a distance of 250 kb or smaller, only one of the two SNPs is included in the PGS. We included only genotyped SNPs, as opposed to also using imputed SNPs, because including imputed SNPs generally does not increase predictive power (Ware et al., 2017). Different PGSs were created depending on P-value cutoffs, from using only genome wide significant SNPs (P ≤ 5 × 10⁻⁸) to including all genotyped SNPs (P ≤ 1) (see Figures SM2–SM5). In our main analyses we included the PGSs that include all genotyped SNPs, since these scores generally had the highest explained variance in our samples. See Table SM6 for the number of SNPs included in each PGS. A requirement for using PGSs is that the GWAS sample is independent of the sample in which the PGS is applied (Wray et al., 2013). The HRS sample was included in the GWASs for NEB, AFB and age at menopause. For that reason for NEB and AFB we received GWAS summary statistics excluding the HRS sample from the authors of the GWAS. For age at menopause we used the MetaSubtract package in R (Nolte, 2017; Nolte et al., 2017) to subtract the HRS GWAS results from the Meta GWAS results on age at menopause.
Principal Components
We had to control for population stratification, which is the case if certain SNPs are more common in certain regional or ancestral populations, which would result in a false effect of the PGSs on the outcome if the outcome shows regional/ancestral variation (Price et al., 2006). We therefore include the first 20 principal components (PCs) from the genomic relationship matrix for all individuals using SNPs, which is generally sufficient to capture regional genetic variation.
For both the HRS and the WLS samples, the PCs are provided through dbGaP (Weir, 2013; Herd, 2016). The principal component analysis is performed after pruning based on LD, including only SNPs with missing call rate <2% (WLS) or <5% (HRS) and minor allele frequency >5%. A number of SNPs on certain regions [2q21 (LCT), HLA, 8p23, and 17q21.31 regions] are removed to avoid PCs to be largely influenced by small sets of SNPs. For HRS using the first seven PCs should be sufficient and for the WLS using the first six PCs should be sufficient (Weir, 2013; Herd, 2016). We use the conservative approach and include all 20 PCs in our analyses.
Statistical Analyses
We apply logistic regression models, adding variables over four steps: (model 1) PGSs for behavioral genetic reproductive outcomes (AFB, NEB) with the first 20 PCs; (model 2) PGSs for biological fecundity-related genetic outcomes (including PCs); (model 3) socio-demographic factors; and, (model 4) all variables. To compare the explanatory power of the genetic and socio-demographic factors, we compare odds ratios (with both PGS and continuous variables standardized) and use adjusted McFadden's pseudo R2 [which is calculated as 1-(log(Lc)-k/log(Lnull)) where Lc is the likelihood value of the complete model and Lnull is the likelihood of the null model without covariates and k is the number of coefficients]. Since siblings are included in the WLS, we run multilevel models on respondents nested within households to adjust for non-independence (Snijders and Bosker, 2012).
The interaction between the genetic propensities and postponement of childbearing were examined by including all PGSs by age at first marriage interactions. To test whether genetic influences on fertility became stronger in more recent birth cohorts, we included a PGS (AFB and NEB) by birth year interaction. To properly control for confounding in gene*socio-demographic interaction models, Keller (2014) argues that interactions between confounders and genes as well as confounders and socio-demographics should be included. For that reason, we include interactions with the first five PCs and with education, birth year and religion.
To assess whether the effect of AFB and NEB PGSs is mediated/confounded by education, marriage or reproduction-related biological traits on the effect of on childlessness, simply comparing coefficients across models with and without confounding factors is not feasible, because unobserved heterogeneity differs between logistic regression models (Mood, 2010). We therefore apply the Karlson-Holm-Breen (KHB) method to equalize the scale of the log-odds across models (Karlson et al., 2012). With these models we can assess the percentage of confounding due to the PGSs and socio-demographic factors, after we control for the first 20 genetic PCs. We furthermore examine correlations between the AFB and NEB PGSs and education and marriage using Pearson correlation coefficients, as well as the association between AFB and NEB PGSs with the biological traits PGSs (while controlling for the first 20 principal components). In addition, we assess the LD-score genetic correlations between the reproductive behavior and the biological traits PGSs to assess the extent to which genes are shared between the traits (Bulik-sullivan et al., 2015). This method only requires summary statistics of GWAS results to estimate the genetic correlation between different traits and is not biased by sample overlap. We performed the LD-score correlation analyses in LD Hub (Zheng et al., 2017).
To estimate sex differences, we used the HRS and WLS samples on both men and women, for which we apply multilevel models (siblings in the WLS and partners in the HRS sample) including interactions with sex. To examine differences by ethnic groups, we run separate analysis on the black HRS sample, as well as analyses that includes both the black and the white sample, in which we include interactions with ethnicity. In our analyses we use self-reported ethnicity. We examined the overlap between self-reported ethnicity and values on the PCs. A small part of the individuals indicated to be white but differed from other white respondents on their PC values. As a robustness check we removed these individuals from the sample, either based on visual inspection or Mahalanobis distance, and results remained largely comparable.
Results
Descriptives
Descriptive statistics of the samples can be found in Table SM1. In the HRS 10.8% of women and 12.5% of men remained childless, whereas for the WLS this was 6.6% and 6.3% (these estimates are in line with the levels of childlessness in the US in these periods, see Figure SM1). In the HRS, around half of the respondents completed high school or less and around 20% of women finished college or above compared to 29% of men. In the WLS, around 58% of women finished high school only compared to 49% of men. Finishing college or more was 25 and 35% for women and men, respectively. Only a very small percentage in both samples never got married (between 3 and 4%). WLS respondents on average had younger ages at marriage than the HRS respondents.
PGSs for Reproductive Behavior and Not Biological Traits Relate to Childlessness
A main finding is that the PGSs for reproductive behavior (AFB and NEB) are to a small extent related to childlessness, while for the PGSs related to biological traits (PCOS, Endometriosis, Menarche and Menopause for women and TDS, Azoospermia, TGCC, Infertility, Cryptorchidism, and Hypospadias for men) we did not find an association with childlessness. PGSs favoring higher NEB were associated with smaller chances of remaining childless among both sexes, but only significantly in the HRS (Figure 2 and model 1 of Tables SM2–SM5). PGSs for later AFB were associated with higher chances of childlessness, especially among women (Figure 2 and model 1 of Tables SM2–SM5). The correlation between the AFB and NEB PGSs is relatively high, −0.17, −0.18, −0.29, and −0.24 in the female HRS, male HRS, female WLS, and male WLS samples, respectively (see Table 1). In Figures SM2–SM5 it is shown that when included in the model separately AFB is significant in all four samples and NEB in both male and female samples of the HRS. However, if we include all socio-demographic variables in our models, the effect sizes of the genetic scores decrease or become insignificant (see model 4 in Tables SM2–SM5, we elaborate on this further in the section on gene-socio-demographic correlations).
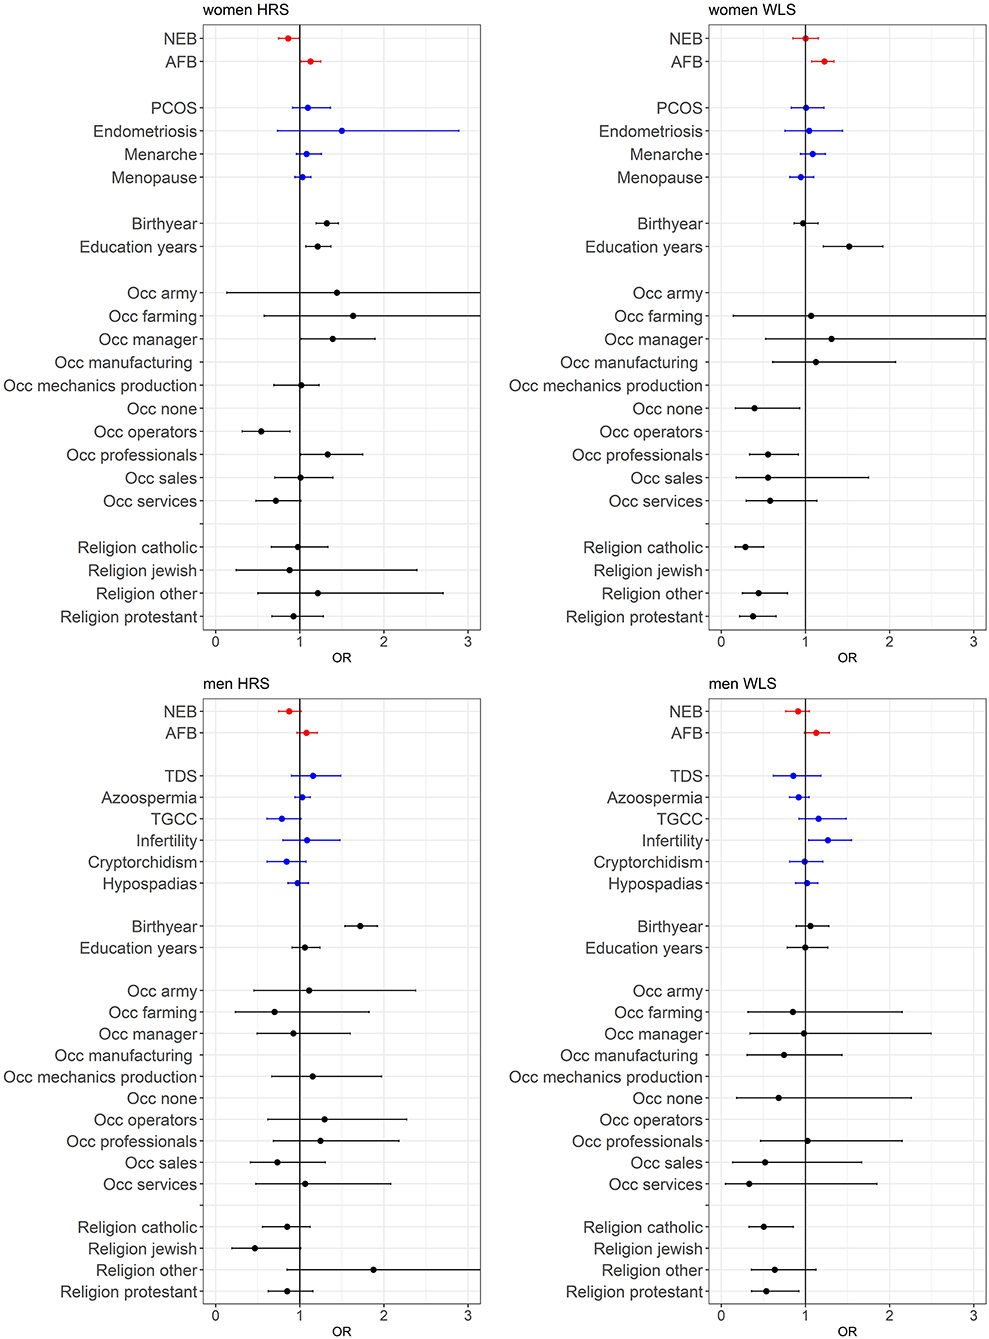
Figure 2. Effects of polygenic risk scores and socio-demographic factors on remaining childless, OR with 95% confidence intervals presented. The effect of marriage is displayed separately in Figure 3, since these effects are very large. See Tables SM2–SM5 for the complete regression tables. Estimates are based on three separate models; model 1 with PGSs for AFB and NEB and 20 PC's (red estimates), model 2 with PGS for biological reproductive traits and 20 PC's (blue estimates), and model 3 with socio-demographics (black estimates).
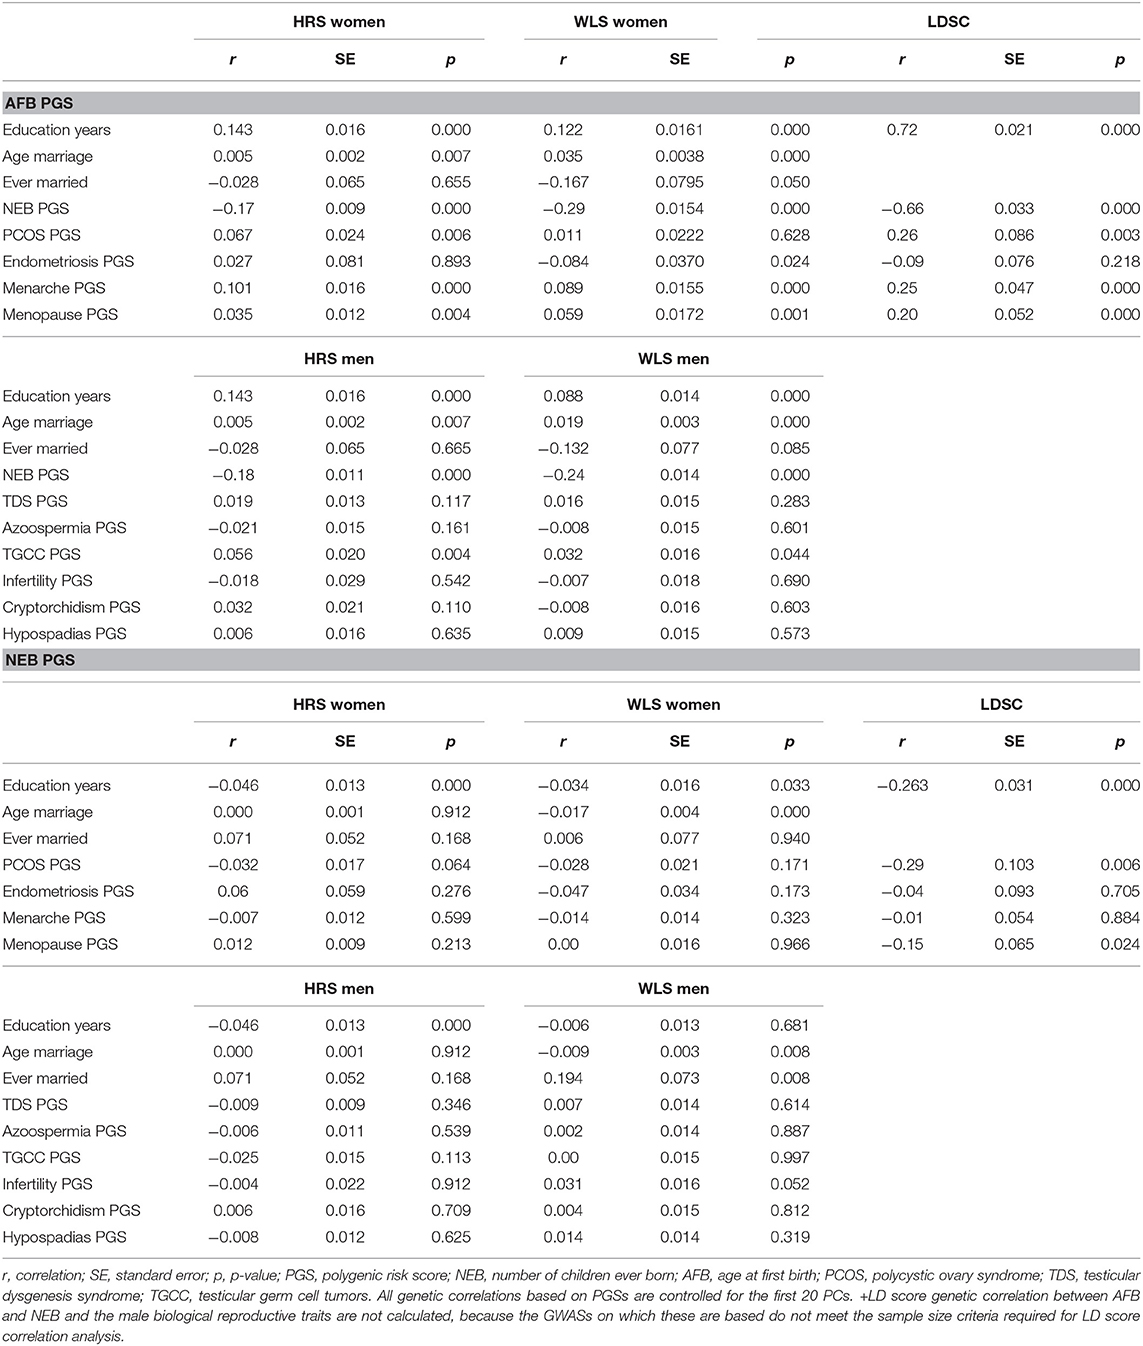
Table 1. Correlations between genetic and socio-demographic factors, and genetic correlations, based on PGSs in the HRS and WLS samples and based on LD-score regressions (LDSC).
For the PGSs related to biological fecundity we find only small and mixed findings (Figure 2 and model 2 of Tables SM2–SM5). For men, PGSs related to infertility due to low sperm count are related to lower levels of male childlessness, which we find only in the WLS sample. We do not find any associations between the PGSs related to biological fecundity traits that replicate across samples. This smaller and insignificant associations with the biological fecundity PGSs is likely attributed to the lower-powered GWASs they are based on (see Table SM6). The relationship between the PGSs and childlessness using different p-value cutoffs are graphically displayed in Figures SM2–SM5, showing that in most cases the p-value cutoff of 1 resulted in the highest odds ratios and smallest confidence intervals.
Effect of Socio-Demographic Factors as Expected
Individuals from more recent birth cohorts, those who married older or did not marry and were not religious (in the WLS) were more likely to remain childless (see Figures 2, 3 and model 3 of Tables SM2–SM5). Among women, those higher educated remained childless more often in contrast to lower childlessness for those who never worked (i.e., no reported first occupation) or were employed in the service sector. Education and occupation did not influence childlessness in men.
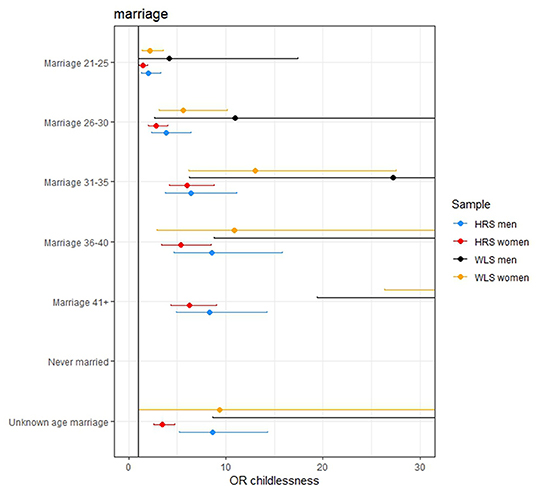
Figure 3. The effect of age at marriage on remaining childless. The effect of never being married is excluded from the figures since these effects are very large (OR 120.268, 471.383, 229.776, and 1,896 in the women HRS, women WLS, men HRS, and men WLS, respectively). The effects of the later ages at marriage are not completely displayed in some of the figures because these effects are large.
Variance Explained by PGSs
The effect sizes for the PGSs were modest: an increase of 1 SD in the AFB PGS increased the odds of remaining childless with 1.127, 1.226, 1.087, and 1.127 in the female HRS, female WLS, male HRS, and male WLS, respectively. However, in the models in which the socio-demographic factors were included these effects reduced to 1.026, 1.147, 1.105, and 0.977. This is relatively small compared to some socio-demographic factors, such as education, where a 1 SD increase in years of education resulted in an increase in the odds of remaining childless of 1.24, 1.53 in the female HRS and WLS samples, respectively. For those who married after age 36, the odds of remaining childless are 4.6, 10.8, 8.8, and 44.8 times higher than those who wed before the age 21, in the four samples, respectively. Examining the adjusted McFadden R2, the goodness of fit in the models with only genetic factors is markedly lower and even negative (<0.001) than models with socio-demographic factors (between 0.19 and 0.46).
PGS for AFB Especially Relevant Among Women Who Married at Higher Ages
We find suggestive evidence that PGSs for AFB are especially related to childlessness among women who married at higher ages (gene*socio-demographic interaction) (Figure 4, Tables SM10, SM11). Genes related to AFB do not seem to relate to childlessness among women who married before 30, but have a positive association for those who married after 30. We are only able to detect these relationships in the HRS data, where more respondents marry at later ages, although the interaction between AFB and age at marriage has a similar direction in the WLS sample (Figure SM6). We expected that the PGSs for AFB and NEB would show a stronger association with childlessness during the second demographic transition, but we did not find these interaction effects (Table SM10).
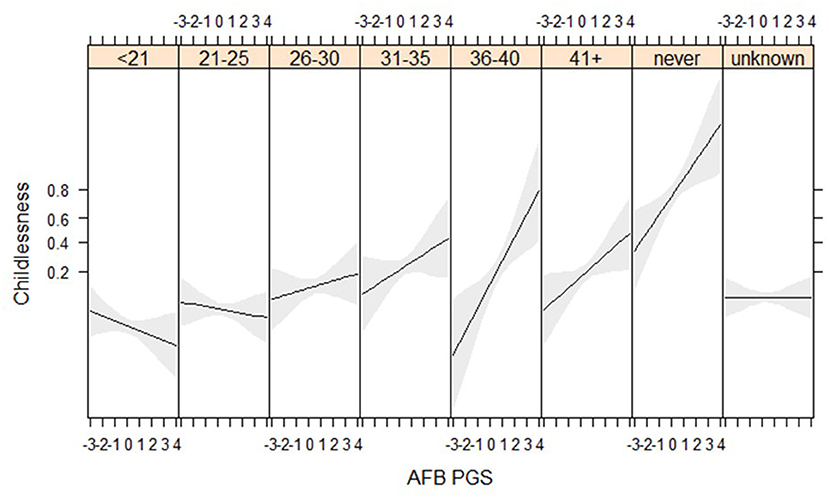
Figure 4. Age at first birth PGSs especially relevant among later married women in the HRS sample (results from the model in Table SM10).
Gene-Socio-Demographic Correlations in the Expected Direction and Mixed Results for the Genetic Correlations
The PGSs related to reproductive behavior (higher AFB, lower NEB) are related to higher education and a higher age at first marriage or never marrying (Table 1), which is in line with our expectations. We find this in both the HRS and the WLS sample and among men and women. The LD score correlation between education and AFB and NEB is even higher. In females, we also see a positive correlation between the AFB PGS with PCOS PGS but an unexpected negative correlation between the AFB PGS with endometriosis PGS (Table 1). PGSs for higher age at menarche and higher age of menopause are related to higher AFB PGS (Table 1). The results from the correlation between the genetic scores are comparable to the results based on LD-score regression (Table 1); almost all of the correlations are in the same direction, although the LD-score regression estimates are higher in most cases. For men, the results are almost all insignificant, it only seems to be the case that genes positively related to testicular germ cell cancer correlate positively to genes related to a higher age at first birth. We cannot calculate LD-score correlations for men due to small sample size and low number of SNPs.
Mediation of AFB and NEB PGSs Effects by Education and Marriage
To further assess the interplay between the PGSs for reproductive behavior (AFB, NEB), those for the biological traits, and the socio-demographic factors, we applied a KHB mediation analysis. Results indicate that the effect sizes of the AFB and NEB PGSs decrease 25–170% by including education and age at marriage in the model (Table 2). On the other hand, the effect sizes do not substantially decrease when including the PGSs for the biological traits.
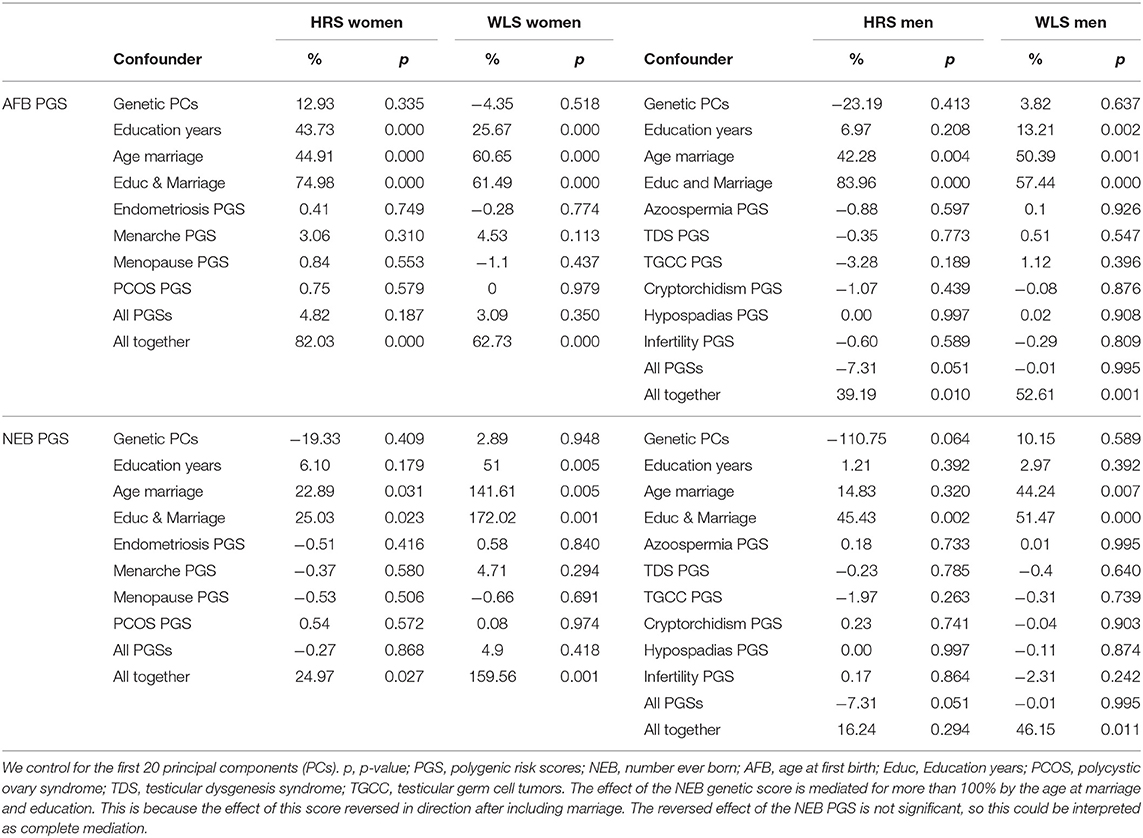
Table 2. Results from the Karlson-Breen-Holm mediation analysis, percentage confounding presented.
Sex Differences in Genetic and Socio-Demographic Influences
We found some support that particular PGSs differently associate to childlessness in men and women, although variation was small. The PGSs associated with later ages at menarche negatively relate to childlessness in men but positively relate to childlessness in women (WLS, see Table SM7). The PGS for a later age at menopause does not relate to childlessness in men but positively relates to childlessness probabilities in women. In the HRS we find no differences in the relationship of the PGSs and therefore the findings from the WLS should be interpreted with caution. For socio-demographic factors, education only influenced women but not men, in line with findings from previous studies. Never being married has an even stronger effect on childlessness in men than in women.
Weaker Effects in the Black HRS Sample
We performed the same analyses in the sample of black respondents from the HRS. None of the PGSs have a significant association with childlessness in this sample, although the directions of the associations seem to be similar to those in the white sample (see Tables SM8, SM9). These differences are not likely due to sample size differences, since when we run the same analyses in a random selection of the same sample size in the white sample, the effects are similar to those described above in the full sample (results available upon request). However, we did not find a significant interaction between race and the AFB and NEB PGSs and the pseudo R2 did not largely differ between the white and black samples. The effect of marriage and birth year are significantly weaker in the black male sample compared to the white male sample.
Conclusion and Discussion
Main Findings
In this paper we apply an innovative and explorative approach to studying childlessness, in which we include PGS from a large range of fertility related outcomes in combination with sociodemographic factors. We find that socio-demographic factors explain 19–46% in childlessness while the current PGS explain <1% of the variance, and only PGSs from large GWASs are related to childlessness. Our findings also indicate that genetic and socio-demographic factors are not independent, with PGSs for AFB and NEB related to education and age at marriage. Socio-demographic factors will always be more important for these behavioral traits. The predictive power of the PGSs will remain lower, but as sample sizes for GWAS increase, we know that the number of loci discovered and predictive power of these scores will increase (Mills and Rahal, 2019).
Replications
An important strength of this study is the use of two independent samples (HRS, WLS) for replication. Several findings replicated, such as the effects of the socio-demographic factors (education, age at marriage), the association of the PGS for AFB and NEB with childlessness and how effects are partly mediated by education and age at marriage. Other findings, however, did not replicate for substantive reasons related to the sample properties. Genes related to AFB were only important for women who married (and thus presumably tried to conceive) at older ages in the HRS, a finding that did not replicate in the WLS. This is likely related to the fact that only 3% (n = 140) of women married over the age of 31 in the WLS, making it underpowered to detect any effects, whereas this group was 12% (n = 826) in the HRS. Given the postponement of unions and childbearing in more recent cohorts, further tests are required.
Even though we perform a large number of test, we use a standard significance threshold of 0.05 for significance testing. We contend that our hypothesis driven tests, in combination with the replication in the two samples in both men and women applies sufficient caution against false positives. The replication of estimating the association of the PGSs with childlessness using different p-value cutoffs (as displayed in Figures SM2–SM5) serves as an additional robustness check. Findings that are not robust are expected to differ in direction and strength by using different p-value cutoffs. Here we find that AFB and NEB PGSs show associations in similar directions across p-value cutoff criteria while this is not the case for all PGSs for biological traits.
Ancestral and Sex Differences
We found smaller and non-significant effects for the PGSs on the black individuals in the HRS, which shows that it is not advisable to apply the PGSs used in this study to non-European ancestry groups. This is due to fact around 90% of the GWASs are derived from European-ancestry populations (Mills and Rahal, 2019), including those used here. Due to patterns of human dispersal out of Africa, population structure and stratification, PGSs derived from one ancestry group cannot be applied to another. The greater genetic variation among black individuals calls for a specific ancestry group GWAS (Tishkoff et al., 2009). PGSs applied outside of non-European ancestry samples are incorrect and not reliable (Martin et al., 2017). These ancestral differences are not to be confused with self-reported race or ethnicity, which are socially constructed and not biological categories.
Regarding sex differences, we confirmed that education has a weaker influence on childlessness in men, while being married is more important for men. There is some evidence that genes related to certain biological traits (age at menarche and menopause, male infertility) have opposite effects in men and in women (in WLS only), in line with findings of genetic sexual dimorphism of childlessness (Verweij et al., 2017).
Interpretations
The suggestive finding that genetic scores related to a higher age at first birth are more important for remaining childless among women who got married at higher ages needs replication and opens questions for further research. This AFB genetic score could be indicative of biologically having more difficulties in conceiving, in which case the interpretation would be that those who genetically are more likely to experience fecundity problems, and who postpone childbearing, are most likely to remain childless. On the other hand, the genetic score related to a higher age at first birth could also be indicative of having lower fertility desires, as previous studies found that fertility desires are partly heritable (Kohler et al., 1999; Miller et al., 2010) and that people who desire fewer children attempt to have children at higher ages (Miller et al., 2010). In this case it could be that those who have lower fertility desires and get married at higher ages are most likely to remain childless.
Our study showed that both higher education and age at marriage are correlated with higher PGS for AFB and lower PGS for NEB, indicating that the PGSs capture genes related to personal characteristics linked to childlessness (i.e., higher education, later partnering). It might also be that pleiotropic genetic effects that influence both childlessness and other outcomes (education, age at marriage) are at play or that genes causally related to educational attainment are correlated with AFB and NEB PGSs due to the large phenotypic relation between AFB, NEB and education. These findings add to the general idea that SNPs found in a GWAS might be associated with the trait of interest indirectly through other outcomes. The same holds for example for SNPs found for education, as effects within families are much smaller, indicating that part of the effect of genes related to education are confounded by family effects (Lee et al., 2018). The fact that we found that genetic and socio-demographic factors do not independently influence childlessness, underscores the importance of simultaneously examining their influences and adopting a sociogenomic approach.
Looking at genetic correlations, in line with an earlier study (Barban et al., 2016), we found an overlap in genes related to reproductive behavior (AFB, NEB) and biological infertility traits (endometriosis, PCOS). The positive genetic correlation between age at menarche, menopause and AFB was somewhat unexpected, but could be interpreted as one set of genes that delay biological maturation and development, resulting in an overall biological shift to fertility in later life (Mostafavi et al., 2017). The finding that a higher genetic risk for endometriosis goes along with a lower genetic propensity for a later age at first birth is unexpected, and since we find this only in our WLS sample this needs replication.
Explanations for Small Effects of the PGSs
It is important to note that genetic factors for reproductive behavior explained <1% of the variation in childlessness, whereas twin studies suggested heritability to be between 20 and 50% (Verweij et al., 2017). The discrepancy between heritability and association-based studies has been related to the phenomena of missing (Manolio et al., 2009) and hidden heritability (Witte et al., 2014) which might be due to, for example, heterogeneity across the discovery samples (Tropf et al., 2017), the excluding of rare genetic variants or overestimation in twin studies (Yang et al., 2015). It may furthermore be methodological, since we add additional uncertainty by examining a phenotype (childlessness) different from the one in the GWAS discovery (AFB, NEB, endometriosis etcetera). That we only include genotyped SNPs and not imputed SNPs might be another reason, although previous research showed that this should not lead to a reduction in explained variance (Ware et al., 2017).
Another reason for the low explained variance is the sample sizes of GWASs, because as sample sizes are increasing, explained variance by PGSs is also increasing (Nolte et al., 2017), and therefore using a similar approach as used in this study will in the future likely entail stronger results. This is illustrated by for example research on educational attainment, where in 2013 a GWAS was conducted among 101,069 individuals, in which three significant SNPs were found (Rietveld et al., 2013). In 2016, 74 genome wide SNPs were identified when the sample size was expanded to 293,723 individuals (Okbay et al., 2016). In 2018, with a sample size of over a million individuals (N = 1,131,881) 1,271 SNPs were discovered in relation to educational attainment (Lee et al., 2018). The increase in the number of significant SNPs that are associated with an outcome also increase the explained variance by genetic scores, with 2.5–4% explained variance from the genetic scores from the 2013 GWAS, 6–7% explained variance from the 2016 GWAS and 11–13% from the most recent GWAS for educational attainment. Also for fertility related traits larger GWASs are or will be available, such as for endometriosis (Sapkota et al., 2017) and in the near future for AFB and NEB.
Although there have been considerable gains in prediction, we also note that the predictive power of polygenic scores does not increase in a linear manner as sample sizes grow. It may be that after a certain plateau is reached, such as SNP-heritability representing the actual ceiling of the genetic predisposition of a trait that can be achieved by GWAS, further increases in sample sizes may not yield better prediction. Polygenic scores may also be influenced by confounding factors such as environmental interactions or parental confounding (Kong et al., 2018). Instead of increasing sample size, it could be more useful to explore the biological function of the SNPs and genetic architecture in more depth.
The GWA studies for biological fecundity traits used the current study were based on very small samples. This could explain why we have many insignificant results for the PGSs for biological fecundity traits. The GWASs on which the results are based are relatively small, and arguably underpowered to detect any significant SNP effects (Rietveld et al., 2015). That we found no observed association of the age at menarche scores is unlikely to be due to power issues, given that the menarche PGS is based on a large sample GWAS. This could be related to the fact that menarche does not have a straightforward (phenotypic) association with fertility (Guldbrandsen et al., 2014). Unfortunately, the HRS and WLS did not include information about the actual biological fecundity traits on which we created PGSs (such as information on age at menarche, sperm count or PCOS). This would have been a valuable contribution to this study and including these traits will be an interesting venue for future research. At the same time, this is one of the promising features of sufficiently powered PGSs in the foreseeable future: even in the absence of measured phenotypes, PGSs can be used as genetic proxies in prediction models.
Another reason for the small effects of the PGSs is that our study does not distinguish between voluntary and involuntary childlessness, resulting in a heterogeneous phenotype. Would we be able to distinguish between different types of childlessness, it would be likely that PGSs for biological fecundity traits have a stronger effect on involuntary childlessness than on voluntary childlessness.
Explanation of Null-Finding for the Interactions
We did not find that PGSs for reproductive behavior have a stronger association with childlessness in more recent cohorts, going against theoretical expectations that individual freedom and thus genetic propensity for individual preferences would be more important in more recent cohorts (Kohler et al., 2002; Briley et al., 2015; Tropf et al., 2015). Since GWA studies are conducted in large samples from a range of birth cohorts and contexts (Conley, 2017; Tropf et al., 2017), genetic studies conducted in different countries and birth cohorts only isolate a small portion of the genetic variants related to the trait, which are the ones that are, regardless of the environment, robustly associated with the trait (Tropf et al., 2017). Thus, we might not be detecting interactions between genes and socio-demographics, because the genes identified in the GWASs which form the basis of the genetic scores are rather independent of the environment.
Summary
To summarize, our results show that genetic and socio-demographic factors are related to childlessness, and that these influences are not independent. We show that the explained variance by PGS at this point is limited. However, the large GWA studies on a growing number of traits leads us to anticipate that a sociogenomic approach could inform future research and will provide useful insights.
Data Availability Statement
The Database of Genotypes and Phenotypes (dbGaP) data that support the findings of this study are publicly available from the WLS (dbGaP phs001157.v1.p1) and the HRS (dbGaP phs000428.v1.p1).
Author Contributions
RV, MM, GS, GG, and HS worked on conception and design of the study, did the analyses and interpretation of analyses. RV wrote the first draft and together with MM, GS, IN, NB, FT, GG, and HS worked on revisions of this draft. DC, KA, KZ, NR, MD, CS, MH, and AD helped in the acquisition of the data and revision of the draft.
Funding
The research leading to these results received funding from the NWO awarded to the faculty of Behavioral and Social Sciences at the University of Groningen (awarded to RV/MM). GS was supported by an NWO VENI Grant (451-15-034). MM received funding ERC, Consolidator Grant SOCIOGENOME (615603), UK ESRC/NCRM SOCGEN grant (ES/N011856/1), MM and KZ from the Wellcome Trust Institutional Strategic Support Fund and John Fell Fund.
Conflict of Interest
The authors declare that the research was conducted in the absence of any commercial or financial relationships that could be construed as a potential conflict of interest.
The reviewer DB declared a past co-authorship with several of the authors GS, NB, and HS to the handling editor.
Acknowledgments
We acknowledge the contributions by Antonie Knigge and Kirsten van Houdt on the structure of the paper. We thank members of the Family, Life course and Aging group (University of Groningen), unit of Genetic Epidemiology and Bioinformatincs (University Medical Center Groningen), Sociogenome group (Oxford) and the Social Genetics club (University of North Carolina at Chapel Hill) for their input during different stages.
Supplementary Material
The Supplementary Material for this article can be found online at: https://www.frontiersin.org/articles/10.3389/fsoc.2019.00074/full#supplementary-material
References
Altshuler, D. M., Gibbs, R. A, Peltonen, L., Altshuler, D. M., Gibbs, R. A., Peltonen, L., et al. (2010). Integrating common and rare genetic variation in diverse human populations. Nature 467, 52–58. doi: 10.1038/nature09298
Aston, K. I., and Carrell, D. T. (2009). Genome-wide study of single-nucleotide polymorphisms associated with azoospermia and severe oligozoospermia. J. Androl. 30, 711–725. doi: 10.2164/jandrol.109.007971
Balbo, N., Billari, F. C., and Mills, M. C. (2013). Fertility in advanced societies: a review of research. Eur. J. Popul. 29, 1–38. doi: 10.1007/s10680-012-9277-y
Barban, N., Jansen, R., de Vlaming, R., Vaez, A., Mandemakers, J. J., Tropf, F. C., et al. (2016). Genome-wide analysis identifies 12 loci influencing human reproductive behavior. Nat. Genet. 17, 1–5. doi: 10.1038/ng.3698
Briley, D. A., Harden, K. P., and Tucker-Drob, E. M. (2015). Genotype x cohort interaction on completed fertility and age at first birth. Behav. Genet. 45, 71–83. doi: 10.1007/s10519-014-9693-3
Briley, D. A., Tropf, F. C., and Mills, M. C. (2017). What explains the heritability of completed fertility? Evidence from two large twin studies. Behav. Genet. 47, 36–51. doi: 10.1007/s10519-016-9805-3
Bulik-sullivan, B., Finucane, H. K., Anttila, V., Day, F. R., ReproGen Consortium Psychiatric Genomics Consortium, et al. (2015). An Atlas of genetic correlations across human diseases and traits. Nat. Genet. 47, 1236–1241. doi: 10.1038/ng.3406
Conley, D. (2017). The challenges of GxE: commentary on “Genetic Endowments, parental resources and adult health: evidence from the Young Finns Study.” Soc. Sci. Med. 188, 201–203. doi: 10.1016/j.socscimed.2017.06.040
Dalgaard, M. D., Weinhold, N., Edsgard, D., Silver, J. D., Pers, T. H., Nielsen, J. E., et al. (2012). A genome-wide association study of men with symptoms of testicular dysgenesis syndrome and its network biology interpretation. J. Med. Genet. 49, 58–65. doi: 10.1136/jmedgenet-2011-100174
Day, F. R., Ruth, K. S., Thompson, D. J., Lunetta, K. L., Pervjakova, N., Chasman, D. I., et al. (2015). Large-scale genomic analyses link reproductive aging to hypothalamic signaling, breast cancer susceptibility and BRCA1-mediated DNA repair. Nat. Genet. 47, 1294–1303. doi: 10.1038/ng.3412
Day, F. R., Thompson, D. J., Helgason, H., Chasman, D. I., Finucane, H., Sulem, P., et al. (2017). Genomic analyses identify hundreds of variants associated with age at menarche and support a role for puberty timing in cancer risk. Nat. Genet. 10, 834–841. doi: 10.1038/ng.3841
Euesden, J., O'Reilly, P. F., Lewis, C. M., and Reilly, P. F. O. (2015). PRSice: polygenic risk score software. Bioinformatics. 31, 1466–1468. doi: 10.1093/bioinformatics/btu848
Frejka, T. (2017). “Childlessness in the United States,” in Childlessness in Europe: Context, Causes and Consequences, eds M. Kreyenfeld and D. Konietzka (Cham: Springer), 159–179. doi: 10.1007/978-3-319-44667-7_8
Frejka, T., and Westoff, C. F. (2008). Religion, religiousness and fertility in the US and in Europe. Eur. J. Popul. 24, 5–31. doi: 10.1007/s10680-007-9121-y
Guldbrandsen, K., Håkonsen, L. B., Ernst, A., Toft, G., Lyngsø, J., Olsen, J., et al. (2014). Age of menarche and time to pregnancy. Hum. Reprod. 29, 2058–2064. doi: 10.1093/humrep/deu153
Hansen, T., Slagsvold, B., and Moum, T. (2009). Childlessness and psychological well-being in midlife and old age: an examination of parental status effects across a range of outcomes. Soc. Indic. Res. 94, 343–362. doi: 10.1007/s11205-008-9426-1
Hayes, M. G., Urbanek, M., Ehrmann, D. A., Armstrong, L. L., Lee, J. Y., Sisk, R., et al. (2015). Genome-wide association of polycystic ovary syndrome implicates alterations in gonadotropin secretion in European ancestry populations. Nat. Commun. 6:7502. doi: 10.1038/ncomms8502
Health Retirement Study (2017). Sample Sizes and Response Rates. Available online at: https://hrs.isr.umich.edu/sites/default/files/biblio/ResponseRates_2017.pdf (accessed 08 January, 2018).
Herd, P. (2016). Quality Control Report for Genotypic Data. Retrieved from: https://www.ssc.wisc.edu/wlsresearch/documentation/GWAS/Herd_QC_report.pdf
Herd, P., Carr, D., and Roan, C. (2014). Cohort profile: wisconsin longitudinal study (WLS). Int. J. Epidemiol. 43, 34–41. doi: 10.1093/ije/dys194
HRS (2017). Genetic Data Products. Available online at: https://hrs.isr.umich.edu/data-products/genetic-data/products (accessed 24 January, 2019).
Human Fertility Database (2017). Cohort childlessness at age 44. Human Fertility Database. Max Planck Institute for Demographic Research (Germany); Vienna Institute of Demography (Austria). Available online at: https://www.humanfertility.org (accessed 26 November, 2014).
Human Fertility Database (2019). Cohort Childlessness. Available online at: https://www.humanfertility.org (accessed 26 June, 2019).
Karlson, K. B., Holm, A., and Breen, R. (2012). Comparing regression coefficients between same-sample nested models using logit and probit: a new method. Sociol. Methodol. 42, 286–313. doi: 10.1177/0081175012444861
Keizer, R., Dykstra, P. A., and Jansen, M. D. (2008). Pathways into childlessness: evidence of genedered life course dynamics. J. Biosoc. Sci. 40, 863–878. doi: 10.1017/S0021932007002660
Keller, M. C. (2014). Gene × environment interaction studies have not properly controlled for potential confounders: the problem and the (simple) solution. Biol. Psychiatry 75, 18–24. doi: 10.1016/j.biopsych.2013.09.006
Kohler, H.-P., Rodgers, J. L., and Christensen, K. (1999). Is fertility behavior in our genes? Findings from a Danish twin study. Popul. Dev. Rev. 25, 253–288. doi: 10.1111/j.1728-4457.1999.00253.x
Kohler, H.-P., Rodgers, J. L., and Christensen, K. (2002). Between nurture and nature: the shifting determinants of female fertility in Danish twin cohorts. Biodemography Soc. Biol. 49, 218–248. doi: 10.1080/19485565.2002.9989060
Kong, A., Thorleifsson, G., Frigge, M. L., Vilhjalmsson, B. J., Young, A. I., Thorgeirsson, T. E., et al. (2018). The nature of nurture: effects of parental genotypes. Science 359, 424–428. doi: 10.1126/science.aan6877
Lee, J. J., Wedow, R., and Okbay, A. (2018). Gene discovery and polygenic prediction from a genome-wide association study of educational attainment in 1.1 million individuals. Nat. Genet. 50, 1112–1121. doi: 10.1038/s41588-018-0147-3
Manolio, T. A., Collins, F. S., Cox, N. J., Goldstein, D. B., Hindorff, L. A., Hunter, D. J., et al. (2009). Finding the missing heritability of complex diseases. Nature 461, 747–53. doi: 10.1038/nature08494
Martin, A. R., Gignoux, C. R., Walters, R. K., Wojcik, G. L., Neale, B. M., Gravel, S., et al. (2017). Human demographic history impacts genetic risk prediction across diverse populations. Am. J. Hum. Genet. 100, 635–649. doi: 10.1016/j.ajhg.2017.03.004
Menken, J., Trussell, J., and Larsen, U. (1986). Age and infertility. Science 233, 1389–1394. doi: 10.1126/science.3755843
Miller, W. B., Bard, D. E., Pasta, D. J., and Rodgers, J. L. (2010). Biodemographic modeling of the links between fertility motivation and fertility outcomes in the NLSY79. Demography 47, 393–414. doi: 10.1353/dem.0.0107
Mills, M. C., and Rahal, C. (2019). A scientometric review of genome-wide association studies. Commun. Biol. 2:9. doi: 10.1038/s42003-018-0261-x
Mills, M. C., and Tropf, F. C. (2015). The biodemography of fertility: a review and future research frontiers. Kolner Z. Soz. Sozpsychol. 67, 397–424. doi: 10.1007/s11577-015-0319-4
Mood, C. (2010). Logistic regression: why we cannot do what we think we can do, and what we can do about it. Eur. Sociol. Rev. 26, 67–82. doi: 10.1093/esr/jcp006
Mostafavi, H., Berisa, T., Przeworski, M., and Pickrell, J. K. (2017). Identifying genetic variants that affect viability in large cohorts. PLoS Biol. 15:e2002458. doi: 10.1101/085969
Nolte, I. M. (2017). MetaSubtract: Subtracting Summary Statistics of One or more Cohorts from Meta-GWAS Results. R Package Version 1.50. https://CRAN.R-project.org/package=MetaSubtract
Nolte, I. M., van der Most, P. J., Alizadeh, B. Z., de Bakker, P. I., Boezen, H. M., Bruinenberg, M., et al. (2017). Missing heritability: is the gap closing? An analysis of 32 complex traits in the Lifelines Cohort Study. Eur. J. Hum. Genet. 25, 877–885. doi: 10.1038/ejhg.2017.50
Okbay, A., Beauchamp, J. P., Fontana, M. A., Lee, J. J., Pers, T. H., Rietveld, C. A., et al. (2016). Genome-wide association study identifies 74 loci associated with educational attainment. Nature 533, 539–542. doi: 10.1038/nature17671
Painter, J. N., Anderson, C. A., Nyholt, D. R., Macgregor, S., Lin, J., Lee, S. H., et al. (2011). Genome-wide association study identifies a locus at 7p15.2 associated with endometriosis. Nat. Genet. 43, 51–4. doi: 10.1038/ng.731
Price, A. L., Patterson, N. J., Plenge, R. M., Weinblatt, M. E., Shadick, N., and aReich, D. (2006). Principal components analysis corrects for stratification in genome-wide association studies. Nat. Genet. 38, 904–909. doi: 10.1038/ng1847
Rietveld, C. A., Esko, T., Davies, G., Pers, T. H., Turley, P., Benyamin, B., et al. (2015). Supporting Information: common genetic variants associated with cognitive performance identified using the proxy-phenotype method. Proc. Natl. Acad. Sci. U.S.A. 112, E380–E380. doi: 10.1073/pnas.1424631112
Rietveld, C. A., Medland, S. E., Derringer, J., Yang, J., Esko, T., Martin, N. W. N. G., et al. (2013). GWAS of 126,559 individuals identifies genetic variants associated with educational attainment. Science 340, 1467–1471. doi: 10.1126/science.1235488
Sapkota, Y., Steinthorsdottir, V., Morris, A. P., Fassbender, A., Rahmioglu, N., De Vivo, I., et al. (2017). Meta-analysis identifies five novel loci associated with endometriosis highlighting key genes involved in hormone metabolism. Nat. Commun. 8:15539. doi: 10.1038/ncomms15539
Sleebos, J. (2003). “Low fertility rates in OECD countries: facts and policy responses,” in OECD Labour Market and Social Policy Occasional Papers, No. 15 (OECD Publishing). doi: 10.1787/568477207883
Snijders, T. A. B., and Bosker, R. J. (2012). Multilevel Analysis: An Introduction to Basic and Advanced Multilevel Modeling, 2nd Edn. London: Sage publications.
Sonnega, A., Faul, J. D., Ofstedal, M. B., Langa, K. M., Phillips, J. W. R., and Weir, D. R. (2014). Cohort profile: The Health and Retirement Study (HRS). Int. J. Epidemiol., 43, 576–585. doi: 10.1093/ije/dyu067
Tishkoff, S. A., Reed, F. A., Friedlaender, F. R., Ehret, C., Ranciaro, A., Froment, A., et al. (2009). The genetic structure and history of Africans and African Americans. Science 324, 1035–1044. doi: 10.1126/science.1172257
Tropf, F. C., Barban, N., Mills, M. C., Snieder, H., and Mandemakers, J. J. (2015). Genetic influence on age at first birth of female twins born in the UK, 1919–68. Popul. Stud. 69, 1–17. doi: 10.1080/00324728.2015.1056823
Tropf, F. C., Lee, S. H. H., Verweij, R. M., Stulp, G., van der Most, P. J. P. J., de Vlaming, R., et al. (2017). Hidden heritability due to heterogeneity across seven populations. Nat. Hum. Behav. 1, 757–765. doi: 10.1038/s41562-017-0195-1
Tropf, F. C., and Mandemakers, J. J. (2017). Is the association between education and fertility postponement causal? The role of family background factors. Demography 54, 71–91. doi: 10.1007/s13524-016-0531-5
Ventura, S. J., and Bachrach, C. A. (2000). Nonmarital childbearing in the US. Natl. Vital Stat. Rep. 48, 1–46.
Verweij, R. M., Mills, M. C., Tropf, F. C., Veenstra, R., Nyman, A., and Snieder, H. (2017). Sexual dimorphism in the genetic influence on human childlessness. Eur. J. Hum. Genet. 25, 1067–1074. doi: 10.1038/ejhg.2017.105
Ware, E. B., Schmitz, L. L., Faul, J., Gard, A., Mitchell, C., Smith, J. A., et al. (2017). Heterogeneity in polygenic scores for common human traits. bioRxiv 1–13. doi: 10.1101/106062
Weir, D. R. (2013). Quality Control Report for Genotypic Data. Retrieved from: http://hrsonline.isr.umich.edu/sitedocs/genetics/HRS2_qc_report_SEPT2013.pdf?_ga=2.95552988.1141673914.1573651236-656503389.1573651236
Witte, J. S., Visscher, P. M., and Wray, N. R. (2014). The contribution of genetic variants to disease depends on the ruler. Nat. Rev. Genet. 15, 765–776. doi: 10.1038/nrg3786
WLS (2011). WLSOverall Retention Rates. Available online at: https://www.ssc.wisc.edu/wlsresearch/documentation/retention/cor1004_retention.pdf (accessed 08 January, 2018).
Wray, N. R., Goddard, M. E., and Visscher, P. M. (2007). Prediction of individual genetic risk to disease from genome-wide association studies. Genome Res. 17, 1520–1528. doi: 10.1101/gr.6665407
Wray, N. R., Yang, J., Hayes, B. J., Price, A. L., Goddard, M. E., and Visscher, P. M. (2013). Pitfalls of predicting complex traits from SNPs. Nature Reviews Genetics, 14, 507–515. doi: 10.1038/nrg3457
Yang, J., Bakshi, A., Zhu, Z., Hemani, G., Vinkhuyzen, A. A. E., Lee, S. H., et al. (2015). Genetic variance estimation with imputed variants finds negligible missing heritability for human height and body mass index. Nat. Genet., 47, 1114–1120. doi: 10.1038/ng.3390
Zheng, J., Erzurumluoglu, A. M., Elsworth, B. L., Kemp, J. P., Howe, L., Haycock, P. C., et al. (2017). LD Hub: A centralized database and web interface to perform LD score regression that maximizes the potential of summary level GWAS data for SNP heritability and genetic correlation analysis. Bioinformatics, 33, 272–279. doi: 10.1093/bioinformatics/btw613
Keywords: fertility, childlessness, polygenic risk scores, sociogenomics, infertility
Citation: Verweij RM, Mills MC, Stulp G, Nolte IM, Barban N, Tropf FC, Carrell DT, Aston KI, Zondervan KT, Rahmioglu N, Dalgaard M, Skaarup C, Hayes MG, Dunaif A, Guo G and Snieder H (2019) Using Polygenic Scores in Social Science Research: Unraveling Childlessness. Front. Sociol. 4:74. doi: 10.3389/fsoc.2019.00074
Received: 28 February 2019; Accepted: 07 November 2019;
Published: 22 November 2019.
Edited by:
Michelle Luciano, University of Edinburgh, United KingdomReviewed by:
Daniel Briley, University of Illinois at Urbana-Champaign, United StatesBrooke M. Huibregtse, University of Colorado Boulder, United States
Copyright © 2019 Verweij, Mills, Stulp, Nolte, Barban, Tropf, Carrell, Aston, Zondervan, Rahmioglu, Dalgaard, Skaarup, Hayes, Dunaif, Guo and Snieder. This is an open-access article distributed under the terms of the Creative Commons Attribution License (CC BY). The use, distribution or reproduction in other forums is permitted, provided the original author(s) and the copyright owner(s) are credited and that the original publication in this journal is cited, in accordance with accepted academic practice. No use, distribution or reproduction is permitted which does not comply with these terms.
*Correspondence: Renske M. Verweij, dmVyd2VpakBlc3NiLmV1ci5ubA==