 Julián E. Mejía-Restrepo
 Paulina Lira
 Hagai Netzer2
 Benny Trakhtenbrot
- 1Departamento de Astronomía, Universidad de Chile, Santiago, Chile
- 2School of Physics and Astronomy, Tel Aviv University, Tel Aviv, Israel
- 3Department of Physics, Institute for Astronomy, ETH Zurich, Zurich, Switzerland
- 4Department of Physics, McGill University, Montreal, QC, Canada
Accurately determining the masses of supermassive black holes is crucial to understand their evolution and the establishment of their relationship with their host galaxy properties. Beyond the local universe, the single epoch mass estimation method provides a simple procedure to estimate black hole masses in large spectroscopic samples of type-1 active galactic nuclei. The method assumes virialized motion of gas in the close vicinity to the active black holes, traced through broad emission lines. However, because of the assumption of a universal virial factor, this procedure has uncertainties associated with the unknown distribution of the gas clouds. Here, using a sample of 39 quasars observed with the VLT/X-shooter spectrograph, we compare alternative estimations of black hole masses determined from the properties of the accretion disk emission around the black hole with the single epoch virial mass estimations. We find that the virial factor is inversely proportional to the observed width of the broad emission lines. This result implies that current virial masses can be miss-estimated by up to a factor of 6. Our analysis indicates that either the effect of line-of-sight inclination in a planar distribution of the broad line emitting gas or the radiation pressure perturbations to the distribution of gas can reproduce our findings.
1. Introduction
Active supermassive black holes (SMBHs) are powered by accretion flows, probably in the form of accretion disks (ADs) that convert gravitational energy into radiation (Shakura and Sunyaev, 1973). Gas in the Broad Line Region (BLR), located in the vicinity of the SMBH and moving at Keplerian velocities of thousands of kilometers per second, is photo-ionized by the AD producing broad emission lines. Under virial equilibrium, their observed full width at half maximum (FWHMobs) can be used as a proxy for the virial velocity (VBLR) to estimate MBH (e.g., Shen, 2013):
here, G is the gravitational constant, RBLR is the mean BLR distance to the SMBH and f is the virial factor that accounts for the differences between the unknown VBLR and FWHMobs due to the unknown geometrical gas distribution. Since even in the closest active galaxies the BLR cannot be resolved with current capabilities, RBLR is derived from reverberation mapping (RM) experiments that show a strong correlation between this distance and the continuum luminosity known as the RBLR − L relation (Kaspi et al., 2000; Bentz et al., 2013). f is assumed to be constant for all systems and is usually determined by requiring RM-based masses (from Equation 1) to agree, on average, with masses estimated from the relation between MBH and the stellar velocity dispersion found in local galaxies (Onken et al., 2004; Graham, 2015; Woo et al., 2015). This indirect technique to determine MBH is known as the single epoch (SE) virial method () and is commonly used for large samples of growing SMBHs (Trakhtenbrot and Netzer, 2012; Shen, 2013).
Unfortunately, the virial method is subject to biases and uncertainties associated with our ignorance of the dependence of f on additional physical properties. These could include radiation pressure perturbations (Marconi et al., 2008; Netzer and Marziani, 2010), non virial velocity components (Denney et al., 2009, 2010), the relative thickness (H/RBLR, where H is the BLR thickness) of the Keplerian BLR orbital plane (Gaskell, 2009), and the line-of-sight (LOS) inclination angle (i) of this plane (Wills and Browne, 1986; Runnoe et al., 2014; Shen and Ho, 2014). An analytical expression for f in the case of a planar BLR of thickness H/RBLR is given by:
Decarli et al. (2008) where sin2 i accounts for the line-of-sight projection of the Keplerian velocity of the BLR orbital plane. The nature of the velocity component responsible for the thickness of the BLR is unclear. However, ideas such as non-coplanar orbits, accretion disk pressure, induced turbulence and outflowing disk winds have been suggested in the literature as plausible mechanisms to puff up the BLR (Collin et al., 2006; Czerny et al., 2016). Given all these, the assumption of an universal f introduces an uncertainty in the single epoch method which is estimated to be at least a factor of 2–3.
In Capellupo et al. (2015, 2016, hereafter papers I and III) we introduced an alternative method to estimate MBH () based on a Bayesian spectral energy distribution (SED) fitting of the accretion disk. We modeled the accretion disk using the standard Shakura and Sunyaev (1973) geometrically thin optically thick model with general relativistic and disc atmosphere corrections (Slone and Netzer, 2012). Each model is defined by its black hole mass (), accretion ratio (Ṁ), black hole spin (a*) and the intrinsic reddening in the host galaxy (AV). Using this model we successfully reproduced the SED emission in 37 out of 39 objects of our X-Shooter sample described below.
The purpose of this work is to compare (from paper III) and (FWHM, Lλ) estimations (from Mejía-Restrepo et al., 2016, hereafter paper II) of the X-Shooter sample in terms of the observational properties of the BLR and the SMBH properties. This analysis will allow us to determine possible biases in (FWHM, Lλ) estimations and look for possible corrections in terms of the BLR properties. The full presentation of this study was recently published in Nature Astronomy (Mejía-Restrepo et al., 2017, MR17) and here we only provide a brief summary of the sample, the different black hole mass determinations, and our main results. The interested reader is encouraged to refer to MR17 for any additional detail.
This document is structured as follows, in section 2 we introduce the X-Shooter sample. In section 3 we describe in detail both the SE and SED fitting methods to estimate MBH. In section 4 we quantify the virial factor from the comparison of both black hole mass approaches and discuss the most relevant results. Finally, in section 5 we present our main conclusions.
2. Sample Description
The main sample that we use in this paper consist of 39 type-I AGN selected to be within a narrow redshift range around z ≃ 1.55. For this sample we obtained high signal to noise (S/N) single epoch spectroscopic observations using the VLT/X-Shooter spectrograph as described in papers I, II and III. At the selected narrow redshift range, the X-Shooter spectrograph covers the range of ~1,200Å to ~9,200Å in the rest-frame. The sample was selected to homogeneously map the parameter space of MBH and L/LEdd. The initial values of these quantities were obtained from the SE calibrations of Trakhtenbrot and Netzer (2012) using their fitting technique of the Mg II broad emission line and its adjacent continuum.
3. Estimating MBH
In papers I, II, and III we describe two alternative procedures to estimate MBH, one based on the standard SE MBH determination (paper II) and the other on the SED fitting of the accretion disc spectrum (papers I and III). In this section we briefly describe both approaches and comment on the sources of uncertainties of each method.
3.1. Single Epoch MBH Estimates
In paper II we present new calibrations of the SE black hole mass estimators using the broad Hα, Hβ, MgII and CIV emission lines. The underlying assumptions is that Eqn. 1 holds for all broad emission lines and VBLR can be estimated from the FWHM of the line in question (FWHM (line)). In this case:
(e.g., Shen, 2013) where fFWHM is the virial factor associated with the line FWHM and RBLR is obtained from various RM studies (see e.g., Kaspi et al., 2000, 2005; Bentz et al., 2009, 2013, and references therein) and can be written as:
here Lλ stands for λL(λ) at various wavelengths: 6,200Å for the Hα line, 5,100Å for the Hβ line, 3,000Å for the Mg II λ2798 line and 1,450Å for the C IV λ1549line.
It is important to note that MBH estimates derived from high ionization lines such as C IV have a bias due the presence of an associated outflow blue shifted component. For objects with high Eddington ratios, the blue shifted component in C IV predominates over the component from the virialized region Sulentic, 2017.
3.2. Black Hole Mass Estimates from SED Fitting
In papers I and III we implemented an alternative method to estimate the black hole mass in type1-AGN based on fitting the SED of the accretion disk. We used the geometrically thin, optically thick accretion disc model from Slone and Netzer (2012) which are based on Shakura and Sunyaev (1973). Using this model we obtained successful fits in 37 out 39 objects in our sample. The model is fully determined by , a*, Ṁ, the inclination (iLOS) with respect to the line-of-sight (LOS) and AV. The procedure consisted of a Bayesian minimization over a grid of models covering a range in values for these parameters following the procedure described in paper III. Particularly, we assumed Gaussian priors centered around the observational estimations of (Hα, L6200) and Ṁ. (Hα, L6200) and Ṁ are calculated assuming a virial factor fFWHM = 1. We also assume scatters in both quantities of 0.3 and 0.2 dex respectively. The minimization process uses 6 continuum windows and the posterior probability of the models is unaffected by the broad emission lines. The role of the priors is to penalize models which deviate significantly from the observational estimation of MBH(Hα) and ṀSE. In spite of this, the code can freely move in the parameter space either side of MBH(Hα) and ṀSE.
A major goal of the present paper is to set limits on MBH under the assumption that thin accretion disks provide an accurate explanation for the observed continuum in AGNs. We therefore try to test the reliability of the results of our Bayesian procedures using different central values for our priors as well as different scatters around them (σMBH). In practice, this is done by considering a large range of virial factors (fFWHM = {0.25, 0.4, 1, 2.5, 4}) to compute (Hα, L6200) and ṀSE and a range of σMBH for each. Each combination of fFWHM and σMBH is used to find the best fit SED and calculate a range of posteriors exactly as done in papers I and III. We find that when the scatter around the central values is small (<0.4 dex), the posterior probability distributions of and Ṁ depends on the chosen value of fFWHM. However, when the scatter is large (>0.8 dex), we find that the posterior probability distributions of and Ṁ are insensitive to the assumed fFWHM and they all tend to converge to the posterior probability distributions of and Ṁ when fFWHM ~ 1 and the scatter is ~0.3 dex. This would indicate that fFWHM ~ 1 is a close representation of the median virial factor of the AGN population within the MBH range that our sample is covering (7.5 ≲ MBH ≲ 10).
A major drawback of the above approach is the assumption that the simplified accretion disks SEDs used here, that neglect the effect of disk-winds, complex transfer in the disk atmosphere and other simplifications, provide an accurate description of the geometry and physics close to the central BH. In this approach, there is a degeneracy between the accretion rate and the inclination angle of the disk. For a given flux, larger inclinations will return larger intrinsic luminosities which in turn will return larger accretion rates. Fortunately, the derived black hole mass does not strongly depend on either inclination or accretion rate. As a consequence, the derived inclination does not bias the estimation of the black hole mass as it does in the virial SE method. From all the test described here, we can conclude AD mass estimations are reliable and of comparable accuracy to SE masses.
4. Results and Discussion
MBH determinations from the SE and the AD methods are compared in the left panel of Figure 1. The approaches yield masses in very good agreement with each other, albeit with significant scatter of a factor of about 2. We looked for possible drivers for this scatter and found a strong gradient in FWHMobs across the relation, as can be seen by the color gradient of the data points in Figure 1.
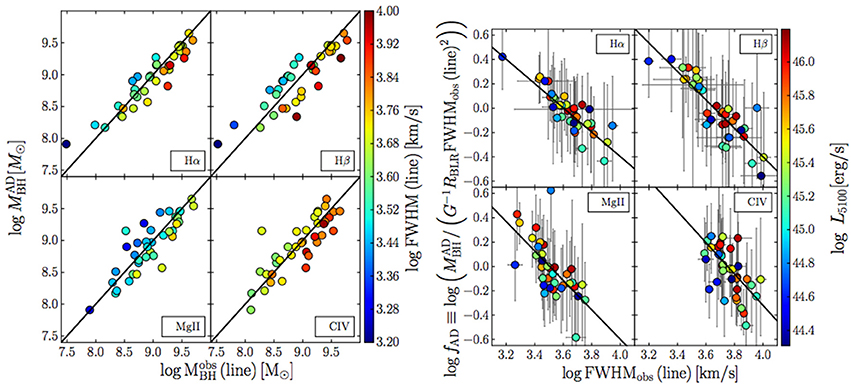
Figure 1. Comparison of black hole mass estimations from the single epoch virial method and the accretion disk modeling Left: log vs. log (FWHM, Lλ). The color of the points in each panel represent the FWHMs of the labeled emission lines in each panel as indicated in the color bar. The black solid line represents the 1:1 relation. Right: log fAD(lines) vs. log FWHM(line). The color of the points in each panel represents the monochromatic luminosity L5100 as indicated in the color bar. The black solid line represents the best linear fit the observed relations.
The ratio between and allows us to determine a proxy for the virial factor f which we define as . In the right panel of Figure 1 we show fAD(line) as a function of the FWHMobs for the Hα, Hβ, Mg II and C IV broad emission lines. Strong anti-correlations between fAD and FWHMobs are present for all lines. As can be seen in Table 1, these correlations are found to be significantly stronger than the expected correlations between fAD and . We can thus conclude that the FWHMobs of the broad lines drives the discrepancies between and .
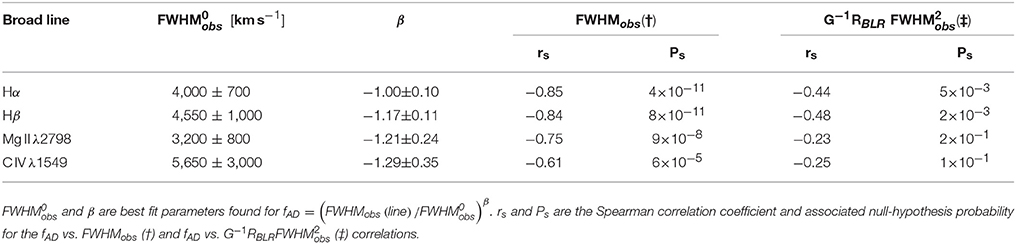
Table 1. The virial factor as a function of FWHMobs for the broad emission lines.
We also determined how depends on the FWHMobs of the lines and the associated Lλ used in single epoch mass determinations methods. To this end, we used the following expression:
and implemented an ordinary bi-variate least square linear regression to determine the coefficients in the equation. We summarize the results in the Table S1, where we also show αline, which represents the slope of the power-law coefficient of Lλ in Equation (4). We also list the scatter between and (FWHM, Lλ) as well as the scatter between and the corrected (FWHM, Lλ) ((corr) ≡ (FWHM, Lλ)) after the dependency of fAD on FWHMobs is taken into account. In the case of the Balmer lines, the scatter is reduced by about a factor 2. Thus, correcting for the correlation between log fAD and the FWHMobs of the Balmer lines provides an important improvement in our MBH estimations.
The results of the linear regressions presented in Table S1 highlight two important findings. First, αAD and αline are basically indistinguishable from each other. This indicates that Lλ has no impact on the scatter between and and that fAD can be expressed as a single function of the FWHMobs of the broad emission lines. In Table 1 we show the explicit expressions relating fAD in terms of FWHMobs for the Hα, Hβ, Mg II and the C IV lines. It can be observed that our measurements are consistent within uncertainties with fAD ∝ FWHMobs−1 for all lines.
4.1. Inclination as the Source of the f−FWHMobs Correlation
In this section we present different tests that we carried out to determine whether inclination is driving the correlation between f and FWHMobs.
Hereafter when referring to log fAD, (FWHM, Lλ) and FWHMobs we are meaning log fAD(Hα), (FWHMobs(Hα)) and the observed value of FWHMobs(Hα), unless otherwise specified. The reason to select the Hα line instead of the Hβ line for the following analysis is the better S/N and hence more accurate measurements of FWHMobs(Hα) in our sample. As shown in earlier works, FWHMobs in both Balmer lines are the same within uncertainties (Greene and Ho, 2005; Mejía-Restrepo et al., 2016).
The anti-correlation between log fAD and FWHMobs could be explained by the inclination of the axis of symmetry of a planar BLR with respect to the LOS. If we consider the median LOS inclination, imedian, at which Type-1 AGN are typically observed, we can also define a median virial factor fmedian at which the SE MBH calibration represents an accurate black hole mass for objects observed at imedian. Objects with narrower than usual broad emission lines are more likely observed at i < imedian (face-on orientations) and objects with broader than usual emission are more likely observed at i > imedian (edge-on orientations). This will produce too large (too small) SE mass estimates for objects with very broad (very narrow) emission lines, and would translate into a virial factor that anti-correlates with the line FWHMs.
For a planar BLR with a thickness ratio H/R and inclination i with respect to the line-of-sight we will have . Thus, for an ensemble of randomly orientated BLRs the final distribution of FWHMobs will depend on (1) the intrinsic FWHMint distribution and (2) the range of possible random orientations at which the BLR can be observed, both of which are, a priori, not known.
To check the inclination hypothesis we first need to determine the distribution of FWHMint that is consistent with the probability density distribution (PDF) of the observed FWHMobs. We then need to test whether it is possible to recover the anti-correlation of f with FWHMobs. In other words, we need to test whether a population of randomly generated inclinations and FWHMint that satisfy the PDF of FWHMobs, can also account for the bidimensional distribution of the parameter space given by f and FWHMobs.
We first assumed a thin BLR by taking H/R = 0. We computed the PDF as the product of two independent random variables (Glen et al., 2004) and applied it to the special case where FWHMobs = FWHMint × sin (i) (Lopez and Jenkins, 2012). For the FWHMint distribution, we assumed an underlying truncated normal distribution with certain mean (FWHMmean) and dispersion (FWHMstd). Our normal distribution was truncated to allow FWHMint to vary between 1,000 and 30,000 km s−1. We also assumed that our sample is limited to objects with line-of-sight inclination angles between imin = 0° and imax = 70°, with imax determined by the torus opening angle. For an optimal exploration of the parameter space we ran a Monte Carlo Markov Chain simulation using the python code EMCEE (Foreman-Mackey et al., 2013). For the simulation we used 20 independent walkers and 5,000 iterations that mapped a total of 105 models.
In the Figure S1 we compare the observed cumulative PDF (FWHMobs) and its uncertainty (magenta thin line and shadowed region, respectively) with the predicted cumulative PDF from the model with the highest posterior probability (orange line). The parameters of this model are: imin = 19°, imax = 45°, FWHMmean = 8,500, FWHMstd = 2,150, FWHMmin = 4,200 and FWHMmax = 30,000. Our model successfully reproduces the observed cumulative PDF. However, a simple normal distribution (turquoise line) is also consistent with the data and cannot be rejected. We also determined the best fit model for a distribution with FWHMstd = 0, i.e., effectively a single velocity. This model (dashed blue-line) is able to reproduce the distribution at low values of FWHMobs, but it is unable to account for the distribution at large velocity widths.
First, we tested whether our thin BLR model is successful in reproducing the f−FWHMobs distribution seen in the data. In the right panel of Figure 1 we show the predicted bi-dimensional probability density distribution of the virial factor and the observed FWHMobs(Hα) as predicted by the thin BLR model. The Figure includes contours showing 25, 50, 75, and 99% confidence limits contours (black-thin lines) centred around the maximum probability point. We also superposed the data from the right panel of Figure 2 (open-blue circles). The magenta line represents the derived relation f = FWHMobs (Hα)/4,000 km s−1. The thick yellow line is the median of the f−FWHMobs distributions derived using a quantile non-parametric spline regression (COBS, Ng and Maechler, 2007). Analogously, the blue-dashed lines represent the 25, 50, and 75% quantiles of the observational distribution. To obtained these quantiles, for each observed data we randomly generated 1,000 points following the error distributions in fAD and FWHMobs(Hα) and then applied the COBS method to characterize the resulting distribution. We can notice that the median (50%-quantile) of the theoretical and observational distributions are in very good agreement. The scattered open-blue circles also show excellent agreement with the the bi-dimensional probability density function from the best model. Explicitly, we find that from our 37 objects, 21% fall inside the central 25% confidence level region, 51% fall inside the 50% confidence level region, 74% fall inside the 75% confidence level region, and 85% fall inside the 99% confidence level region.
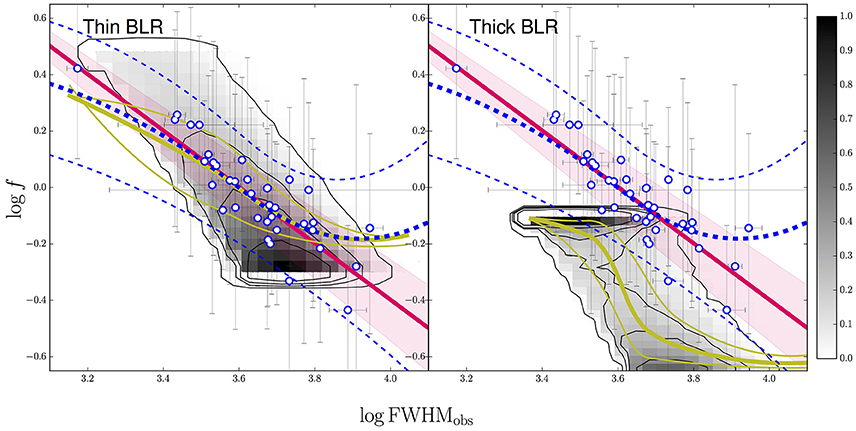
Figure 2. Virial factor–FWHMobs bi–dimensional distributions for a thin and thick BLR. Predicted bi-dimensional probability distribution functions of the virial factor and FWHMobs for a thin BLR (left) and a thick BLR (right), as predicted by the best-fit models, are shown in gray. The darkest regions represent the most probable combinations of these quantities as quantified in the color-bar. The thin black lines are the 25, 50, and 75% and 99% confidence limit contours centered around the maximum probability point. The thick yellow lines are the median of the f−FWHMobs distributions derived from a quantile non-parametric spline regression (COBS). The open-blue circles are data from the right panel of Figure 1 for the Hα line. The magenta lines are the derived relation f = (FWHMobs(Hα)/4,000 km s−1) and the shadowed regions the associated uncertainties. The thin blue-dashed lines are the 25, 50, and 75% quantiles of the observational distribution after accounting for the measurement errors in fAD and FWHMobs(Hα). We see that for the thin BLR the 50%-quantile (median) of the theoretical and observational distributions are in very good agreement with each other. Additionally, the distribution of the data points shows good agreement with the predicted bi-dimensional distribution confidence limits. Explicitly, we find that 21% of the points fall inside the central 25% confidence level region, 51% fall inside the 50% confidence level region, 78% fall inside the 75% confidence level region, and 87% fall inside the 99% confidence region level. On the other hand, the thick BLR model cannot reproduce the bi-dimensional f−FWHMobs distribution.
In order to test the effects introduced by a thick BLR (0 < H/R < 1), we assumed a single H/R for all objects and followed the same steps outlined for the case of a thin BLR. We found that a wide range in BLR thickness ratios (H/R < 0.5) is able to reproduce the cumulative FWHMobs PDF. However, objects with large thickness ratios clearly fail to reproduce the bi-dimensional distributions of f−FWHMobs as can be seen in the right panel of Figure 2. We generally find that only relatively thin BLRs, i.e., those with H/R < 0.1, are able to reproduce both the bi-dimensional distributions and the cumulative FWHMobs(Hα) PDF. In particular, for a BLR with H/R → 0, we find that the derived fAD values constrain the range of inclinations at which the BLR is observed in our sample to 15° ≲ i ≲ 50°. This upper limit is consistent with typical expectations of a central torus hiding the BLR. We also find that the median virial factor in our sample, f = 0.95, corresponds to a median orientation of imedian = 31°.
In summary, our results show that a population of randomly orientated, thin BLRs can successfully reproduce our observations. We can thus conclude that inclination is very likely the main reason for the observed f−FWHMobs correlations.
4.2. Radiation Pressure Effects
We finally considered the possibility that radiation pressure perturbations to the BLR motions might cause the observed fAD−FWHMobs dependency. A recent model considers the effects of radiation pressure in a BLR composed of pressure confined clouds, hence allowing the gas density of individual clouds to decrease with distance to the central black hole (Netzer and Marziani, 2010). In this model the system is still bound by gravity and FWHMobs becomes smaller with increasing λEdd. The reason for this trend is that as λEdd increases, the clouds spend more time at large distances from the black hole, therefore increasing the median RBLR and decreasing the median BLR Keplerian velocities. To account for this effect, the authors of this model proposed a modified expression for RBLR:
where a1 and a2 are constants. The first term accounts for the observational relation described in Equation (4) and the second term represents a radiation pressure perturbation quantified by Lλ/MBH ∝ λEdd. When replaced into the virial mass equation (Equation 1) this relation leads to a simple quadratic equation on MBH with solution:
or equivalently:
where MBHrad and frad are the black hole mass and virial factor for a radiation pressure dominated BLR. , , and f0 is a normalization constant. In the case when this would result in a close agreement with the inverse proportionality between fAD and FWHMobs found in our data. Given that αline is found to be ~0.6 for all lines (see Table S1), this would translate into an explicit dependency of f on Lλ. We would then expect that the scatter in the fAD−FWHMobs relation should be driven by Lλ. In the right panel of Figure 1 larger (smaller) values of L5100 are represented by redder (bluer) colors. We can see that there is no clear suggestion that the scatter in driven by L5100 in any of the lines. Note however that the relatively narrow range in L5100 covered by our sample (from L5100 = 2.0 × 1044 to L5100 = 1.6 × 1046 ergs/s, corresponding to a factor of 80), together with the uncertainties in our estimations of f, do not allow us to rule out this mechanism.
Testing this model further, we found the combination of parameters a1, a2, and f0 that best reproduce our measurements and the observed relation between f and FWHMobs for the Hα line. To obtain dimensionless values for a1 and a2 we expressed MBH, Lλ and FWHM in units of 108 M⊙, 1044erg s−1 and 1,000 km s−1, respectively. Taking αline = 0.63, as suggested by the observations (see Table S1), we carried out a Monte-Carlo Markov Chain exploration of the parameter space of the model and found that a1 = 0.88, a2 = 0.36 and fo = 0.51 are able to reproduce our measurements with a scatter of 0.12 dex, preserving the experimental dependence of RBLR on Lλ as expressed in Equation 4 with a scatter of 0.05 dex. At the same time the results are able to reproduce the observed f−FWHMobs relation with a scatter of 0.11 dex [see Figure 3, which presents our observations (black squares with error bars) together with the prescribed values for f as given by Equation 8 (colored circles without error bars)]. However, we also found that the residuals between the predicted values and the best fit to the correlation are heavily correlated with L5100 (rs > 0.63, Ps < 2 × 10⁻⁵), as can be seen by the color gradient of our simulated points in the direction perpendicular to the correlation best fit in Figure 3. This bias is introduced by the explicit dependence of frad on Lλ which is not observed in our sample, although notice that the error bars of our derived f values are of the order of, if not larger, than the expected dependence (see Figure 3). Finally, the dependency on L5100 vanishes when αline = 0.5. For this case, however, we were unable to reproduce any the observables. Extending our sample towards lower luminosities will allow us to determine a possible dependence of frad on Lλ. This should yield the final test to be able to confidently conclude whether this model can be the driving mechanism for the observed f−FWHMobs correlation.
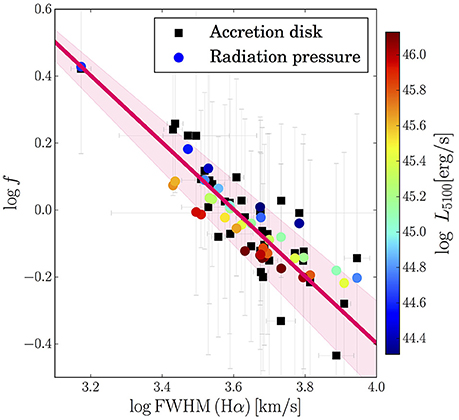
Figure 3. Radiation pressure in a gravitationally bound BLR. The observed virial factor vs. FWHMobs for the Hα line is shown (black squares). The magenta line is the derived relation f = (FWHMobs(Hα)/4,000 km s−1) and the width of the shadowed region accounts for the uncertainties in that relation. The filled points represent the modeled frad from the best fit model for radiation pressure in a gravitationally bound BLR. The color of the points scales with the measured monochromatic luminosity at 5,100Å (L5100) for each object, as indicated by the color bar. Redder (bluer) points correspond to larger (smaller) values of L5100. As can be observed, the model predicts that the scatter in frad (colored points) is driven by L5100 (see Equation 8). This dependence is not seen in our data (black squares) as shown in the right panel of Figure 1. Nevertheless, the relatively large errors in fAD and the weak dependence of frad in L5100 may probably hide the expected dependence from this radiation pressure model.
5. Summary and Conclusions
In this paper we compared Single Epoch black hole masses ((FWHM, Lλ)), obtained from the spectral properties of the BLR, with the black hole masses () that we derived through SED fitting of the accretion disk emission by assuming a standard geometrically thin and optically thick disk model. Because of the independence of masses on BLR properties, the comparison of these quantities allowed us to quantify the discrepancies between both black hole mass approaches expressing them in terms of the virial factor fAD.
Our results suggest a strong anti-correlation between FWHMobs(Hα) and fAD which indicates that (FWHM, Lλ) estimations are presumably biased. In particular we found that our results are consistent, within uncertainties, with fAD ∝ 1/FWHMobs for the case of the Hα, Hβ, Mg II and C IV lines.
Our analysis suggests that LOS inclination in a planar BLR and/or radiation pressure perturbations to the BLR distribution can reproduce our findings. Regardless of its physical origin, the dependence of f with FWHMobs(Hα) implies that MBH has been, on average, systematically overestimated for systems with large FWHMobs(Hα) (≳ 4,000 km s−1) and underestimated for systems with small FWHMobs(Hα) (≲4,000 km s−1). The range of fAD values presented in the right panel of Figure 1, which are associated with FWHMobs(Hα) = 1,600–8,000 km s−1, imply a range in f, and hence MBH, of factor ~6. However, this range should not be taken as representative of the entire population of AGN since our sample is too small (37 objects) and was not defined to be complete in terms of BLR properties.
Author Contributions
JM-R and PL co-developed the idea and wrote the manuscript; JM-R, PL, and DC wrote the codes needed for the different measurements and fittings procedures, JM-R obtained the measurements and performed the analysis. HN, DC, and BT contributed to the accretion disc calculations, the error estimates of the black hole mass and the interpretation of the results and improvements to the manuscript.
Conflict of Interest Statement
The authors declare that the research was conducted in the absence of any commercial or financial relationships that could be construed as a potential conflict of interest.
The reviewer, AN, and handling Editor declared their shared affiliation.
Acknowledgments
Support for the work of JM-R was provided by “CONICYT-PCHA/doctorado Nacional para extranjeros/2013-63130316”. PL acknowledges support by Fondecyt Project #1161184. HN acknowledges support by the Israel Science Foundation grant 234/13. BT is a Zwicky Fellow at the ETH Zurich.
Supplementary Material
The Supplementary Material for this article can be found online at: https://www.frontiersin.org/articles/10.3389/fspas.2017.00070/full#supplementary-material
References
Bentz, M. C., Denney, K. D., Grier, C. J., Barth, A. J., Peterson, B. M., Vestergaard, M., et al. (2013). The low-luminosity end of the radius-luminosity relationship for active galactic nuclei. Astrophys. J. 767:149. doi: 10.1088/0004-637X/767/2/149
Bentz, M. C., Peterson, B. M., Netzer, H., Pogge, R. W., and Vestergaard, M. (2009). The radius-luminosity relationship for active galactic nuclei: the effect of host-galaxy starlight on luminosity measurements. II. The full sample of reverberation-mapped AGNs. Astrophys. J. 697, 160–181. doi: 10.1088/0004-637X/697/1/160
Capellupo, D. M., Netzer, H., Lira, P., Trakhtenbrot, B., and Mejía-Restrepo, J. (2015). Active galactic nuclei at z~1.5 - I. Spectral energy distribution and accretion discs. Monthly Not. R. Astron. Soc. 446, 3427–3446. doi: 10.1093/mnras/stu2266
Capellupo, D. M., Netzer, H., Lira, P., Trakhtenbrot, B., and Mejía-Restrepo, J. (2016). Active galactic nuclei at z~1.5 - III. Accretion discs and black hole spin. Monthly Not. R. Astron. Soc. 460, 212–226. doi: 10.1093/mnras/stw937
Collin, S., Kawaguchi, T., Peterson, B. M., and Vestergaard, M. (2006). Systematic effects in measurement of black hole masses by emission-line reverberation of active galactic nuclei: eddington ratio and inclination. Astron. Astrophys. 456, 75–90. doi: 10.1051/0004-6361:20064878
Czerny, B., Du, P., Wang, J.-M., and Karas, V. (2016). A test of the formation mechanism of the broad line region in active galactic nuclei. Astrophys. J. 832:15. doi: 10.3847/0004-637X/832/1/15
Decarli, R., Dotti, M., Fontana, M., and Haardt, F. (2008). Are the black hole masses in narrow-line Seyfert 1 galaxies actually small? Monthly Not. R. Astron. Soc. 386, L15–L19. doi: 10.1111/j.1745-3933.2008.00451.x
Denney, K. D., Peterson, B. M., Pogge, R. W., Adair, A., Atlee, D. W., Au-Yong, K., et al. (2009). Diverse kinematic signatures from reverberation mapping of the broad-line region in AGNs. Astrophys. J. 704, L80–L84. doi: 10.1088/0004-637X/704/2/L80
Denney, K. D., Peterson, B. M., Pogge, R. W., Adair, A., Atlee, D. W., Au-Yong, K., et al. (2010). Reverberation mapping measurements of black hole masses in six local seyfert galaxies. Astrophys. J. 721, 715–737. doi: 10.1088/0004-637X/721/1/715
Foreman-Mackey, D., Hogg, D. W., Lang, D., and Goodman, J. (2013). emcee: the MCMC hammer. Publ. Astrono. Soc. Pac. 125, 306–312. doi: 10.1086/670067
Gaskell, C. M. (2009). What broad emission lines tell us about how active galactic nuclei work. New Astron. Rev. 53, 140–148. doi: 10.1016/j.newar.2009.09.006
Glen, A. G., Leemis, L. M., and Drew, J. H. (2004). Computing the distribution of the product of two continuous random variables. Comput. Stat. Data Anal. 44, 451–464. doi: 10.1016/S0167-9473(02)00234-7
Graham, A. W. (2015). Galaxy bulges and their massive black holes: a review. ArXiv. doi: 10.1007/978-3-319-19378-6_11
Greene, J. E., and Ho, L. C. (2005). Estimating black hole masses in active galaxies using the Hα emission line. Astrophys. J. 630, 122–129. doi: 10.1086/431897
Kaspi, S., Maoz, D., Netzer, H., Peterson, B. M., Vestergaard, M., and Jannuzi, B. T. (2005). The relationship between luminosity and broad-line region size in active galactic nuclei. Astrophys. J. 629, 61–71. doi: 10.1086/431275
Kaspi, S., Smith, P. S., Netzer, H., Maoz, D., Jannuzi, B. T., and Giveon, U. (2000). Reverberation measurements for 17 quasars and the size-mass-luminosity relations in active galactic nuclei. Astrophys. J. 533, 631–649. doi: 10.1086/308704
Lopez, S., and Jenkins, J. S. (2012). The effects of viewing angle on the mass distribution of exoplanets. Astrophys. J. 756:177. doi: 10.1088/0004-637X/756/2/177
Marconi, A., Axon, D. J., Maiolino, R., Nagao, T., Pastorini, G., Pietrini, P., et al. (2008). The effect of radiation pressure on virial black hole mass estimates and the case of narrow-line seyfert 1 galaxies. Astrophys. J. 678, 693–700. doi: 10.1086/529360
Mejía-Restrepo, J. E., Lira, P., Netzer, H., Trakhtenbrot, B., and Capellupo, D. M. (2017). The effect of nuclear gas distribution on the mass determination of supermassive black holes. Nat. Astron. 2, 63–68. doi: 10.1038/s41550-017-0305-z
Mejía-Restrepo, J. E., Trakhtenbrot, B., Lira, P., Netzer, H., and Capellupo, D. M. (2016). Active galactic nuclei at z~1.5 - II. Black hole mass estimation by means of broad emission lines. Monthly Not. R. Astron. Soc. 460, 187–211. doi: 10.1093/mnras/stw568
Netzer, H., and Marziani, P. (2010). The effect of radiation pressure on emission-line profiles and black hole mass determination in active galactic nuclei. Astrophys. J. 724, 318–328. doi: 10.1088/0004-637X/724/1/318
Ng, P., and Maechler, M. (2007). A fast and efficient implementation of qualitatively constrained quantile smoothing splines. Stat. Model. 7, 315–328. doi: 10.1177/1471082X0700700403
Onken, C. A., Ferrarese, L., Merritt, D., Peterson, B. M., Pogge, R. W., Vestergaard, M., et al. (2004). Supermassive black holes in active galactic nuclei. II. Calibration of the black hole mass-velocity dispersion relationship for active galactic nuclei. Astrophys. J. 615, 645–651. doi: 10.1086/424655
Runnoe, J. C., Brotherton, M. S., DiPompeo, M. A., and Shang, Z. (2014). The behaviour of quasar C IV emission-line properties with orientation. Monthly Not. R. Astron. Soc. 438, 3263–3274. doi: 10.1093/mnras/stt2429
Shakura, N. I., and Sunyaev, R. A. (1973). Black holes in binary systems. Observational appearance. Astron. Astrophys. 24, 337–355. doi: 10.1007/978-94-010-2585-0_13
Shen, Y., and Ho, L. C. (2014). The diversity of quasars unified by accretion and orientation. Nature 513, 210–213. doi: 10.1038/nature13712
Slone, O., and Netzer, H. (2012). The effects of disc winds on the spectrum and black hole growth rate of active galactic nuclei. Monthly Not. R. Astron. Soc. 426, 656–664. doi: 10.1111/j.1365-2966.2012.21699.x
Trakhtenbrot, B., and Netzer, H. (2012). Black hole growth to z = 2 - I. Improved virial methods for measuring MBH and L/LEdd. Monthly Not. R. Astron. Soc. 427, 3081–3102. doi: 10.1111/j.1365-2966.2012.22056.x
Wills, B. J., and Browne, I. W. A. (1986). Relativistic beaming and quasar emission lines. Astrophys. J. 302, 56–63. doi: 10.1086/163973
Keywords: active galactic nuclei, supermassive black holes, broad line region, accretion discs, virial coefficient
Citation: Mejía-Restrepo JE, Lira P, Netzer H, Trakhtenbrot B and Capellupo D (2018) The Virial Factor and Biases in Single Epoch Black Hole Mass Determinations. Front. Astron. Space Sci. 4:70. doi: 10.3389/fspas.2017.00070
Received: 31 August 2017; Accepted: 20 December 2017;
Published: 31 January 2018.
Edited by:
Deborah Dultzin, Universidad Nacional Autónoma de México, MexicoReviewed by:
Milan S. Dimitrijevic, Astronomical Observatory, SerbiaOmar López-Cruz, National Institute of Astrophysics, Optics and Electronics, Mexico
Alenka Negrete, Universidad Nacional Autónoma de México, Mexico
Copyright © 2018 Mejía-Restrepo, Lira, Netzer, Trakhtenbrot and Capellupo. This is an open-access article distributed under the terms of the Creative Commons Attribution License (CC BY). The use, distribution or reproduction in other forums is permitted, provided the original author(s) and the copyright owner are credited and that the original publication in this journal is cited, in accordance with accepted academic practice. No use, distribution or reproduction is permitted which does not comply with these terms.
*Correspondence: Julián E. Mejía-Restrepo, amVtZWppYUB1Zy51Y2hpbGUuY2w=