 Syun-Ichi Akasofu
- International Arctic Research Center, University of Alaska Fairbanks, Fairbanks, AK, United States
Auroral substorms and solar flares are basically various manifestations of electromagnetic energy dissipation processes, so it is useful to consider both phenomena in terms of a chain of processes, consisting of power supply (dynamo), transmission (currents/circuits), and dissipation (auroral substorms, solar flares), the electric current approach. In this short review, we briefly describe both phenomena together on the basis of the chain process. It is shown that the introduction of a dynamo process in this consideration provides a step-by-step way of studying both phenomena. It is shown that (a) both the solar wind–magnetosphere dynamo and a photospheric dynamo proposed by Lee et al. (1995) have enough power to accumulate enough energy for the explosive features of both phenomena, respectively. (b) For substorms, the power is accumulated in the inner magnetosphere and inflates it, and for flares, the power is likely to be accumulated in a loop current along and above two-ribbon flares. (c) For substorms, the energy release (unloading) process deflates the inner magnetosphere, resulting in an earthward electric field, and for flares, the disruption of the loop current suggested by Alfven (1950) may be responsible for the energy release.
Introduction
Auroral substorms and solar flares are mainly various manifestations of electromagnetic dissipation processes, so it is important to study them as a chain of processes consisting of power supply (dynamo), transmission, and dissipation. Auroral substorms consist of the growth, expansion, and recovery phases. Solar flares consist of the pre-flare, explosive, and recovery phases. Both phenomena have various morphological similarities: curtain-like or ribbon-like atmospheric emissions, the spectacular explosive features, including radio emissions, acceleration of charged particles, although there is a large difference of the power and energy [1018 erg/s (1011 w) and 1022 ergs (1015 J) for auroral substorms and 1026 erg/s (1019 w) and 1030 ergs (1023 J) for solar flares] (Figure 1).
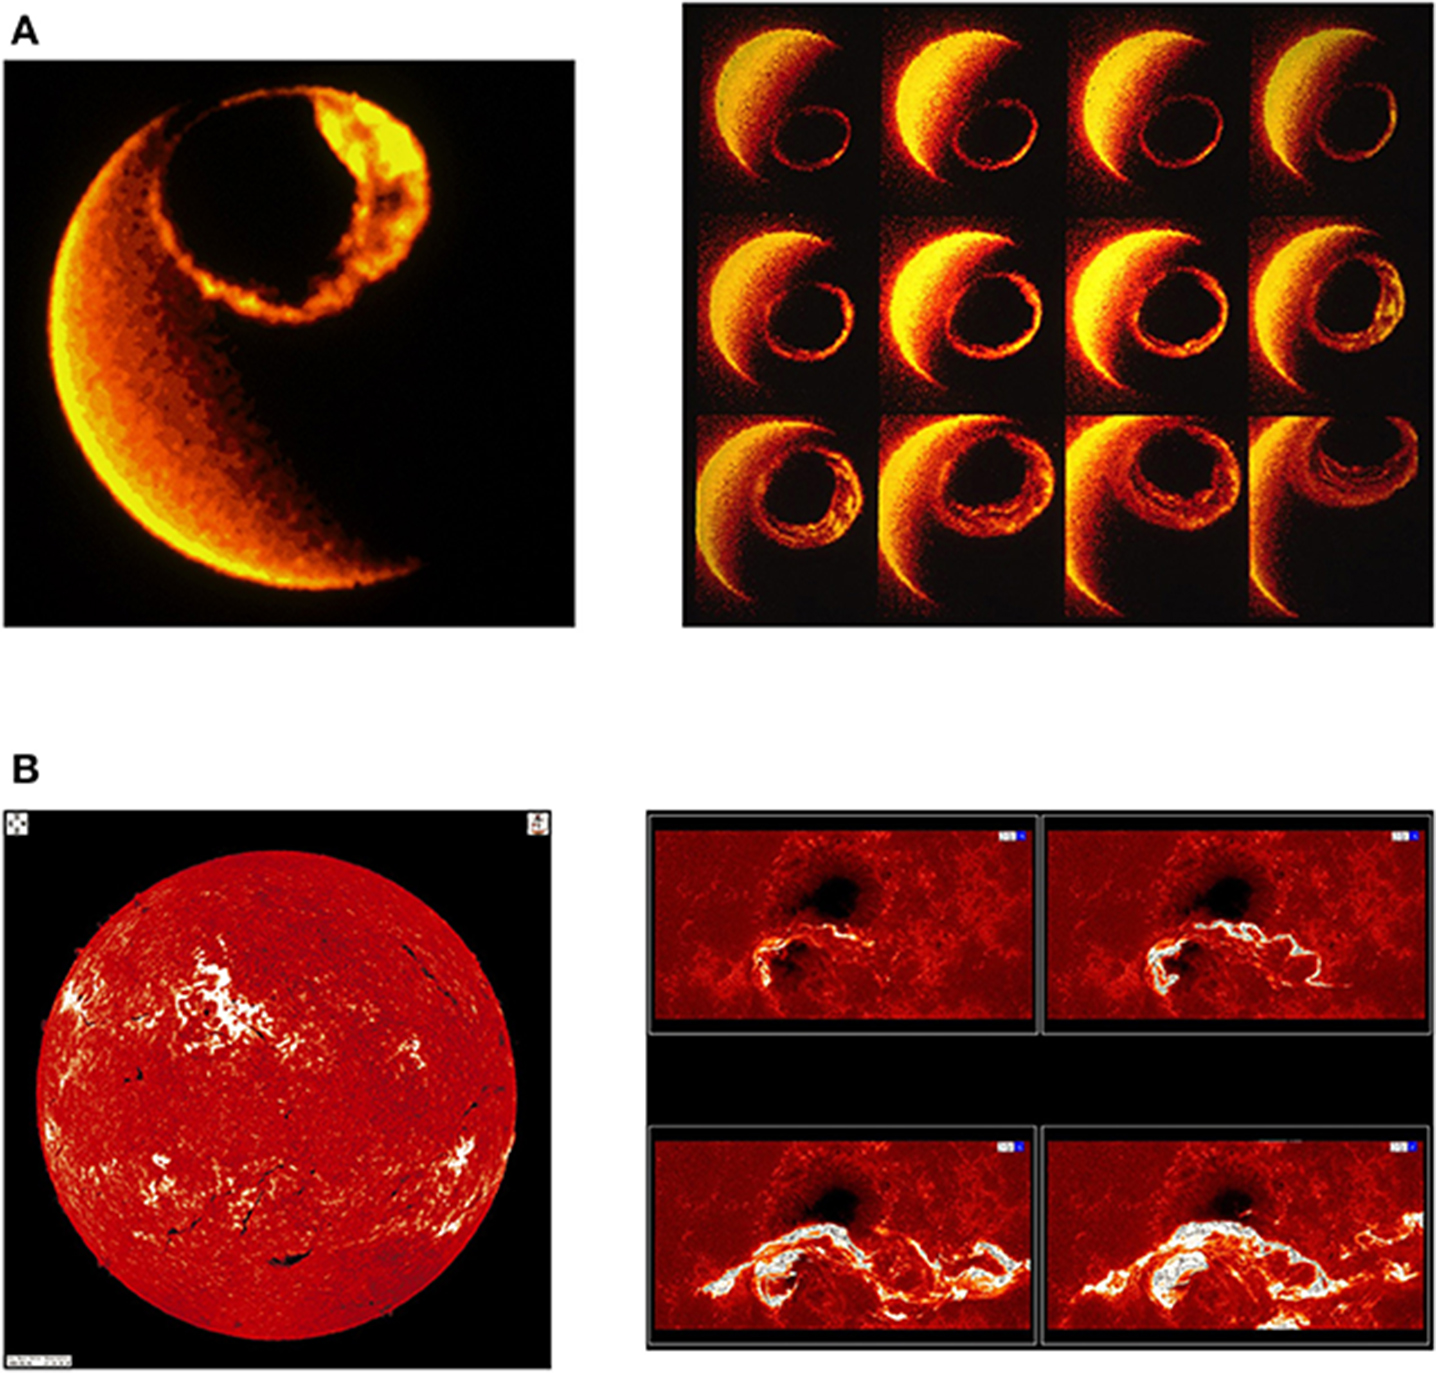
Figure 1. (A) A global view of an auroral substorm and an example of its development (Courtesy of L. Frank). (B) A global view of a solar flare and an example of its development (adopted from Figure 1 in “Rotating eruption of an untwisting filament triggered by the 3B flare of 25 April 1984, Kurokawa et al. (1987); permission from Springer Nature; Courtesy of K. Shibata).
In this review, we choose the electric current approach in considering both auroral substorms and solar flares together. The electric current approach was emphasized by Alfven (1967) by noting, “—in many cases the physical basis of the phenomena is better understood if the discussion is centered around the picture of the current lines [rather than the magnetic field line approach].”
Thus, the following steps are considered for both phenomena together:
(1) Dynamo process,
(2) Current circuit,
(3) Phenomena directly produced by the dynamo (quiet auroral arcs, spotless flares),
(4) Explosive phenomena,
(5) Power accumulation,
(6) Energy release (unloading),
(7) The total energy input–output relationship.
One of the important purposes of this review is to promote not only the electric current approach but also a joint research on both phenomena in terms of the chain process by magnetospheric physicists and solar physicists. In the 1960s, researchers of both fields often worked together on both phenomena and had several joint conferences, but the specialization in each field has since then separated them. The integration of both fields has been emphasized by Balasis et al. (2011a,b,c).
Thus, this review is constructed in such a way that one field of researchers can find progresses of the other on the basis of the electric current approach. For this purpose, the review includes some elementary explanations for both phenomena, but in making the review concise, details may be referred to cited papers, including Akasofu (2017a) and Akasofu and Lee (2019) and references therein. It will be seen that the electric current approach on both phenomena is still at a very early stage.
Dynamo Process
Auroral Substorms
The dynamo process occurs as a result of the interaction between the solar wind and the earth's magnetic field. The power is generated by the fact that the solar wind of speed (V) flows across the linked magnetic field (B) between the interplanetary (solar) magnetic field (IMF) and the magnetic field of the magnetosphere (Figure 2A).
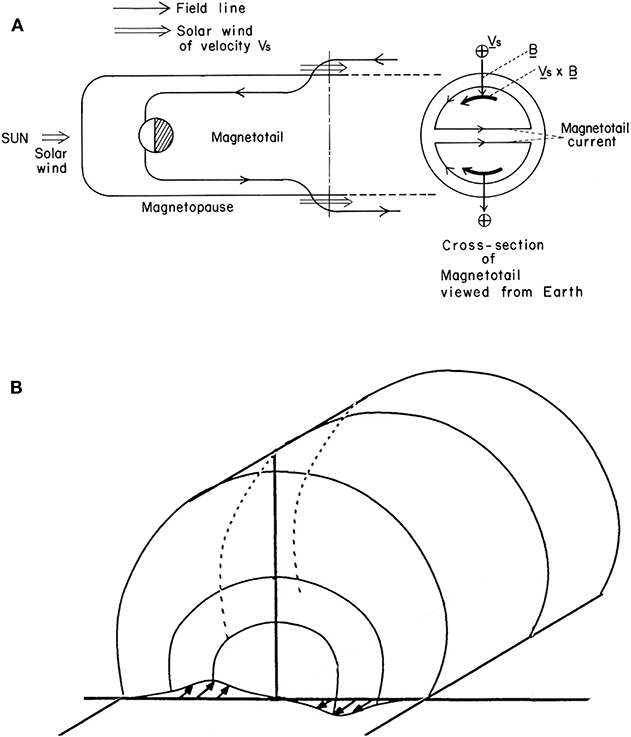
Figure 2. (A) The solar wind–magnetosphere dynamo. The electromotive force (V × B) is generated along the northern and southern boundaries of the magnetosphere, producing two half-solenoidal currents; the cross section of the magnetosphere with the dynamo process is indicated (Akasofu). (B) A photospheric dynamo proposed by Lee et al. (1995); the photospheric plasma flows along the neutral line under a magnetic arcade.
The power of the solar wind–magnetosphere dynamo is defined by the Poynting flux P (erg/s):
Typical values of the parameters are:
Solar wind speed V = 500 km/s,
IMF B = 10 nT,
S = sin4(θ/2)(l2π), l = 10 Re (Re = the earth's radius), θ = the polar angle of the IMF [the angle θ =180° indicates the IMF is oriented southward],
Solar Flares
The dynamo process occurs as a result of plasma flows across magnetic fields on the photosphere along the neutral line (between positive and negative magnetic fields) over a magnetic arcade. Figure 2B shows a photospheric dynamo proposed by Lee et al. (1995). The power equation is the same as that for auroral substorms, the Poynting flux [P = ∫ (E × B) ds = V (B2/8π) S].
Typical values of the parameters are:
Photospheric plasma speed V = 2.0 km/s,
Magnetic field intensity around the neutral line B = 100 G,
S = kd, k = the lateral dimension [1.0 × 10⁵ km], d = the depth [6.0 × 10⁴ km]; cf. Kosovovichev and Duvall (2010); θ = 180° (perpendicular to the photosphere).
P = 2.4 × 1027 erg/s.
Note:
(a) In the past, the concept of dynamo process and its power (erg/s or w) has not been explicitly considered in most substorm and flare studies. This may be because it had been thought that the dynamo process alone cannot explain the explosive features, and thus the main concern has focused on how rapidly the energy in an anti-parallel magnetic configuration can be released by magnetic reconnection, but the formation process of the anti-parallel magnetic configuration had not been considered. However, Sweet (1958) considered already two approaching sunspot pairs in establishing his anti-parallel magnetic field consideration, which may be considered to be a photospheric dynamo process.
(b) In a substorm study, V, B, and θ can be directly measured simultaneously together, enabling us to study at least semi-quantitatively the whole chain processes. Unfortunately, a similar situation is not available for flares at present.
Circuit
Auroral Substorms
One of the currents is directly generated by the dynamo, namely, the directly driven (DD) current (the DD current), and flows in the form of two half-solenoids, one in each hemisphere, so that the currents from both half-solenoids join as the dawn–dusk current across the equatorial plane (Figure 3A).
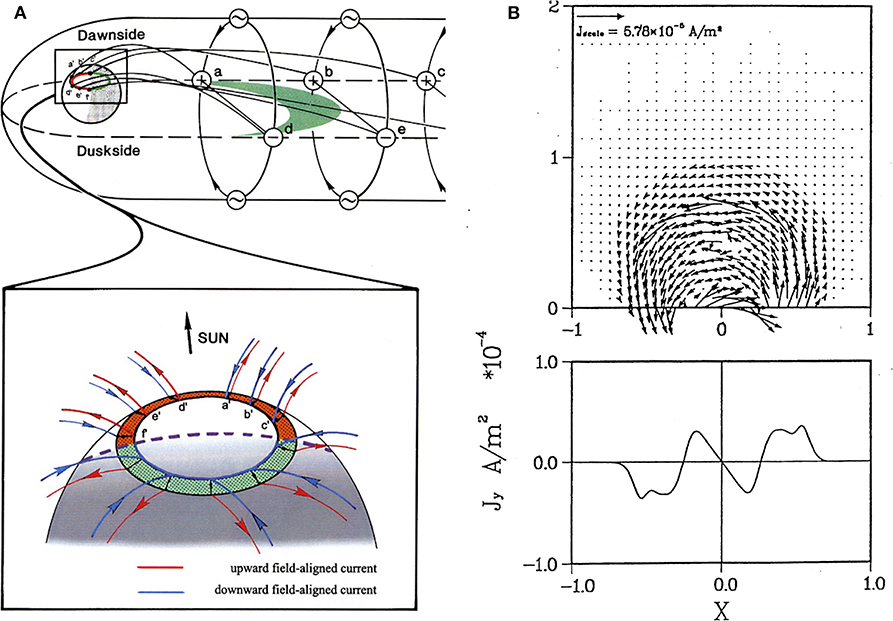
Figure 3. The electric current system generated directly by the dynamo. (A) In the magnetosphere, there are two current systems, one is the two half- solenoidal currents, and the other is the field-aligned current system, connecting the dynamo terminals and the auroral oval (Akasofu). (B) In the solar atmosphere, one of the currents flows along the magnetic field lines of the magnetic arcade; the current intensity is also shown. The photospheric dynamo generates another current system, which is discussed in sections Power Accumulation and Energy Unloading (Release) (Courtesy of G. S. Choe).
The dynamo generates other DD currents, which are field-aligned currents, connecting the terminals of the dynamo and the northern and southern auroral ovals (along which auroras are located) in the ionosphere; the location where magnetic field lines from the terminals are “rooted” in the auroral oval in both hemispheres, from the morning side of the terminal to the morning half of the auroral oval, and from the evening side of the terminal to the evening half of the auroral oval. Thus, the dynamo voltage of about 100 kV is communicated to the auroral oval, the morning half of the auroral oval becoming positive and the evening half negative, transferring the dynamo voltage across the polar cap. This voltage across the polar cap generates the ionospheric DD current (section Explosive Phenomena).
Solar Flares
The photospheric dynamo generates two directly driven (DD) currents, the solar DD currents. One of them flows along magnetic field lines of the arcade (Figure 3B); the upward field-aligned currents produce two-ribbon flares, as we discuss in the following. The other current flows along the dark filament, as discussed in sections Power Accumulation and Energy Unloading (Release).
Note:
As we shall see in the following, in the electric current approach, the field-aligned currents in both phenomena play a crucial role in explaining various features of both phenomena.
Phenomena Caused Directly by the Dynamo (Directly Driven)
Since we have introduced the dynamo process, it is important to identify phenomena directly produced by the dynamo. For substorms, quiet arcs (curtain-like) are identified. For flares, it is suggested that spotless flares are produced directly by the dynamo.
Auroral Oval and Quiet Auroral Arcs
The dynamo produces directly quiet auroral arcs (often multiple) along the auroral oval, which are shown in Figures 4A,B. Since the solar wind is blowing all the time, quiet arcs are almost always present along the oval (unless θ ≈ 0°). The arcs become bright when the power P exceeds 1018 erg/s. In the upper atmosphere above 100 km, the most abundant atoms are oxygen atoms, which emit a greenish line. Some of the properties related to current-carrying electrons are: the energy = 10–15 KeV, the flux = 106-108/cm2s sr, and the current intensity = 10–40 μA/m2.
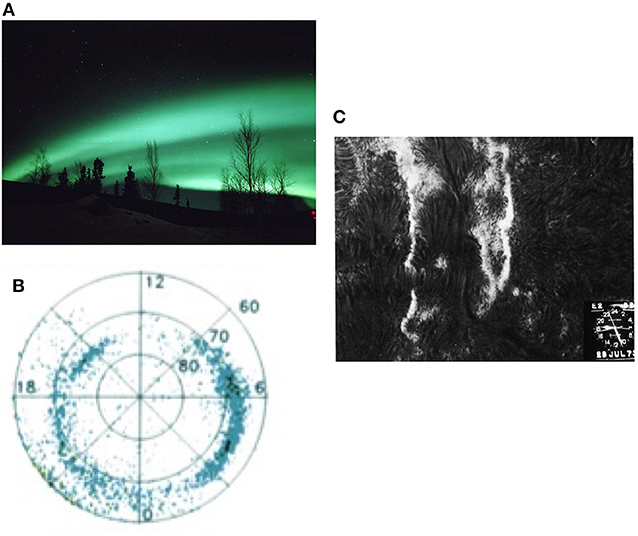
Figure 4. (A) Quiet auroral arcs (often multiple) produced directly by the dynamo (Permission from the archives of the Geophysical Institute, University of Alaska Fairbanks). (B) The distribution of quiet arcs (viewed from a satellite) along the auroral oval (Courtesy of G. Parks). (C) An example of spotless flares (adopted from Figure 20a in Svestka (2004); permission from Springer Nature). Note the dark filament between two ribbons.
The transmitted voltage to the ionosphere generates an electric current in the ionosphere, the ionospheric DD current (Figure 6), which plays a crucial role in understanding substorms, as we see in the following sections.
Spotless Solar Flares
It is suggested that spotless flares (Figure 4B) are a direct result of the photospheric dynamo (namely, the solar DD component). Thus, they can be considered to be the basic pattern of flares produced directly by the dynamo, rather than just weakest flares.
As their name indicates, there is no sunspot around spotless flares. Dodson and Hedman (1970) examined 83 spotless flares and found that they are of long duration and rise to maximum intensity slowly; these are not the characteristics of explosive features of flares. They occur more frequently than intense flares (Ruzdjak et al., 1989) but have almost been forgotten because of their weakness.
In order to produce two-ribbon Hα flares, it is necessary to generate an energy flux 1012 erg/cm2 s of 20 keV electrons (Svestka, 1976, p. 103). This value corresponds to an electron flux of 3 × 10¹⁴ electron/cm2 s and the current of 4.8 × 10⁻⁴ A/m2. This value may be compared with the current intensity generated by the photospheric dynamo, 0.5 × 10⁻⁴ A/m2, under the condition of the dynamo model by Lee et al. (1995) [V = 2 km/s and a weak magnetic field B= 12 G] (Figure 3B).
The dynamo generates an additional current system, In Figure 4C, the dark filament is present between the two-ribbon emission, which is actually located above the two-ribbon flare, and is known that electric current flows along it (Bothmer and Schwenn, 1994); this current system will be discussed in section Power Accumulation (Solar Flares).
Note:
(a) As the terms “curtain-like” and “ribbon-like” express, both phenomena are produced by field-aligned sheet currents. However, why the electron stream forms a thin sheet form is not well-known. In auroral arcs, the current-carrying electrons are observed to be accelerated along the magnetic field lines by the electric field of the double layer in order to reach the ionosphere (Karlsson, 2012).
(b) In the past, it has been thought that two-ribbon flares, including spotless flares, are caused by magnetic reconnection above the magnetic arcade (cf. Hirayama, 1974); magnetic reconnection will be discussed in section Energy Unloading (Release).
Explosive Phenomena
Both the magnetospheric and the solar atmospheric systems accumulate the power. When the accumulated power reaches a certain level, both systems become unstable and release the accumulated energy, causing explosive (dynamic) activities around the quiet arcs and spotless flares, respectively. They are not just an enhancement of their brightness, but have many dynamical features. The explosive feature will be discussed in section Energy Unloading (Release).
The explosive activities occur both in the polar region and the magnetosphere. Their auroral activity is shown schematically in Figure 5A, illustrating a typical development of auroral activity (the expansion phase of auroral substorms) (Akasofu, 1964). At about the same time, there occur complicated changes of the magnetic configuration in the magnetotail (cf. Angelopoulos et al., 2008) (Figure 5B).
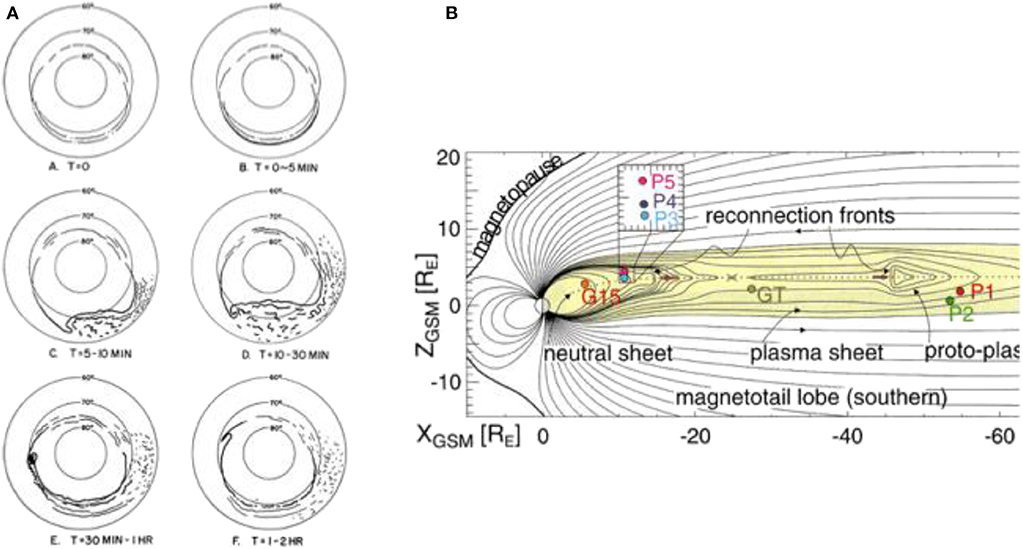
Figure 5. A global view. (A) A schematic illustration of the development of the expansion phase of the auroral substorms (adopted from Figure 1 in Akasofu, 1964; permission from Elsevier Ltd.). (B) The magnetic field configuration in the magnetotail during a substorm, showing magnetic reconnection (adopted from Figure 1 in Angelopoulos et al., 2008; permission from the American Association for the Advancement of Science).
Flares show a very complex way of developing. As an example, Figure 1 in Moore et al. (2001) shows the tethering model. It shows brightening of the two-ribbon emission and the exploding dark filament (the prominence seen above the photospheric disk); their figure is considered because it contains all the major features of solar flares and is most useful in considering flare phenomena.
Note:
Because of the complexity of both phenomena, the choice of the important topics and major features of substorms and flares may be different, depending on researchers.
Power Accumulation
The dynamo alone cannot cause directly explosive phenomena, so that the power must be accumulated in the magnetosphere and solar atmosphere, respectively. In this section, the concept and process of the power accumulation process are described in detail because the power accumulation has not been discussed adequately in both fields in the past.
Figure 6 illustrates conceptually the power accumulation and the resulting energy UL. Taking the magnetospheric situation as an example, the magnetosphere is considered to be a tank, into which the solar wind energy flows in; the parameter S in the power equation can be considered to be the cross section of the magnetosphere (faucet in Figure 6). A part of the accumulated energy flows out directly from the tank, producing quiet auroras and the DD current in the ionosphere, and the other part flows into the inductive circuit of the magnetosphere (pitcher in Figure 6) and when it is full, the magnetosphere unloads it suddenly, producing the explosive features and the UL current in the ionosphere.
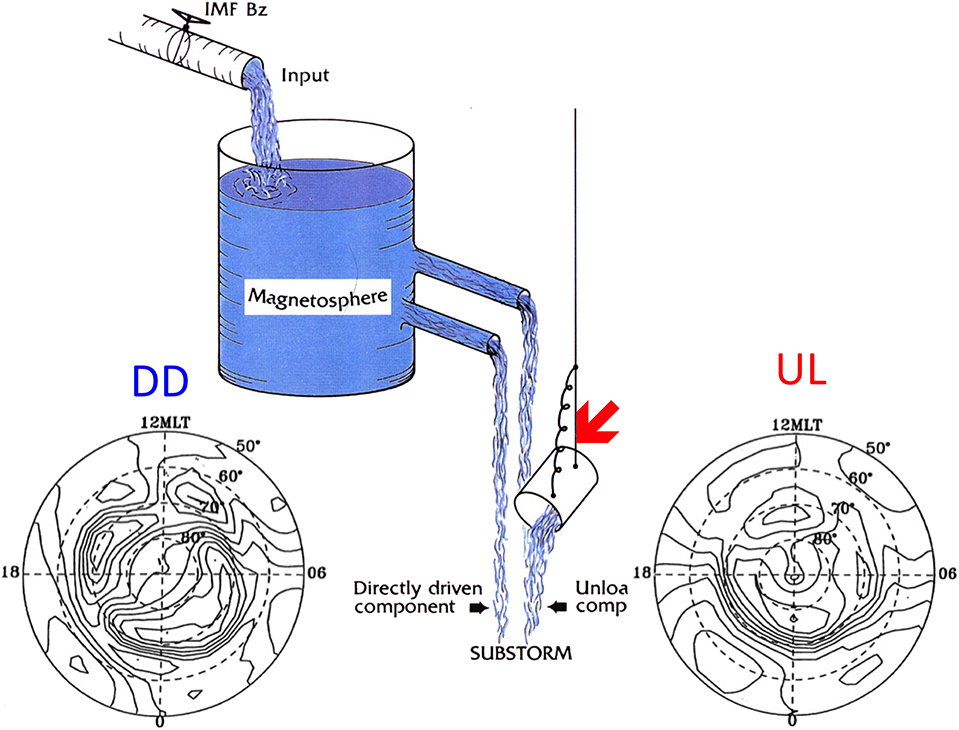
Figure 6. An attempt to explain how the accumulated power (loaded energy) is generated by the dynamo flows; one is directly dissipated from the tank (magnetosphere), and other flows into the pitcher (the inductive circuit, red arrow) first and then unloaded suddenly. The former produces the directly driven (DD) current in the ionosphere, which is a two-cell current, while the latter produces the unloading (UL) current in the ionosphere, which is mainly a single-cell current (modified from Akasofu, 2019).
Note that the ionospheric DD current is a two-cell current, while the ionospheric UL current is basically a single-cell current. Fortunately, in substorm studies, it is possible to examine the chain process by following both the DD and UL currents as a function of time.
Auroral Substorms
The energy produced by the dynamo is dissipated mainly in the ionosphere as the Joule heat; the particle precipitation accounts for only about 10%. The power accumulation and the energy UL can be monitored by observing the driven DD current and the UL current (from the pitcher) in the ionosphere because the Joule heat production (the main dissipation process for substorms) is proportional to the current intensity I in the ionosphere (the Joule heat production rate δ [= I2/σ = (I/σ)I ∞ I]); this is because the field-aligned currents (connected to the DD and UL currents) produce the ionization in the ionosphere.
In Figure 7 and in many other examples, unlike the UL component, the DD current follows fairly well the power P (= ε/8π). The DD current grows slowly at the beginning after the power increases, while the onset of the UL current begins with a significant delay of about 1 h behind the DD current (UL until the pitcher is filled in Figure 6). This delay period is called the growth phase of substorms. Further, unlike the DD current, the UL current occurs impulsively (unrelated to time variations of the power P). Furthermore, the UL current is short lived (about 1 h), but the DD current lasts until the power becomes <1018 erg/s.
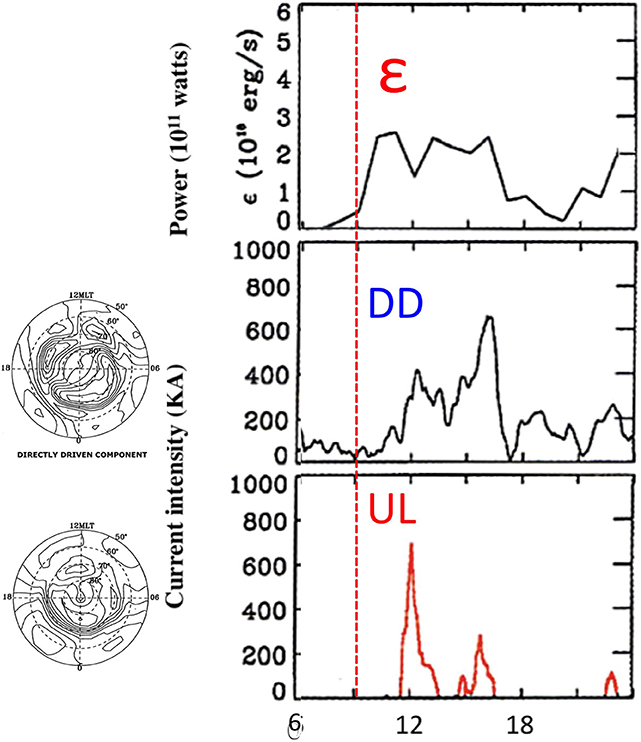
Figure 7. The relationship among the power P (= ε/8π), the directly driven (DD) current and the unloading (UL) current in the ionosphere; both the DD and UL current patterns are also shown (Akasofu).
The most important fact is that the DD current (thus, the dissipation) is very weak during the growth phase (despite the fact that the power is increasing), indicating that the excess power must be accumulated in the inductive circuit of the magnetosphere.
The power generated by the dynamo flows in the direction of the Poynting flux (E × B). Thus, in the magnetosphere, the flux tends to be directed mainly toward the inner magnetosphere (because of a dipolar configuration) (Figure 8A). As a result, the inner magnetosphere becomes “inflated” by the incoming power; for medium intensity of substorms, the energy is loaded (accumulated) at about the distance of 6 Re.
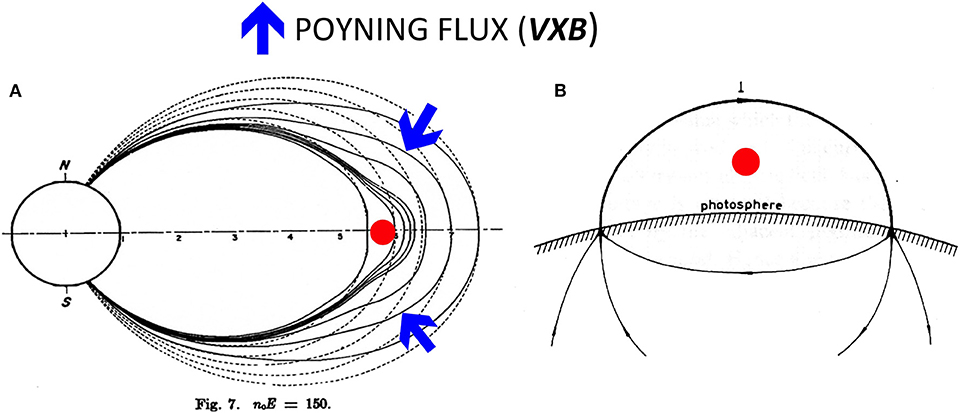
Figure 8. The location where the power is accumulated. (A) The inner magnetosphere is inflated (red dot) as the power flows into there. The Poynting flux is also shown (blue arrow) (Akasofu). (B) For flares, one of the possibilities for the location is a loop current along the dark filament (red dot) (Alfven, 1950; a red dot is added). This loop current is produced by the photospheric dynamo and is discussed in this section (Figure 11).
The power is typically 3–5 × 10¹⁸ erg/s, so that the accumulated energy W during the growth phase (about 1 h) becomes about 5 × 10²² ergs (or 5 × 10¹⁵ J); note that W = (1/2)I2 H = 5 × 10²² ergs for the about L = 100 H, I = 107 A (cf. Alfven, 1981).
The inflation can be studied by calculating the resulting deformation of the magnetic field configuration. Figure 8A shows the results for the loaded energy of 3 × 10²¹ erg/s around 6 Re, which is a little less than the amount in making the magnetosphere unstable; the current intensity at 6 Re is 3 × 10⁻² μA/m2. An observational example of the inflation (causing a reduction of the magnetic field intensity at the distance of 6 Re) will be discussed in section Energy Unloading (Release).
Note:
(a) An interesting observation in this connection is the fact that the main UL current occurs only during an early epoch of substorms (despite the fact that the power is maintained high even after the end of the expansion phase; Figure 7); this indicates the fact that there is no large accumulation of the power after the ionosphere becomes ionized enough to conduct the current (producing enough Joule heat and thus dissipating the power). The DD current lasts until the power becomes <1018 erg/s (Figure 7).
(b) Several observations indicate that the location of the power accumulation varies, depending on the intensity of substorms, 4 Re for most intense substorms (AE index 2,000 nT) and 10 Re for the weakest substorms (AE index 100 nT).
Solar Flares
As mentioned earlier, the photospheric dynamo discussed in section Dynamo Process generates another electric current along the dark filament between the two ribbons but above them (Akasofu and Lee, 2019). It is actually a loop current as shown in Figure 8B (Alfven, 1950). Bothmer and Schwenn (1994) showed that an electric current flows along the dark filament, which we propose to be the solar UL current.
This UL current system is generated as a result of the magnetic shear of the dynamo (Figures 9A,B); for details of the Poynting flux in this process, see Akasofu and Lee (2019); the loop current will be discussed further in section Energy Unloading (Release) (Figure 12B). Figure 9C shows an active (kinked) dark filament between the two ribbons, which is exploding.
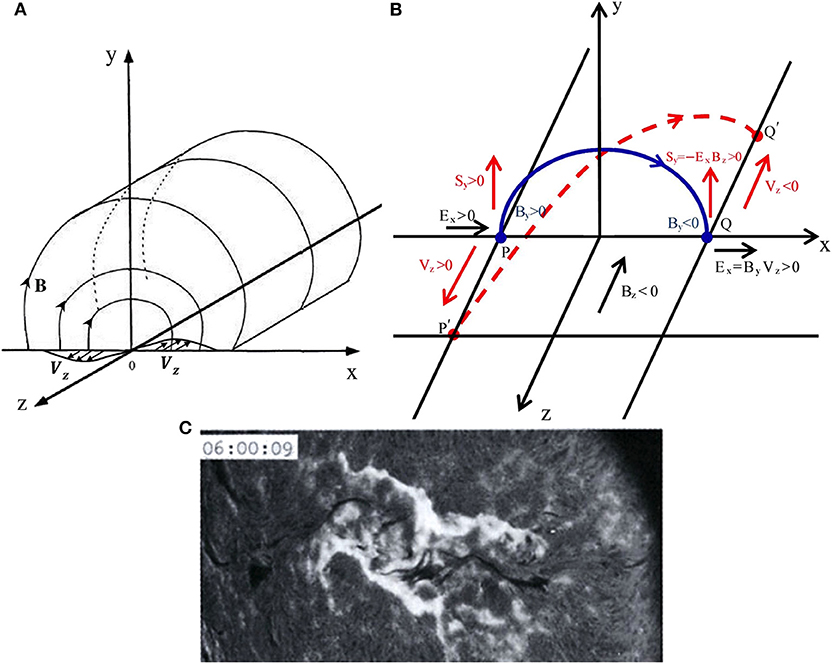
Figure 9. (A) The photospheric dynamo (adopted from Figure 9 in Akasofu and Lee, 2019; permission from Elsevier Ltd.). (B) The process of generating the loop current above a two-ribbon flare by the dynamo as a result of magnetic shear (from the blue line to the dash red line), caused by the photospheric plasma flow (Akasofu and Lee, 2019). (C) An example of a two-ribbon flare with an unstable (exploding) dark filament (the Hidaka Solar Obvervatory, courtesy of E. Hiei; see also Figure 11).
This loop UL current can unload its magnetic energy when it is disrupted; a loop current system as the source of flare energy was suggested by Alfven (1950, 1981). Chen and Krall (2003) estimated the current intensity to be 1011A in launching a prominence to become a coronal mass ejection (CME).
The dynamo power increases by either an increased speed of photospheric plasma flows or higher magnetic field intensities or both.
Here, we examine how much energy can be loaded by magnetic shear by examining magnetic shear observed by Wang et al. (1994); their Figure 1. The magnetic shear was observed to increase for about 5 h before a sudden increase of the radio emission (an indication of the onset of the explosive process). They observed an increase of the shear angle from 40 to 45° in a rectangular area of 6.5 × 10⁸ km2 (50“ × 25” = 3.6 × 104 km × 1.8 × 104 km). From such a magnetic shear observation, it is possible to infer the speed V of the photospheric plasma. In this case, the speed V of plasma flow is estimated to be roughly 1.3 km/s. This estimate is close to 1.6 km/s obtained by Yang et al. (2004). For the magnetic field intensity, it is reasonable to assume B = 100 G in an active sunspot group, the width of the arcade (or distance between two ribbons of flare) 1.8 × 10⁴ km and the depth of the flow d = 6.0 × 10⁴ km (cf. Kosovovichev and Duvall, 2010). The dynamo power in this case is estimated to be P ≈ 2.8 × 1026 erg/s. For solar flares, the minimum power is estimated by dividing the minimum energy of flares W by 1 h 2.8 × 1026 erg/s (=1030 erg/1 h); see section Dynamo Process (Solar Flares).
In this particular case (Wang et al., 1994), magnetic shear was increasing for about 5 h before the explosive onset, so that the loaded energy is estimated to be W= 1.8 × 1030 ergs. This amount of energy seems to be enough for making the loop current system unstable (in this example) for unloading the magnetic energy in producing the explosive features at the flare onset. Thus, this prolonged shear period may be the pre-flare phase (corresponding to the growth phase of auroral substorms).
Note:
(a) For the parameters of the dynamo in section Dynamo Process (Solar Flares), the amount of accumulated energy W in 5 h = 4.3 × 1031 ergs.
(b) In the case of Wang et al. (1994; their Figure 1), it is interesting to note that the loaded energy increased even after flare onset (not decreased as theories of magnetic reconnection presume; the dynamo process must be still in progress and is even greatly enhanced, overcoming the unloading.
(c) For flares, since the dynamo process is considered as the power supply, there is no reason to restrict the magnetic field configuration of the power accumulation only to an anti-parallel configuration as theories of magnetic reconnection presume. The loop current is also such a possibility among many other possible others under the electric current approach.
(d) Akasofu (2018) suggested that if we could monitor the power P and W (=P × t), it may be possible to predict the occurrence of flares and their intensity in the future. If W reaches 1030 ergs (the minimum energy) before flare onset, a flare may be expected, and if W exceeds more than 1032 ergs before flare onset, a major flare may be imminent. It is suggested that the future flare prediction should advance semi-quantitatively at least this far, although this requires many efforts (observing V and B simultaneously together). For substorms, the power must increase to at least 1018 erg/s. If the loaded energy reaches above 1022 ergs or more before the onset, an intense substorm can be expected.
Energy Unloading (Release)
Figures 10A,B show some emission features associated with the explosive process of substorms and flares. In Figure 10A, a series of all-sky images (00:31–00:36 UT) shows a rapid poleward advance of auroral arcs in the midnight sector; the speed of the advance is about 250 m/s. In Figure 10B, the first column [23:24–(next day) 02:03 UT] shows the pre-flare phase, and the second column (04:03–08:38 UT) the explosive phase; note a clear development of the two ribbons and the unstable dark filament.
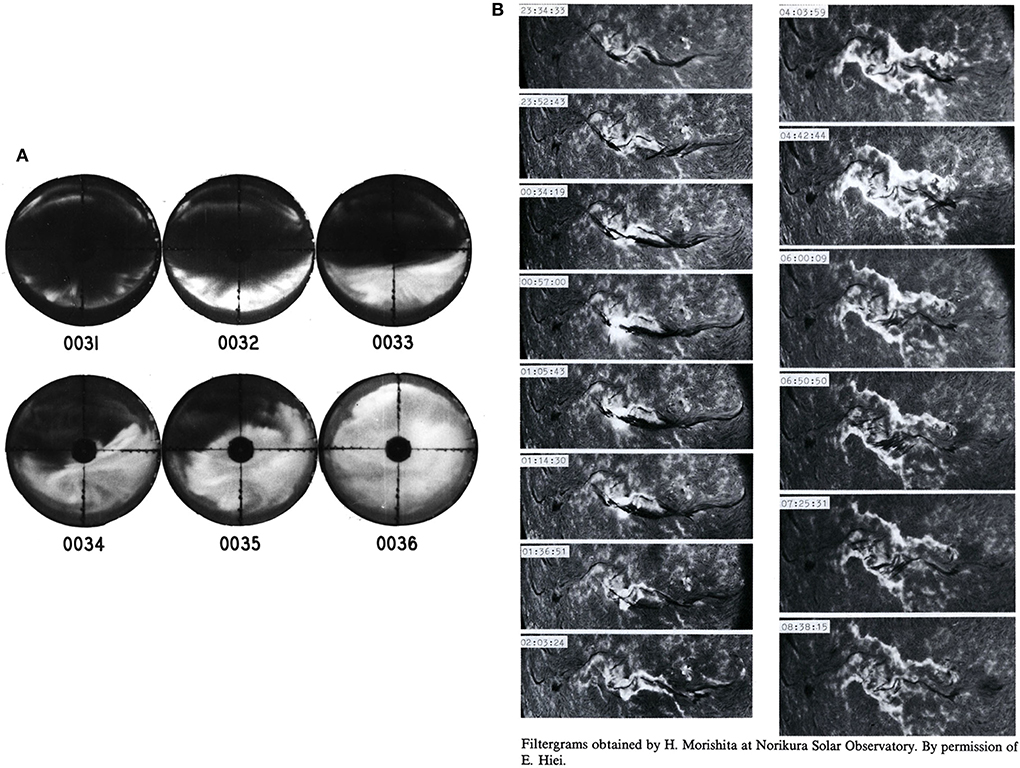
Figure 10. Examples of the explosive features. (A) A series of all-sky images showing a rapid poleward advance of auroral arcs (00:31–00:36 UT); the top of the circular images points northward. (B) A typical flare; the first column (22:24 UT–[next day] 02:03 UT) is the pre-flare condition, while the second column (04:03–08:30 UT) shows the explosive phase; note the development of the two ribbons and the disturbed dark filament (the Norikura Solar Observatory, courtesy of E. Hiei).
Auroral Substorms
It seems that the loaded energy of about 1022 ergs is the limit of energy (the size of the pitcher), which the magnetosphere can hold at about the distance of 6 Re because the expansion phase expends this amount of the energy (Figure 11).
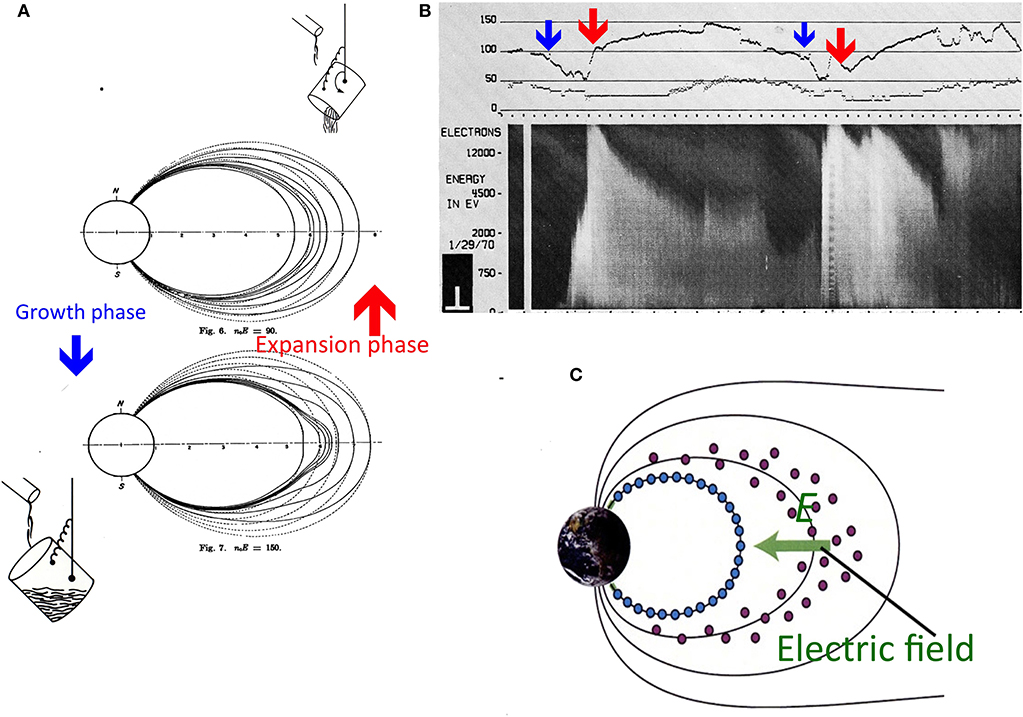
Figure 11. Auroral substorms (modified from Akasofu, 2019). (A) It shows the inflation (the growth phase, blue arrow) by the power accumulation and deflation (the expansion phase, red arrow) by unloading of the energy. (B) Satellite observations at the geosynchronous distance (6 Re) (courtesy of C. E. McIlwain). The magnetic field decreases during the inflation (blue arrow), and the deflation causes an increase of the magnetic field (red arrow). The double layer along the field-aligned current [the three-dimensional (3D) unloading (UL) current system in Figure 12A] accelerates electrons, indicating the occurrence of substorms (as can be seen in the lower part). (C) A schematic illustration how the deflation might cause the charge separation and the earthward electric field which generates the UL 3D current system (electrons in blue and protons in red).
The reason for this to happen is that when the magnetosphere is loaded by as much as 1022 ergs of energy at 6 Re, it seems to become unstable and unload the energy, and the result is the expansion phase of auroral substorms.
In fact, in the magnetic field observation at 6 Re, we can see the sequence of the inflation (blue arrow)–deflation (red arrow) process (Figure 11A). In Figure 11B, when the inflation occurs, the magnetic field intensity is decreased (blue arrow) in the region of the enhanced current, and a sudden deflation is manifested by a sudden increase of the field intensity (red arrow) in the region of the decreased current (DeForst and McIlwain, 1971). Thus, these changes of the magnetic field can be understood in terms of changes of the east–west current on the equatorial plane (Figure 3A).
One possibility is that the deflation causes an earthward electric field by a charge separation (Lui and Kamide, 2003). This charge separation is expected to occur because electrons are tightly bound to the contracting field lines during the deflation, while protons may not. The electrons attached to the contracting field lines will be discharged, causing the sudden brightening of an arc, substorm onset. Figure 11C shows schematically how the charge separation can cause the earthward electric field. Note that I •E < 0 occurs only in the equatorial part of the circuit. The expected electric field E is given by one of Maxwell's equations, E = [–(∂Bz/∂t)∫ ∂y]≈ 5–50 mV/m.
The electric field generates the three-dimensional UL current system (Bostrom, 1964), which has the field-aligned currents (Figure 11A). Electrons are accelerated by the electric field, which is set up by the double layer along the field-aligned current (Karlsson, 2012).
Fortunately, there was a very important set of observations at 8.1 Re (in the inner magnetosphere), showing a sequence of events, leading to the deflation at the time of a substorm onset; the simultaneous occurrence of (i) reduction of the current, (ii) breakdown of the frozen-in field condition, and (iii) earthward electric field (Lui, 2011). The breakdown of the frozen-in field condition is crucial for the suggested charge separation.
The major phenomena associated with substorms are caused by this new UL (3D) current system (Figure 12A). The upward sheet current (for the curtain-like structure) in the meridional component is responsible for active auroral arcs. The auroral electrojet is the earthward end of this 3D current system, while its magnetic field produced by the 3D UL current system (B, red arrow) shifts the earthward end of the azimuthal component poleward, causing the poleward advance of arcs (Figure 6A); for a typical value B = 50 nT, it can shift the end of the azimuthal component about 500 km as observed.
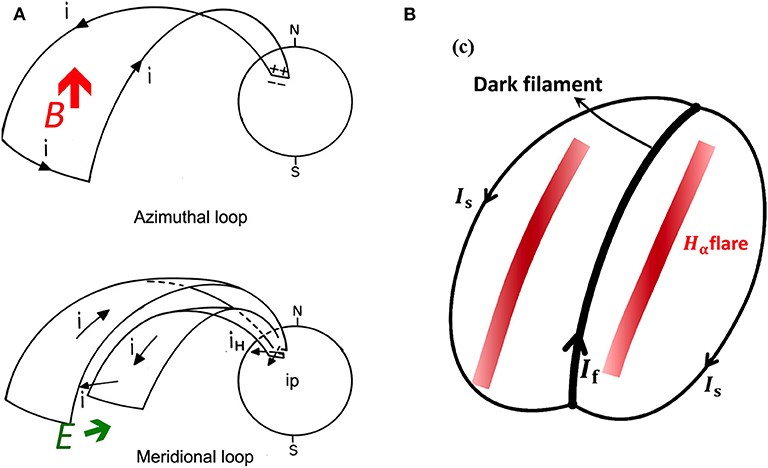
Figure 12. The current system for the explosive phase. (A) The three-dimensional (3D) unloading (UL) current system, which consists of the azimuthal component and the meridional component (Bostrom, 1964). The earthward electric field E is responsible for establishing this current system. The magnetic field B produced by the azimuthal component advances its earthward end poleward, causing the poleward advance of auroral arcs and the auroral electrojet. Note that the so-called “dipolarization” cannot explain the poleward expansion; the stretched field lines go back to the pre-substorm location with the frozen-in particles. (B) The loop current system generated by the dynamo, which flows along the dark filament (Akasofu and Lee, 2019). The loop current explodes during flares, which appears as a rising prominence above the solar disk.
Note:
At this stage of the progress of understanding substorms, the eastward electric field and the 3D UL current generated by it are a good set of possibility, but other possibilities should be explored. A similar statement can also be made for the current along the dark filament.
Solar Flare
At about the same time of the Hα enhancement, the dark filament becomes unstable and explode. Figure 13A shows such an example. Figure 13B shows an example of the rising dark filament (seen as a prominence beyond the solar disk). This phenomenon has been known as “disparitions brusque” for a long time and is described in detail by a number of researchers in the past (cf. Svestka, 1976, p. 229) and is also known to be related to CMEs (cf. Chen and Krall, 2003).
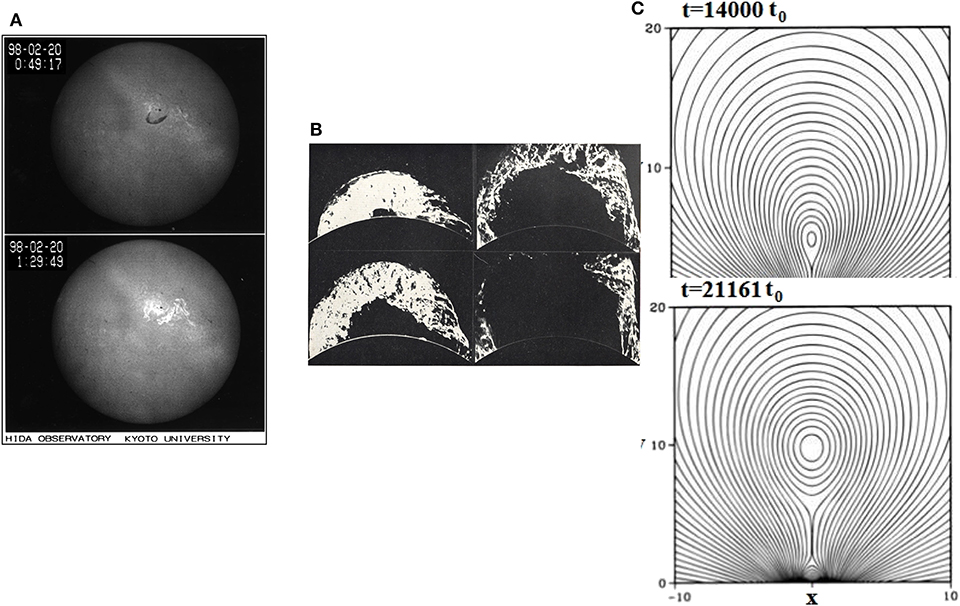
Figure 13. Explosive features of flares. (A) The dark filament explodes at about the time of the Hα emission enhancement. This phenomenon is known as “disparition brusque” (courtesy of the Norikura Solar Observatory, E. Hiei). (B) An example of rising prominences (the High Altitude Observatory, courtesy of W. O. Roberts). (C) A simulation of the exploding dark filament (Choe and Lee, 1996a,b; Akasofu and Lee, 2019).
Figure 13C shows a simulation result of the rising filament by an enhanced dynamo process (Choe and Lee, 1996a,b; see also Akasofu and Lee, 2019). During the formation of the loop current, the magnetic field lines link in the corona. Moore et al. (2001) called this process as “runaway tether-cutting reconnection,” but they noted that this process is a linkage, not an energy production process as theories of magnetic reconnection presume.
Among a number of morphological models of solar flares, the model proposed by Moore et al. (2001; their Figure 1) is most illustrative in describing our dynamo model based on the electric current approach. They studied six major flares in detail and described them in terms of magnetic shear (sigmoid), the dark filament, tether-cutting, and rising prominence. Further, they noted that none of the six flares was associated with magnetic reconnection (energy release).
The disruption (or a reduction of the current loop) process is unknown. Kurokawa et al. (1987) found that a rising eruptive prominence showed untwisting motions, suggesting that the untwisting of helical magnetic fields is caused by a reduction of the current in the prominence, suggesting a partial current disruption.
In terms of the current line approach, one of the important future problems is instabilities of the current loop. (Alfven and Carlqvist, 1967) and Alfven (1981) suggested that the formation of the double layer is related to the process of the loop current disruption; the presence of the double layer is confirmed in the process of auroral electron acceleration (Karlsson, 2012).
In considering the double layer, it is important to note that flares are known to produce a wide-range energy of both protons and electrons, including sub-cosmic rays. Alfven (1981, pp. 33–35) suggested that the formation of a double layer along the loop current (along the dark filament) could produce the voltage of 108 volt (=P/I = 1019 w/10 11A). Since none of the plasma/wave processes seems to generate solar cosmic rays (Zharkova et al., 2011), the formation of the double layer along the loop current may be related to the causes of the loop current disruption.
Note:
(a) It is known that the linkage of magnetic fields does not always produce energy. In as early as 1975 on the basis of X-ray observations of the corona, Sheeley et al. (1975) noted: “these field lines usually interact by changing flux linkage, much as they do in a vacuum.” Further, summarizing the Yohko Conference on Magnetic Reconnection in the Solar Atmosphere, Tsuneta (1996) warned: “There are ubiquitous neutral sheet structures with scale size-103 km to several 105 km almost everywhere on the sun. It appears that most of these neutral sheet structures are static or dormant and do not show explosive reconnection.” Thus, it is questionable if an anti-parallel magnetic configuration can really be the source of energy for solar flares as theories of magnetic reconnection presume. The same can also be said about the magnetotail configuration for auroral substorms.
(b) The most important role of magnetic reconnection is to generate explosively a large amount of energy in a short time for substorms and solar flares, respectively. Thus, the most crucial confirmation of theories of magnetic reconnection must specifically demonstrate that almost the total energy for substorms and solar flare, respectively, can be rapidly released from an anti-parallel magnetic configuration by magnetic reconnection. Many of theories of magnetic reconnection discuss the process in general terms and do not show the total amount of released energy for solar flares and auroral substorms. Although there have been a number of observations which claim to confirm magnetic reconnection by direct observations around the X-line by satellites, none of them examined the total energy produced in the reconnection region and also the reconnection rate (cf. Angelopoulos et al., 2008; Burch et al., 2016; Torbert et al., 2018, on substorms; Su et al., 2013, on flares).
(c) Since the dynamo can produce both the power and field-aligned currents (accelerating electrons), the observed simultaneity between events around the X-line and substorms and flares, respectively, cannot be the concrete proof of magnetic reconnection. As stated in (c), the production of the total energy for substorms/flares must be demonstrated. Akasofu (2017b) showed that there is not enough magnetic energy in the magnetotail to cause auroral substorms, so that the energy supply from the magnetotail by magnetic reconnection cannot be significant, as confirmed by satellite observations (Miyashita et al., 2012).
Input–Output Relationship
In a study of auroral substorms, P(t), δ(t), ∫ P(t)dt, and ∫ δ(t)dt can be studied semi-quantitatively within the accuracy of observations and analyses. The dissipation rate δ is determined on the basis of the distribution of the (DD + UL) current in the ionosphere at six meridian chains of magnetic observatories. Then, the Joule heat production rate is then computed on the inferred ionospheric conductivity from ground magnetic observations. Figure 14 shows an example of the development of the Joule heat production during a substorm. This process was confirmed later by estimating the conductivity by satellite images.
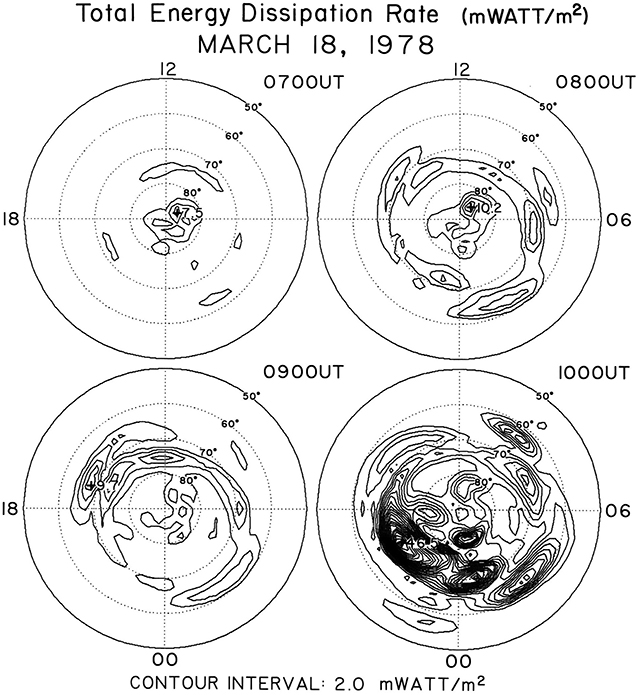
Figure 14. An example of the development of the Joule heat production rate δ (mw/m2 = erg/s) from the beginning to the maximum epoch during a substorm (Akasofu, 2017a).
From this study, the total power and energy generated by the solar wind–magnetosphere dynamo, P(t)dt, is found to be about the same as the total dissipation ∫ δ(t)dt, namely, ∫ P(t)dt ≈ ∫ δ(t)dt during individual substorms within the accuracy of observations and analyses. Thus, it may be concluded that the solar wind–magnetosphere dynamo power can supply the substorm energy without any extra processes, such as magnetic reconnection.
For flares, since these quantities are not available for individual flares, it is not possible to examine the input–output relationship at this time, although it is shown that a photospheric dynamo can provide the necessary power and energy.
Concluding Remarks
It is very unfortunate that the electric current approach has hardly been considered in both fields for at least three to four decades in both fields, despite the fact that Alfven (1967, 1981) emphasized that there are the two ways, the electric current line approach and the magnetic field line approach, by pointing out that current I and magnetic field B are related by the equation I = curl B. In fact, both approaches should have helped each other by recognizing their weakness and strength. The electric current approach must be developed more in studying both substorms and flares (compared with the magnetic field line approach) because the electric current approach has not been taken up by a large number of researchers and thus is still rather new in both fields.
It is for this very reason that this short review is attempted in order to promote joint researches of both phenomena in terms of the electric current approach since both fields will benefit each other with such an approach.
Author Contributions
The author confirms being the sole contributor of this work and has approved it for publication.
Conflict of Interest
The author declares that the research was conducted in the absence of any commercial or financial relationships that could be construed as a potential conflict of interest.
Acknowledgments
The author would like to acknowledge the late Professor Hannes Alfven who introduced him to the electric current approach. He would like to thank Professor Lou-Chuang Lee for his discussion on solar flares.
References
Akasofu, S.-I. (1964). The development of the auroral substorm. Planet. Space Sci. 12, 273–282. doi: 10.1016/0032-0633(64)90151-5
Akasofu, S.-I. (2017a). Auroral substorms: search for processes causing the expansion phase in terms of the electric current approach. Space Sci. Rev. 212, 341–381. doi: 10.1007/s11214-017-0363-7
Akasofu, S.-I. (2018). A new and quantitative prediction scheme for solar flares. J. Atmos. Solar-Terr. Phys. 174, 66–70. doi: 10.1016/j.jastp.2018.04.011
Akasofu, S.-I. (2019). The explosive characteristics of the aurora: the electric current line approach, frontiers in astronomy and space. Sciences 6, 1–13. doi: 10.3389/fspas.2019.00001
Akasofu, S.-I., and Lee, L.-C. (2019). On the explosive nature of auroral substorms and solar flares: the electric current approach. J. Atmosph. Space Phys. 186, 104–115. doi: 10.1016/j.jastp.2019.02.007
Akasofu, S. I. (2017b). Where is the magnetic energy for the expansion phase of auroral substorm accumulated? 2. The main body, not the magnetotail. J. Geophys. Res. 122, 8479–8487. doi: 10.1002/2016JA023074
Alfven, H. (1967). “The second approach to cosmical electrodynamics,” in The Birkeland Symposium on Auroras and Magnetic Storms, eds A. Egeland and J. Holtet (Paris: Center National de la Recherche Scientifique).
Alfven, H., and Carlqvist, P. (1967). Current in the solar atmosphere and a theory of solar flares. Sol. Phys. 1, 220–228. doi: 10.1007/BF00150857
Angelopoulos, V., McFadden, P. J., Larson, D., Carlson, C. W., Mende, S. B., Frey, H., et al. (2008). Tail reconnection triggering substorm. Onset. Sci. 321, 931–935. doi: 10.1126/science.1160495
Balasis, G., Daglis, I. A., Anastasiadis, A., Papadimitrou, C., Mandea, M., and Efaxias, K. (2011a). Universality in solar flares, magnetic storm and earthquake dynamics using Tsalis statistical mechnics. Phys. A. 390, 341–346. doi: 10.1016/j.physa.2010.09.029
Balasis, G., Daglis, I. A., Papadimitriou, C., Anastasiadis, A., Sandberg, I., and Eftaxias, K. (2011b). Quantifying dynamicl complexity of magnetic storms and sllar flares via nonextensive Tsallis. Entropy 13, 1865–1881. doi: 10.3390/e13101865
Balasis, G., Papadimitriou, C., Daglis, I. A., Anastasiadis, A., Sandberg, I., and Eftaxias, K. (2011c). Similarites between extreme events in the solar-terrestrial system by means of nonextensivity. Nolin. Proc. Geophys. 18, 563–572. doi: 10.5194/npg-18-563-2011
Bostrom, R. (1964). A model of the auroral electrojets. J. Geophys. Res. 69, 4983–4999. doi: 10.1029/JZ069i023p04983
Bothmer, V., and Schwenn, R. (1994). Eruptive prominences as source of magnetic clouds in the solar wind. Space Sci. Rev. 70, 215–220. doi: 10.1007/978-94-011-0930-7_39
Burch, J. L., Torbert, R. B., Phan, T. D., Chen, L. J., Moore, T. E., Ergun, R. E., et al. (2016). Electron-scale measurements of magnetic reconnectionin space. Science 352:aaf2939. doi: 10.1126/science.aaf2939
Chen, J., and Krall, J. (2003). Acceleration of coronal mass ejection. J. Geophys. Res. 108, 2-1–2-23. doi: 10.1029/2003JA009849
Choe, G. S., and Lee, L.-C. (1996a). Evolution of solar magnetic arches. I. Ideal MHD evolution under footpoint shearing. Astrophys. J. 472, 360–388. doi: 10.1086/178069
Choe, G. S., and Lee, L.-C. (1996b). Evolution of magnetic arcades. II. Effects of resistivity and solareruptive processes. Astrophys. J. 472, 372–388. doi: 10.1086/178070
DeForst, S. E., and McIlwain, C. E. (1971). Plasma clouds in the magnetosphere. J. Geophys. Res. 76, 3587–3611. doi: 10.1029/JA076i016p03587
Dodson, H. W., and Hedman, E. R. (1970). Major Hα flares in centers of activity with very little or no spot. Solar Phys. 13, 401–419. doi: 10.1007/BF00153560
Hirayama, T. (1974). Theoretical model of flares and prominences. I. Evaporation flare model. Solar Phys. 1974, 323–338. doi: 10.1007/BF00153671
Karlsson, T. (2012). “The acceleration region of stable auroral arcs,” in Auroral Phenomenology and Magnetospheric Processes: Earthand Other Planets, AGUMonograph, Vol. 197, eds A. Keiling, E. Donovan, F. Bagenal, and T. Karlsson.
Kosovovichev, A. G., and Duvall, T. L. (2010). “Investigation of a sunspot complex by time-distance helioseismology,” in The Physics of the Sun and Star Spots, eds P. D. Chodhary and K. G. Strssmeter (Germany: Proceedings of IAU Symposium), 320–324.
Kurokawa, H., Hanaoka, Y, Shibata, K., and Uchida, Y. (1987). Rotating eruption of untwisting filament triggered by the 3B flare of 25 April. Solar Phys. 108, 251–264. doi: 10.1007/BF00214165
Lee, L.-C., Choe, C. S., and Akasofu, S.-I. (1995). “A simulation study of the formation of solar promineneces,” in Space Plasma: Coupling Between Small and Medium Scale Processes, eds M. Ashour-Abdalla, T. Chang, and P. Dusenbery (Washington, DC: AGU, 29–42.
Lui, A. T. Y. (2011), Reduction of the cross-tail current during near earth depolarization with multisatellite observations. J. Geophys. Res. 116:A12239. doi: 10.1029/2011JA017107.
Lui, A. T. Y., and Kamide, Y. (2003), A fresh perspective of the substorm currentsystem its dynamo. Geophys. Res. Lett. 30, 12-1–12-4. doi: 10.1029/2003GL017835
Miyashita, Y., Machida, S., Nose, M., Liou, K., Saito, Y., and Peterso, W. R. (2012). A statistical study of energy release and transport midway between the magnetic reconnection and initial depolarization regions in the near-Earth magnetotail associated with sudden expansion onset. J. Geophys. Res. Autom. 117:A11214. doi: 10.1029/2012JA017925
Moore, R. L., Sterling, A. C., Hudson, H. S., and Lemen, J. R. (2001). Onset of the magnetic explosion in solar flares and coronal mass ejections. Astophys. J. 552, 833–848. doi: 10.1086/320559
Ruzdjak, V., Vrsnak, B., Schrool, A., and Brajsa, R. A. (1989). Comparison of Hα and soft x-ray characteristics of spotless and spot group flares. Solar Phys. 123, 309–316. doi: 10.1007/BF00149108
Sheeley, N. R., Bohlin, J. D., Brueekner, G. E., Purcell, J., Scherrer, V., and Tousey, R. (1975). XUV observations of coronal magnetic fiels. Solar Phys. 40, 103–121. doi: 10.1007/BF00183155
Su, Y., Veronig, H. M., Dennis, G. D., Wang, T., Temmerand, M., and Gan, W. (2013). Imaging coronal magnetic-field reconnection in a solar flare. Nat. Phys. 9, 489–493. doi: 10.1038/nphys2675
Sweet, P. A. (1958). “The neutral point theory of solar flares,” in Electromagnetic Phenomena Cosmical Physics, ed Lehnert, B (Cambridge University Press), 123–134.
Torbert, R. B., Burch, J. L., Phan, T. D., Hesse, M., Argall, M. R., Shuster, J., et al. (2018). Electron-scale dynamics of the diffusion region during symmetric magnetic reconnection in space. Science 362, 1391–1395. doi: 10.1126/science.aat2998
Tsuneta, S. (1996). “Magnetic reconnection: open issues,” in Magnetic Reconnection in the Solar Atmosphere ASP Conference Series, eds R. D. Bentley and J. T. Masiska (San Francisco, CA, 439–444.
Wang, H., Ewell, M. H., and Zirin, H. (1994). Vector magnetic field changes associated with X-class flares. Astrophys. J. 424, 436–443. doi: 10.1086/173901
Yang, G., Xu, Y., Cao, W., Wang, H., Denker, C., and Rimmele, T. R. (2004). Photospheric shear flows along the magnetic neutral line of active region 10486 prior to an X10 Flare. Astro. J. Lett. 617:L151–L154.
Keywords: auroral substorms, solar flares, electric currents, magnetic reconnection, photospheric dynamo
Citation: Akasofu S-I (2020) Electric Current Approach Studying Both Auroral Substorms and Solar Flares Together. Front. Astron. Space Sci. 7:4. doi: 10.3389/fspas.2020.00004
Received: 16 September 2019; Accepted: 31 January 2020;
Published: 06 March 2020.
Edited by:
Chi Wang, National Space Science Center (CAS), ChinaReviewed by:
Julia E. Stawarz, Imperial College London, United KingdomGeorgios Balasis, National Observatory of Athens, Greece
Copyright © 2020 Akasofu. This is an open-access article distributed under the terms of the Creative Commons Attribution License (CC BY). The use, distribution or reproduction in other forums is permitted, provided the original author(s) and the copyright owner(s) are credited and that the original publication in this journal is cited, in accordance with accepted academic practice. No use, distribution or reproduction is permitted which does not comply with these terms.
*Correspondence: Syun-Ichi Akasofu, c2FrYXNvZnVAYWxhc2thLmVkdQ==