 Anton A. Reva
 Sergey V. Kuzin
 Alexey S. Kirichenko
 Artem S. Ulyanov
 Ivan P. Loboda
 Sergey A. Bogachev
- Laboratory of the X-ray Astronomy of the Sun, P.N. Lebedev Physical Institute, Moscow, Russia
Investigations of solar activity require information about plasma in a wide range of temperatures. Generally, researchers require observations from telescopes producing monochromatic images of coronal plasma with cool, warm, and hot temperatures. Until now, monochromatic telescopic imaging has been made only in the Mg XII 8.42 Å line with the Mg XII spectroheliograph on board CORONAS-I, CORONAS-F, and CORONAS-PHOTON satellites. The Mg XII spectroheliograph used Bragg crystal optics. Its design is based on two main principles: (1) to select the working wavelength and the crystal in such a way that reflection occurs at small incident angles; (2) to use the aperture of the mirror as a spectral filter. We believe that these design principles can be applied to other spectral lines. In this article, we will review the design of the Mg XII spectroheliograph and present our thoughts on how to apply these principles to the Si XIV 6.18 Å and Si XIII 6.65 Å lines. A combination of the monochromatic Mg XII 8.42 Å, Si XIV 6.18 Å, and Si XIII 6.65 Å images will help us to study the dynamics of the hot plasma in the solar corona.
1. Introduction
Plasma in solar phenomena can be at a wide range of temperatures. Quiet Sun and active regions are at temperatures around 1 MK, while during flares, the coronal plasma can reach temperatures beyond 10 MK. To study solar activity, we need information about the plasma at different temperatures. Generally, researchers require observations from telescopes producing monochromatic images of coronal plasma images with cool, warm, and hot temperatures.
Imaging spectrometers—such as the Extreme ultraviolet Imaging Spectrometer (Culhane et al., 2007) on board the Hinode satellite (Kosugi et al., 2007), the Coronal Diagnostic Spectrometer (Harrison et al., 1995) on board the Solar and Heliospheric Observatory (Domingo et al., 1995), the Interface Region Imaging Spectrograph (De Pontieu et al., 2014), or Marshall Grazing Incidence X-ray Spectrometer (MaGIXS; Kobayashi et al., 2011; Athiray et al., 2019)—can achieve this goal. These instruments build raster images of the solar corona in multiple spectral lines. However, they have a small field of view or long exposure times. The small field of view lowers the chances of events registration, and long exposure time limits our ability to study the dynamics of the event.
On the other hand, the most commonly used extreme ultraviolet (EUV) and X-ray telescopes—such as Atmospheric Imaging Assembly (Lemen et al., 2012) on board the Solar Dynamics Observatory (Pesnell et al., 2012) or the X-Ray Telescope (Golub et al., 2007) on board the Hinode satellite—have large field of view and high temporal resolution. However, their images are not monochromatic, and the majority of their channels are sensitive to a broad range of temperatures. Wide temperature response functions complicate plasma diagnostics.
One of the solutions to this problem is to use a focusing X-ray telescope with a photon-counting detector. In this way, we will have information about the location of the emission and its spectrum. An example of this approach is the sounding rocket experiment Focusing Optics X-ray Solar Imager (FOXSI; Ishikawa et al., 2014) and the upcoming PhoENiX mission (Narukage, 2019).
Another approach is to use monochromatic X-ray telescopes based on the Bragg crystal optics. However, such observations were made only in the Mg XII 8.42 Å line with the Mg XII spectroheliograph (Kuzin et al., 1994; Zhitnik et al., 2003b). In this article, we will review the design of the Mg XII spectroheliograph and present our thoughts on how these principles could be applied to other spectral lines.
2. Design Principles
An X-ray spectroheliograph consists of a spherical crystal mirror and a detector (see Figure 1). The reflection occurs only at those areas of the mirror, where Wulff–Bragg's condition is satisfied:
where d is the interplanar distance of the crystal, θ is the incident angle, m is the order of diffraction, and λ is the wavelength.
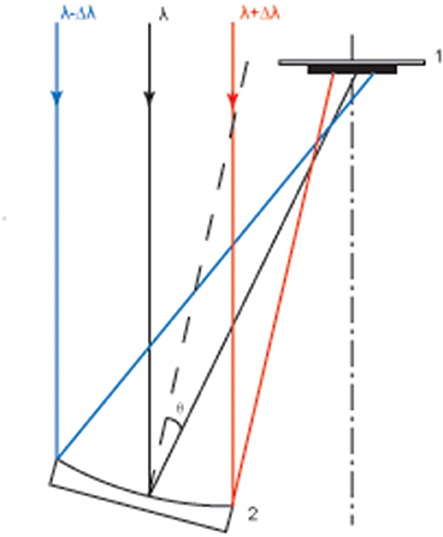
Figure 1. Optical scheme of the X-ray spectroheliograph: (1) detector; (2) crystal mirror. Red lines indicate rays with a maximum wavelength that could be reflected from the mirror. Blue lines indicate rays with a minimum wavelength that could be reflected from the mirror.
The design of the instrument is based on two main principles. The first idea is to choose the crystal and working wavelength of the instrument in such a way that λ ≈ 2d. This choice will make θ small. The aberrations of an optical scheme are less prominent when incident angles are close to normal. Therefore, this choice will allow us to build an instrument with relatively good spatial resolution.
The second idea is to use the aperture of the mirror as a spectral filter. The aperture of the mirror limits the range of the incident angles that could be reflected from the mirror. As a consequence, this limits the field of view of the instrument and the range of the wavelengths that could reflect from the mirror (see Figure 1). By varying the size of the mirror, we can change the wavelength range of the instrument.
To calculate the wavelength range of the instrument, we differentiate equation (1):
where Δθ is the range of incident angles that could reflect from the mirror, and Δλ is the corresponding range of the wavelengths that could reflect from the mirror.
To observe full Sun, we need Δθ ≈ ±1°. In the 1–10 Å spectral range, θ will be in the range of 5–10°. We put these values in Equation (2) and obtain that Δλ ≈ ±0.02 Å. If the chosen spectral line is not blended with other lines, it is possible that only one line in the solar spectrum will be within the instrument wavelength range.
In summary, to build a monochromatic X-ray imager, the followings steps are necessary:
1. Select the working wavelength and crystal in such a way that λ ≈ 2d;
2. Make sure that the chosen spectral line is not blended with other lines;
3. Select the mirror size that will make Δλ small enough for the instrument to be monochromatic, and Δθ large enough to observe the full Sun.
The optical scheme of the instrument is not flexible. For a given λ and 2d, θ is fixed. The only thing that we can change in the optical scheme is its size. In the 1–10 Å spectral range, θ will be in the range of 5–10°. At such incident angles, the spherical aberration will amount to several arcseconds. It will be the main factor that determines the spatial resolution of the instrument.
The instrument detector should be sensitive to the X-ray emission and be able to work in the space environment. It is desirable that the pixel size is less than the instrument spatial resolution.
More technical details on design, fabrication, and optical testing of the X-ray spectroheliographs could be read in Kuzin et al. (1994).
3. History of the Observations
3.1. Mg XII Spectroheliograph
At the time of writing, these design principles were successfully applied in a space environment only for observations in the Mg XII 8.42 Å line with the Mg XII spectroheliograph. The instrument used a quartz mirror with 2d = 8.501 Å. The incident angle for the chosen λ and 2d is 8°. The angular resolution of the instrument was 4′′, which was determined by the spherical aberration. The size of the mirror was chosen to have Δθ = ±1° and Δλ = ±0.02 Å.
In the wavelength range of the Mg XII spectroheliograph (8.40–8.44 Å), only Mg XII 8.42 Å line is present in the solar spectrum (see Figure 2). This line is Lyα doublet of the hydrogen-like Mg ion: λ1 = 8.4192 Å ( – ) and λ2 = 8.4246 Å ( – ). It emits at a temperature higher than 4 MK. The Mg XII images mark the location of the heating in the solar corona, which makes the Mg XII spectroheliograph a useful instrument in studying the dynamics of hot plasma.
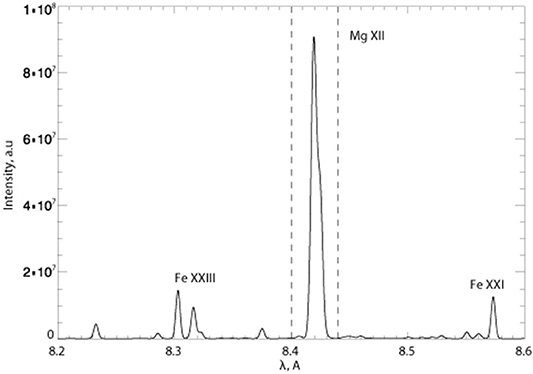
Figure 2. Synthetic spectrum of the flare (solid line) and wavelength range of the Mg XII spectroheliograph (dashed lines). The spectrum was calculated with the CHIANTI package (Dere et al., 1997; Del Zanna et al., 2015).
The Mg XII spectroheliograph operated on board CORONAS-I (Sobel'Man et al., 1996), CORONAS-F (Zhitnik et al., 2002, 2003a; Zhithik et al., 2005), and CORONAS-PHOTON satellites (Kotov, 2011; Kuzin et al., 2011). The instrument is a part of the future missions such as Interhelioprobe (Kuznetsov et al., 2016) and KORTES (Shestov et al., 2014). Below we will briefly review these missions.
3.2. CORONAS-I
CORONAS-I was the first satellite that carried the Mg XII spectroheliograph (Sobel'Man et al., 1996). The satellite observed the Sun from March 12, 1994 to July 5, 1994.
Due to the satellite's short lifetime, the Mg XII spectroheliograph obtained a very limited number of images. Nonetheless, this mission showed that described above design principles could be successfully implemented in the space environment.
3.3. CORONAS-F
CORONAS-F was launched in 2001. The satellite carried SPIRIT complex: a set of instruments that observed the solar corona in EUV and soft X-ray. The SPIRIT included two Mg XII spectroheliographs.
The example of the obtained Mg XII images is shown in Figure 3. The Mg XII images differ from the images obtained by Extreme-Ultraviolet Imaging Telescope (EIT; Delaboudinière et al., 1995) or Soft X-ray Telescope (SXT; Tsuneta et al., 1991): they contain signal only from hot plasma without any low-temperature background. Due to the use of the spherical crystal mirror, the Mg XII spectroheliograph had dispersion. In the Mg XII images, the spatial component was convolved with the spectrum of the Mg XII line. Two Mg XII channels of the SPIRIT complex had perpendicular directions of the dispersion. Comparing images in the two channels, we can distinguish the spatial component from the spectral one.
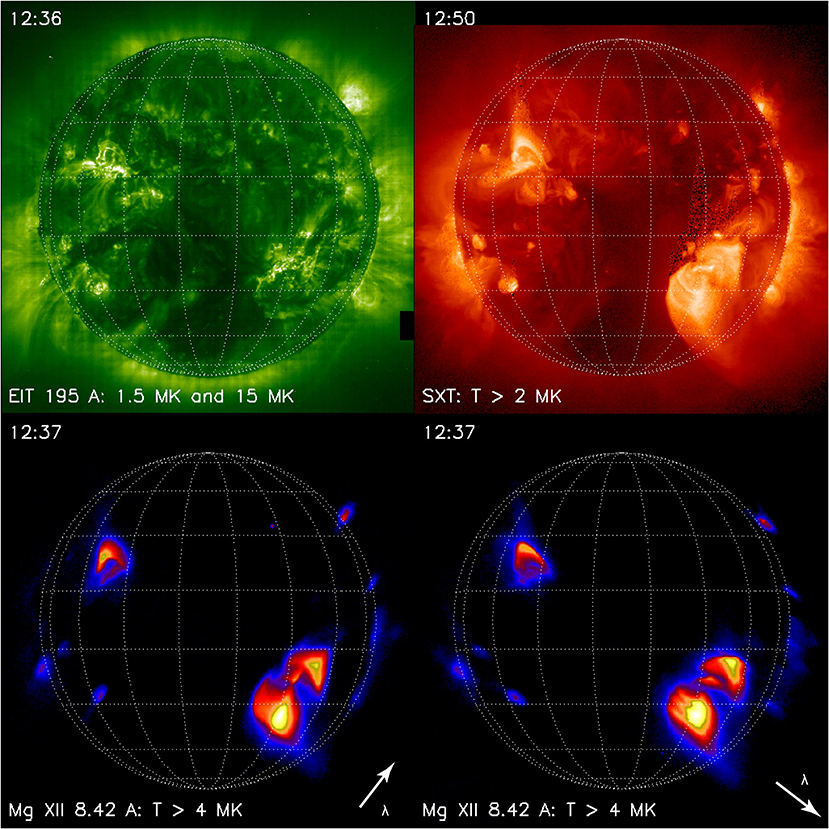
Figure 3. Example of the images obtained by the Mg XII spectroheliograph on board CORONAS-F/SPIRIT. Top left: the EIT 195 Å; top right: the SXT; bottom left: the Mg1 channel of the Mg XII spectroheliograph; bottom right: the Mg2 channel of the Mg XII spectroheliograph. Images were taken on December 11, 2001. In the Mg XII images, blue corresponds to low intensities and yellow corresponds to high intensities. Arrows indicate the direction of the dispersion.
The Mg XII spectroheliographs operated from 2001 till 2003. During these years, the Sun was in the maximum of the activity, and plenty of information about hot plasma dynamics was recorded. These data were used to study large flares (Grechnev et al., 2006; Urnov et al., 2007; Shestov et al., 2010; Reva et al., 2015), micro-activity (Reva et al., 2012), and coronal heating (Reva et al., 2018).
3.4. CORONAS-PHOTON
CORONAS-PHOTON was launched in February 2009 and worked until November 2009. The satellite carried the TESIS complex that included the Mg XII spectroheliograph. The Mg XII spectroheliograph on board CORONAS-PHOTON had a larger mirror and a more sensitive detector compared to the CORONAS-F/SPIRIT version.
In 2009, the Sun was in the minimum of the solar activity. The data were mainly used to study microflares (Kirichenko and Bogachev, 2017a,b) and hot plasma dynamics during Coronal Mass Ejection (CMEs) (Kirichenko and Bogachev, 2013; Reva et al., 2017).
3.5. Future Missions
At the time of writing, the Mg XII spectroheliograph is included in two missions: Interhelioprobe (Kuznetsov et al., 2016) and KORTES (Shestov et al., 2014).
Interhelioprobe is a mission of the Russian Federal Space Agency. The satellite will study the Sun from a close distance (up to 0.3 AU) and from out of the ecliptic plane (up to 30°). Interheliprobe will carry instruments that will study the Sun in a wide spectral range: from hard X-ray to visible light, with a launch date after 2025.
One of the instruments that Interhelioprobe will carry is the Mg XII spectroheliograph. Close distance to the Sun will effectively increase the instrument's spatial resolution and sensitivity, which will help to study phenomena in better detail.
KORTES is a complex of instruments that will study the solar activity in the EUV and X-ray wavelength range. It will be installed on the International Space Station. The main goal of the KORTES is to study flares. KORTES will include the Mg XII spectroheliograph that will have similar parameters to CORONAS-F/SPIRIT version of the instrument. The estimated launch date is 2024.
4. New Spectral Channels
The Mg XII spectroheliograph provides unique information about hot plasma in the solar corona. However, an image in only one wavelength is not enough to perform spectral diagnostics. Ideally, we would like to have a set of monochromatic images obtained at different spectral lines. As we will see, there is a need to apply the described above design principles to other spectral lines.
To create an instrument that is similar to the Mg XII spectroheliograph and works in a different wavelength, we need to select λ and 2d that satisfy the following criteria:
1. λ should be a strong line in the solar spectra that have some scientific value;
2. The chosen spectral line should not be blended with other lines;
3. The crystal that can be used in space environment;
4. 2d ≈ λ, to ensure that θ is small;
5. The instrument should be monochromatic.
We propose to apply the described design principles to the Si XIV 6.18 Å and Si XIII 6.65 Å lines. These are strong lines in the solar spectrum (see Figure 4). The contribution functions of these lines differ from the Mg XII 8.42 Å line (see Figure 5). Therefore, we can use their ratio for temperature diagnostics.
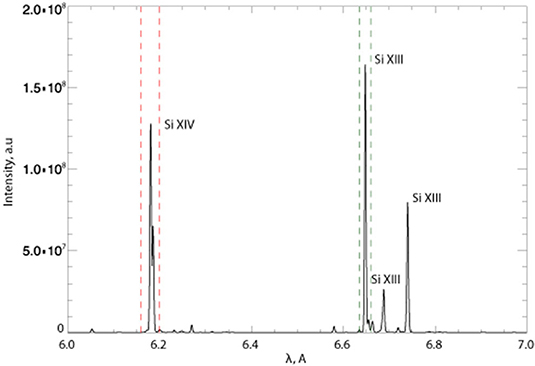
Figure 4. Synthetic spectrum of the flare and wavelength range of the proposed instruments. The red dashed line indicates the wavelength range for the Si XIV line, and the green dashed line for the Si XIII line. The spectrum was calculated with the CHIANTI package (Dere et al., 1997; Del Zanna et al., 2015).
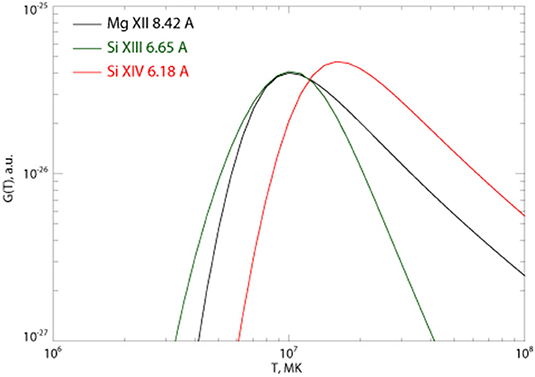
Figure 5. Contribution functions. Black: Mg XII 8.42 Å line; green: Si XIII 6.65 Å line; red: Si XIV 6.18 Å line. These data do not include the contribution from the instrument optics and detector.
Figure 6 shows the intensity ratios of the Mg XII 8.42 Å, Si XIV 6.18 Å, and Si XIII 6.65 Å lines. The ratio of the Mg XII and Si XIII lines is sensitive to temperature in the range of 3–8 MK. The ratio of the Si XIV and Mg XII lines is sensitive to temperature in the range of 5–20 MK. Finally, the ratio of the Si XIV and Si XIII lines can be used for diagnostics in a wide range of temperatures. As we see, these three lines will help to analyze the temperature of warm and hot plasma.
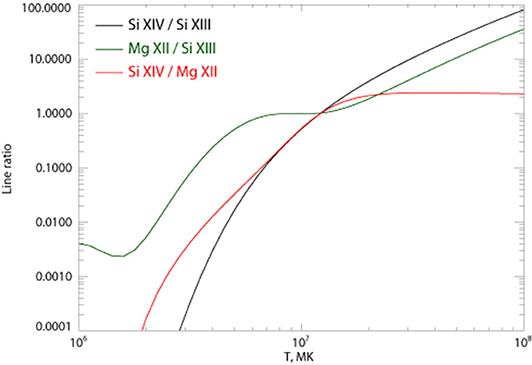
Figure 6. Intensity ratios of the proposed lines. Black: intensity ratio of the Si XIV and Si XIII lines; green: intensity ratio of the Mg XII and Si XIII lines; red: intensity ratio of the Si XIV and Mg XII lines.
Usually, in solar X-ray spectroscopy, one instrument registers a signal from several spectral lines (Neupert et al., 1969; Strong et al., 1991; Kobayashi et al., 2011; Siarkowski et al., 2016). We propose to use three different instruments for three different spectral lines.
As a material for the mirror for the Si XIV 6.18 Å channel, we propose to use the silicon crystal with 2d = 6.278 Å. For λ = 6.18 Å and 2d = 6.278 Å, the incident angles is equal θ = 10.1°. By choosing the size of the mirror that makes Δθ = ±1°, we limit the spectral range to Δλ = ±0.02 Å. In the wavelength range 6.16–6.20 Å, only Si XIV 6.18 Å line is present in the solar spectrum (see Figure 4). Therefore, the instrument will build monochromatic images.
As a material for the mirror for the Si XIII 6.65 Å channel, we propose to use the quartz crystal with 2d = 6.686 Å. For λ = 6.65 Å and 2d = 6.686 Å, the incident angles is equal θ = 6.1°. By choosing the size of the mirror that makes Δθ = ±1°, we limit the spectral range to Δλ = ±0.012 Å. In the wavelength range 6.64–6.66 Å, only Si XIII 6.65 Å line is present in the solar spectrum (see Figure 4). As we see, this channel will also be monochromatic.
Manufacturing of the Si XIV 6.18 Å and Si XIII 6.65 Å spectroheliographs would not require the development of significantly new technologies. These instruments use the design ideas that were tested in the space environment. We think that they can be created with modern technologies within the constraints of limited funding.
5. Forward Modeling
In the solar corona, the conduction is effective along the magnetic field lines. However, the conduction in the direction perpendicular to the magnetic field is inhibited. Due to this insulation, areas with significantly different temperatures can exist very close to each other. Therefore, it is important for solar telescopes to be able to distinguish cool, warm, and hot plasma.
To see how the proposed spectral lines tackle this problem, we will model synthetic images that should be observed in these lines. For the modeling, we use a simplistic structure shown in Figure 7a. It consists of the quiet Sun region (blue), the active region (green), and two hot loops. One loop has a temperature of 5 MK (yellow), and another has a temperature of 10 MK (red).
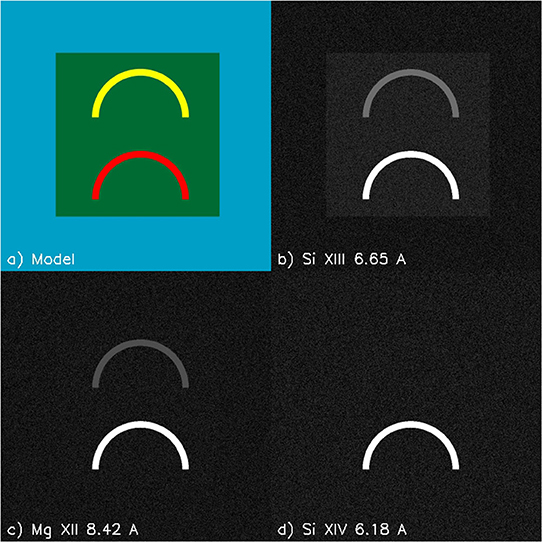
Figure 7. Forward modeling. (a) Model used for calculations: blue corresponds to the quiet Sun; green corresponds to the active region; yellow is the loop with 5 MK temperature; red is the loop with 10 MK temperature. (b) Synthetic image in the Si XIII 6.65 Å line. (c) synthetic image in the Mg XII 8.42 Å line. (d) Synthetic image in the Si XIV 6.18 Å line. The intensity in the images is scaled as I1/4.
For each pixel, we calculate the intensity that should be observed in the proposed spectral lines. For this purpose, we use the following formula:
where I is the calculated intensity in a spectral channel, G(T) is the contribution function of the channel, and DEM(T) is the differential emission measure (DEM) of the pixel. For values of the G(T), we use the data from Figure 5.
Figure 8 shows the DEMs used for the forward modeling. For the quiet Sun, we used the data obtained by Brooks et al. (2009). For the active region, we used the modified DEM of the non-flaring active region obtained by Reva et al. (2018). The DEM obtained by Reva et al. (2018) has a high-temperature tail. It is caused by the limited sensitivity of the instruments, and it is an upper limit on the DEM of the hot plasma. For illustrational purposes, we want the active region in our model to have only warm plasma. To achieve this, we extrapolated the values of the DEM above 5 MK (see Figure 8). For the hot loops, we used narrow DEMs with temperature peaks at 5 and 10 MK.
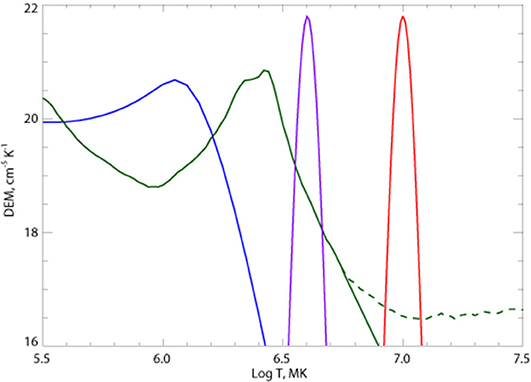
Figure 8. DEMs used for the forward modeling. Blue line: The DEM of the quiet Sun; green dashed line: the DEM obtained by Reva et al. (2018); green line: the DEM of the active region; purple line: the DEM of the 5 MK loop; red line: the DEM of the 10 MK loop.
Figure 7 shows the results of the forward modeling. In the Si XIII 6.55 Å image (see Figure 7b), we see both loops and a faint emission from the active region. In the Mg XII 8.42 Å image (see Figure 7c), the active region disappears. Both loops are visible, but the 5 MK loop is fainter. In the Si XIV 6.18 Å image (see Figure 7d), only 10 MK loop is visible. This demonstrates the utility of the proposed lines to distinguish hot and warm plasma to study heating dynamics in solar phenomena.
6. Conclusion
In this work, we described the design principles of the monochromatic X-ray imagers. These principles were successfully applied for observations in the Mg XII 8.42 Å line on board CORONAS-I, CORONAS-F, and CORONAS-PHOTON satellites. The obtained results were used to study hot plasma in flares, microflares, and CMEs.
Although the Mg XII data provide unique information about the hot plasma dynamics, their diagnostic possibilities are limited. There is a need for instruments that build monochromatic images in other spectral lines.
In this work, we proposed to apply the design principles of the monochromatic X-ray imagers to the Si XIV 6.18 Å and Si XIII 6.65 Å lines. The addition of these lines will extend the possibilities of hot plasma diagnostics.
At the time of writing, the Si XIV 6.18 Å and Si XIII 6.65 Å monochromatic X-ray imagers are not a part of any confirmed space mission. However, we think that this is an important and needed step in further developing of these types of instruments. If we create several monochromatic imagers that work in different wavelengths, we will not only have telescopic images of the hot plasma, we will have the ability for spectral diagnostics of its temperature.
Currently, the interest to the soft X-ray spectral range is revitalizing. The upcoming ChemiX instrument on board the Interhelioprobe satellite will register full Sun spectra in the range of 1.5–8.8 Å ( Kuznetsov et al., 2016; Siarkowski et al., 2016). Marshall Grazing Incidence X-ray Spectrometer (MaGIXS) is an upcoming rocket flight experiment, which will perform stigmatic imaging spectroscopy in the 6–24 Å spectral range (Kobayashi et al., 2011; Athiray et al., 2019). The monochromatic X-ray imagers, ChemiX, and MaGIXS will observe the same spectral range using different approaches: monochromatic imaging, full Sun spectroscopy, and stigmatic imaging spectroscopy. These methods augment each other, and we believe that solar physics will benefit from joint observations of these instruments.
Data Availability Statement
The original contributions presented in the study are included in the article/Supplementary Material, further inquiries can be directed to the corresponding author/s.
Author Contributions
AR, SK, AK, AU, IL, and SB wrote a sections of this article. All authors contributed to the article and approved the submitted version.
Funding
This research was funded by the Laboratory of the X-ray Astronomy of the Sun, which is located at P.N. Lebedev Physical Institute.
Conflict of Interest
The authors declare that the research was conducted in the absence of any commercial or financial relationships that could be construed as a potential conflict of interest.
Acknowledgments
CHIANTI was a collaborative project involving George Mason University, the University of Michigan (USA), University of Cambridge (UK), and NASA Goddard Space Flight Center (USA).
Supplementary Material
The Supplementary Material for this article can be found online at: https://www.frontiersin.org/articles/10.3389/fspas.2021.645062/full#supplementary-material
References
Athiray, P. S., Winebarger, A. R., Barnes, W. T., Bradshaw, S. J., Savage, S., Warren, H. P., et al. (2019). Solar active region heating diagnostics from high-temperature emission using the MaGIXS. Astrophys. J. 884, 24. doi: 10.3847/1538-4357/ab3eb4
Brooks, D. H., Warren, H. P., Williams, D. R., and Watanabe, T. (2009). Hinode/extreme-ultraviolet imaging spectrometer observations of the temperature structure of the quiet corona. Astrophys. J. 705, 1522–1532. doi: 10.1088/0004-637X/705/2/1522
Culhane, J. L., Harra, L. K., James, A. M., Al-Janabi, K., Bradley, L. J., Chaudry, R. A., et al. (2007). The EUV imaging spectrometer for Hinode. Solar Phys. 243, 19–61. doi: 10.1007/s01007-007-0293-1
De Pontieu, B., Title, A. M., Lemen, J. R., Kushner, G. D., Akin, D. J., Allard, B., et al. (2014). The interface region imaging spectrograph (IRIS). Solar Phys. 289, 2733–2779. doi: 10.1007/s11207-014-0485-y
Del Zanna, G., Dere, K. P., Young, P. R., Landi, E., and Mason, H. E. (2015). CHIANTI - An atomic database for emission lines. Version 8. Astron. Astrophys. 582:A56. doi: 10.1051/0004-6361/201526827
Delaboudiniére, J., Artzner, G. E., Brunaud, J., Gabriel, A. H., Hochedez, J. F., Millier, F., et al. (1995). EIT: extreme-ultraviolet imaging telescope for the SOHO mission. Solar Phys. 162, 291–312. doi: 10.1007/978-94-009-0191-9_8
Dere, K. P., Landi, E., Mason, H. E., Monsignori Fossi, B. C., and Young, P. R. (1997). CHIANTI - an atomic database for emission lines. Astron. Astrophys. Suppl. 125, 149–173. doi: 10.1051/aas:1997368
Domingo, V., Fleck, B., and Poland, A. I. (1995). The SOHO mission: an overview. Solar Phys. 162, 1–37. doi: 10.1007/978-94-009-0191-9_1
Golub, L., Deluca, E., Austin, G., Bookbinder, J., Caldwell, D., Cheimets, P., et al. (2007). The x-ray telescope (XRT) for the Hinode mission. Solar Phys. 243, 63–86. doi: 10.1007/s11207-007-0182-1
Grechnev, V. V., Kuzin, S. V., Urnov, A. M., Zhitnik, I. A., Uralov, A. M., Bogachev, S. A., et al. (2006). Long-lived hot coronal structures observed with CORONAS-F/SPIRIT in the Mg XII line. Solar Syst. Res. 40, 286–293. doi: 10.1134/S0038094606040046
Harrison, R. A., Sawyer, E. C., Carter, M. K., Cruise, A. M., Cutler, R. M., Fludra, A., et al. (1995). The coronal diagnostic spectrometer for the solar and heliospheric observatory. Solar Phys. 162, 233–290. doi: 10.1007/BF00733431
Ishikawa, S., Glesener, L., Christe, S., Ishibashi, K., Brooks, D. H., Williams, D. R., et al. (2014). Constraining hot plasma in a non-flaring solar active region with FOXSI hard X-ray observations. Pub. Astron. Soc. Japan 66:S15. doi: 10.1093/pasj/psu090
Kirichenko, A. S., and Bogachev, S. A. (2013). Long-duration plasma heating in solar microflares of X-ray class A1.0 and lower. Astron. Lett. 39, 797–807. doi: 10.1134/S1063773713110042
Kirichenko, A. S., and Bogachev, S. A. (2017a). Plasma heating in solar microflares: statistics and analysis. Astrophys. J. 840:45. doi: 10.3847/1538-4357/aa6c2b
Kirichenko, A. S., and Bogachev, S. A. (2017b). The relation between magnetic fields and x-ray emission for solar microflares and active regions. Solar Phys. 292:120. doi: 10.1007/s11207-017-1146-8
Kobayashi, K., Cirtain, J., Golub, L., Winebarger, A., Hertz, E., Cheimets, P., et al. (2011). “The Marshall grazing incidence x-ray spectrograph (MaGIXS),” in Society of Photo-Optical Instrumentation Engineers (SPIE) Conference Series, eds S. L. O'Dell and G. Pareschi (San Diego, CA). doi: 10.1117/12.894071
Kosugi, T., Matsuzaki, K., Sakao, T., Shimizu, T., Sone, Y., Tachikawa, S., et al. (2007). The Hinode (Solar-B) mission: an overview. Solar Phys. 243, 3–17. doi: 10.1007/s11207-007-9014-6
Kotov, Y. D. (2011). Scientific goals and observational capabilities of the CORONAS-PHOTON solar satellite project. Solar Syst. Res. 45, 93–96. doi: 10.1134/S0038094611020079
Kuzin, S. V., Andreev, E. A., Korneev, V. V., Krutov, V. V., Mitropolosky, M. M., Pertzov, A. A., et al. (1994). “X-ray spectroheliographs with the Bragg focusing optics for the CORONAS project: design, fabrication, and optical testing,” in X-Ray and Ultraviolet Spectroscopy and Polarimetry, ed S. Fineschi (San Diego, CA), 242–250. doi: 10.1117/12.193192
Kuzin, S. V., Zhitnik, I. A., Shestov, S. V., Bogachev, S. A., Bugaenko, O. I., Ignat'ev, A. P., et al. (2011). The TESIS experiment on the CORONAS-PHOTON spacecraft. Solar Syst. Res. 45, 162–173. doi: 10.1134/S0038094611020110
Kuznetsov, V. D., Zelenyi, L. M., Zimovets, I. V., Anufreychik, K., Bezrukikh, V., Chulkov, I. V., et al. (2016). The Sun and heliosphere explorer - the Interhelioprobe mission. Geomagnet. Aeron. 56, 781–841. doi: 10.1134/S0016793216070124
Lemen, J. R., Title, A. M., Akin, D. J., Boerner, P. F., Chou, C., Drake, J. F., et al. (2012). The Atmospheric Imaging Assembly (AIA) on the Solar Dynamics Observatory (SDO). Solar Phys. 275, 17–40. doi: 10.1007/978-1-4614-3673-7_3
Narukage, N. (2019). “Satellite mission: PhoENiX (Physics of Energetic and Non-thermal plasmas in the X (= magnetic reconnection) region),” in American Astronomical Society Meeting Abstracts #234 (St. Louis, MO), 126.
Neupert, W. M., White, W. A., Gates, W. J., Swartz, M., and Young, R. M. (1969). X-ray and extreme ultraviolet (1 400 Å) spectroscopy of the sun, from OSO-III. Solar Phys. 6, 183–192. doi: 10.1007/BF00150943
Pesnell, W. D., Thompson, B. J., and Chamberlin, P. C. (2012). The solar dynamics observatory (SDO). Solar Phys. 275, 3–15. doi: 10.1007/s11207-011-9841-3
Reva, A., Shestov, S., Bogachev, S., and Kuzin, S. (2012). Investigation of hot x-ray points (HXPs) using spectroheliograph Mg XII experiment data from CORONAS-F/SPIRIT. Solar Phys. 276, 97–112. doi: 10.1007/s11207-011-9883-6
Reva, A., Shestov, S., Zimovets, I., Bogachev, S., and Kuzin, S. (2015). Wave-like formation of hot loop arcades. Solar Phys. 290, 2909–2921. doi: 10.1007/s11207-015-0769-x
Reva, A., Ulyanov, A., Kirichenko, A., Bogachev, S., and Kuzin, S. (2018). Estimate of the upper limit on hot plasma differential emission measure (DEM) in non-flaring active regions and nanoflare frequency based on the Mg XII spectroheliograph data from CORONAS-F/SPIRIT. Solar Phys. 293:140. doi: 10.1007/s11207-018-1363-9
Reva, A. A., Kirichenko, A. S., Ulyanov, A. S., and Kuzin, S. V. (2017). Observations of the coronal mass ejection with a complex acceleration profile. Astrophys. J. 851:108. doi: 10.3847/1538-4357/aa9986
Shestov, S. V., Kuzin, S. V., Urnov, A. M., Ul'Yanov, A. S., and Bogachev, S. A. (2010). Solar plasma temperature diagnostics in flares and active regions from spectral lines in the range 280-330 Åin the SPIRIT/CORONAS-F experiment. Astron. Lett. 36, 44–58. doi: 10.1134/S1063773710010056
Shestov, S. V., Ulyanov, A. S., Vishnyakov, E. A., Pertsov, A. A., and Kuzin, S. V. (2014). “Complex of instrumentation KORTES for the EUV and x-ray imaging and spectroscopy of the solar corona,” in Space Telescopes and Instrumentation 2014: Ultraviolet to Gamma Ray (Montréal, QC), 91443G. doi: 10.1117/12.2055946
Siarkowski, M., Sylwester, J., Bąkała, J., Szaforz, Ż., Kowaliński, M., Kordylewski, Z., et al. (2016). ChemiX: a Bragg crystal spectrometer for the Interhelioprobe interplanetary mission. Exp. Astron. 41, 327–350. doi: 10.1007/s10686-016-9491-4
Sobel'Man, I. I., Zhitnik, I. A., Ignat'ev, A. P., Korneev, V. V., Klepikov, V. Y., Krutov, V. V., et al. (1996). X-ray spectroscopy of the Sun in the 0.84-30.4 nm band in the TEREK-K and RES-K experiments on the KORONAS-I satellite. Astron. Lett. 22, 539–554.
Strong, K. T., Lemen, J. R., and Linford, G. A. (1991). Abundance variations in solar active regions. Adv. Space Res. 11, 151–154. doi: 10.1016/0273-1177(91)90104-R
Tsuneta, S., Acton, L., Bruner, M., Lemen, J., Brown, W., Caravalho, R., et al. (1991). The soft X-ray telescope for the SOLAR-A mission. Solar Phys. 136, 37–67. doi: 10.1007/BF00151694
Urnov, A. M., Shestov, S. V., Bogachev, S. A., Goryaev, F. F., Zhitnik, I. A., and Kuzin, S. V. (2007). On the spatial and temporal characteristics and formation mechanisms of soft X-ray emission in the solar corona. Astron. Lett. 33, 396–410. doi: 10.1134/S1063773707060059
Zhithik, I. A., Kuzin, S. V., Sobel'Man, I. I., Bugaenko, O. I., Ignat'ev, A. P., Mitrofanov, A. V., et al. (2005). Main results of the SPIRIT experiment onboard the CORONAS-F satellite. Solar Syst. Res. 39, 442–452. doi: 10.1007/s11208-005-0057-7
Zhitnik, I., Kuzin, S., Afanas'ev, A., Bugaenko, O., Ignat'ev, A., Krutov, V., et al. (2003a). XUV observations of solar corona in the spirit experiment on board the coronas-F satellite. Adv. Space Res. 32, 473–477. doi: 10.1016/S0273-1177(03)00351-X
Zhitnik, I. A., Bougaenko, O. I., Delaboudiniere, J.-P., Ignatiev, A. P., Korneev, V. V., Krutov, V. V., et al. (2002). “SPIRIT X-ray telescope/spectroheliometer results,” in Solar Variability: From Core to Outer Frontiers, Volume SP-506 of ESA, ed A. Wilson (Noordwijk: ESA Publications Division), 915–918.
Zhitnik, I. A., Bugaenko, O. I., Ignat'ev, A. P., Krutov, V. V., Kuzin, S. V., Mitrofanov, A. V., et al. (2003b). Dynamic 10 MK plasma structures observed in monochromatic full-Sun images by the SPIRIT spectroheliograph on the CORONAS-F mission. Mnthly. Not. R. Astron. Soc. 338, 67–71. doi: 10.1046/j.1365-8711.2003.06014.x
Keywords: sun, solar corona, X-ray, spectroscopy, flares
Citation: Reva AA, Kuzin SV, Kirichenko AS, Ulyanov AS, Loboda IP and Bogachev SA (2021) Monochromatic X-Ray Imagers of the Sun Based on the Bragg Crystal Optics. Front. Astron. Space Sci. 8:645062. doi: 10.3389/fspas.2021.645062
Received: 22 December 2020; Accepted: 10 March 2021;
Published: 20 May 2021.
Edited by:
Sergei Shestov, Royal Observatory of Belgium, BelgiumReviewed by:
Vaibhav Pant, Instituto de Astrofísica de Canarias, SpainJuan Carlos Martínez Oliveros, UC Berkeley, United States
P. S. Athiray, NASA Postdoctoral Program, United States
Copyright © 2021 Reva, Kuzin, Kirichenko, Ulyanov, Loboda and Bogachev. This is an open-access article distributed under the terms of the Creative Commons Attribution License (CC BY). The use, distribution or reproduction in other forums is permitted, provided the original author(s) and the copyright owner(s) are credited and that the original publication in this journal is cited, in accordance with accepted academic practice. No use, distribution or reproduction is permitted which does not comply with these terms.
*Correspondence: Anton A. Reva, cmV2YS5hbnRvaW5lQGdtYWlsLmNvbQ==