 Ryan C. Blase1*
 Mark J. Libardoni1Gregory P. Miller1Kelly E. Miller1Charity M. Phillips-Lander1Christopher R. Glein1
 J. Hunter Waite1Abhishek Ghosh2Anandram Venkatasubramanian2Maxwell Wei-hao Li3Andrew Stephens4Xudong Fan2
 Katsuo Kurabayashi3,4
- 1Space Science and Engineering Division, Southwest Research Institute, San Antonio, TX, United States
- 2Biomedical Engineering Department, University of Michigan, Ann Arbor, MI, United States
- 3Electrical Engineering and Computer Science Department, University of Michigan, Ann Arbor, MI, United States
- 4Mechanical Engineering Department, University of Michigan, Ann Arbor, MI, United States
We present a novel, innovative approach to gas chromatography-mass spectrometry (GC-MS) based on micro-electro-mechanical systems (MEMS) columns that improve the current, state-of-the-art by dramatically reducing the size, mass, and power resources for deploying GC for future landed missions. The outlet of the MEMS GC column was coupled to a prototype of the MAss Spectrometer for Planetary EXploration (MASPEX) through a heated transfer line into the ion source. MEMS GC-MS experiments were performed to demonstrate linearity of response and establish limit of detection (LOD) to alkanes (organics), fatty acid methyl esters (FAMEs) and chemically derivatized amino acids (biological molecules). Linearity of response to each chemical family was demonstrated over two orders of magnitude dynamic range and limit of detection (LOD) values were single to tens (4–43) of picomoles per 1 μl injection volume. MEMS GC column analytical performance was also demonstrated for a “Mega Mix” of chemical analytes including organics and biological molecules. Chromatographic resolution exceeded 200, retention time reproducibility was << 1% RSD (majority ≤ 0.3%), and peak capacity values calculated to be 124 ± 2 over a 435 s retention time window. The 5.5 m MEMS column was also shown to be a suitable alternative to traditional commercial columns for use in comprehensive two-dimensional gas chromatography (GC × GC). Mass spectra collected from MASPEX showed close consistency with National Institute of Technology (NIST) reference mass spectra and were used for high confidence identification of all eluting analytes.
Introduction
The search for life, whether extinct or extant, is a high-priority goal for the National Aeronautics and Space Administration’s (NASA’s) Planetary Science Division (Green et al., 2021). The benchmark for life detection requires instrument measurements to be: 1) sensitive, 2) contamination-free, and 3) repeatable. Furthermore, one or more features that indicate life must be 4) detectable, 5) preserved (or survivable in the environment), 6) reliable, 7) compatible with life as we know it; and 8) biological interpretations must be a last resort (Neveu et al., 2018).
Multiple astrobiology-focused mission concepts are now in development to evaluate prebiotic chemistry and habitability (e.g., concentration of CHNOPS elements), to detect biosignatures, and ultimately to detect life. Another important need is to distinguish between biotic and abiotic sources of complex organics. Carbonaceous chondrite meteorites have been shown to provide minerals to catalyze Fisher-Tropsch type reactions from CO and H2 mixtures to generate complex organic environments of alkanes, alkenes, and alcohols (Rotelli et al., 2016). With the addition of water and formamide (aqueous environment) to meteorites, the Fisher-Tropsch type catalyzed reactions produce even more diverse organic products including nucleobases, fatty acids, and amino acids (Cabedo et al., 2021). The distribution of molecules produced are also different for abiotic (Fisher-Tropsch) versus biotic (life synthesis) processes (Lovelock, 1965; Hartgers et al., 2000). Abiotic processes produce smooth distributions of organic material whereas biotic, or biological, processes use the “Lego Principle” (McKay, 2004), introducing selectivity into their organic building blocks (Summons et al., 2007). Icy worlds astrobiology mission concepts include both the Flagship Europa Lander (Hand et al., 2017) and Enceladus Orbilander concepts (MacKenzie et al., 2021a; 2021b) which would land on the surface of these planetary bodies and sample the ice and potentially plume fall out. An Enceladus life detection mission in particular has strong scientific justification based on recent findings from the Cassini mission (Cable et al., 2021). These astrobiology-focused landed mission concepts are expected to identify individual organic molecules within potentially complex mixtures at low (1 nM) concentrations (Hand et al., 2017; MacKenzie et al., 2021a, 2021b).
However, even prior to life, organic complexity could be promoted in a planetary body. For example, evidence has been presented that a wet Mars existed billions of years ago. Remote sensing observations from Mars Advanced Radar for Subsurface and Ionosphere Sounding (MARSIS) on board the European Space Agency (ESA) Mars Express mission detected liquid water under the ice at the South Polar Layered deposits (Orosei et al., 2018; Lauro et al., 2020). Furthermore, geological evidence points to much of the water (30—99%) being sequestered through crustal hydration (Scheller et al., 2021). Potential presence of water in the crust could promote catalysis of organic compounds that could be better preserved deep below the surface. In situ organic matter detection at the surface of Mars has been accomplished with evolved gas analysis (EGA) from pyrolysis and gas chromatography-mass spectrometry by the Sample Analysis at Mars (SAM) instrument suite (Eigenbrode et al., 2018). The authors suggest that molecular records (organics) may be better-preserved below the surface where radiation, oxidizing conditions, and acidic diagenesis of rock are reduced or eliminated. Environments with the potential for interaction of water and minerals to increase organic complexity are a promising target for GC-MS instrumentation.
The first successful deployment of a GC-MS in space was part of the Viking lander biological experiments (Biemann et al., 1976). A more detailed description of the Viking GC-MS can be found here (Rushneck et al., 1978). The Tenax stationary phase GC column was developed to: 1) maximize the separation of H,O and CO from organic compounds, 2) transmit most compound classes efficiently at the low nanogram level, 3) have exceptional thermal stability, and 4) have mechanical strength compatible with the rigors of spaceflight (Novotny et al., 1975). The mass spectrometer was a Nier-Johnson double-focusing design (Fenselau et al., 2003). Laboratory demonstrations of mass spectrometric analysis to detect organic compounds, water, and volatile constituents in the atmosphere and surface of Mars were described prior to the in situ investigation (Anderson et al., 1972). Initial in situ analyses at the surface of Mars identified only carbon dioxide and water from the Mars surface samples (Biemann, 2007) but a re-analysis of the data in 2018 seemed to indicate the presence of chlorobenzene(Guzman et al., 2018). A second GC present on the Viking lander biological experiment was the Viking Gas Exchange Experiment (GEX) to measure atmospheric gases (Oyama, 1972). The GEX successfully measured the atmospheric composition of Mars with findings of ∼96.15% CO2, 2.2% N2, 1.5% Ar, and ≤ 0.15% O2 (Oyama and Berdahl, 1977).
Several GC instruments have visited Venus. The Large Probe Gas Chromatograph on Pioneer Venus (Colin and Hunten, 1977) was a modified version of the Viking Biology Gas Exchange Experiment targeted for measurement of atmospheric gases. The instrument had a sensitivity of a few ppm and successfully measured the major/minor composition of the lower atmosphere of Venus (96.4% CO2, 3.41% N2, 0.135% H2O, 69.3 ppm O2, 18.6 ppm Ar, 186 ppm SO2) (Oyama et al., 1979b; 1979a). Similar experiments were performed onboard Venera 12, 13, and 14 (Mukhin et al., 1987).
More information on the early applications of GC in space can be found in the paper Gas chromatography in space (Akapo et al., 1999), which includes a description of the Huygens Titan probe GC-MS (Niemann et al., 2002). The Huygens probe GC–MS gas sampling system had three inlets: one for direct atmospheric analysis by the MS, one for GC–MS analysis, and a third for the analysis of the aerosol collector pyrolyzer (ACP) (Israel et al., 2002) gaseous products connected to both the GC and the MS. The GC column assembly contained three parallel columns with different stationary phases to target the expected atmospheric species (Navale et al., 1998). The first column was 2 m long, 0.75 mm ID Silcosteel tubing micropacked with carbon molecular sieve (porous carbon) for the separation of permanent gases particularly nitrogen and carbon monoxide. The second column, 10 m length and 0.18 mm ID, was an MXT wall coated open tubular (WCOT) capillary column with CPPS-DMPS stationary phase for higher molecular mass compounds (C3 to C6) and nitriles or gas mixtures from the ACP experiments. The third column, 14 m length and 0.18 mm ID, was an MXT WCOT low temperature glassy carbon stationary phase for the analysis of low mass hydrocarbons (C2 to C3). The GC-MS made atmospheric composition measurements during descent (detected H2, CH4, N2, 40Ar, and CO2) and at the surface (detected H2, CH4, N2, 40Ar, and CO2 in addition to C2N2 and C6H6) and also investigated isotopic ratio measurements of 15N/14N in N2, 13C/12C in CH4, and D/H in H2 (Niemann et al., 2005, 2010).
The Sample Analysis at Mars (SAM) instruments (Mahaffy et al., 2012) included a gas chromatograph assembly, containing six complementary chromatographic columns (Supplementary Table S1 reproduced from Table 9 in (Mahaffy et al., 2012)), each 30 m in length with an internal diameter of 0.25 mm. The column stationary phases selected provide a broad range of selectivity for both light and heavy organic molecules for a range of molecular polarity and for inorganic volatiles. Three of the columns (4, 5, and 6) incorporate a small adsorption trap to preconcentrate the analytes and release them as narrow plugs onto the GC column through flash heating. The SAM GC-MS has provided useful information on the search for organics on Mars with the detection of chlorobenzene (Freissinet et al., 2015) (surmised that preferred precursor of dichlorobenzene is benzoic acid) (Freissinet et al., 2020), two to three isomers of dichlorobenzene (Szopa et al., 2020), and most recently derivatized phenol and benzoic and phosphoric acid (Millan et al., 2021). Similarly, the Mars Organic Molecule Analyzer (MOMA) (Brinckerhoff et al., 2013; Goesmann et al., 2017; Li et al., 2017), part of the “Pasteur analytical laboratory” on the Rosalind Franklin rover scheduled to land on the surface of Mars in 2023, is equipped with 4 GC columns coupled to an ion trap mass spectrometer. The four columns, used with heritage from SAM, are indicated in Supplementary Table S1. Laboratory experiments documenting the performance of flight spares of the 4 GC columns has been performed (Guzman et al., 2020). A similar GC system coupled to the MOMA mass spectrometer will be included on the DraMS instrument, part of the Dragonfly mission to Titan (Barnes et al., 2021; Grubisic et al., 2021).
As evidenced by the historical examples above, much effort has been spent in the design of multiple chromatographic columns in GC-MS platforms to provide broad range selectivity for a wide variety of compounds. Multiple columns along with dedicated ovens result in increased size (footprint on the spacecraft/lander) and mass of the GC-MS system. We present in this paper a new, innovative approach to GC-MS based on MEMS columns that can dramatically reduce the size, mass, and power resources for deploying GC in space while at the same time maintaining performance. The novelty of MEMS GC expands the capabilities over the current, state-of-the-art in GC-MS for spaceflight applications. We present the sensitivity of the MEMS GC-MS setup (linearity of response and limit of detection) as well as the reproducibility of the device to demonstrate the achievements of two of the three benchmarks for life detection. We also discuss the potential for the MEMS GC columns to be used in series for comprehensive two-dimensional gas chromatography (GC×GC).
Materials and Methods
Solvents and Chemicals
Alkanes, amino acids, fatty acids, fatty acid methyl esters (FAMEs), and polycyclic aromatic hydrocarbons (PAHs) were purchased from Sigma Aldrich (St. Louis, MO) and used without further purification. n-Hexane solvent was purchased from Alfa Aesar and was used for dissolution of alkanes, fatty acids, FAMEs, and PAHs and any dilution of said chemical families. Fatty acid mixtures made in n-hexane were evaporated to dryness before chemical derivatization. A solution of 0.1 N HCl was purchased from Supelco (Sigma Aldrich) and used for dissolution of amino acids to make amino acid mixtures prior to evaporation to dryness and chemical derivatization. Chemical derivatization was performed with N-tert-Butyldimethylsilyl-N-methyl-trifluoroacetamide (MTBSTFA) along with N,N-Dimethylformamide (DMF). For more details, see the Materials and Methods Section in Supplementary Material.
Chemical Derivatization
Amino acids and fatty acids were derivatized with MTBSTFA owing to its high reaction yield (Mawhinney and Madson, 1982) and its demonstrated superior experimental performance relative to other chemical derivatization agents (Rodier et al., 2001). Sealed 1 μl ampules of MTBSTFA were purchased from Sigma Aldrich and the ampules were broken open and used immediately to mitigate exposure to water and degradation. Anhydrous DMF was also used with MTBSTFA in a 3:1 (v:v) MTBSTFA:DMF mix (Goesmann et al., 2017).
For chemical derivatization of amino acids, individual amino acids were first dissolved in 0.1 N HCl. A mixture of the 11 amino acids was made from the individual amino acid solutions and then evaporated to dryness via dry nitrogen gas blow down. MTBSTFA and anhydrous DMF were added at the 3:1 (v:v) mix and the mixture was then heated in a sand bath on a hot plate at 90°C for 60 min. After the derivatization reaction, the solution was directly injected into the commercial injector and onto the GC column. Similarly, for chemical derivatization of the fatty acids, individual fatty acids were first dissolved in n-hexane. A mixture of the fatty acids was made from the individual solutions and then the n-hexane was evaporated to dryness by the same dry nitrogen gas blow down step. The derivatization process for the fatty acids is the same as that described for amino acids.
MEMS GC-MS Instrument
A 5.5 m length, 150 μm × 240 μm rectangular channel (similar in area to a 215 μm ID open tubular capillary column) coated with OV-5 (DB-5, 95% polydimethylsiloxane/5% phenyl) stationary phase, the same stationary phase as MXT five columns used on SAM and MOMA, served as the MEMS GC column. The rectangular channels are made out of etched silicon substrate and a Pyrex glass coating is anodically bonded over the silicon substrate to seal the column. Fused silica capillary columns are inserted into the inlet and outlet of the MEMS GC column and sealed with a polyimide/Hysol 1C epoxy. A photograph of the 5.5 m MEMS GC column with fused silica capillary inlet and outlet is displayed in Figure 1.
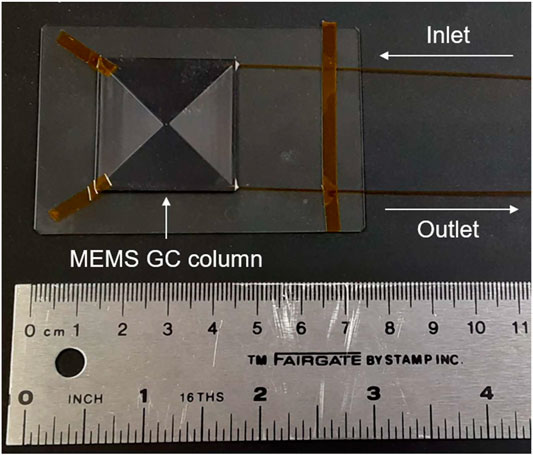
FIGURE 1. Photograph of the 5.5 m length MEMS GC column with inlet and outlet fused silica capillaries. The column footprint is approximately 3 cm × 3 cm, reducing the size versus MXT (metal clad) capillary columns.
For the experiments described here, the 5.5 m length MEMS GC column was placed inside an Agilent 6,890 commercial GC to utilize the commercial thermal injector, carrier gas electronic pressure controller (EPC), and GC oven. The fused silica capillary inlet to the MEMS GC column was inserted into the GC injector inlet and sealed with the inlet ferrule and nut. The outlet of the MEMS GC column was coupled to a 0.6 m length, 100 μm ID fused silica capillary guard column serving as a restriction column (conductance limit) to reduce the operating pressure for the mass spectrometer. The restriction column was then coupled to a 250 μm ID fused silica capillary guard column that exits the GC oven and travels through a heated transfer line and terminates at the aperture of the closed ion source of the mass spectrometer. The GC separation parameters are as follows: front inlet (injector) temperature of 280°C, oven temperature start at 70°C hold for 1 min, 30°C min−1 ramp to 300°C, helium carrier gas flow rate of 1.2 ml min−1.
The effluent from the GC enters the mass spectrometer ion source through the aperture and intersects an electron beam to ionize the neutral gas molecules via electron ionization (EI). The ions are then extracted through a voltage pulse to the pusher and extractor electrodes, providing uniform kinetic energy to all extracted ions. The ions separate over the flight length, or disperse in time, owing to their different velocities governed by the mass of the ion (t ∼ m1/2). An earlier prototype of MASPEX is used for the time-of-flight (TOF) mass spectrometer (Hässig et al., 2015; Brockwell et al., 2016) and a simple linear mode of operation is employed. Ions are extracted from the ion source and travel the flight distance from the source to the microchannel plate (MCP) detector with the trapping reflectrons (ion mirrors) off. The time-of-flight of the ions is converted to m/z through calibration, resulting in a mass spectrum.
The TOF instrument and MCP detector response (data acquisition) is controlled by a FastFlight 12 bit analog-to-digital converter (ADC). The ADC is operated at a sampling frequency of 2 GHz, providing 0.5 ns time-of-flight (TOF) bin widths. The ion source extraction frequency is about 9.5 kHz and 500 TOF spectra are averaged before writing to disk to display the total ion chromatogram (or total ion counts) versus time. This serves as the chromatogram as detected by the MCP.
GC×GC-FID Instrument
A LECO 7890 GC×GC-FID instrument was used for the comprehensive two-dimensional gas chromatography analyses. The first analysis of Mega Mix 40 (40 components) was performed on commercial open tubular fused silica capillary columns. The inlet utilized a split flow of 100:1, helium carrier gas at a flow rate of 1.5 ml min−1, inlet temperature of 250°C, and a 1 μl injection volume. The first dimension column (C1) was a 30 m × 0.25 mm x 0.25 μm (Rtx-1, Restek) and the second dimension column (C2) was a 1.0 m × 0.10 mm x 0.10 μm (Rxi-17, Restek). The oven temperature program for C1 started at 40°C for 1 min, followed by a 5°C min−1 ramp to a final temperature of 280°C with a hold time of 10 min. The total GC run time was 59 min. C2 was +10°C relative to C1. The quad jet, dual stage thermal modulator temperature was +15°C relative to C1 with a modulation period of 3 s and a hot gas jet pulse of 0.65 s. The cold gas jet pulse was ambient temperature nitrogen (∼20°C) and was sufficient to trap the large molecular weight species being separated. The detector was a flame ionization detector (FID) with a sampling rate of 100 Hz and collected data continuously after a solvent delay of 800 s.
A second analysis of Mega Mix 40 was conducted with the 5.5 m MEMS GC column as the first dimension column (C1) and the 1.0 m × 0.10 mm x 0.10 μm (Rxi-17) column as the second dimension column (C2). The inlet temperature, split flow, and oven temperature programs were the same as for that stated above. The helium carrier gas flow rate was changed to 1.2 ml min−1 due to the shorter MEMS column. The modulation period was changed to 5 s. The FID sampling rate was the same but the solvent delay was changed to 700 s.
Results
Linearity of Response
This experiment was performed to test the linear response in terms of sample analyte injected on-column mass (or concentration) and the peak area response from the total ion chromatogram constructed from the microchannel plate (MCP) detector. Three different analyte types (or chemical families) were used to investigate the linearity of response: alkanes, fatty acid methyl esters (FAMEs), and chemically derivatized amino acids (tert-butyldimethylsilyl (TBDMS) derivatives). The linearity of response was investigated over two orders of magnitude dynamic range.
Sample analyte mixtures were prepared for all three analyte types (or chemical families). The mixtures were as follows: C12 to C22 (dodecane, tetradecane, hexadecane, octadecane, eicosane, and docosane) even numbered alkanes; C12 to C22 (dodecanoic acid, tetradecanoic acid, hexadecanoic acid, octadecanoic acid, eicosanoic acid, and docosanoic acid methyl esters) even numbered fatty acid methyl esters; Alanine (Ala), Glycine (Gly), 2-Aminoisobutyric acid (AIB), β-Alanine (β-Ala), Valine (Val), Leucine (Leu), 4-Aminobutanoic acid (GABA), Serine (Ser), Aspartic Acid (Asp), Glutamic Acid (Glu), and Histidine (His) amino acid TBDMS derivatives. The alkanes and FAMEs mixtures were dissolved and diluted in n-hexane. The amino acids were first dissolved in 0.1 N HCl and various volumes of this mixture were taken and evaporated to dryness, and then chemically derivatized in MTBSTFA.
n-Alkanes
Individual alkanes were dissolved in n-hexane, and then a mixture of the alkanes was made in n-hexane followed by serial dilutions for decreasing concentrations (mass) to be injected on the MEMS GC column. Concentrations of the alkanes for the five dilutions were approximately 100, 50, 25, 12.5, and 6.25 ng/μl. For the exact concentration of each alkane in ng/μl and picomoles/μl, see Supplementary Table S2. Peak area versus picomoles injected were plotted for the group of alkanes and are displayed in Figure 2. The plot at left includes linear best fit trendlines overlaid with the data. The plot at right is a log-log plot (both axes plotted on a logarithmic scale) to better demonstrate the response of each alkane relative to the other alkanes. A representative mass spectrum of hexadecane (C16 ALK) acquired by MASPEX during the MEMS GC-MS experiment overlaid with the NIST reference mass spectrum for high confidence identification is displayed in Supplementary Figure S1.
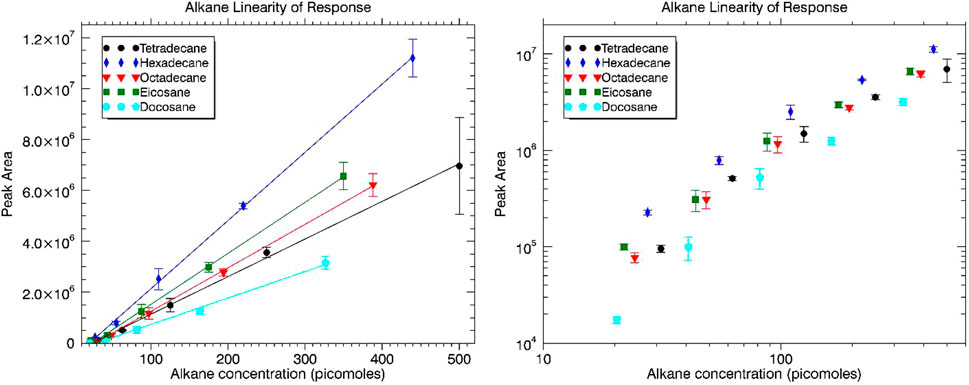
FIGURE 2. Alkane linearity of response in terms of peak area versus alkane concentration injected (picomoles) plotted with linear axes at left and logarithmic axes at right.
Linear response was observed over two orders of magnitude dynamic range. The log-log plot of Figure 2 is shown to demonstrate the groupings of each alkane relative to the others. The reduced peak area for similar concentration of the largest molecular weight alkane, C22, is most likely explained by its longer retention time in the analytical column leading to peak band broadening.
Limit of Detection
Limit of detection (LOD) values were established from each of the individual alkane linearity of response tests (linear trend lines; Figure 2) extrapolated to a peak area still discernible above the baseline of the chromatogram. This discernible threshold was set at a signal-to-noise (S/N) ratio of 3. The extrapolated limit of detection for each alkane is displayed in Table 1. Looking at the data overall, an average LOD for the system is approximately 25 picomoles (range of 21–30) for the alkanes.
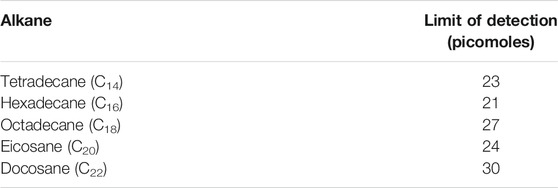
TABLE 1. Extrapolated limits of detection (LODs) for the alkanes on the MEMS GC-MS experimental setup.
Fatty Acid Methyl Esters (FAMEs)
Individual fatty acid methyl esters (FAMEs) were dissolved in n-hexane, and then a mixture of the FAMEs was made in n-hexane followed by serial dilutions of decreasing concentration to be injected onto the MEMS GC column. Concentrations of the FAMEs for the five dilutions were approximately 128, 64, 32, 16, and 8 ng/μl. For the exact concentration of each FAME in ng/μl and picomoles/μl, see Supplementary Table S3. Peak area versus picomoles injected were plotted for the group of FAMEs and are displayed in Figure 3. Linear best fit trendlines are overlaid with the data on the plot at left, while the log-log plot at right is to better demonstrate the response of each FAME relative to the others. A representative mass spectrum of dodecanoic acid, methyl ester (methyl decanoate, C12 FAME) acquired by MASPEX and overlaid with the NIST reference mass spectrum is displayed in Supplementary Figure S2.
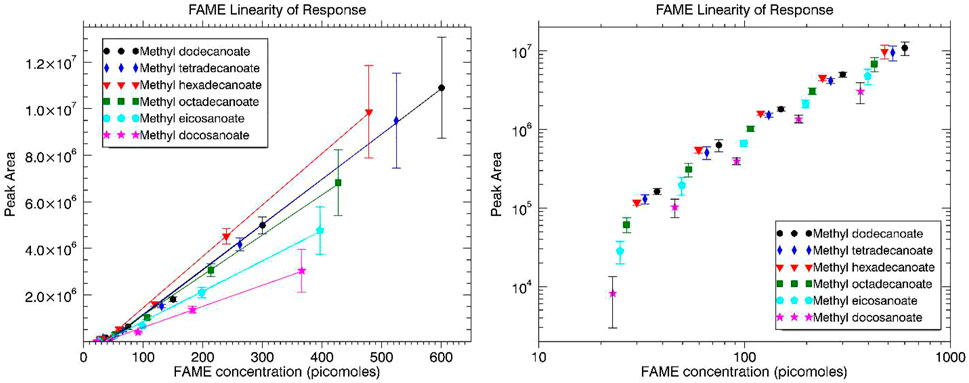
FIGURE 3. FAMEs linearity of response in terms of peak area versus FAME concentration injected (picomoles) plotted with linear axes at left and logarithmic axes at right.
Linear response was observed over the two orders of magnitude dynamic range. The log-log plot of Figure 3 demonstrate the response (groupings) of each FAME relative to the others. The observed trend, similar to the alkanes, is that as the molecular weight of the FAME is increased the peak area (or signal response) is decreased for similar concentrations. This is once again best explained by the longer retention times leading to increased band broadening.
Limit of Detection
Limit of detection (LOD) values were established from each of the individual FAME linearity of response tests (linear trend lines) extrapolated to a peak area still discernible above the baseline of the chromatogram. This discernible threshold was set at a signal-to-noise (S/N) ratio of 3. The extrapolated limit of detection for each FAME is displayed in Table 2. An average LOD for the system is approximately 38.5 picomoles (range of 35–43) for the FAMEs.
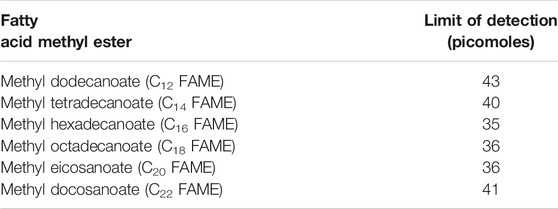
TABLE 2. Extrapolated limits of detection (LODs) for the fatty acid methyl esters (FAMEs) on the MEMS GC-MS experimental setup.
Amino Acids
Individual amino acids were dissolved in 0.1 N HCl at a concentration around 1 mg ml−1. Then, 50 μl aliquots of these individual amino acid solutions were mixed to make the 11 amino acid mixture and a total volume of 550 μl. From this total mixture volume (550 μl), decreasing aliquot volumes were added to five vials: 220, 110, 55, 27.5, and 13.75 μl. The 0.1 N HCl was evaporated in each vial via dry gas nitrogen blow down. Volumes of 150 μl of MTBSTFA and 50 μl of anhydrous DMF were added to each vial and placed in a sand bath at 90 °C for 60 min for the chemical derivatization reaction. Concentrations of the amino acids for the five dilutions were approximately 100, 50, 25, 12.5, and 6.25 ng/μl. For the exact concentration of each amino acid in ng/μl and picomoles/μl, see Supplementary Table S4. Peak area versus picomoles injected were plotted for the group of derivatized amino acids and are displayed in Figure 4. The linear best fit trendlines for each derivatized amino acid are omitted from the plot at left as there are too many data points and the plot becomes too crowded and difficult to decipher. A representative mass spectrum of Alanine, 2-TBDMS acquired by MASPEX overlaid with the NIST reference mass spectrum is displayed in Supplementary Figure S3.
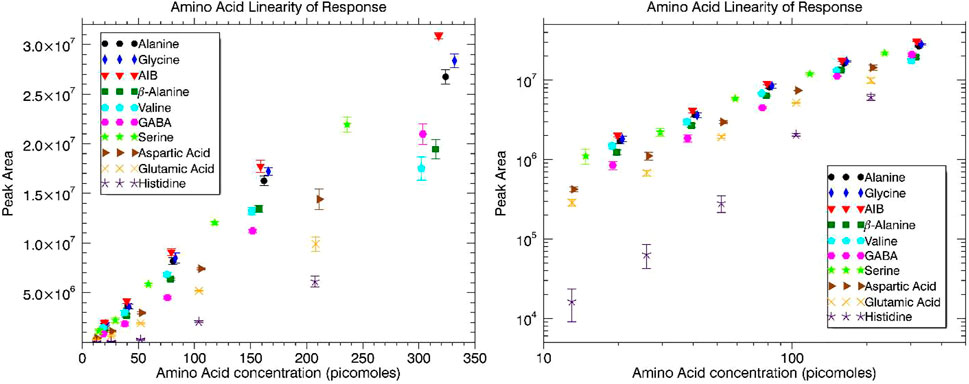
FIGURE 4. Amino acid linearity of response in terms of peak area versus FAME concentration injected (picomoles) plotted with linear axes at left and logarithmic axes at right.
Linear response was generally observed over the two orders of magnitude dynamic range, save for some roll-off in the response curves for Ala, Gly, AIB, β-Ala, and Val at the highest concentration data points. The chromatographic peaks of these species at the highest injected concentration show peak fronting and double peaks (or a bi-modal distribution) indicative of column overloading. The response roll-off (deviation from linearity) is most apparent for β-Ala and Val as these analytes have very close retention times and lose baseline separation (overlap more with increasing concentration). Peak integration in these cases becomes more difficult and is responsible for the lower than expected peak areas at the highest concentration data point. A linearity of response plot with linear best fit trend lines is included in Supplementary Figure S4 with the removal of the highest concentration data points (save for Asp, Glu, and His) to demonstrate the linearity of response.
Limit of Detection
Limit of detection (LOD) values were established from each of the individual derivatized amino acids linearity of response tests (linear trend lines) extrapolated to a peak area still discernible above the baseline of the chromatogram. This discernible threshold was set at a signal-to-noise (S/N) ratio of 3. For Ala, Gly, AIB, β-Ala, and Val the highest concentration data point, where roll-off from linearity is observed, is removed for the calculation of the LOD. For His, the three highest concentration data points are used to establish the LOD. His was detected at the two lowest concentrations but barely above baseline noise (not exceeding a S/N of 3). Without the advantage of previous runs at higher concentrations and knowledge (intrinsic bias) of the retention time this would most likely be considered a non-discernible signal. The extrapolated limit of detection for each derivatized amino acid is displayed in Table 3. Looking at the data overall, the average LOD for the system is approximately 6.5 picomoles (range of 3–10 excluding His) for the derivatized amino acids.
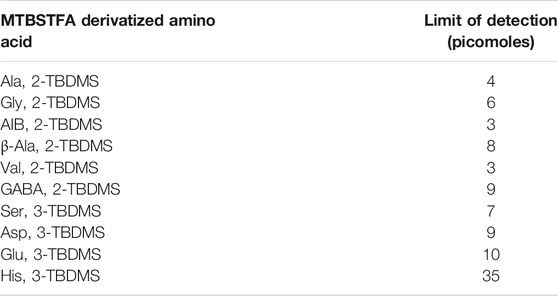
TABLE 3. Extrapolated limits of detection (LODs) for the derivatized amino acids on the MEMS GC-MS experimental setup.
MEMS GC, Column Analytical Performance—Reproducibility, Resolution, Peak Capacity, Number of Theoretical Plates, and Height Equivalent to a Theoretical Plate.
The MEMS GC column analytical performance was also tested for retention time reproducibility, resolution, peak capacity, number of theoretical plates, and height equivalent to a theoretical plate. For this testing, mixtures of alkanes, FAMEs, and chemically derivatized amino and fatty acids (TBDMS derivatives) were first tested as individual chemical families, described below.
The individual chemical families were first run on the MEMS GC column with multiple injections for each chemical family to investigate retention time reproducibility. Retention times of the individual runs of alkanes, FAMEs, amino acids (TBDMS derivatives), and fatty acids (TBDMS derivatives) are displayed in Table 4. The table displays multiple injections (n = number of injections) at each specified concentration. A 5th data point of lower concentration was also used (not shown in the table) to calculate the average retention time over all of the runs. For example, for the alkanes, the average retention time displayed on the right side of the table is for n = 19 injections over the five concentrations.
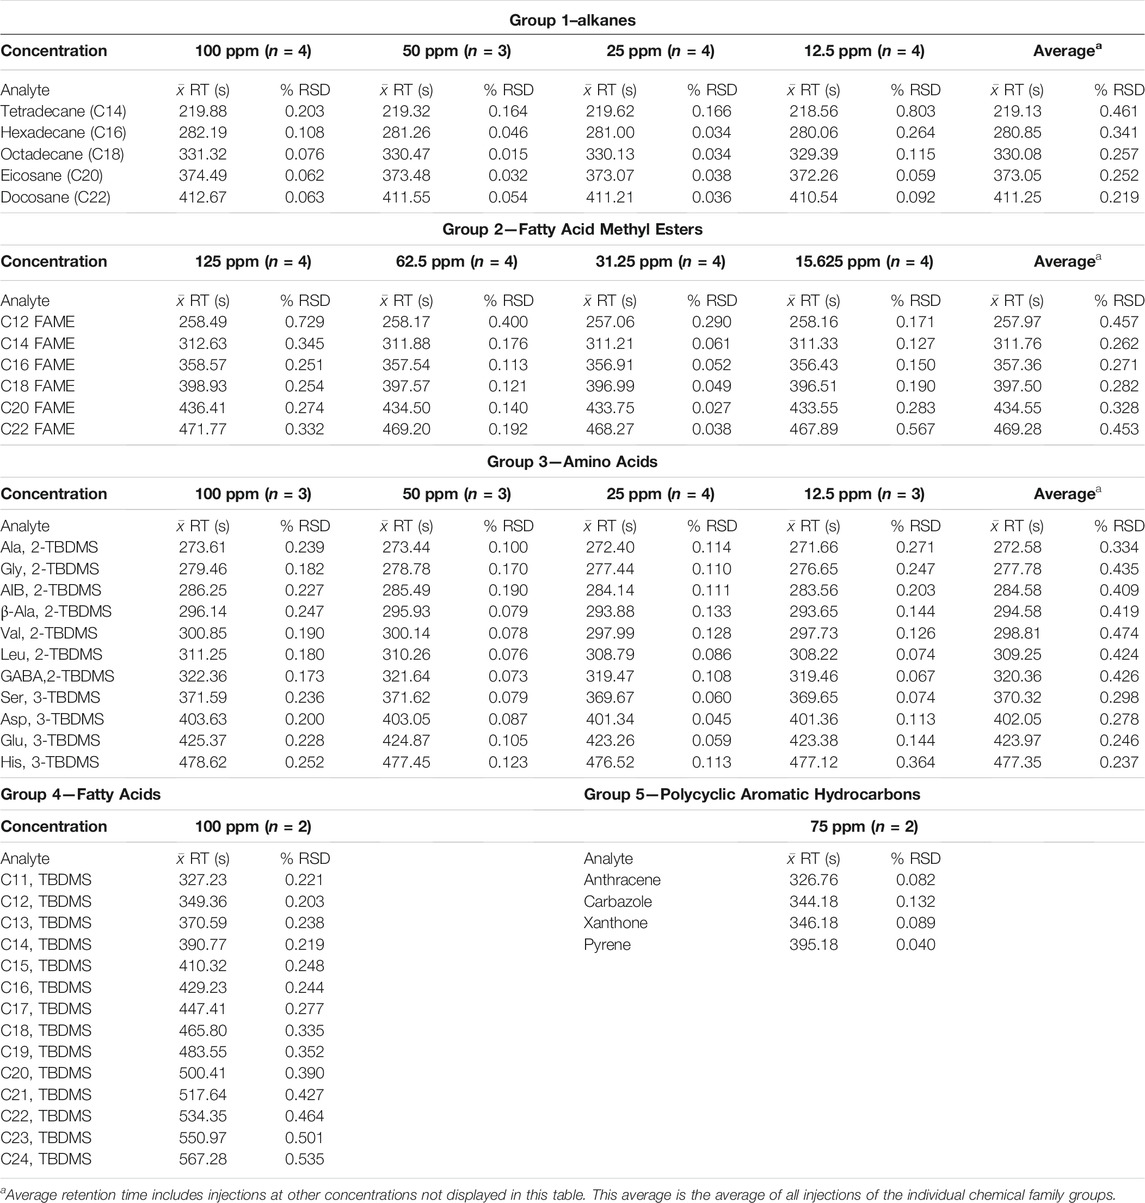
TABLE 4. Average retention time and percent relative standard deviation (% RSD) for multiple injections of the five different chemical families (groups) at different concentrations.
For groups 1 to 3 (see Table 4), the retention time shifts to slightly faster retention times (to the left) as the on-column concentration is decreased. This is expected due to improved partitioning of the band into and out of the stationary phase and hence a more ideal Gaussian peak shape, compared with higher concentrations that lead to fronted peaks and shifting of the centroid of the peak to the right. The multiple injections within each concentration range show consistent reproducibility with ≤ 1% RSD values. In fact, the majority of the results show ≤ 0.3% RSD values. This demonstrates the improvement of the MEMS GC column heating in the oven and carrier gas flow rate control provided by the electronic pressure controller (EPC) of the commercial GC instrument versus our previous published values of ≤ 2% RSD values (Blase et al., 2020). With these improvements, we approach the reproducibility of full-up commercial GC systems with autosampler injections. In this work, manual injections were still employed as well as manual start times of the GC oven and FastFlight data acquisition software for the TOF MS.
For groups 4 and 5 in Table 4, which include the fatty acid TBDMS derivatives and polycyclic aromatic hydrocarbons (PAHs), only one concentration was injected, with n = 2 runs, to establish a benchmark for the retention time and % RSD values to then compare with the Mega Mixture runs. Low % RSD values were also seen for these chemical families, again demonstrating the reproducibility of the MEMS GC column. It is expected that the same trend would be seen and that decreasing the on-column concentration would shift the retention time (the centroid of the chromatographic peak) to slightly faster retention times (to the left).
Resolution, peak capacity, number of theoretical plates, and height equivalent to a theoretical plate were also calculated for the individual chemical family runs. Resolution, R, is defined as follows:
Where
where
where tR is the retention time and
In other words, HETP is the distance between adjacent theoretical plates within a column and is a good measure for comparing different chromatographic columns.
Resolution and peak capacity results for the three chemical families for which linearity of response experiments were performed are displayed in Table 5. Resolution values correspond to the average resolution values of all chromatographic peaks in each chemical family. Peak capacity values, as mentioned above, are calculated for the first and last eluting chromatographic signals within each chemical family. The trend that can be deduced from the table is that as the concentration of each component decreases, the resolution values increase (due to less band broadening) as do the peak capacity values.
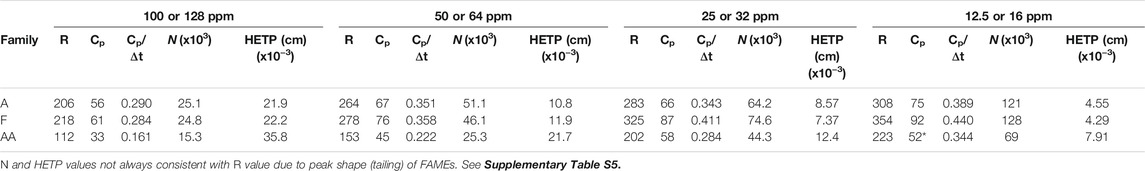
TABLE 5. Average resolution values, peak capacities, and peak capacity divided by the retention time spread, number of theoretical plates (x103), and height equivalent to a theoretical plate (x10−3 cm) at the different concentrations for all peaks in the individual chemical families of alkanes (A), FAMEs (F), and amino acids (AA).
The individual runs of the chemical families have different retention time differences,
It is also important to note that across all chemical families the maximum value of Cp/ΔtR is ∼0.45. This term provides a normalized measure of the peak capacity over a specific retention time interval and yields similar values for different analytes at similar on-column concentrations, regardless of the retention time difference, ΔtR.
The number of theoretical plates (N) and height equivalent to a theoretical plate (HETP) are presented as average values for multiple injections over the different concentrations for all the components in the chemical families (Table 5). N increases with decreasing concentration, similar to the trend for resolution and peak capacity, while HETP decreases as it is inversely proportional to N. N varies from 15,000 to 128,000 (HETP of 0.00429–0.0358 cm) across the different chemical families and varied concentrations. For a more direct comparison, 30 m (0.25 mm ID) commercial columns provide N = 120,000 theoretical plates (de Zeeuw, 2020), HETP = 0.025 cm, and 4,000 theoretical plates per meter. The commercially produced columns refer to wall coated open tubular (WCOT) capillary columns where the walls of the column are coated with a liquid stationary phase. WCOT columns, predicted to increase separation efficiency by orders of magnitude over packed GC columns in 1957 by Golay yet not demonstrated in practice until years later (Ettre, 1987), have been produced commercially for 30 years. These WCOT columns are produced by many vendors and are accurate, precise, robust, and reproducible and for this reason are a good benchmark for comparison with the MEMS rectangular channel wall coated liquid stationary phase GC column presented here.
For the highest concentration injection N varies from 15,000 to 25,000. A value of 20,000 yields HETP = 0.0275 cm, near commercial column performance. As injection concentration decreases, N increases. Another interesting point of note is the increase in R and N with later eluting components within each chemical family (see Supplementary Table S5 and related discussion). This is most likely due to the 100 μm ID restriction column between the MEMS GC column and the transfer line to the mass spectrometer to reduce the helium carrier gas load introduced to the vacuum chamber. This restriction column increases the retention time, t, but band broadening from diffusion increases by the
Mixtures—Increasing the Chemical Complexity of the Sample.
After characterizing resolution and peak capacity for each chemical family, the next step was to increase the chemical complexity of the overall sample by adding the chemical families together into a mixture. We termed these more complex samples the mega mixtures. The first mega mixture is called Mega Mix 36 and contains the alkanes, FAMEs, and amino acid and fatty acid TBDMS derivatives at concentrations of ∼50 ppm of each. The second mega mixture is called Mega Mix 40 and contains the aforementioned analytes in addition to compounds resembling polycyclic aromatic hydrocarbons (PAHs): anthracene, carbazole, pyrene, and xanthone. The concentrations of each of these analytes in the mixture is ∼40 ppm. Injections of 1 µl were made for both of the Mega Mixes on the MEMS GC column.
A chromatogram of Mega Mix 36 is displayed in Supplementary Figure S5 while a chromatogram of Mega Mix 40, with the addition of the polycyclic aromatic hydrocarbons (PAHs) denoted in red text, is presented in Figure 5. Table 6 compares the average retention time and % RSD values from the individual chemical family injections with those of the Mega Mixes (increasing chemical matrix (sample) complexity). A visual overlay of the chromatograms from multiple injections for Mega Mix 36 (n = 6) and Mega Mix 40 (n = 4) are provided in Supplementary Figure S6 and Supplementary Figure S7, respectively. For the most part, retention times and % RSD values for the Mega Mixes are very similar to those established in the individual chemical family runs. The greatest deviations in retention time seen in the Mega Mix versus the individual chemical family runs were seen for the earlier eluting components: C14 and C16 ALK, C12 FAME and a slight shift for C14 FAME shifting to the right to longer retention times; and Ala-, Gly-, AIB-, β-Ala-, Val-, Leu-, and GABA-2, TBDMS derivatives shifting to the left to shorter retention times.
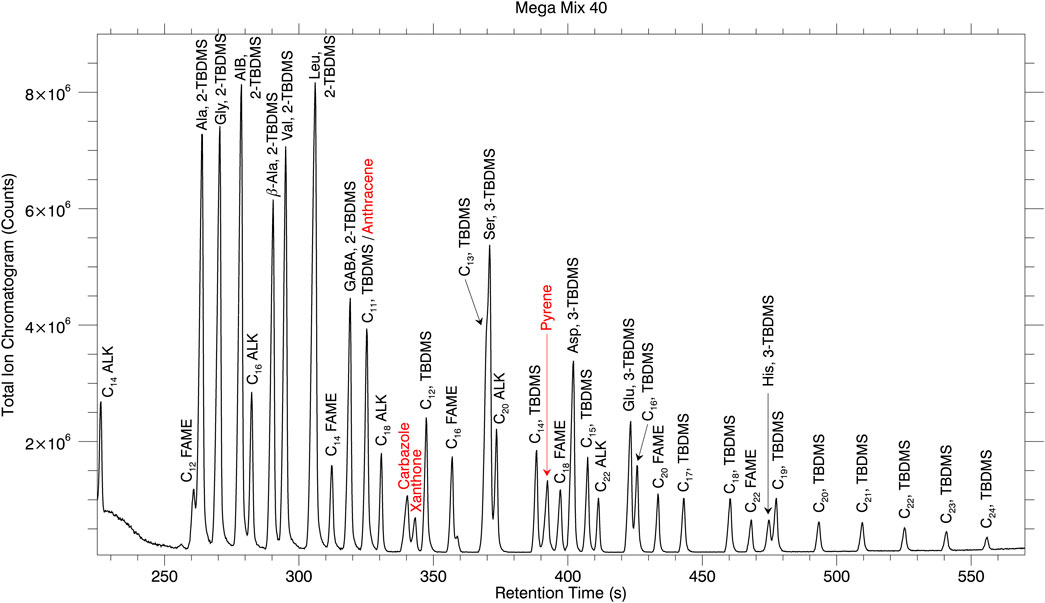
FIGURE 5. Chromatogram of the Mega Mix 40 mixture. The majority of the compounds are baseline separated. The forward slash between C11, TBDMS and anthracene denotes that these peaks overlap under the present chromatographic conditions.
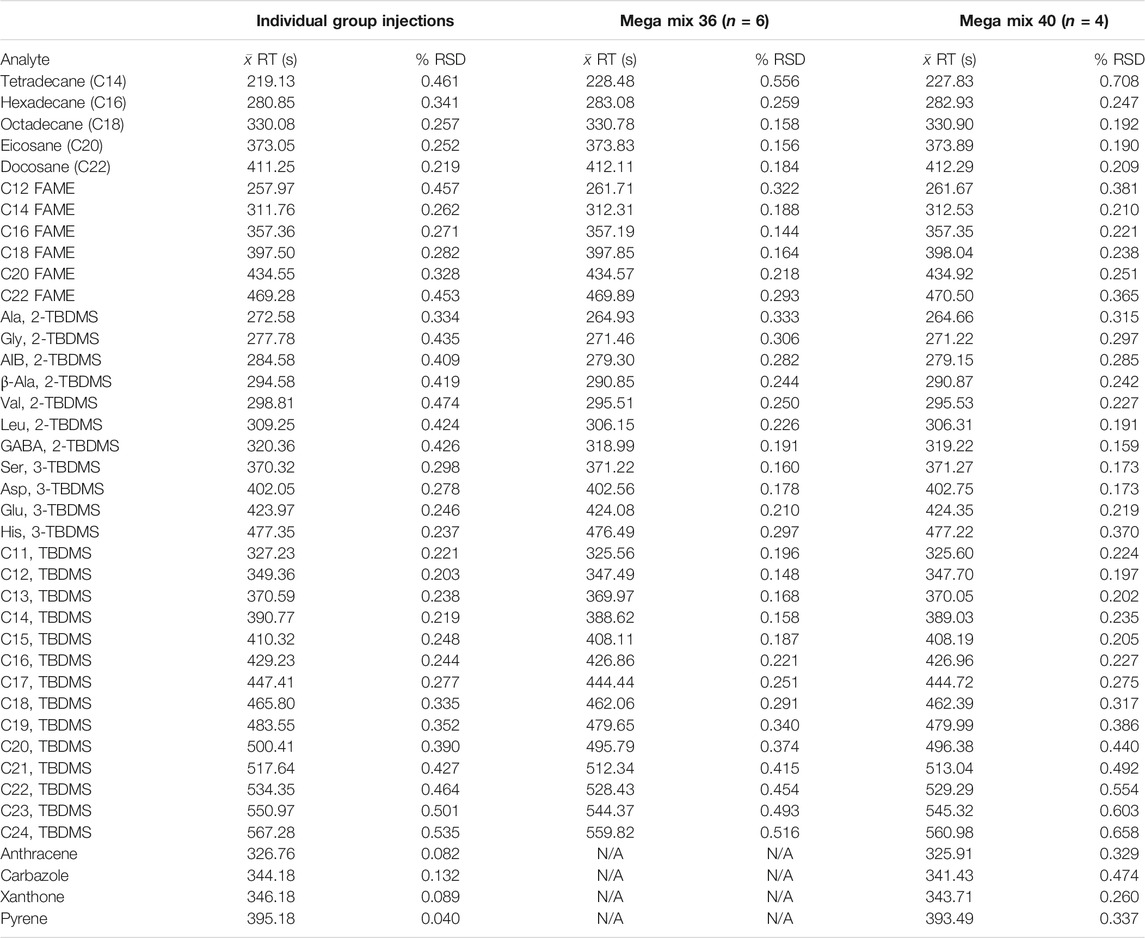
TABLE 6. Comparison of retention times and % RSD values for the individual chemical family averages (from Table 4) and those from Mega Mix 36 and Mega Mix 40.
Retention time deviations observed in the Mega Mix versus individual chemical family runs are most likely explained by retention (k’) and selectivity factors (α). As the sample becomes more complex, the retention and selectivity factors change when considering the added components to the overall mixture. This is the first reason for employing a mass spectrometric detector after the MEMS GC separation. If a different detector such as a flame ionization detector (FID), thermal conductivity detector (TCD), or photoionization detector (PID) were employed then retention time libraries would have to be relied upon for identification. However, possible shifts in retention times with increasing sample matrix complexity implies a major scientific risk for a landed search-for-life mission. The use of the mass spectrometric detector provides m/z values from the parent molecular ion and associated fragment ions that enable chemical structure elucidation for unambiguous, high confidence identification.
Additionally, problems of co-elution such as the C11 TBDMS and Anthracene co-elution of Figure 5 require mass spectral analyses for the identification of the co-eluting components. An FID, TCD, or PID would be blind to the structural information provided by the mass spectrometer that enables identification of two chemical species within what looks to be a single chromatographic peak. The mass spectrum for C11 TBDMS and Anthracene taken from the individual chemical family runs are displayed versus the mass spectrum from the co-elution of these two analytes from Mega Mix 40 (Figure 6). A second example of co-eluting analytes confirmed by the mass spectrometer is the C13 TBDMS and Ser, 3-TBDMS co-elution (slight shoulder of C13 TBDMS visible in Mega Mix 36 and 40 chromatograms; Supplementary Figure S5 and Figure 5). Mass spectra of the clean analytes compared to the co-elution are displayed in Supplementary Figure S8. This is a second reason for employing a mass spectrometric detector.
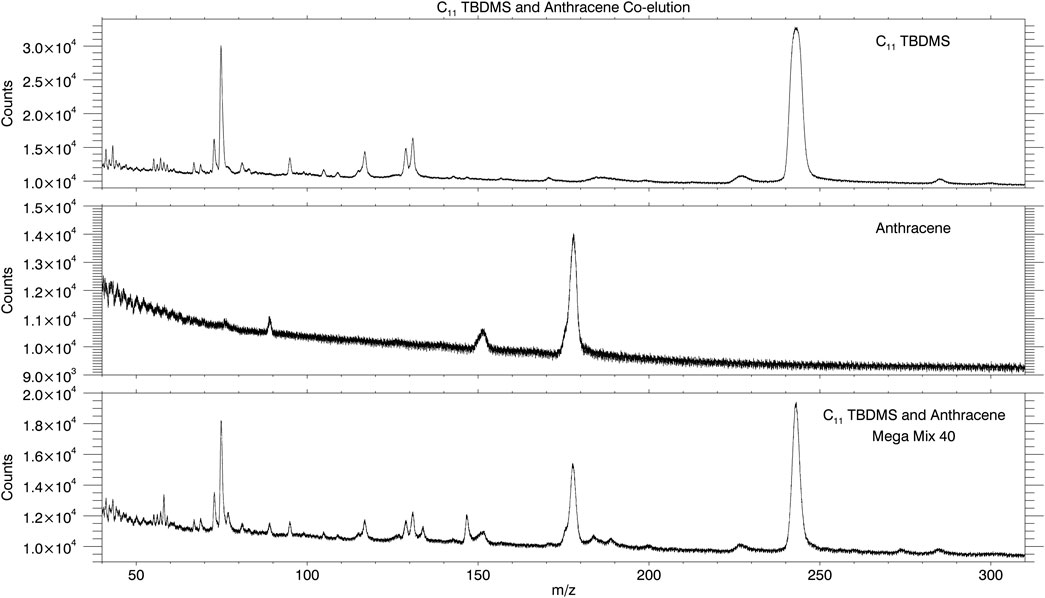
FIGURE 6. Mass spectrum of C11 TBDMS (top plot) taken from the mixture of fatty acid TBDMS (individual chemical family run) and mass spectrum of anthracene (middle plot) taken from the mixture of PAHs (individual chemical family run). Mass spectral features of both analytes are present in the single chromatographic peak of Mega Mix 40 confirming co-elution.
Peak capacity values were calculated for the Mega Mix 36 chromatographic separations (n = 6) and the average peak capacity value was 124 ± 2. This means that based on the peak shape and resolution provided by the MEMS GC column, 124 peaks can fit into the retention time range of ∼225–560 s. This is a useful measure of the analytical performance of the 5.5 m length MEMS column.
The average Cp/Δt for the Mega Mix 36 runs (n = 6) calculated for C14 ALK and C24, TBDMS, the first and last eluting peaks, is 0.375. From the single chromatogram plotted in Supplementary Figure S5, Cp/Δt values were calculated for 15 peak combinations providing an average value of 0.358. While by no means exhaustive (there would be 630 combinations for 36 baseline-separated peaks to compare), this calculation is representative enough to provide an average value. Maximum values of Cp/Δt were around 0.45 for alkane and FAME comparisons, very similar to the results presented in Table 5 for the individual chemical family runs. Mega Mix 36 and 40 chromatograms revealed an average N = 20,000 theoretical plates (HETP = 0.0275 cm) for analytes eluting prior to
Attempting to Optimize for the Best Resolution
The Mega Mix 40 chromatogram in Figure 5 shows baseline separation of the overwhelming majority of the analytes. However, as mentioned previously, there are some analytes not completely baseline separated ([C12 FAME—Ala, 2-TBDMS]; [Carbazole-Xanthone]; [C13 TBDMS—Ser, 3-TBDMS—C20 ALK]; [Glu, 3-TBDMS—C16 TBDMS]; [His, 3-TBDMS-C19 TBDMS]) and two analytes that are completely co-eluted ([C11 TBDMS—Anthracene]). In an attempt to improve the separation of these analytes, the oven temperature program was decreased from the 30°C min−1 ramp rate used in all previous data down to 15°C min−1 in 5°C min−1 intervals. The resulting chromatograms are displayed in Figure 7.
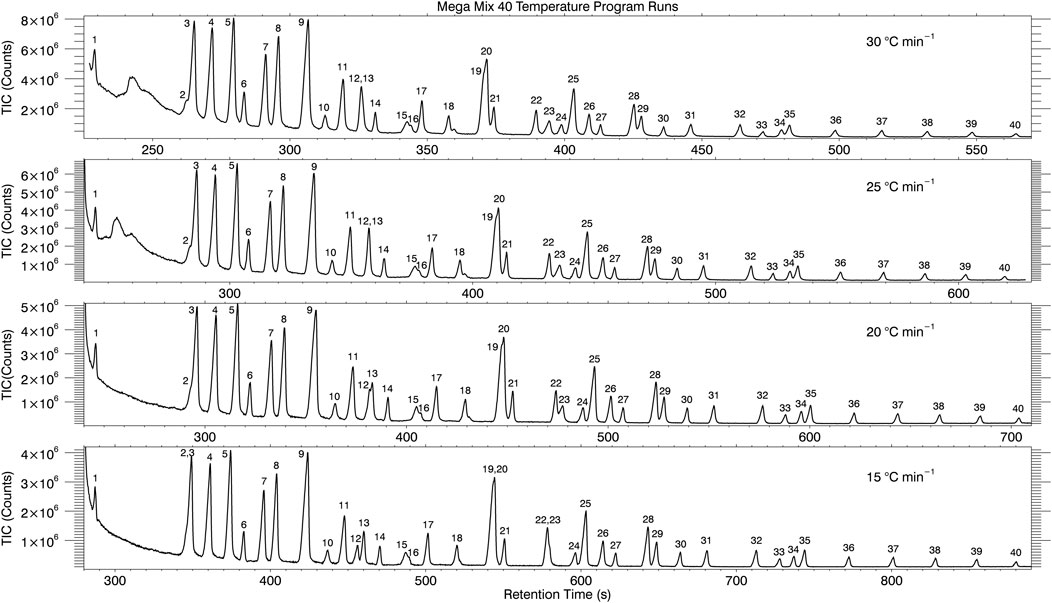
FIGURE 7. Oven temperature ramp programs from 30°C min−1–15°C min−1 in 5°C min−1 intervals attempting to optimize resolving power (separation of all components of Mega Mix 40).
Close inspection of these chromatograms reveals some improvement in chromatographic resolution as the oven temperature ramp is reduced for some of the analyte combinations mentioned above while others do not. The first example given above ([C12 FAME—Ala, 2-TBDMS]) are displayed by the peak elution number of 2 and 3 in Figure 7. At the 30°C min−1 ramp rate, a visible shoulder is seen for the C12 FAME peak before the higher abundance signal from Ala, 2-TBDMS. As the temperature ramp is decreased, the shoulder from the C12 FAME becomes less pronounced and almost blends in completely on the 15°C min−1 ramp (labeled as 2,3). The Carbazole-Xanthone example (labeled as 15 and 16) shows slightly decreased resolution with the decrease in temperature ramp rate. The three analyte example ([C13 TBDMS—Ser, 3-TBDMS—C20 ALK)] labeled 19, 20 and 21 shows improved resolution and separation between 20 and 21 as the temperature program is decreased, but 19 and 20 are co-eluted at the 15°C min−1 ramp. Glu, 3-TBDMS—C16 TBDMS, labeled 28 and 29, and His, 3-TBDMS–C19 TBDMS, labeled 34 and 35, also show improved separation as the temperature ramp is decreased. For the co-elution example of Anthracene—C11 TBDMS, the two peaks begin to separate (into peaks 12 and 13) at the 20°C min−1 ramp rate and further separate to near baseline separation at 15°C min−1. A separate example of analytes that were baseline-separated but result in co-elution at the 15°C min−1 oven ramp temperature are C14 TBDMS and Pyrene (labeled peaks 22 and 23). Optimization of the oven temperature ramp did not yield baseline separation of all components. A better option to increase chromatographic resolution and peak capacity is to utilize comprehensive two-dimensional gas chromatography (GC × GC).
GC × GC-FID Analysis
Comprehensive two-dimensional gas chromatography (GC×GC) (Liu and Phillips, 1991) separates components on two sequential columns with different stationary phases (different physical or chemical characteristics) to enhance separation power. The two columns are coupled together with a thermal or valve-based modulator to gate the effluent from the first column to the second column. GC × GC provides increased chromatographic resolution, increased peak capacity, and greater sensitivity at virtually no expense in separation time compared to 1D GC, and these advantages could be implemented into future spaceflight missions (Libardoni et al., 2020). We have previously demonstrated the analytical utility (advantages) of using GC × GC for in situ investigations of harsh environments (Blase et al., 2015; Libardoni and Blase, 2019). Previous MEMS technology based micro-thermal modulators (µTMs) (Kim et al., 2010, 2011) have been developed by our team members at the University of Michigan. The analytical capability of these µTMs was demonstrated with 21 volatile organic compounds (VOCs) separated in <3 min (Serrano et al., 2012), and 36 VOCs spanning a wide range of vapor pressure separated in 22 min (Collin et al., 2015). The present study provides the first demonstration of the MEMS GC column technology in a GC × GC configuration used for the analyses of large molecular mass compounds such as derivatized amino and fatty acids.
The comprehensive, two dimensional GC separation provides contour plots of the 1st dimension retention time, 2nd dimension retention time, and the peak area as the contour (or z-dimension coming out of the page). The centroid 1st and 2nd dimension times and peak areas are displayed in the contour plot of Figure 8. The colored contour map of the data displays the peak area of each chromatographic signal and the legend of the color (heat map) is shown at right. One of the distinct advantages of GC × GC is the chemical family groupings, or speciation, in the two-dimensional retention time space. Molecular species within the same type of chemical family fall along trendlines, which allow for a quick compound identification screening tool. In Figure 8, three trendlines are drawn to demonstrate chemical speciation.
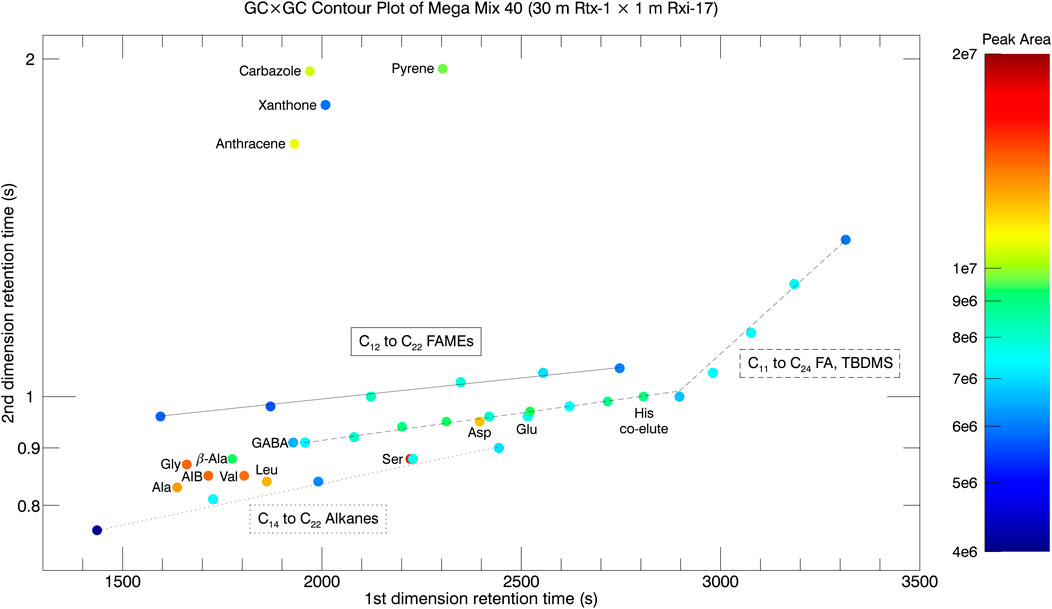
FIGURE 8. GC × GC contour plot of Mega Mix 40 taken on a 30 m Rtx-1 × 1 m Rxi-17 column configuration. The two-dimensional retention space shows the increased resolving power and peak capacity provided by GC × GC. The peak area contour values are shown at right. Chemical family groupings, or speciation, are depicted by the trendlines and labels for the species that fall on these trendlines. Amino acid derivatives are individually labeled since they do not fall along a simple trend line.
The solid trendline depicts the C12 to C22 FAMEs and where they fall in the two-dimension retention time space. The next trendline drawn is the dashed line for the C11 to C24 fatty acid tert-butyl dimethyl silyl (TBDMS) derivatives. The TBDMS derivatives are much larger chemical derivatives that perhaps introduce some steric hindrance to the dipole moment compared to the FAMEs and elute faster in the 2nd dimension column. The C11 to C20 fatty acid TBDMS derivatives fit on a single slope trendline while the C21 to C24 fatty acid derivatives deviate from the trend. This is due to the isothermal condition (GC oven temperature hold at 280°C for 10 min) beginning at 49 min, or 2,940 s. The last trendline is the dotted line depicting the C14 to C22 alkanes, which are nonpolar and therefore elute fastest through the 2nd dimension column.
The last two chemical families in Mega Mix 40 are the amino acids and polycyclic aromatic hydrocarbons (PAHs). The amino acids are diverse with many different R groups, and some amino acids containing 2 TBDMS derivatives and others containing 3 (Ser, Asp, Glu, His). For these reasons, the amino acids are sprinkled around the two-dimensional retention time space. The PAHs are well-separated from the rest of the chemical compounds in the 2nd dimension retention plane (space). Anthracene and Pyrene are 3- and 4-membered benzene ring structures and the pi-stacking of the double bonded electrons in the aromatic rings provide affinity for the phenyl portion of the stationary phase of the Rxi-17 secondary column. Pyrene is larger in molecular weight and has more electrons involved in the pi-stacking, and thus greater affinity for the 2nd dimension column and longer 2nd dimension retention time. Carbazole and Xanthone are pseudo-PAHs with cyclic aromatic structures but additional chemical moieties. Carbazole contains a 5-member cyclic ring with a secondary amine group and the 5-member cyclic ring bridging two benzene rings. Xanthone contains a 6-member cyclic ring with an ether and ketone and the 6-member ring being flanked by two benzene rings on either side. The net dipole moment of the secondary amine group in Carbazole is stronger than the net dipole moment of the ether and ketone of Xanthone due to their near symmetrical positions about the molecular structure.
In a second test, the 5.5 m MEMS GC column was inserted as the 1st dimension column instead of the 30 m Rtx-1 column. The 2nd dimension column stayed the same: 1.0 m × 0.10 mm x 0.10 μm (Rxi-17). The oven temperature programs remained the same but the helium carrier gas flow rate was changed to 1.2 ml min−1 to accomodate the shorter (5.5 m) MEMS column length. The modulation period was 5 s compared to 3 s with the 30 m commercial Rtx-1 column. The GC×GC contour plot for Mega Mix 40 taken with the 5.5 m MEMS column as the first dimension column is displayed in Figure 9. Similar separation of 39 of the 40 components (with a possible His co-elution with C19 TBDMS, or His is not seen) and chemical family speciation is observed for the 5.5 m MEMS column compared to the 30 m commercial column along with a 30 percent reduction in analysis time. There is an increase in the 2nd dimension retention time for all species, and this is most likely due to the combination of decreased carrier gas linear velocity in the 2nd dimension from the lower flow rate and lower temperature of the secondary column oven at the time of elution.
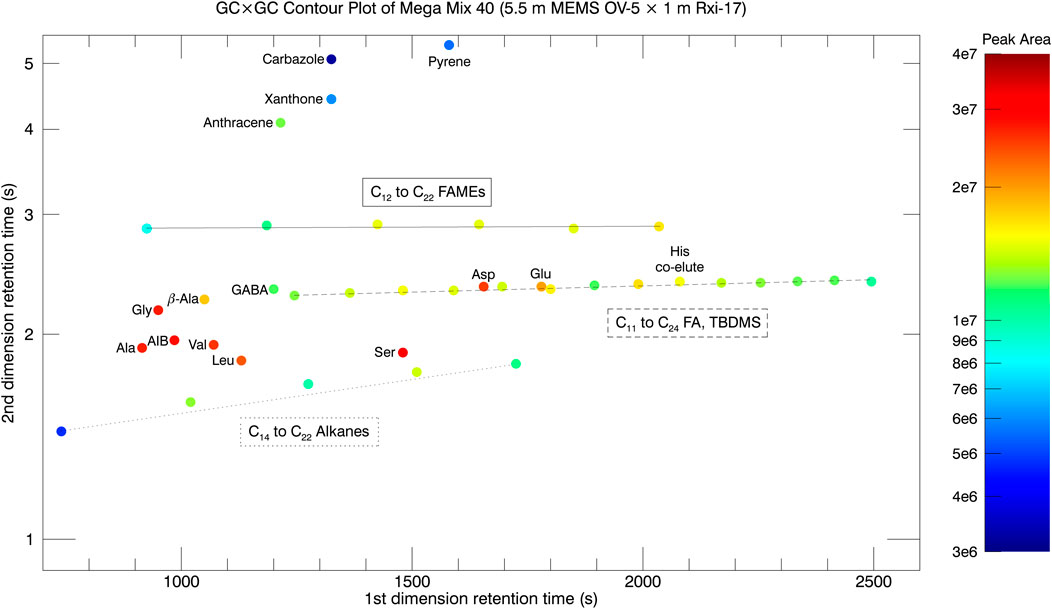
FIGURE 9. GC × GC contour plot of Mega Mix 40 with the 5.5 m MEMS GC column as the first dimension column.
The elution order for some analytes on the 5.5 m MEMS column GC × GC runs at 5°C min−1 changed relative to the elution order at 30°C min−1 for the MEMS GC-MS experiments. One example is elution 2 and 3 where the chromatograms in Figure 7 show C12 FAME 2) eluting before Ala 3) at 30°C min−1, but then co-elute at 15°C min−1. Reducing the temperature ramp even further down to 5°C min−1 inverted the elution order with Ala 2) eluting 10 s before C12 FAME (3). A second example is for Carbazole 15) and Xanthone 16) as labeled in Figure 7. Carbazole elutes before Xanthone with Xanthone showing up as the shoulder to the right side of the distribution at 30°C min−1 temperature ramp. As the temperature is decreased to 15°C min−1, the two peaks begin to merge together. In the 5°C min−1 temperature ramp GC × GC run, Xanthone and Carbazole are co-eluted in the 1st dimension but separate in the 2nd dimension with Xanthone eluting first. A third example is the elution order of C13 TBDMS 19) and Ser (20) as labeled in Figure 7. At a temperature ramp of 30°C min−1, C13 TBDMS elutes before Ser as evidenced by the shoulder to the left of the Ser peak. As the temperature ramp is decreased to 15°C min−1, the two peaks co-elute (are indistinguishable from each other). At the 5°C min−1 GC × GC run, the co-elution in the first dimension is still observed (same 1st dimension retention time) but is resolved in the 2nd dimension with Ser now eluting before C13 TBDMS in the 2nd dimension. The last example is for C14 TBDMS 22) and Pyrene 23) as labeled in Figure 7. This is the most dramatic example with the two peaks being baseline separated at a temperature ramp of 30°C min−1 but nearly completely co-eluting at 15°C min−1. For the 5°C min−1 GC × GC run, the elution order is reversed with Pyrene eluting 10 s before C14 TBDMS in the 5.5 m MEMS 1st dimension column.
Another interesting point of note is the difference in elution order for some of the analytes in the same 5°C min−1 GC × GC runs due to different stationary phases in the 1st dimension column The 5.5 m MEMS column employs OV-5 stationary phase (95% polydimethylsiloxane/5% phenyl), while the 30 m commercial column employs Rtx-1 (100% dimethylpolysiloxane). The different stationary phases change the retention (k’) and selectivity (α) factors, which are related to chemical interaction between the stationary phase and analytes, and hence cause changes in the elution order. For the 5.5 m MEMS GC column GC × GC run with oven temperature ramp of 5°C min−1, elution 2 is Ala and elution 3 is C12 FAME but the order is the opposite on the 30 m column. The next difference between the columns is the elution order of peaks 14, 15, and 16. For the 5.5 m MEMS column the elution order is C18 ALK, Xanthone, and Carbazole (with Xanthone and Carbazole co-eluting in the first dimension but being separated in the 2nd dimension with Xanthone eluting first in the 2nd dimension) while for the 30 m column the elution order is Carbazole, C18 ALK, and Xanthone. Peak elution order 19 and 20 are also different with Ser and C13 TBDMS eluting on the 5.5 m MEMS GC column (co-eluting in 1st dimension but Ser eluting first in the 2nd dimension) with the reverse happening for the 30 m column. The differences in elution order as a function of oven temperature ramp (thermodynamics) and stationary phase (retention and selectivity factors) emphasize the importance of utilizing a mass spectrometric detector for unambiguous, high confidence identification of all eluting analytes.
For the future of spaceflight landed missions, GC×GC could play an integral role in broad range chemical selectivity and detection and even targeted analyses of specific chemical compounds, i.e. biological molecules. GC × GC offers increased chromatographic resolution, sensitivity, and peak capacity without sacrificing analysis time. However, the coupling of the two columns requires thermal modulation and for MEMS systems requires the development of robust and dependable micro thermal modulation devices. Thermally modulated peaks can also be very narrow, hence the increased sensitivity, but require fast acquisition rate detectors (Blase et al., 2014). In this regard, the TOF mass spectrometer is a perfectly suited detector. These potential challenges must be addressed in future engineering developments to make the MEMS GC×GC dream into a reality.
Conclusion
The 5.5 m length MEMS GC column coupled with MASPEX (MEMS GC-MS) successfully separated a variety of organics and biologically relevant compounds important for the search for life in future landed missions. Our laboratory data show that this type of system has excellent potential to be part of a future integrated instrument that would also include sample processing (Glein et al., 2019). The MEMS GC-MS setup provided linear response for all chemical species tested over two orders of magnitude dynamic range. Extrapolated limits of detection (LODs) were in the single to tens of picomoles range (4–43 pmol for the analytes tested), approaching the nominal measurement sensitivity of 1 pmol (1 pmol per 1 g (∼1 ml) of Europan ice) from the Europa SDT Report (Hand et al., 2017). Improvements to the GC-MS system that would improve sensitivity and limit of detection (LOD) are:
1. Carrier gas removal or rejection prior to entering the ion source of the mass spectrometer by use of a jet separator.
2. Differentially pumped ion source with conductance limiting aperture for lower pressure achieved in the TOF mass analyzer.
3. Heated ion source to mitigate condensing out larger molecular weight species upon exiting the heated transfer line.
4. Increased gain on the MCP detector could provide for more signal and improved LODs, but introduces risk at the elevated pressure of the vacuum chamber and reduces the lifetime of the MCP.
MEMS GC column analytical performance was evaluated in terms of retention time reproducibility, resolution, and peak capacity. Retention time reproducibility was highly consistent with % RSD values commonly ≤ 0.3% for the individual chemical families at various concentrations, and ≤ 0.7% within the Mega Mixes with increased chemical (sample matrix) complexity. Comparing the individual chemical family runs with the Mega Mixes show retention time shifts from changing retention and selectivity factors and demonstrate the importance of the use of a mass spectrometric detector. Resolution values of the 5.5 m MEMS column were typically 200–300 with the resolution values exceeding 300 at the lower concentrations investigated. The peak capacity of the 5.5 m MEMS column was calculated to be 124 ± 2 in a 435 s retention time window.
The MEMS GC column was also successfully used as a 1st dimension column in comprehensive, two-dimensional gas chromatography (GC × GC). The MEMS GC column was coupled to a 1 m Rxi-17 column with a thermal modulator between the two columns and directly compared to a typical, commercial 30 m (Rtx-1) column. The MEMS GC column provided very similar performance compared to the commercial 30 m column, separating 39 of the 40 component Mega Mix (His either co-eluted with C19 TBDMS or could not be seen) while providing a 30 percent reduction in analysis time.
Data Availability Statement
The original contributions presented in the study are included in the article/Supplementary Material, further inquiries can be directed to the corresponding author.
Author Contributions
RB and ML collected all the data presented in the manuscript. RB wrote the first draft of the manuscript. All authors contributed to the writing and editing of the manuscript.
Funding
This work was supported by the Instrument Concepts for Europa Exploration (ICEE) 2 program through NASA grant 80NSSC19K0611.
Conflict of Interest
The authors declare that the research was conducted in the absence of any commercial or financial relationships that could be construed as a potential conflict of interest.
Publisher’s Note
All claims expressed in this article are solely those of the authors and do not necessarily represent those of their affiliated organizations, or those of the publisher, the editors, and the reviewers. Any product that may be evaluated in this article, or claim that may be made by its manufacturer, is not guaranteed or endorsed by the publisher.
Supplementary Material
The Supplementary Material for this article can be found online at: https://www.frontiersin.org/articles/10.3389/fspas.2022.828103/full#supplementary-material
References
Akapo, S. O., Dimandja, J.-M. D., Kojiro, D. R., Valentin, J. R., and Carle, G. C. (1999). Gas Chromatography in Space. J. Chromatogr. A 843, 147–162. doi:10.1016/S0021-9673(98)00947-9
Anderson, D. M., Biemann, K., Orgel, L. E., Oro, J., Owen, T., Shulman, G. P., et al. (1972). Mass Spectrometric Analysis of Organic Compounds, Water and Volatile Constituents in the Atmosphere and Surface of Mars: The Viking Mars Lander. Icarus 16, 111–138. doi:10.1016/0019-1035(72)90140-6
Barnes, J. W., Turtle, E. P., Trainer, M. G., Lorenz, R. D., MacKenzie, S. M., Brinckerhoff, W. B., et al. (2021). Science Goals and Objectives for the Dragonfly Titan Rotorcraft Relocatable Lander. Planet. Sci. J. 2, 130. doi:10.3847/PSJ/ABFDCF
Biemann, K. (2007). On the Ability of the Viking Gas Chromatograph-Mass Spectrometer to Detect Organic Matter. Proc. Natl. Acad. Sci. 104, 10310–10313. doi:10.1073/PNAS.0703732104
Biemann, K., Oro, J., Toulmin, P. I., Orgel, L. E., Nier, A. O., Anderson, D. M., et al. (1976). Search for Organic and Volatile Inorganic Compounds in Two Surface Samples from the Chryse Planitia Region of Mars. Science 194, 72–76. doi:10.1126/SCIENCE.194.4260.72
Blase, R. C., Libardoni, M. J., Miller, G. P., Miller, K. E., Phillips-Lander, C. M., Waite, J. H., et al. (2020). Experimental Coupling of a MEMS Gas Chromatograph and a Mass Spectrometer for Organic Analysis in Space Environments. ACS Earth Space Chem. 4, 1718–1729. doi:10.1021/acsearthspacechem.0c00131
Blase, R. C., Llera, K., Luspay-Kuti, A., and Libardoni, M. (2014). The Importance of Detector Acquisition Rate in Comprehensive Two-Dimensional Gas Chromatography (GC×GC). Separation Sci. Technology 49, 847–853. doi:10.1080/01496395.2013.866961
Blase, R. C., Patrick, E. L., Mitchell, J. N., and Libardoni, M. (2015). Analysis of Cave Atmospheres by Comprehensive Two-Dimensional Gas Chromatography (GC×GC) with Flame Ionization Detection (FID). Anal. Chem. Res. 3, 54–62. doi:10.1016/j.ancr.2014.09.002
Brinckerhoff, W. B., Pinnick, V. T., Van Amerom, F. H. W., Danell, R. M., Arevalo, R. D., Atanassova, M. S., et al. (2013). Mars Organic Molecule Analyzer (MOMA) Mass Spectrometer for ExoMars 2018 and beyond. IEEE Aerosp. Conf. Proc. doi:10.1109/AERO.2013.6496942
Brockwell, T. G., Meech, K. J., Pickens, K., Waite, J. H., Miller, G., Roberts, J., et al. (2016). The Mass Spectrometer for Planetary Exploration (MASPEX). IEEE Aerospace Conference Proceedings. IEEE Computer Society. doi:10.1109/AERO.2016.7500777
Cabedo, V., Llorca, J., Trigo-Rodriguez, J. M., and Rimola, A. (2021). Study of Fischer-tropsch-type Reactions on Chondritic Meteorites. A&A 650, A160. doi:10.1051/0004-6361/202039991
Cable, M. L., Porco, C., Glein, C. R., German, C. R., MacKenzie, S. M., Neveu, M., et al. (2021). The Science Case for a Return to Enceladus. Planet. Sci. J. 2, 132. doi:10.3847/PSJ/ABFB7A
Colin, L., and Hunten, D. M. (1977). 11. Pioneer venus experiment Descriptions. Space Sci. Rev. 20, 451–525. doi:10.1007/BF02186463
Collin, W. R., Bondy, A., Paul, D., Kurabayashi, K., and Zellers, E. T. (2015). μGC × μGC: Comprehensive Two-Dimensional Gas Chromatographic Separations with Microfabricated Components. Anal. Chem. 87, 1630–1637. doi:10.1021/AC5032226
de Zeeuw, J. (2020). Impact of GC Parameters on the Separation Part 2: Choice of Column Internal Diameter. Available at: www.sepscience.com.
Eigenbrode, J. L., Summons, R. E., Steele, A., Freissinet, C., Millan, M., Navarro-González, R., et al. (2018). Organic Matter Preserved in 3-Billion-Year-Old Mudstones at Gale Crater, Mars. Science 360, 1096–1101. doi:10.1126/science.aas9185
Ettre, L. S. (1987). M.J.E. Golay and the Invention of Open-Tubular (Capillary) Columns. J. High Resol. Chromatogr. 10, 221–230. doi:10.1002/JHRC.1240100503
Fenselau, C., Caprioli, R., Nier, A. O., Hanson, W. B., Seiff, A., Mcelroy, M. B., et al. (2003). Mass Spectrometry in the Exploration of Mars. J. Mass. Spectrom. 38, 1–10. doi:10.1002/JMS.396
Freissinet, C., Glavin, D. P., Mahaffy, P. R., Miller, K. E., Eigenbrode, J. L., Summons, R. E., et al. (2015). Organic Molecules in the Sheepbed Mudstone, Gale Crater, Mars. J. Geophys. Res. Planets 120, 495–514. doi:10.1002/2014JE004737
Freissinet, C., Knudson, C. A., Graham, H. V., Lewis, J. M. T., Lasue, J., McAdam, A. C., et al. (2020). Benzoic Acid as the Preferred Precursor for the Chlorobenzene Detected on Mars: Insights from the Unique Cumberland Analog Investigation. Planet. Sci. J. 1, 41. doi:10.3847/PSJ/ABA690
Glein, C. R., Waite, J. H., and Miller, K. E. (2019). MAss Spectrometer for Planetary Exploration-ORganic Composition Analyzer (MASPEX-ORCA) for Europa Lander and Other Missions to Icy Ocean Worlds. 2019 Astrobiology Science Conference. Seattle, Washington. Available at: https://agu.confex.com/agu/abscicon19/meetingapp.cgi/Paper/478962.
Goesmann, F., Brinckerhoff, W. B., Raulin, F., Goetz, W., Danell, R. M., Getty, S. A., et al. (2017). The Mars Organic Molecule Analyzer (MOMA) Instrument: Characterization of Organic Material in Martian Sediments. Astrobiology 17, 655–685. doi:10.1089/ast.2016.1551
Green, J., Hoehler, T., Neveu, M., Domagal-Goldman, S., Scalice, D., and Voytek, M. (2021). Call for a Framework for Reporting Evidence for Life beyond Earth. Nature 598, 575–579. doi:10.1038/s41586-021-03804-9
Grubisic, A., Trainer, M. G., Li, X., Brinckerhoff, W. B., van Amerom, F. H., Danell, R. M., et al. (2021). Laser Desorption Mass Spectrometry at Saturn's Moon Titan. Int. J. Mass Spectrom. 470, 116707. doi:10.1016/J.IJMS.2021.116707
Guzman, M., McKay, C. P., Quinn, R. C., Szopa, C., Davila, A. F., Navarro-González, R., et al. (2018). Identification of Chlorobenzene in the Viking Gas Chromatograph-Mass Spectrometer Data Sets: Reanalysis of Viking Mission Data Consistent with Aromatic Organic Compounds on Mars. J. Geophys. Res. Planets 123, 1674–1683. doi:10.1029/2018JE005544
Guzman, M., Szopa, C., Freissinet, C., Buch, A., Stalport, F., Kaplan, D., et al. (2020). Testing the Capabilities of the Mars Organic Molecule Analyser (MOMA) Chromatographic Columns for the Separation of Organic Compounds on Mars. Planet. Space Sci. 186, 104903. doi:10.1016/J.PSS.2020.104903
Hand, K. P., Murray, A. E., Garvin, J. B., Brinckerhoff, W. B., Christner, B. C., Edgett, K. S., et al. (2017). Report of the Europa Lander Science Definition Team, Technical Report.
Hartgers, W. A., Schouten, S., Lopez, J. F., Sinninghe Damsté, J. S., and Grimalt, J. O. (2000). 13 C-Contents of Sedimentary Bacterial Lipids in a Shallow Sulfidic Monomictic lake (Lake Cisó, Spain). Org. Geochem. 31, 777–786. doi:10.1016/S0146-6380(00)00095-4
Hässig, M., Libardoni, M., Mandt, K., Miller, G., and Blase, R. (2015). Performance Evaluation of a Prototype Multi-Bounce Time-Of-Flight Mass Spectrometer in Linear Mode and Applications in Space Science. Planet. Space Sci. 117, 436–443. doi:10.1016/J.PSS.2015.09.006
Israel, G., Cabane, M., Brun, J. F., Niemann, H., Way, S., Riedler, W., et al. (2002). Huygens Probe Aerosol Collector Pyrolyser experiment. Space Sci. Rev. 104, 433–468. doi:10.1023/A:1023640723915
Kim, S.-J., Reidy, S. M., Block, B. P., Wise, K. D., Zellers, E. T., and Kurabayashi, K. (2010). Microfabricated thermal Modulator for Comprehensive Two-Dimensional Micro Gas Chromatography: Design, thermal Modeling, and Preliminary Testing. Lab. Chip 10, 1647–1654. doi:10.1039/C001390K
Kim, S.-J., Serrano, G., Wise, K. D. K., Kurabayashi, K., and Zellers, E. T. E. (2011). Evaluation of a Microfabricated Thermal Modulator for Comprehensive Two-Dimensional Microscale Gas Chromatography. Anal. Chem. 83, 5556–5562. doi:10.1021/ac200336e
Lauro, S. E., Pettinelli, E., Caprarelli, G., Guallini, L., Rossi, A. P., Mattei, E., et al. (2020). Multiple Subglacial Water Bodies below the South Pole of Mars Unveiled by New MARSIS Data. Nat. Astron. 5 (5), 63–70. doi:10.1038/s41550-020-1200-6
Li, X., Danell, R. M., Pinnick, V. T., Grubisic, A., van Amerom, F., Arevalo, R. D., et al. (2017). Mars Organic Molecule Analyzer (MOMA) Laser Desorption/ionization Source Design and Performance Characterization. Int. J. Mass Spectrom. 422, 177–187. doi:10.1016/J.IJMS.2017.03.010
Libardoni, M., and Blase, R. C. (2019). Laser Thermal Desorption and GCxGC for Harsh Environment and Planetary Mass Spectrometry. Curr. Trends Mass. Spectrom. 17, 16–22.
Libardoni, M. J., Blase, R. C., Miller, K. E., Glein, C. R., Lander, C., and Waite, J. H. (2020). Multi-dimensional Separation of Volatile and Semi-volatile Organic Compounds for Deep Space and Outer Planetary Worlds. Curr. Top. Anal. Chem. 12, 1–13.
Liu, Z., and Phillips, J. B. (1991). Comprehensive Two-Dimensional Gas Chromatography Using an On-Column Thermal Modulator Interface. J. Chromatogr. Sci. 29, 227–231. doi:10.1093/CHROMSCI/29.6.227
Lovelock, J. E. (1965). A Physical Basis for Life Detection Experiments. Nature 207, 568–570. doi:10.1038/207568a0
MacKenzie, S. M., Neveu, M., Davila, A. F., Lunine, J. I., Craft, K. L., Cable, M. L., et al. (2021a). The Enceladus Orbilander Mission Concept: Balancing Return and Resources in the Search for Life. Planet. Sci. J. 2, 77. doi:10.3847/PSJ/ABE4DA
MacKenzie, S. M., Neveu, M., Davila, A., Lunine, J., Cable, M., Phillips-Lander, C. M., et al. (2021b). Science Objectives for Flagship-Class mission Concepts for Life Detection at Enceladus. Astrobiology in review.
Mahaffy, P. R., Webster, C. R., Cabane, M., Conrad, P. G., Coll, P., Atreya, S. K., et al. (2012). The Sample Analysis at mars Investigation and Instrument Suite. Space Sci. Rev. 170, 401–478. doi:10.1007/s11214-012-9879-z
Mawhinney, T. P., and Madson, M. A. (1982). N-Methyl-N-(tert-butyldimethylsilyl)trifluoroacetamide and Related N-Tert-Butyldimethylsilyl Amides as Protective Silyl Donors. J. Org. Chem. 47, 3336–3339. doi:10.1021/JO00138A032
McKay, C. P. (2004). What Is Life-And How Do We Search for it in Other Worlds? PLOS Biol. 2, e302. doi:10.1371/JOURNAL.PBIO.0020302
Millan, M., Teinturier, S., Malespin, C. A., Bonnet, J. Y., Buch, A., Dworkin, J. P., et al. (2021). Organic Molecules Revealed in Mars's Bagnold Dunes by Curiosity's Derivatization experiment. Nat. Astron. 6, 129–140. doi:10.1038/s41550-021-01507-9
Mukhin, L. M., Nenarokov, D. F., Porschnev, N. V., Bondarev, V. B., Gelman, B. G., Israe`l, G., et al. (1987). Preliminary Calibration Results of VEGA 1 and 2 SIGMA-3 Gas Chromatograph. Adv. Space Res. 7, 329–335. doi:10.1016/0273-1177(87)90240-7
Navale, V., Harpold, D., and Vertes, A. (1998). Development and Characterization of Gas Chromatographic Columns for the Analysis of Prebiological Molecules in Titan's Atmosphere. Anal. Chem. 70, 689–697. doi:10.1021/AC9708598
Neveu, M., Hays, L. E., Voytek, M. A., New, M. H., and Schulte, M. D. (2018). The Ladder of Life Detection. Astrobiology 18, 1375–1402. doi:10.1089/ast.2017.1773
Niemann, H. B., Atreya, S. K., Bauer, S. J., Biemann, K., Block, B., Carignan, G. R., et al. (2002). The Gas Chromatograph Mass Spectrometer for the Huygens Probe. Space Sci. Rev. 104, 553–591. doi:10.1023/A:1023680305259
Niemann, H. B., Atreya, S. K., Bauer, S. J., Carignan, G. R., Demick, J. E., Frost, R. L., et al. (2005). The Abundances of Constituents of Titan's Atmosphere from the GCMS Instrument on the Huygens Probe. Nature 438, 779–784. doi:10.1038/nature04122
Niemann, H. B., Atreya, S. K., Demick, J. E., Gautier, D., Haberman, J. A., Harpold, D. N., et al. (2010). Composition of Titan's Lower Atmosphere and Simple Surface Volatiles as Measured by the Cassini-Huygens Probe Gas Chromatograph Mass Spectrometer experiment. J. Geophys. Res. 115, 12006. doi:10.1029/2010JE003659
Novotny, M., Hayes, J. M., Bruner, F., and Simmonds, P. G. (1975). Gas Chromatographic Column for the Viking 1975 Molecular Analysis Experiment. Science 189, 215–216. doi:10.1126/SCIENCE.189.4198.215
Orosei, R., Lauro, S. E., Pettinelli, E., Cicchetti, A., Coradini, M., Cosciotti, B., et al. (2018). Radar Evidence of Subglacial Liquid Water on Mars. Science 361, 490–493. doi:10.1126/science.aar7268
Oyama, V. I., and Berdahl, B. J. (1977). The Viking Gas Exchange Experiment Results from Chryse and Utopia Surface Samples. J. Geophys. Res. 82, 4669–4676. doi:10.1029/JS082I028P04669
Oyama, V. I., Carle, G. C., Woeller, F., and Pollack, J. B. (1979a). Laboratory Corroboration of the Pioneer Venus Gas Chromatograph Analyses. Science 205, 52–54. doi:10.1126/science.205.4401.52
Oyama, V. I., Carle, G. C., Woeller, F., and Pollack, J. B. (1979b). Venus Lower Atmospheric Composition: Analysis by Gas Chromatography. Science 203, 802–805. doi:10.1126/SCIENCE.203.4382.802
Oyama, V. I. (1972). The Gas Exchange experiment for Life Detection: The Viking Mars Lander. Icarus 16, 167–184. doi:10.1016/0019-1035(72)90144-3
Rodier, C., Sternberg, R., Raulin, F., and Vidal-Madjar, C. (2001). Chemical Derivatization of Amino Acids for In Situ Analysis of Martian Samples by Gas Chromatography. J. Chromatogr. A 915, 199–207. doi:10.1016/S0021-9673(01)00625-2
Rotelli, L., Trigo-Rodríguez, J. M., Moyano-Cambero, C. E., Carota, E., Botta, L., Di Mauro, E., et al. (2016). The Key Role of Meteorites in the Formation of Relevant Prebiotic Molecules in a Formamide/water Environment. Sci. Rep. 6, 1–7. doi:10.1038/srep38888
Rushneck, D. R., Diaz, A. V., Howarth, D. W., Rampacek, J., Olson, K. W., Dencker, W. D., et al. (1978). Viking Gas Chromatograph-Mass Spectrometer. Rev. Scientific Instr. 49, 817–834. doi:10.1063/1.1135623
Scheller, E. L., Ehlmann, B. L., Hu, R., Adams, D. J., and Yung, Y. L. (2021). Long-term Drying of Mars by Sequestration of Ocean-Scale Volumes of Water in the Crust. Science 372, 56–62. doi:10.1126/SCIENCE.ABC7717
Serrano, G., Paul, D., Kim, S.-J., Kurabayashi, K., and Zellers, E. T. (2012). Comprehensive Two-Dimensional Gas Chromatographic Separations with a Microfabricated thermal Modulator. Anal. Chem. 84, 6973–6980. doi:10.1021/AC300924B
Summons, R. E., Albrecht, P., Mcdonald, G., Moldowan, J. M., Summons, R. E., Albrecht, P., et al. (2007). Molecular Biosignatures. Space Sci. Rev. 135, 133–159. doi:10.1007/S11214-007-9256-5
Szopa, C., Freissinet, C., Glavin, D. P., Millan, M., Buch, A., Franz, H. B., et al. (2020). First Detections of Dichlorobenzene Isomers and Trichloromethylpropane from Organic Matter Indigenous to Mars Mudstone in Gale Crater, Mars: Results from the Sample Analysis at Mars Instrument Onboard the Curiosity Rover. Astrobiology 20, 292–306. doi:10.1089/AST.2018.1908
Keywords: gas chromatography, mass spectrometry, micro-electro-mechanical systems (MEMS), planetary exploration, landed missions, life detection, biosignatures
Citation: Blase RC, Libardoni MJ, Miller GP, Miller KE, Phillips-Lander CM, Glein CR, Waite JH, Ghosh A, Venkatasubramanian A, Li MW-h, Stephens A, Fan X and Kurabayashi K (2022) MEMS GC Column Performance for Analyzing Organics and Biological Molecules for Future Landed Planetary Missions. Front. Astron. Space Sci. 9:828103. doi: 10.3389/fspas.2022.828103
Received: 02 December 2021; Accepted: 24 January 2022;
Published: 18 February 2022.
Edited by:
Francesca Altieri, Institute for Space Astrophysics and Planetology (INAF), ItalyReviewed by:
Josep M. Trigo-Rodríguez, Institute of Space Sciences (CSIC), SpainMarzio Rosi, University of Perugia, Italy
Copyright © 2022 Blase, Libardoni, Miller, Miller, Phillips-Lander, Glein, Waite, Ghosh, Venkatasubramanian, Li, Stephens, Fan and Kurabayashi. This is an open-access article distributed under the terms of the Creative Commons Attribution License (CC BY). The use, distribution or reproduction in other forums is permitted, provided the original author(s) and the copyright owner(s) are credited and that the original publication in this journal is cited, in accordance with accepted academic practice. No use, distribution or reproduction is permitted which does not comply with these terms.
*Correspondence: Ryan C. Blase, cmJsYXNlQHN3cmkuZWR1