 S. M. Díaz Castillo
 A. Asensio Ramos
 C. E. Fischer
 S. V. Berdyugina
- 1Leibniz-Institut für Sonnenphysik (KIS), Freiburg, Germany
- 2Physikalisches Institut, Albert-Ludwigs-Universität Freiburg, Freiburg, Germany
- 3Instituto de Astrofísica de Canarias (IAC), San Cristóbal de La Laguna, Spain
- 4Departamento de Astrofísica, Universidad de La Laguna, San Cristóbal de La Laguna, Spain
- 5National Solar Observatory (NSO), Boulder, CO, United States
Solar granulation is the visible signature of convective cells at the solar surface. The granulation cellular pattern observed in the continuum intensity images is characterised by diverse structures e.g., bright individual granules of hot rising gas or dark intergranular lanes. Recently, the access to new instrumentation capabilities has given us the possibility to obtain high-resolution images, which have revealed the overwhelming complexity of granulation (e.g., exploding granules and granular lanes). In that sense, any research focused on understanding solar small-scale phenomena on the solar surface is sustained on the effective identification and localization of the different resolved structures. In this work, we present the initial results of a proposed classification model of solar granulation structures based on neural semantic segmentation. We inspect the ability of the U-net architecture, a convolutional neural network initially proposed for biomedical image segmentation, to be applied to the dense segmentation of solar granulation. We use continuum intensity maps of the IMaX instrument onboard the Sunrise I balloon-borne solar observatory and their corresponding segmented maps as a training set. The training data have been labeled using the multiple-level technique (MLT) and also by hand. We performed several tests of the performance and precision of this approach in order to evaluate the versatility of the U-net architecture. We found an appealing potential of the U-net architecture to identify cellular patterns in solar granulation images reaching an average accuracy above 80% in the initial training experiments.
1 Introduction
The solar photosphere is the lowest visible layer of the solar atmosphere, where the solar plasma changes from almost completely opaque to almost completely transparent, forming the so-called solar surface (Stix, 2002). Continuum intensity images of this layer reveal the existence of the solar granulation. It covers most of the solar surface and is characterized by a recurrent and dynamical cellular pattern. Individual elements are called granules, which are relatively small and bright bubble-like structures with horizontal scales in the order of megameters (103 km) evolving on timescales of minutes (Nordlund et al., 2009). Solar granules are evidence of the overturning convection process occurring at the solar interior, where hot plasma rises at their centre, then cools down and sinks downward at the edges (Stix, 2002). An intergranular region forms when the granule’s cool plasma drives down into the solar interior. This relatively darker narrow lane surrounding the granules is another identifiable structure at the solar surface. (Nordlund et al., 2009).
Detailed studies of small-scale phenomena on the solar surface have shown specific and systematic morphological patterns in the granulation. A type of pattern that has been studied extensively is the so-called Exploding granules. They were first described by Carlier et al. (1968) as special types of granules with sizes 2–3 times bigger than regular ones, being a product of their rapid horizontal expansion. Based on their morphology, exploding granules are characterized by a reduction in the continuum intensity in their centre, generating a “dark dot”, which eventuality evolves by fragmenting (Kitai and Kawaguchi, 1979; Namba, 1986; Hirzberger et al., 1999). Several observational and numerical studies revealed that exploding granules have a close relationship with mesogranular dynamics (Domínguez Cerdeña, 2003; Roudier et al., 2003; Roudier and Muller, 2004), small-scale magnetic field diffusion and concentration (Roudier et al., 2016; Malherbe et al., 2018), and small-scale magnetic flux emergence (De Pontieu, 2002; Palacios et al., 2012; Rempel, 2018; Guglielmino et al., 2020). Another extensively studied pattern are Bright points, point-like bright elements localized within intergranular lanes and which can be clearly identified in certain photospheric spectral bands such as the Fraunhofer’s G band (Muller and Roudier, 1984). Those are mostly related with magnetic field elements, being perfect tracers of high magnetic field concentrations in intensity images ((Bellot Rubio and Orozco Suárez, 2019) and references therein). More recently, Granular lanes have been reported as another subgranular pattern of interest (Steiner et al., 2010). Those are arch-like signatures moving from the boundary of a granule into the granule itself. In general, they do not completely cover the granules and are associated with a linear polarisation signal, which corresponds to the emergence of horizontal magnetic fields (Fischer et al., 2020). Granular lanes were described in simulations as signatures of underlying tubes of vortex flow with their axis oriented parallel to the solar surface (Steiner et al., 2010).
The capabilities of the new and upcoming solar telescopes (Daniel K. Inouye Solar Telescope–DKIST (Rimmele et al., 2020) or Balloon-borne telescope Sunrise III (Solanki et al., 2017)) will provide us with large amounts of unprecedented high-resolution images, which could reveal the next level of complexity of granulation. The statistical study of photospheric plasma dynamics at this level of resolution will rely on the correct identification, classification and localization of systematic structures. For this specific task, automatic solutions can be implemented, for instance, Machine Learning techniques (ML) have demonstrated promising results in classification tasks on solar images (Armstrong and Fletcher, 2019; Love et al., 2020; Baek et al., 2021; Chola and Benifa, 2022). The demonstrated effectiveness of those algorithms in pattern identification tasks has motivated us toward the exploration of Deep Learning (DL) in semantic segmentation tasks, i.e., producing automatically labelled maps at the pixel level in order to rapidly distinguish diverse granulation patterns, such as described previously.
Machine Learning techniques have acquired high popularity in resolving diverse problems in daily life during the last decade. For instance, giving computers the ability to learn representations without being directly programmed for a specific task has been extensively leveraged in computer vision (Sebe et al., 2005). Convolutional Neural Networks (CNNs) were particularly developed for image recognition tasks (Le Cun et al., 1997; Krizhevsky et al., 2012). Inspired by biological visual perception, CNNs are trained to react to specific image features, starting from simple forms, as lines or edges, and then detecting more complex and abstract patterns in subsequent layers (Ghosh et al., 2020). Sequentially combining layers inside the network to progressively extract higher-level features is the main line of the DL success (Aloysius and Geetha, 2017). Taking advantage of large amounts of data, this approach may achieve unprecedented performance on several perception tasks, e.g., instance classification (Simonyan and Zisserman, 2015; Huang et al., 2017), object detection (Girshick, 2015) or optical flow estimation (Ilg et al., 2017).
Another task that saw an important push forward with DL was dense prediction, i.e., prediction at a pixel level in images, such as semantic segmentation (Shelhamer et al., 2017; Chen et al., 2018), which solves the classification problem working at pixel resolution. More specifically, the aim is to group the pixels of an image into categories, providing precise localization of labeled structures. Additionally, semantic segmentation seeks to partition the image into semantic meaningful parts (Szeliski, 2011). This paradigm has been successfully addressed using Encoder-Decoder architectures (Badrinarayanan et al., 2017; Yanli and Pengpeng, 2021). Leveraging the properties of CNNs, this type of architecture is capable of producing spatially consistent classification maps, thus providing precise localization of objects of interest.
In this work, we propose to train supervisedly and evaluate the performance of a CNN to carry out solar granulation segmentation. To this end, we apply an encoder-decoder architecture called U-net (Ronneberger et al., 2015). This architecture was developed for biomedical image segmentation tasks, and it is especially interesting for our objectives since it has been successfully applied to cellular pattern segmentation. It can work with few training images, and it achieves high levels of accuracy in the localization of specific structures (Ronneberger et al., 2015).
2 Methods
2.1 U-Net Architecture
A U-net is composed of fully CNN layers organized in an encoder-decoder architecture (Ronneberger et al., 2015)1. The encoder part (left side of Figure 1) is responsible for producing a low dimensionality dense representation of an image. In the initial stage, the contracting network receives an image of a specific size H (height) × W (width), which is downsampled by sequential layers, each composed by the following operations:
1. Two 3 × 3 padded convolution operations each followed by a rectified linear unit (entire operation represented by orange arrows in the Figure 1). As the fundamental components of the convolutional neural network, 2D convolution operations transform the image into feature maps using a set of filters or kernels. Those resulting feature maps then pass through a non-linear activation function. We use a set of 64 3 × 3 kernels generating features maps of 64 (depth) × H × W in the initial operation. Then for the subsequent one, each kernel will have a depth dimension, which corresponds to the feature map depth previously generated. We used padded operations in order to not change the size of the input map during the convolution operations (Dumoulin and Visin, 2016). U-net convolutional operations use a rectified linear unit (ReLU) as the default activation function, which gives the non-linear character to the network. This function is characterized by being linear for input positive values and zero for input negative values. It is well-behaved and converges fast when using the stochastic gradient descent algorithm. Consequently, it is commonly used as an activation function in deep neural networks (Schmidhuber, 2014).
2. A 2 × 2 max-pooling operation with stride 2, which reduces the dimensions of the input map by computing the maximum value of each successive 2 × 2 pixel set to produce a downsampled map (pink arrows in Figure 1). During this process, the spatial information is reduced by a factor of two, while the feature information is increased by a factor of two.
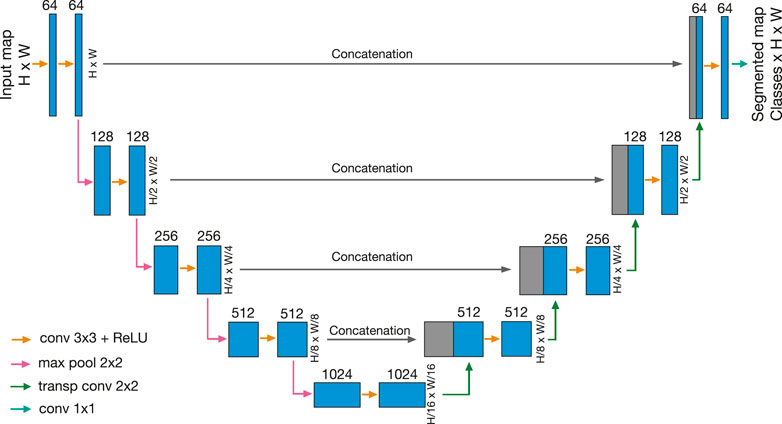
FIGURE 1. Schematic sketch of the U-net architecture used, going sequentially from left to right. Each blue box corresponds to a feature map. The depth of the map is denoted on top of the box. Gray boxes represent copied feature maps. The arrows denote the different operations. We use 64 kernels (feature information) for the initial kernel set, whose number increases sequentially in the contraction levels and decreases in the expansion levels as seen in the feature maps depth values. Based on the intrinsic properties of a fully convolutional neural network, the height (H) and width (W) of the input images can be arbitrary numbers but must be equal (squared maps). For the training procedure, we use input maps of sizes of 128 × 128. Sketch modified from (Ronneberger et al., 2015).
When the lower level is reached, the lower feature map is then expanded by upsampling sequential layers in the decoder part (right side of the Figure 1), which is responsible for recovering the initial spatial dimension. This expanding network consists of upsampled layers, each composed by:
1. Two 3 × 3 padded convolution operations, each followed by a rectified linear unit (orange arrows in the Figure 1) equivalent to the operations of the encoder part.
2. A 2 × 2 transposed convolution with stride 2 as the upsampling operation (green arrows in Figure 1). Those seek to reverse the encoder downsampling operations, while broadcasting input elements via a set of 2 × 2 kernels, thereby producing an output that is larger than the input (Dumoulin and Visin, 2016). During this process, the spatial information is increased by a factor of two, while the feature information is reduced by a factor of two.
As the outstanding component of the U-net architecture, each expansion layer is concatenated with high-resolution features from the encoder path at the same level (see grey blocks in Figure 1), giving the network the capacity to localize with precision. We use five levels of contraction and expansion, like in the original U-net model, giving it its characteristic symmetrical shape. Finally, at the end of the sequence, a 1 × 1 convolution operation produces probability maps per class as output with the same sizes as the original map. Using the configuration shown in Figure 1, our model employs around 31 million trainable parameters or hyperparameters.
2.2 Ground-Truth Data
2.2.1 Observational Dataset: IMaX/Sunrise
In order to train the model using supervised training, we should provide it with a suitable set of data for the segmentation process, i.e., a ground-truth. We are interested in classifying specific patterns in observational images of the solar surface seen in the continuum. Based on our requirements of high-spatial-resolution data, we select the products of the Imaging Magnetograph eXperiment (IMaX) (Martínez Pillet et al., 2011), the filterpolarimeter onboard the Sunrise I balloon-borne telescope during its flight in June 2009 (Barthol et al., 2011; Solanki et al., 2010). IMaX was tuned to the Fei at 525.02 nm highly Zeeman-sensitive line, and provided measurements of the local continuum intensity near this line. After phase diversity reconstruction, each map reached a spatial resolution of around 0”.15 ≈ 100 km over the solar surface (pixel scale 0”.05) and a field of view (FOV) of 50” × 50” ≈ 35 × 35 Mm (Martínez Pillet et al., 2011). Those data products are freely accessible on https://star.mps.mpg.de/sunrise/. We select a time series of 56 min with a cadence of 30 s resulting in 113 individual frames. We selected the frames with the highest quality and spread out in time to obtain as much as possible a diverse data set. Due to the apodization needed for image reconstruction, a portion of the edges was lost. Taking all the above in consideration, our ground-truth dataset is composed of eight frames of 768 × 768 pixels each, with a FOV of 38” × 38” (see one frame as example in Figure 2 map A).
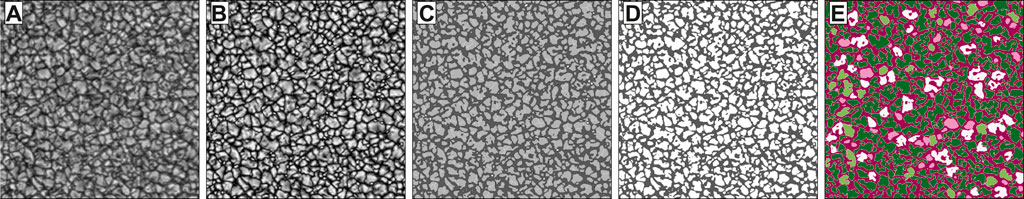
FIGURE 2. Frame example of IMaX/Sunrise during the labeling procedure. (A) Reconstructed continuum intensity map, (B) Initial segmentation results using 25 descending detection thresholds, (C) Merging and shrinking results, (D) Result map differentiating integranular lanes and granules cells as single units, (E) Manual selection into defined categories: intergranular lane (dark violet), uniform-shaped granules (pink), granules with a dot (white), granules with a lane (light green) and complex-shaped granules (dark green).
2.2.2 Labeling Structures
In a supervised learning approach, we need to provide an initial truth segmentation of our selected dataset in order to properly train the model. In previous studies, the identification and tracking of specific granular structures have been done mostly manually with the help of intensity multi-threshold algorithms (Javaherian et al., 2014; Ellwarth et al., 2021). For our experiment, we select a common multi-threshold algorithm MLT4 (Bovelet and Wiehr, 2001; Bovelet and Wiehr, 2007) used for segmenting photospheric structures for the initial granular identification (see for instance (Riethmüller et al., 2008; Fischer et al., 2019; Kaithakkal and Solanki, 2019)) which is freely available2. We adopt this approach to assess the extent to which user intervention affects the training process on the network. In particular, for labeling our structures at a pixel level we follow a procedure composed of two phases:
1. Semi-automatic granules identification: Using the Multiple-Level Pattern Recognition algorithm–MLT4 (Bovelet and Wiehr, 2001; Bovelet and Wiehr, 2007), we segregated the intergranular regions and the granular pattern. This is a top-down segmentation technique of brightness structures based on a sequence of descending detection thresholds (Bovelet and Wiehr, 2007). The algorithm uses the reconstructed and normalized continuum intensity maps as input (see one frame as an example in Figure 2 map A). The procedure starts with an initial segmentation of features at equidistant intensity levels as shown in map B of Figure 2, and then the pixel brightness level is normalized within each cell to its maximum value. Consecutively, a semi-automatic procedure of merging over-segmented cells and (4) shrinking these brightness-normalized cells to features of adequate sizes is performed, resulting in maps such as map C of Figure 2. Regarding the setup parameters used, we selected 25 descending thresholds, 0.47 as a normalized reference for merging and 0.38 as the unitary cut threshold for shrinking. The unitary cut threshold controls the final size of the recognized features, initially derived from a normalized brightness histogram for the full sample of recognized cells, which was then tuned by visual inspection. The rest of input parameters were set to their default value (Bovelet and Wiehr, 2001). The resulting maps are composed of several hundred individual cells (granules) separated from the intergranular space as shown in map D of the Figure 2.
2. Fully manual granules classification: Based on the basic instantaneous morphological features of the granular phenomena that we seek to classify, we propose an initial set of granule classes characterised by the presence of a central dot signatures or an arch-like lane signatures. For completeness, we include two categories that refer to extreme levels of complexity in granules: 1) morphologies with low complexity, i.e. uniform and clean morphologies with circular or ellipsoid shapes, and 2) morphologies with high complexity, i.e. abnormal granules having combinations of dark spots or lanes. In that sense and using the map products of the previous procedure, we classified manually the set of individual cells into four categories: granules with a dot (cells with dark point-shape features close to the centre of the cell), granules with a lane (cells with a dark arch-like lane following a bright rim mark inside the cell structure), uniform-shaped granules (cells with uniform intensity distribution and with elliptical or circular shapes) and complex-shaped granules (all remaining cells). The map E of the Figure 2 shows the results of the manual classification, where each colour corresponds to a specific classification, equivalently to the ground-truth maps in the Figure 4A; Figure 5A. During the selection via visual inspection, we pursue to classify all individual granules per class unequivocally to avoid ambiguity.
We perform this two-step procedure for all pixels of the eight selected frames, generating one ground-truth labeled map for each continuum intensity map. We are interested in evaluating independently and unbiased the performance of our model and simultaneously providing it with as many training examples as possible, thus we split our dataset in such a way that seven frames are used for the training set and one is used for the validation/test set. As an example, Figure 2 shows the intermediate steps in the complete labeling procedure for the validation/test map.
2.3 Training Strategy
Although the U-net architecture has demonstrated a good performance even with a few per-class training examples, it is essential to provide it with a large and diverse set of training data. In that sense, we divided the full FOV of all available maps into several sub-maps of a fixed size. As we are interested in predicting the class of each granule, we select sub-maps of the size 128 × 128 pixels
We identified a severely skewed class distribution in the labeled data, where 85% of the pixels of all available maps are associated to two classes (intergranular lane 40% and complex-shaped granules 45%) and the remaining 15% of the pixels belong to the underrepresented classes (granules with a dot 8%, granules with a lane 3% and uniform-shaped granules 4%). This is a known difficulty that affects all classification machine learning algorithms because the metrics used for training assume an equivalent proportion of examples of each class. This assumption decreases the performance of the model for underrepresented classes (He and Garcia, 2009; Fernández et al., 2018). Many strategies have been developed to overcome this issue in computer vision paradigms [see, e.g., (He et al., 2008; He and Garcia, 2009; He and Ma, 2013; Huang et al., 2016; Khan et al., 2017; Oksuz et al., 2020)], however, it is still an active topic research in semantic segmentation tasks [see, e.g., (Havaei et al., 2017; Olã Bressan et al., 2022; Zou et al., 2021)].
We addressed the imbalance-class issue in this work by including a stratified random sub-map sampling previous to the augmentation procedure as follows. 1) We defined weighted pixel maps for each full image, in which the greater weights were given to areas where underrepresented classes were localized. 2) We applied a softmax function to compute probability distribution maps. Those probability distributions were included in a weighted random choice function, which returned sub-maps centred on underrepresented classes regions. With this method, we increased the pixel proportion of the underrepresented classes to 22% in our training dataset. We noticed that this proportion has an upper limit due to the size of the sub-maps. The reason is that the surface covered by underrepresented classes is smaller than the size of the sub-maps, which is mostly covered by the background classes (i.e., intergranular regions and several complex-shaped granules).
An additional strategy towards solving class imbalance is an appropriate selection of the loss function. Neural networks applications learn via optimization, which requires a suitable cost/loss functions to calculate the model error. The iterative process of hyperparameter tuning is controlled by the loss function minimization, which, at the end of the training, ideally provides the best model setup for the assigned task. In particular, metrics for semantic segmentation have been historically dominated by global approaches, like the Cross-Entropy loss (Aggarwal, 2018). Defined as CE = − log(pt), where pt corresponds to the estimated probability for a correct classification for a specific class t, the cross-entropy loss evaluates the overall proportion of the correctly classified pixels as the precision measurement. However, these scores are dominated by the background classes in skewed datasets. Typically, the addition of a cost-sensitive weighting factor α is used in cross-entropy, known as α-balance variant. This seeks to balance the importance of well-classified over the wrong-classified examples in cases of skewed datasets. For several classes, the α factor can be considered as a weight vector with values inversely proportional to the frequency of each class (Lin et al., 2017).
For our experiments, we test the accuracy and effectiveness of two different loss functions during the network training, which are commonly used for imbalanced data problems:
1. The Focal Loss was developed for addressing the unbalance-class problem by adding a modulating factor
2. The Intersection-over-Union (IoU) loss or Jaccard index was extensively used in semantic segmentation tasks. It is focused on determining the similarity between finite sample sets (Jaccard, 1912). For images, the IoU measures the agreement between any predicted region and its corresponding ground-truth region by measuring the intersection between the prediction and the ground-truth normalized by their union. The IoU loss can take into account the frequency of the classes, and thus it is considered robust to the class imbalance problem (Leivas Oliveira, 2019). For multi-class classification tasks like the one we pursue here, the mean IoU (mIoU) loss function is often used, which initially computes the Jaccard index for each class and then computes the average over all classes.
For comparative purposes, we computed the standard evaluation metrics for semantic segmentation. We computed the overall accuracy, measured as the ratio between the correctly predicted pixels and the total number of pixels, and the mean pixel accuracy per class measured as the average of the correctly predicted pixels per class over the total ground-truth pixels per class. Likewise, we compare the test performance with performance parameters during the execution of the training. In this sense, we monitor the average per epoch of the loss value given its loss function (average loss) and the average overall accuracy per epoch (accuracy).
3 Results
We implemented the model and the training using the open-source PyTorch (Paszke et al., 2019) framework3. All our training cases have been performed with an NVIDIA GeForce 2080 Ti GPU and an NVIDIA Tesla P100 GPU. We generated 27,000 sub-maps in the training dataset and 3,000 sub-maps in the validation dataset from the augmentation procedure previously described. We used the Adam stochastic gradient algorithm (Kingma and Ba, 2014) for optimization. In this case, the gradient is estimated from subsets of the training dataset or batches. We used batches of 32 samples, generating around 840 subsets containing all the training dataset, which are used to update the hyperparameters and to computed the metric in each cycle or epoch. We considered 100 or 200 epochs depending on the loss function that we used, thus we executed around 84,000 or 168,000 iterations in total respectively. The learning rate was annealed from the initial value of 0.001 with a dynamic adjustment, lowering the value by a factor 0.9 when the minimization did not decrease in 5 consecutive epochs. We performed several training cases by turning off some of the transformations of the data augmentation process, changing the weight values for the stratified random sampling maps, and changing the loss functions and its parameters. Using this setup, each epoch took
We present two training cases that reached the highest accuracies from all testing that we ran. Test 1 uses the U-net architecture with a α-balanced Focal Loss. For this experiment, we consider a proportion of 1:100 for the background classes with respect to the underrepresented classes to build the weighted pixel maps for the stratified sampling selection. On the other hand, Test 2 uses the U-net architecture using the mean IoU as the loss function. Similarly, we consider a proportion of 1:100 for the background classes with respect to the underrepresented classes to build the weighted pixel maps. In both experiments, we only used random rotations and perspective transformations as augmentation. Figures 3A,B present the monitoring plots of these two test cases during the training execution. These graphs show the evolution of the performance parameters of the selected metrics per epoch, i.e., average loss and accuracy. For both cases, the performance parameters behave as expected for the training dataset (see blue curves in Figures 3A,B), however, the parameters associated with the validation dataset show differences between each other.
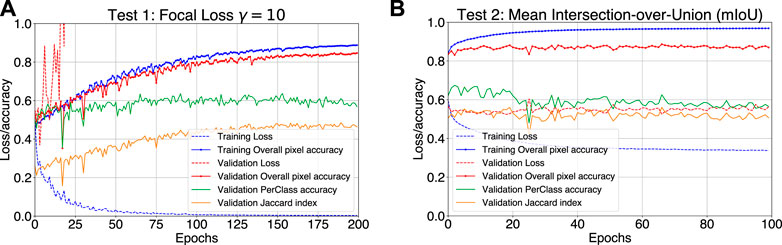
FIGURE 3. (A) Tracking plot for the training for test 1: U-net model using α-balanced Focal loss with γ = 10 as training loss function. (B) Tracking training plot for test 2: U-net model using Mean IoU as training loss function.
For test 1, the overall pixel accuracy, the accuracy per class and the Jaccard index for the validation dataset increase slowly over every iteration reaching 0.84, 0.60, and 0.47 respectively, while its corresponding loss increases heavily. We interpret that the noise and rising trend in the loss profile are due to the accumulation of misclassified examples, such as pixels at the edge of granules or clusters of pixels that have features of multiple classes, which the model slowly corrects thus improving the accuracy. The model reaches high levels of saturation, with hints a slight overfitting close to the end of the training (see Figure 3A).
This effect can be observed in the full map prediction and in the predicted probability distribution per class shown in Figures 4A,B. In the whole map, the model reaches 0.74 of overall pixel accuracy, a mean accuracy per class of 0.52 and a Jaccard index of 0.40. These values are slightly lower than those achieved during training (evaluated in sub-maps of size 128 × 128) but still compatible, since they come from the same map. Figure 4A displays the direct comparison between the ground-truth map with the predicted map. As a first conclusion, we highlight the efficiency of the model to segregate granules and intergranular lanes, which contributes mostly to the overall pixel accuracy.
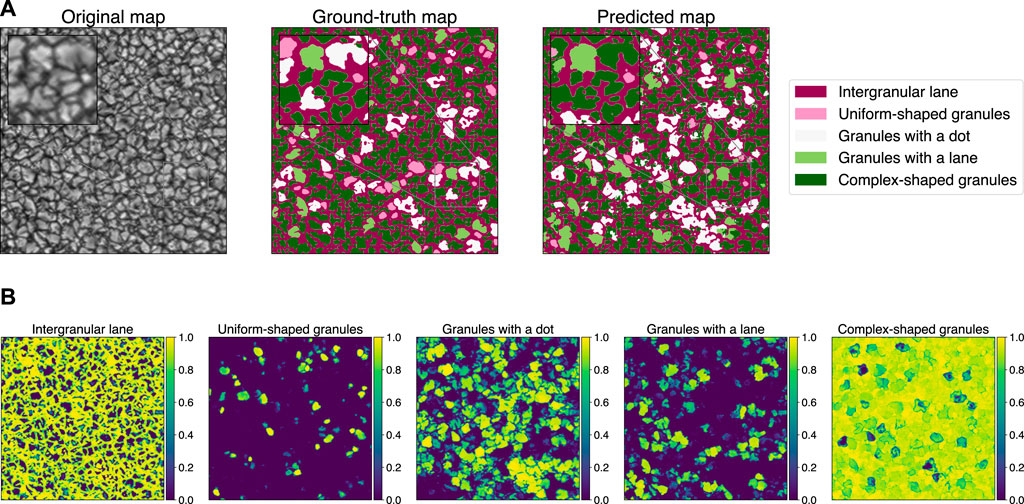
FIGURE 4. (A) Comparative maps using the validation full size map–Test 1: U-net model using α-balanced Focal loss with γ = 10 as training loss function. A zoomed region is highlighted showing in detail the diverse constrains of the segmentation. (B) Probability maps per class using the validation full size map–Test 1: U-net model using α-balanced Focal loss with γ = 10 as training loss function.
Regarding the correct identification of underrepresented morphologies, the model behaviour is different per class. Based on the probability maps in Figure 4B, we identify that the model develops different reliability levels depending on the class. For clean morphologies such as uniformly shaped granules, the model is slightly more confident as compared with more structured and complex classes. In that sense, granules with multiple and similar features give rise to a prediction with a high degree of uncertainty. This is manifested in classes such as granules with a dot, granules with a lane and complex-shaped granules.
On the other hand, test 2 shows a completely different behaviour. As shown in Figure 3B, the performance parameters related to the validation dataset reaches a threshold at an early stage of training without appreciable changes along the epochs. From the first cycle, a value of 0.87 for overall pixel accuracy and a Jaccard index of 0.52 are achieved. However, in terms of the mean accuracy per class, the average threshold value during the first 20 iterations is 0.64, which then decreases and stabilizes around 0.60 correspondingly. Using this training setup, we suggest that the model is able to learn the basic morphological patterns from few batches, but it is unable to extract more specific information from the full dataset provided during the training. Signatures of over-fitting are also observed, but the invariance of the loss for the training and validation datasets indicates an upper limit in the learning process in the defined training time.
Figure 5A shows the full map prediction and the predicted probability distribution maps of the model with the lowest loss value obtained during the training (epoch 12). In the whole map, the model reaches 0.71 of overall pixel accuracy, a mean accuracy per class of 0.58 and a Jaccard index of 0.40. Again, these values are slightly lower than those achieved during training (evaluated in sub-maps of size 128 × 128) but still compatible, since they come from the same map. A good efficiency to segregate granules and intergranular lanes is also obtained in this test, contributing mostly to the overall pixel accuracy as well (see the Figure 5A).
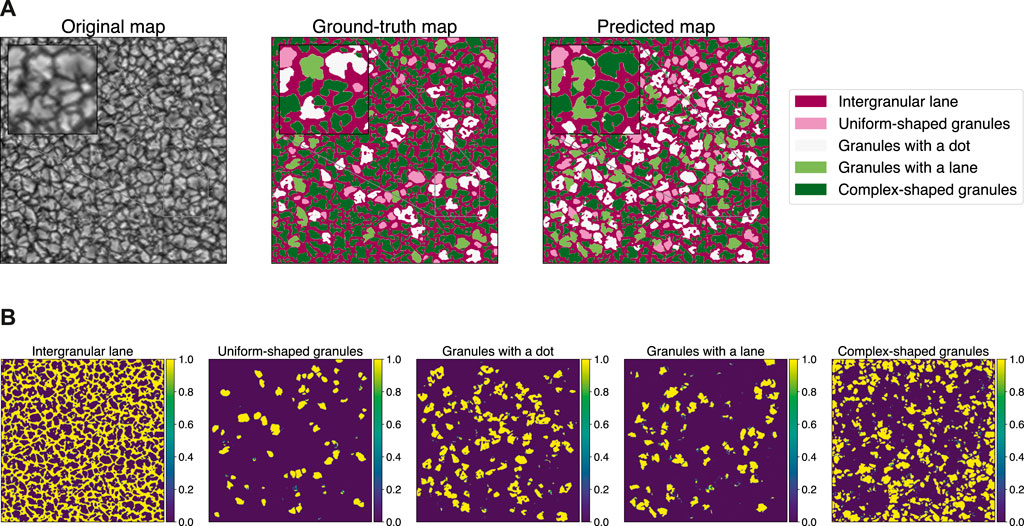
FIGURE 5. (A) Comparative maps using the validation full size map–Test 2: U-net model using Mean IoU as training loss function. A zoomed region is highlighted showing in detail the diverse constrains of the segmentation. (B) Probability maps per class using the validation full size map–Test 2: U-net model using Mean IoU as training loss function.
Based on the probability maps generated (see Figure 5B), we notice that the model reproduces high levels of confidence in all classes, managing to identify detailed morphological patterns associated with the classes, i.e., dots, lanes or combinations even within individual cells, which promotes the over-labelling of structures, i.e., single granules contain pixels of different classes as shown in the predicted map of Figure 5A.
So far, we have been referring to class-average quantities of the performance parameters, which are biased by the well-know imbalance between granulation structures. In Table 1, we present a summary of the overall pixel accuracy (OPA) and the Jaccard index per class. As we mentioned, the identification of the intergranular lane provides the major contribution to the effectiveness of the models, reaching accuracy values around 0.90 in both metrics. On the other hand, the identification of specific morphologies has a significantly lower performance, especially for underrepresented classes. We identify that the contribution of precision and recall on the Jaccard index are unequal, i.e. the models are acceptably sensitive (higher recall) in detecting the simple shapes characteristics of each class, but those are inexact during the ground-truth comparison.
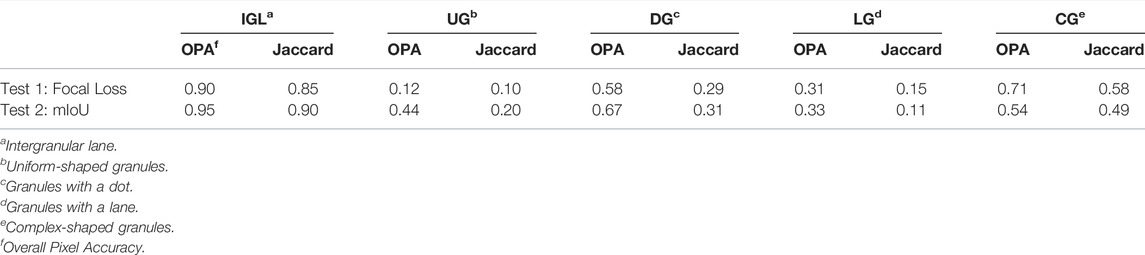
TABLE 1. Summary of the performance parameters per class calculated for the full size verification map prediction.
Based on the multi-class confusion matrix at the pixel level for each model shown in the Figures 6A,B, we notice specific behavior per model. For test 1, the high uncertainty levels generate a strong effect on the maximum probability to match a category given the original category. In this case, granules belonging to under-represented classes have a high tendency to be classified as complex-shape granules due to the homogeneous probabilities between classes in granules where similar morphologies are shared. On the other hand, for test 2, the over-labeling effect and the high levels of reliability, tend to homogenize the maximum probabilities by class, negatively affecting classes such as uniform-shaped granules and granules with a lane.
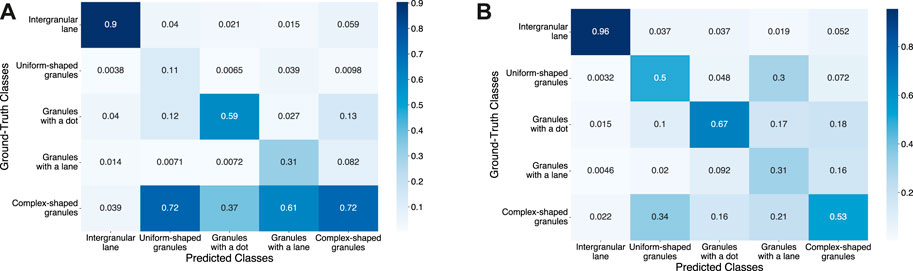
FIGURE 6. (A) Probability distribution at pixel level of the category prediction given its original category (confusion matrix) for test 1: U-net model using α-balanced Focal loss with γ = 10 as training loss function. (B) Probability distribution at pixel level of the category prediction given its original category (confusion matrix) for test 2: U-net model using Mean IoU as training loss function.
4 Discussion
In summary, we present the first attempts to classify and identify structures in the solar granulation based on the semantic segmentation paradigm using a deep learning method. As our main objective, we found an interesting potential of the U-net architecture to identify and classify cellular patterns in solar granulation images, but modifications to the current model should be implemented to ensure its optimal performance. With the proposed training procedure, the model achieves high levels of accuracy in the identification of the intergranular network which allows the effective separation of granular morphologies. We have also established that the network architecture is sensitive in identifying characteristic patterns in granules, such as granules with a dot (overall accuracy greater than 0.5 in both tests), but it looses efficacy when it comes to discerning between structures with combined morphologies, i.e., granules with multiple features and complex-shaped structures. This outcome drives high uncertainty levels (test 1) or an over-labeling effect in single granules (test 2).
During our experiments, we have identified recurrent hints of overfitting in all performed tests, meeting the highest accuracy for the tests presented here. We implemented some functional strategies such as the Dropout regularization and hyperparameters scaling but without obtaining any improvement. Going further, we identified that the preparation of the ground-truth dataset played a crucial role in the model generalization ability. The semi-manual and manual labeling process introduced unwanted constraints, e.g., over-merging, poor contours separation and small incorrect areas. Moreover, we noted the difficulty in defining closed classification criteria, which would allow us to represent the samples of each category unambiguously. Labeling structures of this specific phenomenon is a complex task, even for human classifications. The phenomena in the photosphere are so diverse that it is effectively easy to under-classify or over-classify morphologies. Thus, it is fundamental to improve the initial labeling for future supervised testing including the use of ground-truth segmentation methods that involve the least amount of user intervention in order to reduce ambiguity.
Another source of over-fitting may be related to the augmentation process, which is highly affected by the wrong-labeled data. In this case, the geometric transformations applied in the limited available labeled samples, especially for the underrepresented classes, can induce over-fitting (Shorten and Khoshgoftaar, 2019). Granules, as individual elements, are unique at a very detailed level, i.e., in super-high-resolution images. However, as we have already mentioned, they share similar phenomenologies that makes it possible to classify them into groups with comparable patterns at basic levels of similarity. Therefore, the use of extensive and random geometric transformations can produce non-deterministic effects, negatively affecting the training performance. Other strategies exist in the literature to prevent overfitting in skewed data, i.e. transfer learning (Weiss et al., 2016), pre-training (Singh Punn and Agarwal, 2021) or one-shot and zero-shot learning (Xian et al., 2017), which we plan to study in future works.
We extensively highlight these initial experiments as a starting point for further investigation. As this research is still under development, we seek to improve the levels of sensitivity and precision as much as possible to unequivocally detect the existing phenomenologies in solar granulation. We anticipate that extending our approach to include time-series, i.e., video segmentation, and other physical observables such as polarization and Doppler maps can be fruitful. This additional information would reveal other characteristics associated with the considered phenomena, allowing the definition of precise selection criteria, e.g., granular lane cases have been unambiguously detected based on the host granule evolution. Besides, the exploration of self-supervised or unsupervised methods is in our sights for further studies.
5 Resource Identification Initiative
All code of the model was constructed based on Python Programming Language, RRID:SCR_008394 version 3.9.7, and PyTorch libraries, RRID: SCR_018536 version 1.10.0.
Data Availability Statement
Publicly available datasets were analyzed in this study. This data can be found here: https://star.mps.mpg.de/sunrise/ and https://gitlab.leibniz-kis.de/smdiazcas/SegGranules_Unet_model.git.
Author Contributions
SD, CF, and AA conceived of the presented idea. SD and CF prepared the ground-truth dataset. SD and AA constructed the algorithm and the training strategy. SD executed the network training and analysed the results with help of AA All authors contributed to the final version of the manuscript. SB supervised the project.
Funding
SMDC and CEF are funded by the Leibniz Association grant for the SAW-2018-KIS-2-QUEST project. The German contribution to Sunrise is funded by the Bundesministerium für Wirtschaft und Technologie through Deutsches Zentrum für Luft und Raumfahrt e.V. (DLR), Grant No.50 OU 0401, and by the Innovationsfond of the President of the Max Planck Society (MPG). The Spanish contribution has been funded by the Spanish MICINN under projects ESP2006-13030-C06 and AYA2009-14105-C06 (including European FEDER funds). HAO/NCAR is sponsored by the National Science Foundation, and the HAO Contribution to Sunrise was partly funded through NASA grant number NNX08AH38G. The National Solar Observatory (NSO) is operated by the Association of Universities for Research in Astronomy, Inc. (AURA), under cooperative agreement with the National Science Foundation.
Conflict of Interest
The authors declare that the research was conducted in the absence of any commercial or financial relationships that could be construed as a potential conflict of interest.
Publisher’s Note
All claims expressed in this article are solely those of the authors and do not necessarily represent those of their affiliated organizations, or those of the publisher, the editors and the reviewers. Any product that may be evaluated in this article, or claim that may be made by its manufacturer, is not guaranteed or endorsed by the publisher.
Acknowledgments
We acknowledge the Instituto de Astrofísica de Canarias (IAC) and the Leibniz-Institut für Sonnenphysik (KIS) for providing us with compute time on their GPUs: NVIDIA GeForce 2080 Ti GPU and an NVIDIA Tesla P100 GPU respectively, resources extensively used in this research. This research has made use of NASA’s Astrophysics Data System Bibliographic Services. We acknowledge the community effort devoted to the development of the following open-source packages that were used in this work: numpy (numpy.org), matplotlib (matplotlib.org) and Pytorch (pytorch.org).
Footnotes
1More information can be found at https://lmb.informatik.uni-freiburg.de/people/ronneber/u-net/
2All code and documentation can be found at http://wwwuser.gwdg.de/astronom/
3All codes are placed in a free access repository (https://gitlab.leibniz-kis.de/smdiazcas/SegGranules_Unet_model.git)
References
Aggarwal, C. C. (2018). An Introduction to Neural Networks. Cham: Springer International Publishing, 1–52. doi:10.1007/978-3-319-94463-0_1
Aloysius, N., and Geetha, M. (2017). “A Review on Deep Convolutional Neural Networks,” in 2017 International Conference on Communication and Signal Processing (ICCSP), Chennai, India, April 6–8, 2017, 0588–0592. doi:10.1109/ICCSP.2017.8286426
Armstrong, J. A., and Fletcher, L. (2019). Fast Solar Image Classification Using Deep Learning and its Importance for Automation in Solar Physics. Sol. Phys. 294, 80. doi:10.1007/s11207-019-1473-z
Badrinarayanan, V., Kendall, A., and Cipolla, R. (2017). Segnet: A Deep Convolutional Encoder-Decoder Architecture for Image Segmentation. IEEE Trans. Pattern Analysis Mach. Intell. 39, 2481–2495. doi:10.1109/TPAMI.2016.2644615
Baek, J. H., Kim, S., Choi, S., Park, J., Kim, J., Jo, W., et al. (2021). Solar Event Detection Using Deep-Learning-Based Object Detection Methods. Sol. Phys. 296, 160. doi:10.1007/s11207-021-01902-5
Barthol, P., Gandorfer, A., Solanki, S. K., Schussler, M., Chares, B., Curdt, W., et al. (2011). The Sunrise Mission. Solar Phys. 268, 1–34. doi:10.1007/s11207-010-9662-9
Bellot Rubio, L., and Orozco Suárez, D. (2019). Quiet Sun Magnetic Fields: an Observational View. Living Rev. Sol. Phys. 16, 1. doi:10.1007/s41116-018-0017-1
Bovelet, B., and Wiehr, E. (2001). A New Algorithm for Pattern Recognition and its Application to Granulation and Limb Faculae. Sol. Phys. 201, 13–26. doi:10.1023/A:1010344827952
Bovelet, B., and Wiehr, E. (2007). Multiple-Scale Pattern Recognition Applied to Faint Intergranular G-Band Structures. Sol. Phys. 243, 121–129. doi:10.1007/s11207-007-9010-x
Carlier, A., Chauveau, F., Hugon, M., and Rösch, J. (1968). Cinématographie à Haute Résolution Spatiale de la Granulation Photosphérique. Acad. Des. Sci. Paris Comptes Rendus Ser. B Sci. Phys. 266, 199–201.
Chen, L., Papandreou, G., Kokkinos, I., Murphy, K., and Yuille, A. (2018). Deeplab: Semantic Image Segmentation with Deep Convolutional Nets, Atrous Convolution, and Fully Connected Crfs. IEEE Trans. Pattern Anal. Mach. Intell. 40, 834–848. doi:10.1109/tpami.2017.2699184
Chola, C., and Benifa, J. V. B. (2022). Detection and Classification of Sunspots via Deep Convolutional Neural Network. Glob. Transitions Proc. doi:10.1016/j.gltp.2022.03.006
De Pontieu, B. (2002). High‐Resolution Observations of Small‐Scale Emerging Flux in the Photosphere. Astrophys. J. 569, 474–486. doi:10.1086/339231
Domínguez Cerdeña, I. (2003). Evidence of Mesogranulation from Magnetograms of the Sun. Astron. Astrophys. 412, L65–L68. doi:10.1051/0004-6361:20034617
Dumoulin, V., and Visin, F. (2016). A Guide to Convolution Arithmetic for Deep Learning. arXiv:1603.07285 [Online].
Ellwarth, M., Fischer, C. E., Vitas, N., Schmiz, S., and Schmidt, W. (2021). Newly Formed Downflow Lanes in Exploding Granules in the Solar Photosphere. Astron. Astrophys. 653, A96. doi:10.1051/0004-6361/202038252
Fernández, A., García, S., Galar, M., Prati, R., Krawczyk, B., and Herrera, F. (2018). “Foundations on Imbalanced Classification,” in Learning from Imbalanced Data Sets (Cham: Springer). doi:10.1007/978-3-319-98074-4_2
Fischer, C. E., Borrero, J. M., Bello González, N., and Kaithakkal, A. J. (2019). Observations of Solar Small-Scale Magnetic Flux-Sheet Emergence. Astron. Astrophys. 622, L12. doi:10.1051/0004-6361/201834628
Fischer, C. E., Vigeesh, G., Lindner, P., Borrero, J. M., Calvo, F., and Steiner, O. (2020). Interaction of Magnetic Fields with a Vortex Tube at Solar Subgranular Scale. Astrophys. J. Lett. 903, L10. doi:10.3847/2041-8213/abbada
Ghosh, A., Sufian, A., Sultana, F., Chakrabarti, A., and De, D. (2020). “Fundamental Concepts of Convolutional Neural Network,” in Recent Trends and Advances in Artificial Intelligence and Internet of Things, Intelligent Systems Reference Library. Editors V. Balas, R. Kumar, and R. Srivastava (Springer), Vol. 172. doi:10.1007/978-3-030-32644-9_36
Girshick, R. B. (2015). “Fast R-Cnn,” in 2015 IEEE International Conference on Computer Vision (ICCV) Santiago, Chile, December 7–13, 2015, 1440–1448. doi:10.1109/iccv.2015.169
Guglielmino, S. L., Martínez Pillet, V., Ruiz Cobo, B., Bellot Rubio, L. R., del Toro Iniesta, J. C., Solanki, S. K., et al. (2020). On the Magnetic Nature of an Exploding Granule as Revealed by Sunrise/IMaX. Astrophys. J. 896, 62. doi:10.3847/1538-4357/ab917b
Havaei, M., Davy, A., Warde-Farley, D., Biard, A., Courville, A., Bengio, Y., et al. (2017). Brain Tumor Segmentation with Deep Neural Networks. Med. Image Anal. 35, 18–31. doi:10.1016/j.media.2016.05.004
He, H., and Garcia, E. A. (2009). Learning from Imbalanced Data. IEEE Trans. Knowl. Data Eng. 21, 1263–1284. doi:10.1109/TKDE.2008.239
He, H., and Ma, Y. (2013). Imbalanced Learning: Foundations, Algorithms, and Applications. 1st edn. Hoboken, New Jersey: Wiley-IEEE Press.
He, H., Bai, Y., Garcia, E. A., and Li, S. (2008). “Adasyn: Adaptive Synthetic Sampling Approach for Imbalanced Learning,” in 2008 IEEE International Joint Conference on Neural Networks Hong Kong, China, June 1–8, 2008 (IEEE World Congress on Computational Intelligence), 1322–1328. doi:10.1109/IJCNN.2008.4633969
Hirzberger, J., Bonet, J. A., Vázquez, M., and Hanslmeier, A. (1999). Time Series of Solar Granulation Images. III. Dynamics of Exploding Granules and Related Phenomena. Astrophys. J. 527, 405–414. doi:10.1086/308065
Huang, C., Li, Y., Loy, C. C., and Tang, X. (2016). “Learning Deep Representation for Imbalanced Classification,” in IEEE Conference on Computer Vision and Pattern Recognition (CVPR), Las Vegas, NV, June 27–30, 2016. doi:10.1109/cvpr.2016.580
Huang, G., Liu, Z., Van Der Maaten, L., and Weinberger, K. Q. (2017). “Densely Connected Convolutional Networks,” in 2017 IEEE Conference on Computer Vision and Pattern Recognition (CVPR), Honolulu, HI, July 21–26, 2017, 2261–2269. doi:10.1109/CVPR.2017.243
Ilg, E., Mayer, N., Saikia, T., Keuper, M., Dosovitskiy, A., and Brox, T. (2017). “Flownet 2.0: Evolution of Optical Flow Estimation with Deep Networks,” in IEEE Conference on Computer Vision and Pattern Recognition (CVPR), Honolulu, HI, July 21–26, 2017. doi:10.1109/cvpr.2017.179
Jaccard, P. (1912). The Distribution of the Flora in the Alpine zone.1. New Phytol. 11, 37–50. doi:10.1111/j.1469-8137.1912.tb05611.x
Javaherian, M., Safari, H., Amiri, A., and Ziaei, S. (2014). Automatic Method for Identifying Photospheric Bright Points and Granules Observed by Sunrise. Sol. Phys. 289, 3969–3983. doi:10.1007/s11207-014-0555-1
Kaithakkal, A. J., and Solanki, S. K. (2019). Cancelation of Small-Scale Magnetic Features. Astron. Astrophys. 622, A200. doi:10.1051/0004-6361/201833770
Khan, S. H., Hayat, M., Bennamoun, M., Sohel, F., and Togneri, R. (2017). “Cost Sensitive Learning of Deep Feature Representations from Imbalanced Data,” in IEEE Transactions on Neural Networks and Learning Systems vol. 29, 3573–3587. doi:10.1109/TNNLS.2017.2732482
Kingma, D. P., and Ba, J. (2014). “Adam: A Method for Stochastic Optimization,” in 3rd International Conference on Learning Representations, ICLR 2015 San Diego, CA, May 7–9, 2015.
Kitai, R., and Kawaguchi, I. (1979). Morphological Study of the Solar Granulation. Sol. Phys. 64, 3–12. doi:10.1007/BF00151111
Krizhevsky, A., Sutskever, I., and Hinton, G. E. (2012). “Imagenet Classification with Deep Convolutional Neural Networks,” in Proceedings of the 25th International Conference on Neural Information Processing Systems (Red Hook,NY, USA: Curran Associates Inc.), 1097–1105. NIPS’12.Vol. 1.
Le Cun, Y., Bottou, L., and Bengio, Y. (1997). “Reading Checks with Multilayer Graph Transformer Networks,” in 1997 IEEE International Conference on Acoustics, Speech, and Signal Processing, Munich, Germany, April 21–24, 1997, 151–154. doi:10.1109/ICASSP.1997.599580
Leivas Oliveira, G. (2019). Encoder-decoder Methods for Semantic Segmentation: Efficiency and Robustness Aspects. Freiburg im Breisgau, Germany: Technische Fakultät, Albert-Ludwigs-Universität Freiburg. Ph.D. thesis. doi:10.6094/UNIFR/150065
Lin, T. Y., Goyal, P., Girshick, R., He, K., and Dollár, P. (2017). “Focal Loss for Dense Object Detection,” in 2017 IEEE International Conference on Computer Vision (ICCV), Venice, Italy, October 22–29, 2017, 2999–3007. doi:10.1109/ICCV.2017.324
Love, T., Neukirch, T., and Parnell, C. E. (2020). Analyzing Aia Flare Observations Using Convolutional Neural Networks. Front. Astron. Space Sci. 7. doi:10.3389/fspas.2020.00034
Malherbe, J.-M., Roudier, T., Stein, R., and Frank, Z. (2018). Dynamics of Trees of Fragmenting Granules in the Quiet Sun: Hinode/SOT Observations Compared to Numerical Simulation. Sol. Phys. 293, 4. doi:10.1007/s11207-017-1225-x
Martínez Pillet, V., Del Toro Iniesta, J. C., Álvarez-Herrero, A., Domingo, V., Bonet, J. A., González Fernández, L., et al. (2011). The Imaging Magnetograph eXperiment (IMaX) for the Sunrise Balloon-Borne Solar Observatory. Sol. Phys. 268, 57–102. doi:10.1007/s11207-010-9644-y
Muller, R., and Roudier, T. (1984). Variability of the Quiet Photospheric Network. Sol. Phys. 94, 33–47. doi:10.1007/BF00154805
Nordlund, Å., Stein, R. F., and Asplund, M. (2009). Solar Surface Convection. Living Rev. Sol. Phys. 6, 2. doi:10.12942/lrsp-2009-2
Oksuz, K., Cam, B. C., Kalkan, S., and Akbas, E. (2020). “Imbalance Problems in Object Detection: A Review,” in IEEE Transactions on Pattern Analysis and Machine Intelligence, 43, 3388–3415. doi:10.1109/TPAMI.2020.2981890
Olã Bressan, P., Marcato Junior, J., Correa Martins, J. A., Nunes Gonçalves, D., Matte Freitas, D., Prado Osco, L., et al. (2022). Semantic Segmentation With Labeling Uncertainty and Class Imbalance Applied to Vegetation Mapping. Internat. J. Appl. Earth Obs. Geoinf. 108, 102690. doi:10.1016/j.jag.2022.102690
Palacios, J., Blanco Rodríguez, J., Vargas Domínguez, S., Domingo, V., Martínez Pillet, V., Bonet, J. A., et al. (2012). Magnetic Field Emergence in Mesogranular-Sized Exploding Granules Observed with sunrise/IMaX Data. Astron. Astrophys. 537, A21. doi:10.1051/0004-6361/201117936
Paszke, A., Gross, S., Massa, F., Lerer, A., Bradbury, J., Chanan, G., et al. (2019). “Pytorch: An Imperative Style, High-Performance Deep Learning Library,” in Advances in Neural Information Processing Systems. Editors H. Wallach, H. Larochelle, A. Beygelzimer, F. d’ Alché-Buc, E. Fox, and R. Garnett (Curran Associates, Inc.), 32, 8024–8035.
Rempel, M. (2018). Small-scale Dynamo Simulations: Magnetic Field Amplification in Exploding Granules and the Role of Deep and Shallow Recirculation. Astrophys. J. 859, 161. doi:10.3847/1538-4357/aabba0
Riethmüller, T. L., Solanki, S. K., Zakharov, V., and Gandorfer, A. (2008). Brightness, Distribution, and Evolution of Sunspot Umbral Dots. Astron. Astrophys. 492, 233–243. doi:10.1051/0004-6361:200810701
Rimmele, T. R., Warner, M., Keil, S. L., Goode, P. R., Knölker, M., Kuhn, J. R., et al. (2020). The Daniel K. Inouye Solar Telescope - Observatory Overview. Sol. Phys. 295, 172. doi:10.1007/s11207-020-01736-7
Ronneberger, O., Fischer, P., and Brox, T. (2015). “U-Net: Convolutional Networks for Biomedical Image Segmentation,” in Medical Image Computing and Computer-Assisted Intervention – MICCAI 2015. MICCAI 2015 Lecture Notes in Computer Science. Editors N. Navab, J. Hornegger, W. Wells, and A. Frangi Cham: Springer. doi:10.1007/978-3-319-24574-4_28
Roudier, T., and Muller, R. (2004). Relation between Families of Granules, Mesogranules and Photospheric Network. Astron. Astrophys. 419, 757–762. doi:10.1051/0004-6361:20035739
Roudier, T., Lignières, F., Rieutord, M., Brandt, P. N., and Malherbe, J. M. (2003). Families of Fragmenting Granules and Their Relation to Meso- and Supergranular Flow Fields. Astron. Astrophys. 409, 299–308. doi:10.1051/0004-6361:20030988
Roudier, T., Malherbe, J. M., Rieutord, M., and Frank, Z. (2016). Relation between Trees of Fragmenting Granules and Supergranulation Evolution. Astron. Astrophys. 590, A121. doi:10.1051/0004-6361/201628111
Schmidhuber, J. (2014). Deep Learning in Neural Networks: An Overview. Neural Networks 61, 85–117. doi:10.1016/j.neunet.2014.09.003
Sebe, N., Cohen, I., Garg, A., and Huang, T. (2005). Machine Learning in Computer Vision. New York: Springer.
Shelhamer, E., Long, J., and Darrell, T. (2017). Fully Convolutional Networks for Semantic Segmentation. IEEE Trans. Pattern Anal. Mach. Intell. 39, 640–651. doi:10.1109/tpami.2016.2572683
Shorten, C., and Khoshgoftaar, T. M. (2019). A Survey on Image Data Augmentation for Deep Learning. J. Big Data 6, 60. doi:10.1186/s40537-019-0197-0
Simonyan, K., and Zisserman, A. (2015). “Very Deep Convolutional Networks for Large-Scale Image Recognition,” in 3rd International Conference on Learning Representations, ICLR 2015, San Diego, CA, May 7–9, 2015 .
Singh Punn, N., and Agarwal, S.(2021). BT-Unet: A Self-Supervised Learning Framework for Biomedical Image Segmentation Using Barlow Twins with U-Net Models. arXiv e-prints. arXiv:2112.03916.
Solanki, S. K., Barthol, P., Danilovic, S., Feller, A., Gandorfer, A., Hirzberger, J., et al. (2010). Sunrise: Instrument, Mission, Data, and First Results. Geophysical Monograph Series 723, L127–L133. doi:10.1088/2041-8205/723/2/l127
Solanki, S. K., Riethmüller, T. L., Barthol, P., Danilovic, S., Deutsch, W., Doerr, H. P., et al. (2017). The Second Flight of the Sunrise Balloon-Borne Solar Observatory: Overview of Instrument Updates, the Flight, the Data, and First Results. Astrophys. J. Suppl. Ser. 229, 2. doi:10.3847/1538-4365/229/1/2
Steiner, O., Franz, M., Bello González, N., Nutto, C., Rezaei, R., Martínez Pillet, V., et al. (2010). Detection of Vortex Tubes in Solar Granulation from Observations with SUNRISE. Astrophys. J. Lett. 723, L180–L184. doi:10.1088/2041-8205/723/2/L180
Weiss, K., Khoshgoftaar, T. M., and Wang, D. (2016). A Survey of Transfer Learning. J. Big Data 3, 9. doi:10.1186/s40537-016-0043-6
Xian, Y., Lampert, C. H., Schiele, B., and Akata, Z. (2017). “Zero-Shot Learning – A Comprehensive Evaluation of the Good, the Bad and the Ugly,” in IEEE Transactions on Pattern Analysis and Machine Intelligence, 41, 2251–2265. doi:10.1109/TPAMI.2018.2857768
Yanli, S., and Pengpeng, S. (2021). J-net: Asymmetric Encoder-Decoder for Medical Semantic Segmentation. Secur. Commun. Netw. 2021, 2139024. doi:10.1155/2021/2139024
Keywords: solar physics, solar granulation, photosphere–convection, dense segmentation, deep learning–artificial neural network
Citation: Díaz Castillo SM, Asensio Ramos A, Fischer CE and Berdyugina SV (2022) Towards the Identification and Classification of Solar Granulation Structures Using Semantic Segmentation. Front. Astron. Space Sci. 9:896632. doi: 10.3389/fspas.2022.896632
Received: 15 March 2022; Accepted: 23 May 2022;
Published: 23 June 2022.
Edited by:
Bala Poduval, University of New Hampshire, United StatesReviewed by:
Reinaldo Roberto Rosa, National Institute of Space Research (INPE), BrazilHerbert Muthsam, University of Vienna, Austria
Jerome Ballot, UMR5277 Institut de Recherche en Astrophysique et Planétologie (IRAP), France
Copyright © 2022 Díaz Castillo, Asensio Ramos, Fischer and Berdyugina. This is an open-access article distributed under the terms of the Creative Commons Attribution License (CC BY). The use, distribution or reproduction in other forums is permitted, provided the original author(s) and the copyright owner(s) are credited and that the original publication in this journal is cited, in accordance with accepted academic practice. No use, distribution or reproduction is permitted which does not comply with these terms.
*Correspondence: S. M. Díaz Castillo, c21kaWF6Y2FzQGxlaWJuaXota2lzLmRl