 Tikemani Bag
 Diptiranjan Rout
 Y. Ogawa1
- 1National Institute of Polar Research, Tachikawa, Japan
- 2GFZ German Research Centre for Geosciences, Potsdam, Germany
- 3Department of Physics, Indian Institute of Technology Roorkee, Roorkee, India
The temporal response of thermospheric CO2 and NO cooling emissions is investigated during ICME and CIR-driven geomagnetic storms by using data from the SABER instrument onboard the TIMED, GRACE, and DMSP satellites. The superposed epoch analysis reveals that the cooling emissions experience a strong enhancement and quick recovery to pre-event value within 3–4 days during CME storms. Whereas, it shows slower recovery that lasts for more than 6–7 days during CIR-driven storms. We performed detailed study of NO cooling emission owing to the fact that the production of NO depends on the external energy input. The different response of thermospheric NO cooling during CME and CIR storms can be attributed to differences in precipitation of particle (electron and ion) fluxes. A strong correlation with a positive timelag is observed between NO cooling emission and Dst index, coupling functions and particle flux. Further, the correlation between NO cooling flux and particle flux displays a distinct and stronger correlation during CIR storms as compared to CME. This study also shows that the Newell coupling function (normalized cross-correlation, r = 0.90 for CME and r = 0.92 for CIR) and the Akasofu parameter (r = 0.92 for CME, r = 0.76 for CIR) are better correlated with NO cooling flux, respectively, during CIR- and ICME-driven storms.
1 Introduction
The large-scale magnetic reconnection process on the Sun’s corona, particularly during solar maxima, gives rise to the Interplanetary Coronal Mass Ejections (ICMEs). On the other hand, during the declining and minimum phase of the solar cycle, the fast solar wind (600–800 kms−1) emanating from the coronal holes interacts with the background slow solar wind stream (300–400 kms−1) in the interplanetary medium forming an interaction region known as a Corotating Interaction Regions (CIRs). Generally, CMEs create the strongest geomagnetic storms while the storms formed by CIRs are less intense but can last for several days (Smith and Wolfe 1976; Borovsky and Denton 2006; Tsurutani et al. 2006). Consequently, the CME induced storms are impulsive, and the CIR induced are more protractive in terms of solar energy depositions into the magnetosphere-ionosphere (M-I) system and hence their impacts (Borovsky and Denton 2006; Tsurutani et al. (2006), Rout et al. (2017), Rout et al. (2022), Richardson 2018; Ogawa et al., 2019).
The infrared radiative cooling by thermospheric nitric oxide (NO) via 5.3 μm wavelength and carbon dioxide (CO2) via 15 μm molecular emissions are two major sources that regulate the thermospheric temperature through the rapid release of energy into space and lower atmosphere (Mlynczak et al., 2003). Several investigations have shown that the cooling emissions show a strong correlation with the Dst index during ICME-induced geomagnetic storms (Mlynczak et al., 2003; Bag., 2018; Knipp et al., 2013; Knipp et al., 2017; Zesta and Oliveira, 2019). At the same time, a few studies also reported the response of these cooling emissions during CIR-driven storms (Verkhoglyadova et al., 2015; Verkhoglyadova et al., 2016). Nevertheless, the similarities and differences in the effects of these two types of storms on thermospheric cooling are still not well understood and need to be further studied.
The primary mechanism for the production of NO and CO2 emissions is the vibrational-rotational (v = 1 to v = 0) transition resulting due to the inelastic collision with atomic oxygen density (Mlynczak et al., 2003; Mlynczak et al., 2010). During daytime, the solar x-ray and extreme ultraviolet dictate the production of nitric oxide. In the high latitude, the ionization/dissociation of molecular nitrogen due to Joule heating and energetic particle precipitation create nitric oxide. Above 140 km, the nitric oxide is formed due to the temperature dependent reaction between the atomic nitrogen and molecular oxygen (Barth et al., 1988; Barth and Bailey., 2004; Barth, 2009; Solomon et al., 1999). Consequently, the nitric oxide emission depends on the densities of nitric oxide, atomic oxygen and the thermospheric temperature (Mlynczak et al., 2003). On the other hand, CO2 is primarily of the anthropogenic origin (Mlynczak et al., 2010).
Chen et al., 2012; Chen et al., 2014 studied the response of thermospheric density by using CHAMP (Challenging Minisatellite Payload) satellite during both the ICME- and CIR-driven geomagnetic storms and showed that the total changes in thermospheric density and satellite orbit decays during the CIR-storms are much larger than those during the CME-storms. Similarly, the response of the thermospheric density and ionospheric, during CIR- and CME-storms, is separately studied by using space borne observations (Lei et al., 2011; Chen et al., 2015; Krauss et al., 2015; Oliveira et al., 2017; Oliveira et al., 2020). On the other hand, the response of thermospheric heating and cooling time was studied by Zesta and Oliveira, (2019) for the geomagnetic storms of different strengths by using data from CHAMP and GRACE. It is found that the more intense the storm, the shorter the heating and cooling times. They also attributed such cooling effects to the high production of NO molecules that in turn play a major role in cooling the thermosphere. However, they neither differentiated the storms in terms of their origin nor studied the thermospheric cooling due to the Nitric Oxide emission. Further, Knipp et al. (2013) showed that the solar wind density enhancements and pressure pulses can lead to intense low-energy particle precipitation which affects the production of thermospheric NO emission. In addition to this, the study of Knipp et al. (2017) statistically showed the impact of shock-led storms on NO emission which are associated to ICME-driven geomagnetic storms. They concluded that the shock-led ICME-driven storms are prone to early and excessive thermospheric NO production and IR emissions and can lead to the process of thermospheric overcooling phenomenon. It is because the interplanetary shock-led ICME-driven storms can increase the precipitating particles, that dictate the thermospheric NO density production, by more than double. It, in turns, enhances the NO emissions by more than double. Lin et al. (2019) investigated the role of electron and ion precipitation on NO cooling during ICME-driven geomagnetic storms and showed that electrons play a dominant role in enhancing the NO cooling production. However, to the best of our knowledge there is no study that shows the relative difference between the ICME- and CIR-driven storms on the response of the NO and CO2 cooling emissions.
In the present study, we address the following few unanswered questions related to the NO and CO2 cooling emissions during ICME and CIR-driven geomagnetic storms: 1) Are there any differences in these cooling fluxes in terms of their magnitude and duration? 2) How do the precipitation of the energetic electrons and ions affect the cooling fluxes for both the solar events? 3) Which energy band of electrons and ions is more efficient in impacting the cooling fluxes? and 4) which coupling function (Akasofu or Newell) is the better one to explain the changes in these cooling fluxes? In order to answer these questions, we performed detailed cross-correlation and superposed epoch analysis study to 10 ICME- and 10 CIR-driven storms by using data from the SABER observations onboard the TIMED, DMSP, and GRACE satellites. These results may help thermospheric modelers and satellite drag forecasters as an input to predict the satellite drag during storms of different solar origin.
2 Data acquisition and analysis
The infrared radiative emissions by NO and CO2 are two dominating thermospheric coolants. They effectively regulate the thermospheric temperature due to the conversion of kinetic energy into radiative energy that exits the thermosphere (Mlynczak et al., 2003). In order to investigate the response of these radiative emissions to the solar wind energy input into the magnetosphere during CME and CIR storms, the cooling emissions from SABER (Sounding of the Atmosphere using Broadband Emission Radiometry) observations onboard the TIMED (Thermosphere ionosphere Mesosphere Energetics Dynamics) satellite are utilized. We selected 20 storms (10 CME and 10 CIR storms) those are not associated with any storm within at least 3 days prior-to and 5 days ahead of the onset. A superposed epoch analysis is employed with zero epoch time corresponding to the onset time of main phase. The list of the storm events selected for investigation are listed in Table 1.
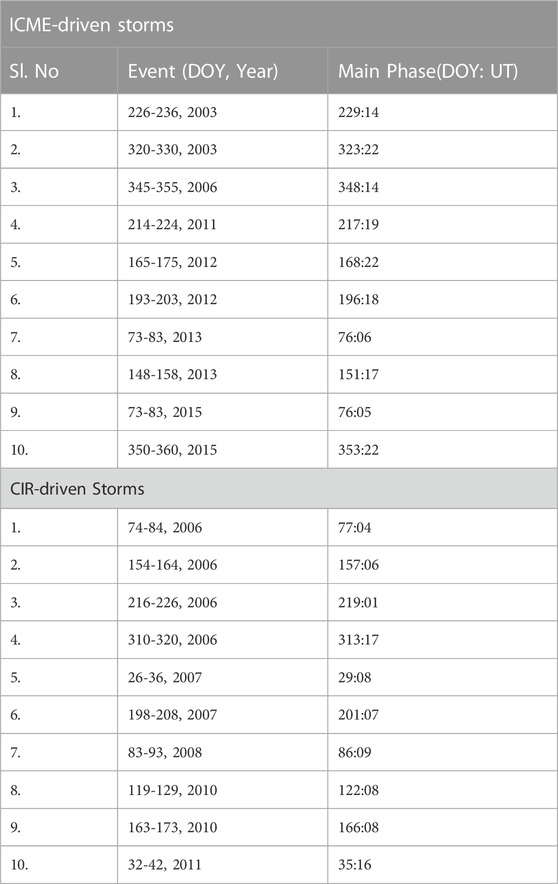
TABLE 1. List of storms used in the present study.
The TIMED satellite was launched in December 2001 and is still in operation. SABER, a limb sounder, is one of the four instruments onboard (Yee et al., 2003). It continuously provides the infrared radiance (W.m−2. sr−1) in ten distinct spectral channels by scanning Earth’s atmosphere from 400 km to surface and back with a vertical resolution of about 0.4 km. SABER covers Earth asymmetrically from about 83° latitude in one hemisphere to 53° latitude in other hemisphere because of its anti-sunward view. This hemispheric coverage changes every 60–65 days corresponding to the TIMED yaw period. The SABER completes 24-h local-time coverage within this period. The SABER observations of the infrared radiance include NO 5.3 µm and CO2 15 µm radiative emissions.
The Nitric Oxide emission is in the weak-line limit of radiative transfer unlike CO2 (Mlynczak et al., 2010). Consequently, an Abel inversion technique is applied to the radiance to get volume emission rate (W.m−3) of NO. The calculation of CO2 radiative cooling emission is different from that of NO emission. A non-local thermodynamic equilibrium condition is assumed to calculate CO2 radiative cooling rate in Kelvin per day (K/day) by applying the Curtis Matrix approach to the SABER non-LTE modelling and temperature (Mlynczak et al., 2010; Hunt et al., 2011). The first law of thermodynamics is then used to calculate the vertical CO2 cooling emission rate (W.m−3). The NO volume emission rate in the altitude of 100–250 km and CO2 volume emission rate in the altitude of 100–140 km are vertically integrated to get respective cooling flux (W.m−2) (Mertens et al. 2009; Mlynczak et al, 2010; Hunt et al., 2011). The accuracy of the estimated cooling rates due to NO and CO2 is better than 15% (Mlynczak et al., 2010). In the present study, we use the processed NO and CO2 cooling flux data (Dataset Version: V 1.0, SABER Data Version 2.0) obtained from the TIMED-SABER satellite (https://saber.gats-inc.com/data.php) binned into 1-h average.
GRACE (Gravity Recovery and Climate Experiment)-A and GRACE-B, two identical 3-axis stabilized satellites, were launched in March 2002 to a near circular orbit at 500 km at an inclination of 89.5°. The two satellites, along-track, are separated by about 220 km. Each satellite carried inter-satellite ranging system, Global Positioning system (GPS) receiver, attitude sensor and accelerometer (Tapley et al., 2004). The accelerometer has precision of about 10−11g. The mass density from GRACE-A and GRACE-B are similar. We have used the GRACE-A accelerometer data normalized, using NRLMSISE-00 model, to 400 km (Sutton et al., 2007). The normalized GRACE data are obtained from the University of Colorado Boulder’s Space Weather Data Portal (https://lasp.colorado.edu/space-weather-portal/home).
The particle precipitation plays important roles in the production of NO, particularly in the high latitude (Barth et al., 1988; Barth and Bailey., 2004; Barth, 2009; Solomon et al., 1999). In order to study the effect of energetic particle precipitation on NO cooling flux, the electron and ion particle flux data are obtained from the Defense Meteorological Satellite Program (DMSP) F15, F16, and F17 satellites via the Madrigal database (http://cedar.openmadrigal.org/index.html). The DMSP spacecraft fly in nearly circular, polar orbit at 850 km with orbital period of about 100 min (Rich et al., 1985). It has low energy particle detectors onboard (SSJ/4). The low energy particle detector sensor measures the auroral precipitating particle in 20 energy channels in the energy range of 30 eV to 30 keV each second with pitch angle in the loss cone. We have divided the electron flux into three categories; low (0.03–0.949 keV), mid (0.949–9.45 keV) and high (9.45–30 keV) electron flux. Similarly, the ion flux has been divided into mid (0.949–9.45 keV) and high (9.45–30 keV) flux categories.
The southward component of interplanetary magnetic field (IMF) plays crucial roles in efficiently transferring solar wind energy into the magnetosphere. It proceeds via the process of magnetic reconnection at magnetopause region during daytime (Koskinen and Eija, 2002). The transfer of the solar wind energy into M-I system is represented by the coupling functions. We used the Akasofu [Epsilon (ε)] and the Newell coupling functions as the representations of energy transfer in the present study (Akasofu., 1981; Newell et al., 2007). The Epsilon parameter is given as (in SI unit);
3 Results and observations
Figure 1 shows a typical case of ICME (left) and CIR-driven (right) storms, respectively, during 16–26 November 2003 and April 29-9 May 2010. Left panel of Figure 1 shows the temporal variations of (a) IMF Bz, (b) Dst- and SYM-H indices, (c) GRACE-A thermospheric density, (d) GRACE-A thermospheric density at 400 km, (e) SABER- CO2 flux and (f) SABER- NO flux for ICME-driven storm during November 16–26, 2003. Similarly, the right panel of Figure 1 shows the temporal variation of same parameters for the CIR-driven storm during April 29-09 May 2010. The main phase of the ICME-driven storm started around 0824UT lasted for about 12 h before reaching the minimum Dst value of −422 nT at around 21 UT on 20 November 2003. The thermospheric density undergoes a huge enhancement (>500%) during storm period (Figures 1C, D). The CO2 and NO radiative emissions also undergo similar strong variations with relatively slower response time than the thermospheric density (Figures 1E, F). The CIR-storm during April 29-9 May 2010 started at around 08 UT on May 02 and the main phase lasted for less than 12 h before reaching the minimum Dst (−71 nT) at 19 UT on the same day. The density and cooling fluxes showed remarkable enhancements during the storm period. However, the relative increase in the magnitudes of the thermospheric density, CO2 and NO fluxes are found to be lesser as compared to CME storm. It is to be noted that the thermospheric density presented here is only to show that the thermospheric density also exhibits different temporal response during ICME- and CIR-driven storms. In the present investigation, the variation of thermospheric density has not been given much attention. More detailed study on the variation of the thermospheric density has been reported by (Chen et al., 2012; Chen et al., 2014).
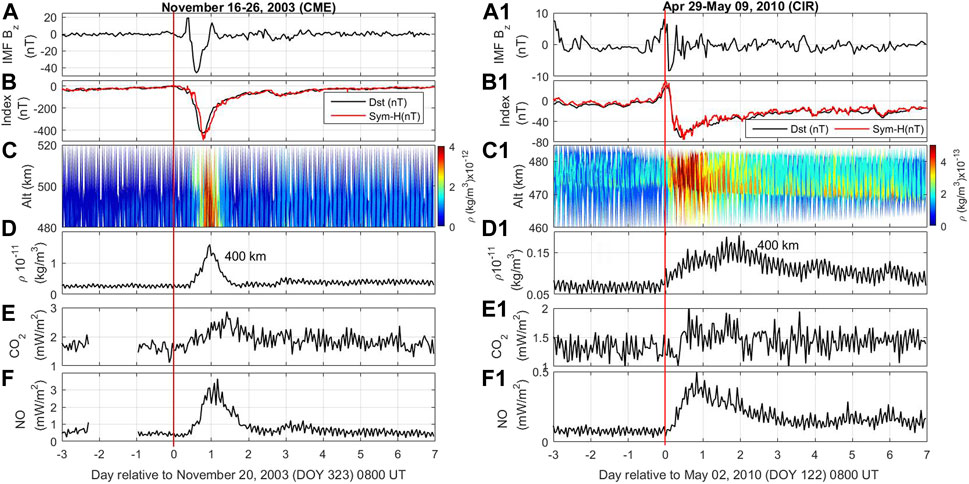
FIGURE 1. Temporal variations of (A) IMF Bz, (B) Dst and SYM-H-indices, (C) GRACE-A thermospheric density, (D) GRACE-A thermospheric density at 400 km, (E)SABER CO2 flux and (F) SABER NO flux during CME-storm of November 16–26, 2003. (A1–F1) Same for CIR-storm during April 29-09 May 2010.
In order to understand the average trend of the thermospheric cooling and its response to energy input, we performed a superposed epoch analysis (SEA) study with zero epoch time corresponding to the storm’s main phase. The SEA of the CME- and CIR-storms are, respectively, depicted in Figures 2A–E, A1-E1. The horizontal dotted lines represent the pre-onset value. It can clearly see that as the storm intensifies, the thermospheric density also increases both during the CME- and CIR-storms (Figures 2C, C1). The maximum density enhancement occurs within a day of onset, similar to the previous reported results (Lei et al., 2011; Chen et al., 2012; Chen et al., 2104; Oliveira et al., 2017). The density during CIR-storm peaks earlier but lasts longer than the CME-storms. Krauss et al. (2015) reported a factor of eight increase in the thermospheric density during ICME-storms as compared to pre-event period. Similar variation is also noticed in the thermospheric cooling emissions (Figures 2E, F, E1–F1). A stronger (slower) enhancement with faster (slower) recovery is observed in the CO2 and NO cooling fluxes during CME (CIR) storms. The peak values of the NO and CO2 cooling fluxes are 2.0 mW m−2 and 1.23 mW m−2 during CME-storm. Whereas, they are 1.5 mW m−2 and 0.28 mW m−2 for CIR-storm, respectively. This indicates that the impact of the ICME-driven storms is much more than the CIR-driven storms as far as the magnitude is concerned. However, it is interesting to note here that the cooling fluxes take more time (>6–7 days) to recover during CIR-driven storms, whereas, the recovery rate is faster (∼3–4 days) for ICME-driven storms.
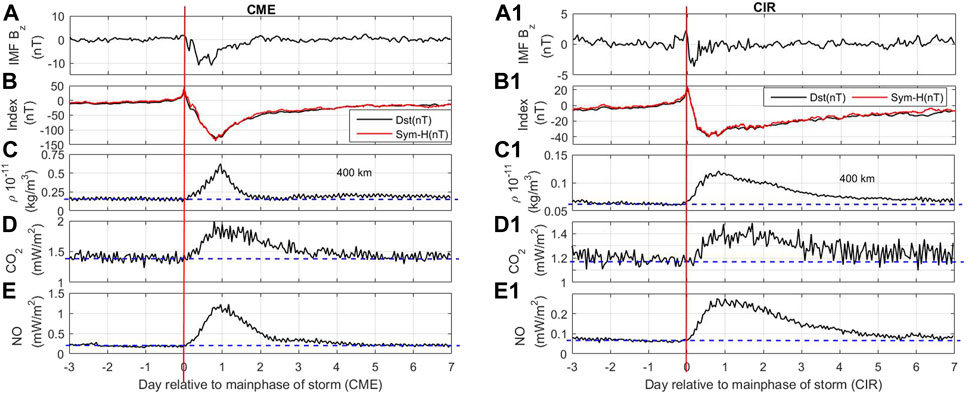
FIGURE 2. Superposed Epoch Analysis for (left) CME and (Right) CIR storms. (A) IMF Bz, (B) Dst- and SYM-H indices, (C) GRACE thermospheric density at 400 km, (D)SABER CO2 flux and (E) SABER NO cooling flux during CME storm. (A1–E1) Same for CIR-storms. All data are binned into 1 h average. Vertical red lines mark the time of main phase. The horizontal dotted lines represent the pre-event value.
In order to understand the impact of the energetic particle precipitations and the energy input from magnetosphere on the thermospheric cooling emission, Figure 3 is presented. Figures 3A–F, A1–F1, respectively, show the DMSP measured electron flux, ion flux along with the Epsilon (ε) and Newell coupling functions (CF) during CME- and CIR-storms. It can be seen that the particle (electron and ion) fluxes and the coupling functions show strong enhancement during both the storm periods. The enhancement in the particle fluxes and the CFs during CME-storm is higher than the CIR-storm. The ε-parameter shows higher enhancement as compared to the Newell’s. The relative enhancement in ε-parameter is more than 50% and 30% during CME- and CIR-storm, respectively, as compared to the quiet value. Whereas, the Newell’s CF undergoes enhancement of about 7% and 5%, respectively. The ion flux returns to pre-event level within 2 days post peak enhancement. However, the electron flux (particularly the mid and high) remains elevated for many days. Further, it is interesting to note that the enhancement in electron fluxes (mid and high) during CIR-storm sustain longer than the CME-storm.
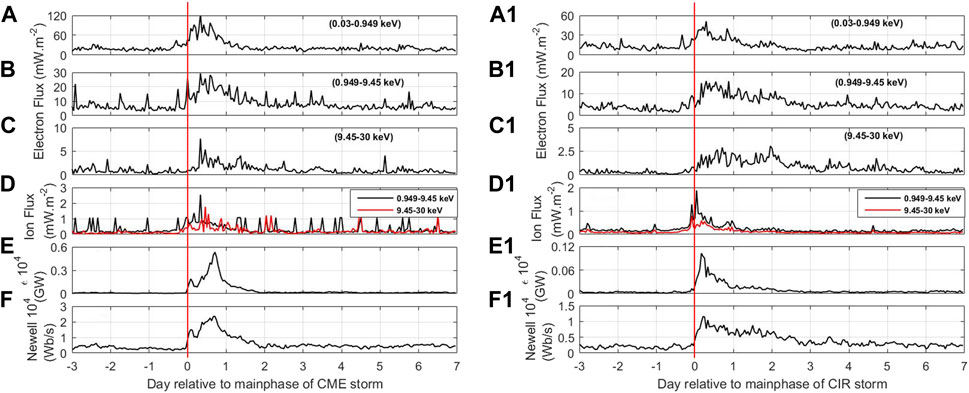
FIGURE 3. Superposed Epoch for (left) CME and (Right) CIR storms. (A–C) DMSP electron flux, (D) DMSP ion flux, (E) Akasofu coupling function and (F) Newell coupling function during CME storms. (A1–F1) Same for CIR storms.
In order to understand the inter-relationship between the cooling flux and other parameters (IMF Bz, Dst index, coupling functions, the particle flux and thermospheric density) during ICME- and CIR-driven storms, we performed a detailed cross-correlation analyses as a function of timelag and are shown in Figures 4A–J. It is important to mention here that the correlation analysis is carried out only for NO cooling flux and not with CO2 cooling flux as the CO2 is of anthropogenic origin. The impact of the space weather events on the CO2 cooling flux, in terms of particle precipitation, is yet to be well established. The normalized cross-correlation coefficients (r) for NO cooling flux with other parameters are provided in Table 2. The NO cooling flux exhibits a strong anti-correlation with Dst index during CME- and CIR-events. A strong negative correlation (r = −0.57) is also noticed between the NO cooling flux and IMF Bz during CME-event. However, no significant correlation is observed during the CIR-storm. The Akasofu-CF exhibits a relatively stronger correlation during CME-events (r = 0.92) as compared to the CIR-storms (r = 0.76). The Newell CF has higher normalized cross-correlation (r = 0.92) during CIR-storm than the CME-storm (r = 0.9) with the thermospheric cooling (Figures 4C, D). A timelag of about 9 h is observed between the NO cooling flux and both coupling functions during CME-storms. Whereas, it displays different timelag with Akasofu and Newell-CF during CIR-storms. The timelag is about 14 h for Akasofu, whereas, it is about 9 h for Newell-CF. Almost an identical behavior is observed with the cross-correlation between NO cooling flux and electron fluxes of lower energy range (0.03–0.949 keV). However, a timelag about 13 h is observed between NO cooling flux and lower electron energy flux during both CME and CIR storms. It is about 5 h longer than the timelag between the NO cooling flux, and mid-electron and high-electron flux. Similarly, about 15 h of timelag is noticed between the NO cooling flux and ion particle flux of mid and high energy range during CIR-storms as compared to the CME-storms. It is interesting to note here that the correlation coefficient significantly increases for mid and high-electron fluxes during CIR events. The NO cooling flux is also found to have a strong correlation with the thermospheric density at 400 km both during CME (r = 0.86) and CIR (r = 0.95) storms. As far as the correlation with ion flux is concerned, the correlation coefficients are much higher for CIR-driven storms. Therefore, it is important to note that the particle flux (both electron and ion) of higher energy range is strongly correlated with the NO cooling flux during CIR events. It is to be noted that the cross-correlation coefficient between cooling fluxes and particle fluxes is maximum with a time lag of 8–15 h. This indicates a distinct delayed response between NO cooling flux and particle precipitation for both the storm events as compared to other parameters.
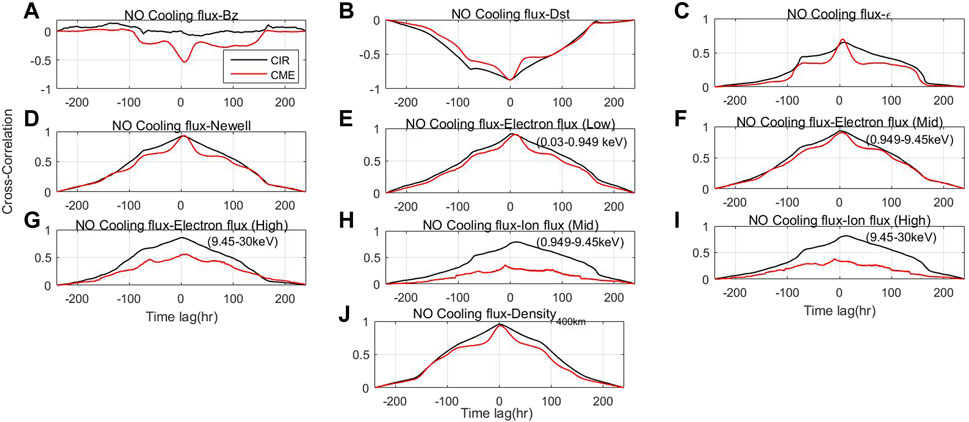
FIGURE 4. Cross-correlation between NO Cooling flux and other parameters. Solid black and red colors, respectively, represent the CIR-storm and CME-storm. Cross-correlation between cooling fluxes and (A) IMF Bz, (B) Dst-Index, (C) Akasofu CF, (D) Newell CF, (E) Low electron flux (0.03–0.949 keV), (F) mid electron flux (0.949–9.45 keV) (G) high electron flux (9.45–30 keV), (H) mid ion flux (0.949–9.45 keV), (I) high ion flux (9.45–30 keV) and (J) GRACE-thermospheric density at 400 km.

TABLE 2. Normalized correlation coefficient between NO cooling flux and other parameters during CME-and CIR-storms.
4 Interpretation and discussion
The NO and CO2 radiative cooling emissions strongly react to the energy deposition into M-I system during space weather events (Mlynczak et al., 2003; Knipp et al., 2013; Knipp et al., 2017; Bag 2018; Bag et al., 2021). It is due to their strong dependence on the abundance of NO (CO2), atomic oxygen and kinetic temperature (Houghton, 1970; Kockarts, 1980; Mlynczak et al., 2003). Between the two, NO cooling is more susceptible to the external energy deposition. However, the CO2 cooling can be dominating during the solar minimum period (Mlynczak et al., 2016). In the present investigation, it is found that the CO2 cooling flux undergoes, respectively, about 40% and 25% increment during CME- and CIR-storms. Although it is observed that CO2 cooling flux is strongly affected by the ICME- and CIR-driven storms, the mechanisms with respect to the external energy deposition and particle flux are not well established.
The CME-storms are impulsive and drive stronger ring current due to steady southward IMF Bz. The CIR-storms drive less intense ring current but last for several days (Tsurutani et al., 2006; Borovsky and Denton, 2006). As a result, the thermospheric density returns to pre-onset value after 2–3 days of storm’s main phase in case of ICME-driven storm. On the other hand, it takes about 5–6 days for density to return to pre-event, owing to the longer energy deposition, during CIR storm (Figure 1C1). Chen et al. (2012) have found that the CIR storms can have same or even greater effects on the thermospheric density than the CME-storms due to the result of the energy deposition in longer time scales. The NO cooling flux undergoes about six times and three times increment, respectively, during CME- and CIR-storms. The cooling emissions strongly dictate the thermospheric density during geomagnetic storms. The different response of the thermospheric density to the CME- and CIR-storms could be due to the impacts of the CO2 and NO emissions.
Earlier studies suggest that the lower energy electrons (<1 keV) have stronger impacts on the thermospheric cooling and intravenously contribute to the upliftment of atmospheric density (Knipp et el., 2013; Lin et al., 2019). A strong correspondence between the cooling and electron flux is also found during storm events. The electron flux during CME-storm shows a sudden, higher enhancement and a quick recovery as compared to the CIR events similar to the thermospheric cooling flux (Figures 3A–C, A1–C1). It could be due to different magnitude and temporal scales of energy deposition (Knipp et el.,2013). The coupling functions also have similar behavior during storm events (Figures 3D, E, D1, E1). Lin et al. (2019) have reported that the enhancement in the NO cooling is dominated by electron flux of 1.4–30 keV during particle precipitation events. The NO molecule is created due to the dissociation of N2 by auroral electrons with energies between 1 and 10 keV (Barth et al., 2003). The electrons of 1 keV produce NO density in the altitude above 120 km whereas that of 1.4–4.6 keV affect 100–110 km altitude (Bailey et al., 2002; Richards, 2004). The ion also significantly contributes to the cooling flux. The electron (ion) of 0.1 keV and 10 keV can reach, respectively, the altitude of 230 (170) km and 105 (120) km (Fang et al., 2010; Fang et al., 2013). The ion flux of 1–20 keV can lead to the NO production by >50% particularly during night (Galand et al., 1999).
The particles strongly react to the external energy input (Lin et al., 2019). The energy deposited into the M-I system can immediately be evident in the magnetospheric/ionospheric parameter, particle flux and coupling functions. Whereas, the cooling flux takes a little longer for the atmosphere to heat and subsequently the cooling mechanism to proceed. It will lead to a positive timelag between the cooling flux and other parameters such as IMF Bz, coupling function, particle flux and thermospheric density (Figure 4). Turner et al. (2009) have shown that CIR-driven storms deposit more energy into the ionosphere through Joule and particle heating and the CME-storms dissipate more energy into the ring current. In addition, the magnetospheric electron flux precipitates on the Earth’s high latitude ionosphere causing considerably high Joule heating (Knipp et al., 2011; Deng et al., 2011; Verkhoglyadova et al., 2015). It is observed from the Figure 3 that there is an enhancement of low, mid and high-energy electron and ion precipitations into the upper atmosphere as measured by the DMSP spacecraft at the onset of storm. The enhancement of particle flux is found to be short-lived in case of CME. Whereas, it remains elevated for a sustained period of time during CIR-storm. Therefore, a stronger correlation is expected between cooling flux and particle flux during CIR-driven storms (Figure 4). Further, Lin et al. (2019) have reported that the NO cooling due to the proton is about 1/4th of the total cooling and about 30% of cooling due to electron precipitation. Relatively longer timelag during CIR-storm could be attributed to the relatively longer-time deposition of energy (Figures 4E–I). Further, the ion flux reacts faster than cooling flux to the energy input during CME storms; resulting in a shorter timelag (Figures 4H, I). A clear and distinct variations in the particle flux, solar wind-magnetosphere coupling functions are observed during the CME- and CIR-storms. It is evident that the different temporal and magnitude of cooling and subsequent thermospheric density could be due to the impacts of the particle flux. Further, the decay rates of the satellite orbits, during the CME storms, are larger due to large amount of energy input in short duration. The CIR storms last longer and affect the orbit for longer time resulting in the larger satellite orbital decays as compared to the CME-storms (Chen et al., 2012; Chen et al., 2014). Similar result is also reported by Oliveira et al. (2020) during historical geomagnetic storms. Their study shows that the long-lived, week superstorm can be more detrimental to the LEO satellite as compared to the short-lived, intense superstorms. Non-etheless, more investigations are needed to understand the relative roles of electron and ion particle flux in the production of NO emission. The response of the CO2 cooling during geomagnetic storm is not well explored. It, along with NO, can have significant impacts on the thermospheric density variability. The distinctive temporal response of the thermospheric cooling could be utilized to model the thermospheric density forecast, and consequently the LEO satellite’s orbital prediction and lifetime estimation.
5 Summary
We performed superposed epoch analysis and detailed cross-correlation study to investigate the response of CO2 15 μm and NO 5.3 μm cooling emissions during ICME- and CIR-driven storms by utilizing the data from TIMED-SABER satellite along with other datasets. The silent features emerged from this investigation are as follows: (I) The thermospheric cooling fluxes undergo quick and strong enhancement with a faster recovery (∼3–4 days) during CME storms. Whereas, a slower enhancement and a longer recovery (>6–7 days) is observed during CIR. (II) The Akasofu and Newell coupling functions display different behavior during CME- and CIR-storms. (III) The NO cooling flux during CIR storm shows longer time-lag with all parameters than the CME-event. (IV) The ions (>0.945 keV) and electrons (>9.45 keV) display a stronger correlation and higher timelag during CIR storms for NO cooling emission. The different behavior of NO cooling emission during ICME and CIR-driven storms could be due to the impacts of the both proton and electron fluxes.
Data availability statement
Publicly available datasets were analyzed in this study. This data can be found here: https://saber.gats-inc.com/data.php, https://lasp.colorado.edu/space-weather-portal, http://cedar.openmadrigal.org/single, https://omniweb.gsfc.nasa.gov/, https://supermag.jhuapl.edu.
Author contributions
TB calculated all relevant data, produced the figures, and wrote parts of the introduction and discussion sections and the majority of the results section. DR worked on epoch calculation and wrote parts of discussion sections and the majority of the introduction. YO and VS reviewed the results, advised on manuscript content, and contributed to the introduction and discussion sections.
Funding
TB is supported by the Japan Society for the Promotion of Science (JSPS) postdoctoral fellowship for research in Japan, grant number: 22F32017. DR acknowledges the support from Humboldt research Fellowship for Postdoctoral Researchers (Humboldt foundation grants PSP D-023-20-001).
Acknowledgments
We thank the SABER, GRACE, DMSP, SuperMAG, and OMNI team for providing the data.
Conflict of interest
The authors declare that the research was conducted in the absence of any commercial or financial relationships that could be construed as a potential conflict of interest.
Publisher’s note
All claims expressed in this article are solely those of the authors and do not necessarily represent those of their affiliated organizations, or those of the publisher, the editors and the reviewers. Any product that may be evaluated in this article, or claim that may be made by its manufacturer, is not guaranteed or endorsed by the publisher.
References
Akasofu, S.-I. (1979). Interplanetary energy flux associated with magnetospheric substorms. Space Sci 27, 425–431. doi:10.1016/0032-0633(79)90119-3
Akasofu, S.-I. (1981). Energy coupling between the solar wind and the magnetosphere. Space Sci. Rev. 28, 121. doi:10.1007/bf00218810
Bag, T. (2018). Diurnal Variation of Height Distributed Nitric Oxide Radiative Emission During November 2004 Super-Storm. J. Geophys. Res.-Space Phys. 123, 6727–6736. doi:10.1029/2018JA025239
Bag, T., Li, Z., and Rout, D. (2021). SABER observation of storm-time hemispheric asymmetry in nitric oxide radiative emission. J. Geophys. Res. Space Physics 126, e2020JA028849. doi:10.1029/2020JA028849
Bailey, S. M., Barth, C. A., and Solomon, S. C. (2002). A model of nitric oxide in the lower thermosphere. J. Geophys. Res. 107, SIA 22-1. doi:10.1029/2001JA000258
Barth, C. A., Mankoff, KD, Bailey, SM, and Solomon, SC (2003). Global observations of nitric oxide in the thermosphere. J. Geophys. Res. 108, 1027. doi:10.1029/2002JA009458
Barth, C. A., and Bailey, S. M. (2004). Comparison of a thermospheric photochemical model with Student Nitric Oxide Explorer (SNOE) observations of nitric oxide. J. Geophys. Res.: Space Phys. 109, A03304. doi:10.1029/2003ja010227
Barth, C. A. (2009). Joule heating and nitric oxide in the thermosphere. J. Geophys. Res.: Space Phys. 114, A5. doi:10.1029/2010ja015565
Barth, C. A., Tobiska, W. K., Siskind, D. E., and Clearly, D. C. (1998). Solar-Terrestrial coupling:Low latitude thermospheric nitric oxide. Geophys. Res.Lett. 15 (1), 92–94.
Borovsky, J. E., and Denton, M. H. (2006). Differences between CME-driven storms and CIR-driven storms. J Geophys Res Space Phys 111. doi:10.1029/2005JA011447
Chen, G., Xu, J., Wang, W., Lei, J., and Burns, A. G. (2012). A comparison of the effects of CIR- and CME-induced geomagnetic activity on thermospheric densities and spacecraft orbits: Case studies. J. Geophys. Res. 117, A08315. doi:10.1029/2012JA017782
Chen, G.-M., Xu, J., Wang, W., and Burns, A. G. (2014). A comparison of the effects of CIR- and CME-induced geomagnetic activity on thermospheric densities and spacecraft orbits: Statistical studies. J. Geophys. Res. Space Physics 119, 7928–7939. doi:10.1002/2014JA019831
Chen, Y., Wang, W., Burns, A. G., Liu, S., Gong, J., Yue, X., et al. (2015). Ionospheric response to CIR-induced recurrent geomagnetic activity during the declining phase of solar cycle 23. J. Geophys. Res. Space Physics 120, 1394–1418. doi:10.1002/2014JA020657
Houghton, J. T (1970). Comment on paper “Absorption and emission by carbon dioxide in the mesosphere”. Q. J. R. Meteorol. Soc. 96, 767.
Deng, Y., Huang, Y., Lei, J., Ridley, A. J., Lopez, R., and Thayer, J. (2011). Energy input into the upper atmosphere associated with high-speed solar wind streams in 2005. J. Geophys. Res. 116, A05303. doi:10.1029/2010JA016201
Fang, X., Lummerzheim, D., and Jackman, C. H. (2013). Proton impact ionization and a fast calculation method. J. Geophys. Res.-Space Phys. 118, 5369–5378. doi:10.1002/jgra.50484
Fang, X., Randall, C. E., Lummerzheim, D., Wang, W., Lu, G., Solomon, S. C., et al. (2010). Parameterization of mono energetic electron impact ionization. Geophys. Res. Lett. 37, L22106. doi:10.1029/2010GL045406
Galand, M., Roble, R. G., and Lummerzheim, D. (1999). Ionization by energetic protons in Thermosphere-Ionosphere Electrodynamics General Circulation Model. J. Geophys. Res. 104 (A12), 27973. doi:10.1029/1999JA900374
Gjerloev, J. W. (2012). The SuperMAG data processing technique. J. Geophys. Res. 117, A09213. doi:10.1029/2012JA017683
Hunt, L. A., Mlynczak, M. G., Marshall, B. T., Mertens, C. J., Mast, J. C., Thompson, R. E., et al. (2011). Infrared radiation in the thermosphere at the onset of solar cycle 24. Geophys. Res. Lett. 38, L15802. doi:10.1029/2011GL048061
Kockarts, G. (1980). Nitric oxide cooling in the terrestrial thermosphere. Geophys. Res. Letters 7, 137–140. doi:10.1029/GL007i002p00137
Knipp, D., Eriksson, S., Kilcommons, L., Crowley, G., Lei, J., Hairston, M., et al. (2011). Extreme Poynting flux in the dayside thermosphere: Examples and statistics. Geophys. Res. Lett. 38, L16102. doi:10.1029/2011GL048302
Knipp, D., Kilcommons, L., Hunt, L., Mlynczak, M., Pilipenko, V., Bowman, B., et al. (2013). Thermospheric damping response to sheath- enhanced geospace storms. Geophys. Res. Lett. 40, 1263–1267. doi:10.1002/grl.50197
Knipp, D. J., Pette, D. V., Kilcommons, L. M., Isaacs, T. L., Cruz, A. A., Mlynczak, M. G., et al. (2017). Thermospheric nitric oxide response to shock-led storms. Space Weather 15, 325–342. doi:10.1002/2016SW001567
Koskinen, H. E. J., and Eija, T. I. (2002). Magnetospheric energy budget and the epsilon parameter. J. Geophys. Res.: Space Phys. 107, 1415. doi:10.1029/2002ja009283
Krauss, S., Temmer, M., Veronig, A., Baur, O., and Lammer, H. (2015). Thermospheric and geomagnetic responses to interplanetary coronal mass ejections observed by ACE and GRACE: Statistical results. J. Geophys. Res.: Space Phys. 120 (10), 8848–8860. doi:10.1002/2015ja021702
Lei, J., Thayer, J. P., Wang, W., and McPherron, R. L. (2011). Impact of CIR Storms on Thermosphere Density Variability during the Solar Minimum of 2008. Sol. Phys. 274, 427–437. doi:10.1007/s11207-010-9563-y
Li, Z., Knipp, D., and Wang, W. (2019). Understanding the behaviors of thermospheric nitric oxide cooling during the 15 May 2005 geomagnetic storm. J. Geophys. Res. Space Physics 124, 2113–2126. doi:10.1029/2018ja026247
Lin, C. Y., Deng, Y., Knipp, D. J., Kilcommons, L. M., and Fang, X. (2019). Effects of energetic electron and proton precipitations on thermospheric nitric oxide cooling during shock-led interplanetary coronal mass ejections. J. Geophys. Res.: Space Physics 124, 8125–8137. doi:10.1029/2019ja027089
Mertens, C. J., Russell III, J. M., Mlynczak, M. G., She, C. Y., Schmidlin, F. J., Goldberg, R. A., et al. (2009). Kinetic temperature and carbon dioxide from broadband infrared limb emission measurements taken from the TIMED/SABER instrument. Adv. Space Res. 43 (1), 15–27. doi:10.1016/j.asr.2008.04.017
Mlynczak, M. G., et al. (2003). The natural thermostat of nitric oxide emission at 5.3 μm in the thermosphere observed during the solar storms of April 2002. Geophys. Res. Lett. 30 (21), 2100. doi:10.1029/2003GL017693
Mlynczak, M. G., Hunt, L. A., Thomas Marshall, B., Martin-Torres, F. J., Mertens, C. J., Russell, J. M., et al. (2010). Observations of infrared radiative cooling in the thermosphere on daily to multiyear timescales from the TIMED/SABER instrument. J. Geophys. Res. 115, A03309. doi:10.1029/2009JA014713
Mlynczak, M. G., Hunt, L. A., Mertens, C. J., Thomas Marshall, B., Russell, J. M., Woods, T., et al. (2014). Influence of solar variability on the infrared radiative cooling of the thermosphere from 2002 to 2014. Geophys. Res. Lett. 41, 2508–2513. doi:10.1002/2014GL059556
Mlynczak, M. G., Hunt, L. A., Russell, J. M., Marshall, B. T., Mertens, C. J., and Thompson, R. E. (2016). The global infrared energy budget of the thermosphere from 1947 to 2016 and implications for solar variability. Geophys. Res. Lett. 43 (11), 934. doi:10.1002/2016GL070965
Newell, P. T., Sotirelis, T., Liou, K., Meng, C. I., and Rich, F. J. (2007). A nearly universal solar wind-magnetosphere coupling function inferred from 10 magnetospheric state variables. J. Geophys. Res. 112, A01206. doi:10.1029/2006JA012015
Ogawa, Y., Seki, K, Keika, K, and Ebihara, Y (2019). Characteristics of CME- and CIR-driven ion upflows in the polar ionosphere. J. Geophys. Res.: Space Physics 124, 3637–3649. doi:10.1029/2018JA025870
Oliveira, D.M., Zesta, E., Schuck, P. W., and Sutton, E. K. (2017). Thermosphere Global Time Response to Geomagnetic Storms Caused by Coronal Mass Ejections. J. Geophys. Res.: Space Phys. 122 (10), 10762–10782. doi:10.1002/2017JA024006
Oliveira, D.M., Zesta, E., Hayakawa, H., and Bhaskar, A. (2020). Estimating satellite orbital drag during historical magnetic superstorms. Space Weather 18, 11e2020SW002472. doi:10.1029/2020SW002472
Perreault, P., and Akasofu, S. I. (1978). A study of geomagnetic storms. Geophys. J. Int. 54, 547–573. doi:10.1111/j.1365-246x.1978.tb05494.x
Rich, F. J., Hardy, D. D., and Gussenhoven, M. S. (1985). Enhanced ionosphere-magnetosphere data from the DMSP satellites. EOS 66, 513. doi:10.1029/EO066i026p00513
Richards, P. G. (2004). On the increases in nitric oxide density at midlatitudes during ionospheric storms. J. Geophys. Res. 109, A06304. doi:10.1029/2003JA010110
Richardson, I. G. (2018). Solar wind stream interaction regions throughout the heliosphere. Living Rev Solar Phys 15 (1), 1. doi:10.1007/s41116-017-0011-z
Rout, D., Singh, R., Pandey, K., Pant, T. K., Stolle, C., Chakrabarty, D., et al. (2022). Evidence for presence of a global quasi-resonant mode of oscillations during high-intensity long-duration continuous AE activity (HILDCAA) events. Earth, Planets and Space 74, 91. doi:10.1186/s40623-022-01642-1
Rout, D., Chakrabarty, D., Janardhan, P., Sekar, R., Maniya, V., and Pandey, K. (2017). Solar wind flow angle and geoeffectiveness of corotating interaction regions: First results. Geophys Res Lett 44 (10), 4532–4539. doi:10.1002/2017GL073038
Smith, E. J, and Wolfe, J. H. (1976). Observations of interaction regions and corotating shocks between one and five au: Pioneers 10 and 11. Geophys Res Lett 3 (3), 137–140. doi:10.1029/GL003i003p00137
Solomon, S. C., Barth, CA, and Bailey, SM (1999). Auroral production of nitric oxide measured by the SNOE satellite. Geophys. Res. Lett. 26, 9.
Sutton, E. K., Nerem, R. S., and Forbes, J. M. (2007). Density and winds in the thermosphere deduced from accelerometer data. J. Spacecr. Rockets 44 (6), 1210–1219. doi:10.2514/1.28641
Tapley, B. D., Bettapur, S, Ries, JC, Thompson, PF, and Watkins, MM (2004). GRACE measurements of mass variability in the Earth system. sci. 305, 503. doi:10.1126/science.109919
Turner, N. E., Cramer, W. D., Earles, S. K., and Emery, B. A. (2009). Geoefficiency and energy partitioning in CIR-driven and CME-driven storms. J. Atmos. Sol.-Terr. Phys. 71 (10-11), 1023–1031. doi:10.1016/j.jastp.2009.02.005
Tsurutani, B. T., Gonzalez, W. D., Gonzalez, A. L. C., Guarnieri, F. L., Gopalswamy, N., Grande, M., et al. (2006). Corotating solar wind streams and recurrent geomagnetic activity: A review. J. Geophys. Res. 111 (A7), 070S1. doi:10.1029/2005JA011273
Verkhoglyadova, O. P., Mannucci, A. J., Tsurutani, B. T., Mlynczak, M. G., Hunt, L. A., Redmon, R. J., et al. (2015). Localized thermosphere ionization events during the high-speed stream interval of 29 April to 5 May 2011. J. Geophys. Res. Space Physics 120, 675–696. doi:10.1002/2014ja020535
Verkhoglyadova, O.P., Meng, X, Mannucci, AJ, Tsurutani, BT, Hunt, LA, Haira, R, et al. (2016). Estimation of energy budget of ionosphere-thermosphere system during two CIR-HSS events: observations and modeling. J. Space Weather Space Clim 6, A20. doi:10.1051/swsc/2016013
Yee, J., Talaat, E R, Christensen, A B, Killeen, T L, Russell, J M, and Woods, T N (2003). TIMED instruments. Johns Hopkins APL Technical Digest 24 (2), 156–164.
Keywords: thermospheric radiative cooling, nitric oxide, carbon dioxide, geomagnetic storm, satellite observations
Citation: Bag T, Rout D, Ogawa Y and Singh V (2023) Distinctive response of thermospheric cooling to ICME and CIR-driven geomagnetic storms. Front. Astron. Space Sci. 10:1107605. doi: 10.3389/fspas.2023.1107605
Received: 25 November 2022; Accepted: 03 January 2023;
Published: 13 January 2023.
Edited by:
Xu-Zhi Zhou, Peking University, ChinaReviewed by:
Jiuhou Lei, University of Science and Technology of China, ChinaDenny Oliveira, University of Maryland, Baltimore County, United States
Copyright © 2023 Bag, Rout, Ogawa and Singh. This is an open-access article distributed under the terms of the Creative Commons Attribution License (CC BY). The use, distribution or reproduction in other forums is permitted, provided the original author(s) and the copyright owner(s) are credited and that the original publication in this journal is cited, in accordance with accepted academic practice. No use, distribution or reproduction is permitted which does not comply with these terms.
*Correspondence: Tikemani Bag, dGlrdS5iYWdAZ21haWwuY29t