 Zhiyang Xia1*
 Lunjin Chen1
 Wenyao Gu1
 Richard B. Horne2
 Yoshizumi Miyoshi3Yoshiya Kasahara4Atsushi Kumamoto5Fuminori Tsuchiya5Satoko Nakamura3Masahiro Kitahara5
 Iku Shinohara6
- 1Department of Physics, University of Texas at Dallas, Richardson, TX, United States
- 2British Antarctic Survey, Cambridge, United Kingdom
- 3Institute for Space-Earth Environmental Research, Nagoya University, Nagoya, Japan
- 4Graduate School of Natural Science and Technology, Kanazawa University, Kanazawa, Japan
- 5Graduate School of Science, Tohoku University, Sendai, Japan
- 6Institute of Space and Astronautical Science, Japan Aerospace Exploration Agency, Sagamihara, Japan
In this study, we use approximately 3 years of observations from the Exploration of energization and Radiation in Geospace (ERG/Arase) satellite to statistically study the meridional distribution of wave power from very-low-frequency (VLF) ground transmitters in the inner magnetosphere and analyze the corresponding latitudinal dependence. The results show that the mean intensity of NWC transmitter signals decreases as the transmitter emission propagates from the southern latitude (∼—30°) region to the equator in the inner magnetosphere and then increases as the emission propagates to the northern latitude
1 Introduction
Electromagnetic waves emitted by ground-based very low frequency (VLF) transmitters can penetrate through the ionosphere into the plasmasphere, which becomes one important type of whistler mode waves in the inner magnetosphere. In the ionosphere, VLF transmitter emissions can cause ionospheric perturbations, particle precipitation and heating (Inan et al., 2007; Parrot et al., 2007; Parrot et al., 2009; Gamble et al., 2008; Sauvaud et al., 2008; Graf et al., 2009; Marshall et al., 2010; Bell et al., 2011; Li et al., 2012; Němec et al., 2020). In the inner magnetosphere, VLF transmitter waves can resonate with energetic electrons and contribute to the loss of energetic electrons in radiation belts (Gamble et al., 2008; Sauvaud et al., 2008; Graf et al., 2009; Rodger et al., 2010; Li et al., 2012; Ma et al., 2017; Ross et al., 2019; Claudepierre et al., 2020; Cunningham et al., 2020; Hua et al., 2020; Hua et al., 2021; Hua et al., 2022; Liu et al., 2022). The propagation of VLF transmitter signals in the magnetosphere can be divided into two main categories: ducted mode (Helliwell, 1966) and non-ducted mode (Cerisier, 1973). The ducted mode requires the presence of plasma density irregularities, which can confine the wave normals to nearly align with the background magnetic field line. The non-ducted mode occurs in smoothly varying density distribution, and the wave normal angles can become very oblique.
Different propagation modes of VLF transmitter signals result in different distributions of wave power and wave normal in the inner magnetosphere, thereby affecting the loss process of energetic electrons. Starks et al. (2008) built a VLF transmitter model combining a simulation of the fields in the Earth-ionosphere waveguide, ionospheric absorption estimates, and geomagnetic field and plasma density models with fully three-dimensional ray tracing. Comparing the modeled wave power with the observations from 5 satellites, the model systematically overestimates the median field strength in the plasmasphere by approximately 20 dB at night and at least 10 dB during the day. Clilverd et al. (2008) compared the distribution of transmitter signals from DEMETER and CRRES in ionospheric footprints and indicated that the non-ducted mode dominates in the low L region (
However, due to the orbital limitation of these satellites, there exists a significant knowledge gap in the VLF transmitter emission propagation between the low latitudinal inner magnetosphere and the topside of the ionosphere, and the latitudinal dependence of the transmitter power has not been verified by in situ observations. In this study, we use approximately 3 years (2017-2020) of observations from the Exploration of energization and Radiation in Geospace (ERG/Arase) satellite and 7 years (2012-2019) of observations from Van Allen Probes to statistically study the meridional wave power distribution of NWC VLF transmitter emissions in the inner magnetosphere and analyze the latitudinal dependence of the wave power. Ray tracing simulation is also performed to reproduce the ray paths of the transmitter signal and the corresponding meridional wave power distribution. In Section 2, we give a brief introduction of the ERG/Arase and Van Allen Probes satellites and the data used in this study. In Section 3, we provide two events of NWC transmitter emissions observed by ERG/Arase and Van Allen Probes. In Section 4, the statistical meridional distribution of the NWC wave power is shown as well as that for other ground transmitters. Finally, we use the ray-tracing model to simulate the wave power distribution and compare it with the observational results in Section 5.
2 Spacecraft and instruments
The Van Allen Probes (Mauk et al., 2013) consist of two satellites with identical instruments and nearly similar near-equatorial (with an orbital inclination of
The Exploration of energization and Radiation in Geospace (ERG) (Miyoshi et al., 2018) satellite with the nickname “Arase” was launched on December 20, 2016, with apogee and perigee of ∼32,000 and 460 km, respectively, and an orbital period of ∼570 min. The High Frequency Analyzer (HFA) (Kumamoto et al., 2018) of the measurements from the Plasma Wave Experiment (PWE) instrument (Kasahara et al., 2018) provides two components electric spectra from a few kHz to 10 MHz (with 480 frequency bins with frequency width from ∼1.2 to ∼98 kHz) every 8 s (one spin period). The inclination of ERG/Arase orbits
3 Examples of NWC transmitter observations in the inner magnetosphere
To study the latitudinal distribution of transmitter wave power in the inner magnetosphere, we first check how the transmitter signals are captured by ERG/Arase and Van Allen Probes. Figure 1 shows two examples of NWC transmitter signals observed by ERG/Arase (1a) and Van Allen Probes (1b). Both events are selected at the nightside since the wave power of the NWC transmitter is stronger at the nightside in the inner magnetosphere (Zhang et al., 2018). For the ERG/Arase electric field wave power spectrum shown in Figure 1A, we can see strong wave power at frequencies near the frequency of the NWC transmitter signal (19.8 kHz). The frequency channel of 19.53 kHz shows the strongest wave power, and the wave power decreases sharply as the frequency increases or decreases away from 19.8 kHz. The orbit of the ERG/Arase satellite in this event is in the region with magnetic longitude from approximately 157° to 207° and magnetic local time from approximately 21 to 1 h. The magnetic latitude of the 100 km footprints of the satellite in the Southern Hemisphere is from −30° to −41°, which is close to the location of the NWC transmitter (geomagnetic longitude of 187° and geomagnetic latitude of −31°). Thus, we can confirm that the observed strong emission near 19.8 kHz is the signal of the NWC transmitter.
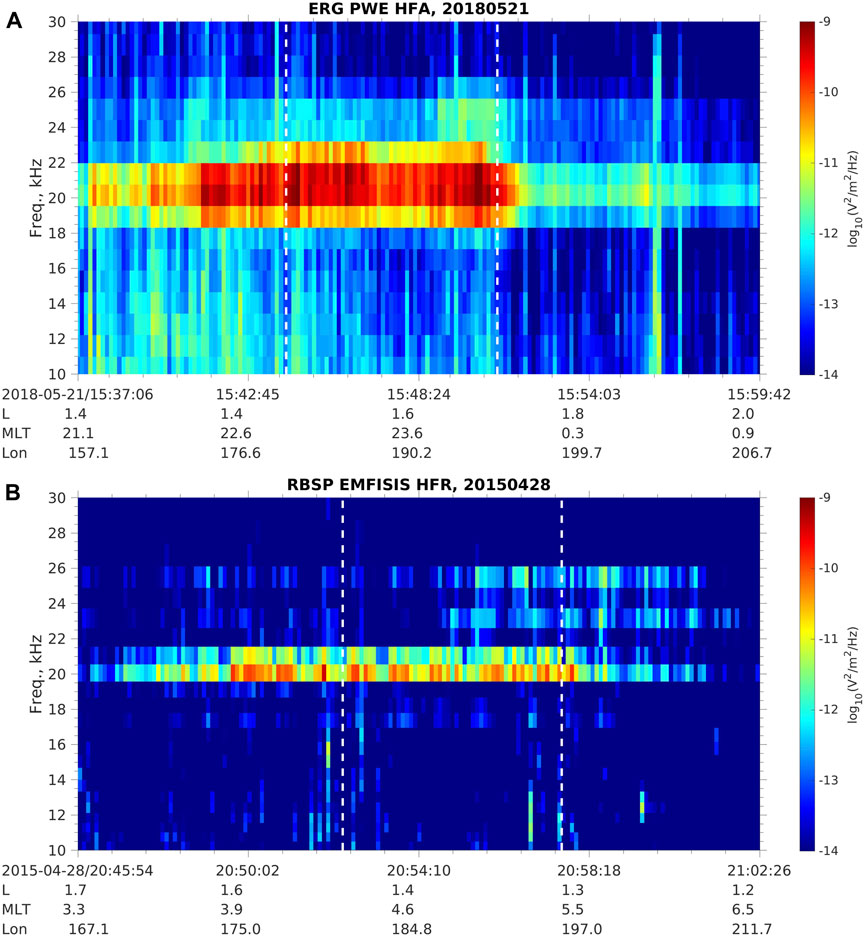
FIGURE 1. Example of NWC transmitter wave spectra observed by ERG/Arase PWE HFA (A) and Van Allen Probes EMFISIS HFR (B). The white vertical dashed lines indicate the longitude boundaries of the NWC signal filter.
In Figure 1B, similar NWC signals are observed by Van Allen Probes, with a similar satellite footprint region and strong wave power near 19.8 kHz. The power spectra density value observed by Van Allen Probes is weaker than that by ERG/Arase due to the differences between the instruments onboard. The undermeasurement of the electric wave power of Van Allen Probes may be caused by plasma sheath effects (Hartley et al., 2016; Hartley et al., 2017). However, the actual value of the power spectra density does not affect our study of the latitudinal variation of the transmitter wave power since we only focus on the relative change of the wave power rather than the exact wave power value.
From the above cases, we are confident that the wave power of the NWC transmitter can be observed well above the background noise by both ERG/Arase and Van Allen Probes. We can use nearly 3 years of ERG/Arase observations and 7 years of Van Allen Probes observations to perform a statistical analysis of the NWC wave power distribution projected on a meridian plane. The following filters are applied to the data for the analysis: 1. The MLT should be at nightside for stronger emissions than dayside; 2. The wave power of the frequency bin closest to 19.8 kHz should be larger than the mean wave power of the two nearby frequency bins; 3. The magnetic longitude should be close to the longitude of the NWC transmitter (187°). The magnetic longitudinal filter range is selected to be [180°, 195°] (similar to the longitude range used in Zhang et al. (2018)), which is labeled by the two white vertical dashed lines in Figures 1A, B, and most of the strong NWC wave signals are confined within this longitude range.
4 Latitudinal dependence of NWC transmitter wave power
The NWC signals are obtained by applying the filters mentioned in the previous section to the observations of ERG/Arase and Van Allen Probes satellites. For the ERG/Arase observation, the obtained data are sorted into bins with different geomagnetic latitudes (of latitudinal bin width 2°) and radial distances (of radial bin width 0.2 RE) from the center of the Earth. Figures 2A, B show the meridional distribution of the data number and mean value of the NWC wave power. The wave power is obtained by a product of the power spectra density and the width of the frequency bin containing 19.8 kHz. In Figure 2A, most of the data numbers for the bins are high enough to provide reliable statistical mean values. In Figure 2B, we can clearly see a region with strong wave power, illuminating the propagation route of the NWC signals from the Southern Hemisphere to the Northern Hemisphere. The wave power at the high latitude region is much higher (approximately by one order of magnitude) than that near the equator, especially in the Southern Hemisphere. This wave power distribution suggests that as the NWC emission propagates from the Southern Hemisphere to the Northern Hemisphere, the wave power decreases as the wave approaches the equator and then increases as the wave leaves the equator.
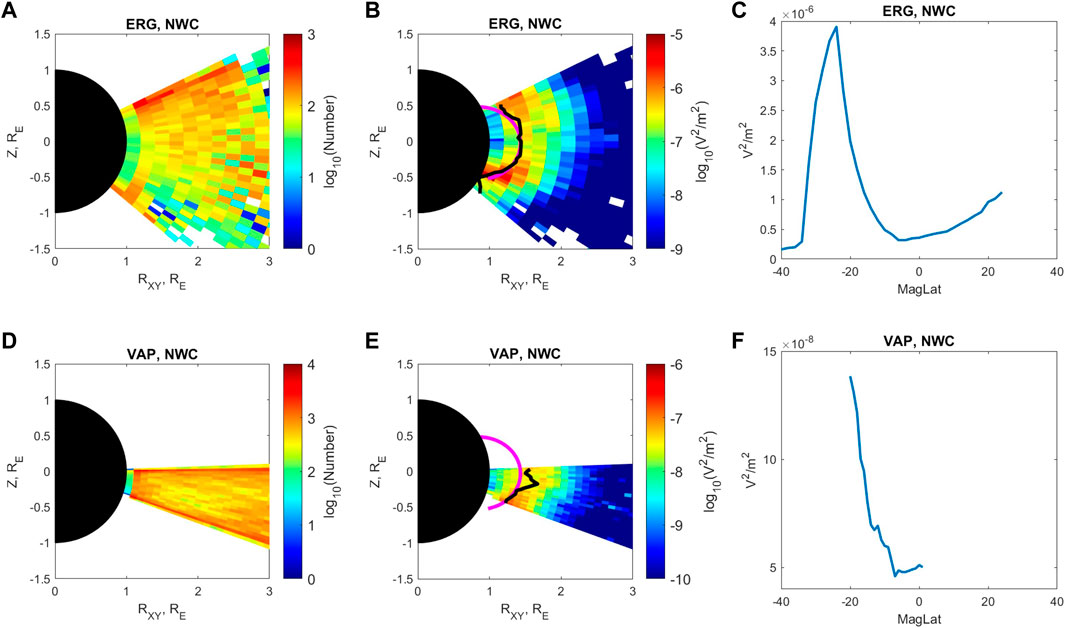
FIGURE 2. The meridional distribution of data number (A), NWC wave power (B), and the variation of peak wave power A0 over magnetic latitude (C) from ERG/Arase observations. Panels (D–F) are observations from Van Allen Probes. Rxy is the distance from the Earth’s diple axis (Z-axis). The black solid lines in (B, E) represent the trajectory of peak wave power location r0 for the ERG/Arase and Van Allen Probes observations, respectively. The magenta solid line is the IGRF magnetic field line starting from the maximum NWC transmitter wave power location observed by DEMETER.
To establish the latitudinal dependence of the NWC wave power more directly, we perform further analysis on the meridional wave power distribution. For each latitude bin, we find the peak wave power A0 and corresponding peak location r0. We plot r0 versus latitude in Figure 2B as the black solid line, which indicates propagation path of NWC waves. The magenta solid line is the background magnetic field line calculated by the IGRF-12 model (Thébault et al., 2015) passing through the location of the power peak of the observed NWC signal from DEMETER from Zhang et al. (2018). The variation in A0 versus latitude is plotted in Figure 2C, in which we can clearly see that the NWC wave power decreases from nearly 4 × 10⁻⁶V2/m2 at approximately -25° latitude to approximately 0.4 × 10⁻⁶V2/m2 near the equator and then increases to nearly 1.2 × 10⁻⁶V2/m2 at approximately 25° latitude. The apparent sharp decrease near -30° latitude is due to no significant NWC wave power in the region near -30° latitude. The NWC emissions propagate from the ionosphere at approximately -25° into the inner magnetosphere and then propagate only northward.
To verify the latitudinal dependence of NWC wave power based on ERG/Arase measurement, we perform a similar analysis for the Van Allen Probes data (with 1° latitude bin and 0.1 RE radial distance bin), with corresponding figures shown in Figures 2D–F. The data number in Figure 2D is even higher than in 2a due to the longer operation time and higher spectral data time resolution of the Van Allen Probes. Although the orbital coverage of the Van Allen Probes limits the latitudinal range of the results to only approximately -20°–0°, the latitudinal variation in NWC wave power from the Van Allen Probes observations is similar to that from ERG/Arase observations. In Figure 2F, the variation in NWC wave power decreases from approximately 1.4 × 10⁻⁷V2/m2 to approximately 4.6 × 10⁻⁸V2/m2, with a decreasing factor of approximately 1/3, which is comparable with the relative decrease from -20° to 0° of the NWC wave power measured by ERG/Arase (∼1/5) shown in Figure 2C. In summary, both ERG/Arase and Van Allen Probes observations confirm that the NWC wave power is minimized near the equator.
5 Comparison with ray tracing simulation
The statistical meridional distribution of the NWC wave power is mainly as a result of the propagation of the VLF transmitter emissions in the inner magnetosphere. Using the HOTRAY code (Horne, 1989), we perform ray-tracing simulations to construct the distribution of the NWC wave power and make a comparison against the observed wave power distribution. For the ray-tracing model used, the background magnetic field is the IGRF-12 field (Thébault et al., 2015), and the cold plasma density profile is identical to the typical nighttime profile in Bortnik et al. (2011). Landau damping during the propagation is also accounted for using a suprathermal electron model (Bortnik et al., 2011) with a moderate Kp value (=2). The rays are launched at an altitude of 700 km from −3° to −50° magnetic latitude with a spacing of 0.1°, and with the initial wave normal angle radially outward. In total, 471 rays are traced. The ray tracing simulation provides the paths of these rays on the meridional plane, the wave normal variation along the ray paths, and path-integrated wave damping.
To obtain wave power variation, we make use of the conservation of energy flux along the propagation. That is, when the wave damping is not considered, for the i-th ray with initial latitude λi, the dot product of the Poynting vector S and the cross-sectional area A should be conservative: S ⋅A = S ⋅ A = Ci, where S is the magnitude of the Poynting vector, A = d ⋅ r⊥⋅Δϕ, where d is the cross-sectional distance between the (i − 1)-th and (i + 1)-th rays, r⊥ is the distance from the Earth’s dipole axis, and Δϕ is an arbitrary fixed azimuthal angle width. Expressing in term of electric field power, the conservation equation can be written as:
where PE is the electric wave power, and the ratio
where
Where the three pairs of brackets on the right side of the equation underline the dispersion, geometric and damping factors, respectively.
The electric wave power at the starting point PE0 is obtained from the statistical wave power distribution based on DEMETER observations (Zhang et al., 2018), and the entire meridional distribution of the electric wave power can be constructed. Figure 3A shows the simulated meridional electric wave power distribution for the NWC transmitter emission. For each latitude bin, we find the wave power peak A0 and the corresponding location r0 as we do in Section 4, and the trajectory of r0 is shown by the black dashed line. We use the minimum value of peak power A0 along the trajectory of r0 near the equator as the normalization factor (PE, norm ∼ 6.9 × 10⁻⁸V2/m2) and the simulated wave power is normalized by PE, norm in Figure 3A. The magenta solid line is the IGRF magnetic field line starting from the maximum NWC transmitter wave power location observed by DEMETER. The simulated wave power distribution shows similar latitudinal dependence: the wave power decreases as the wave propagates to the equator and then increases as the waves leave the equator. This provides support for the presence of minimal wave power near the equator.
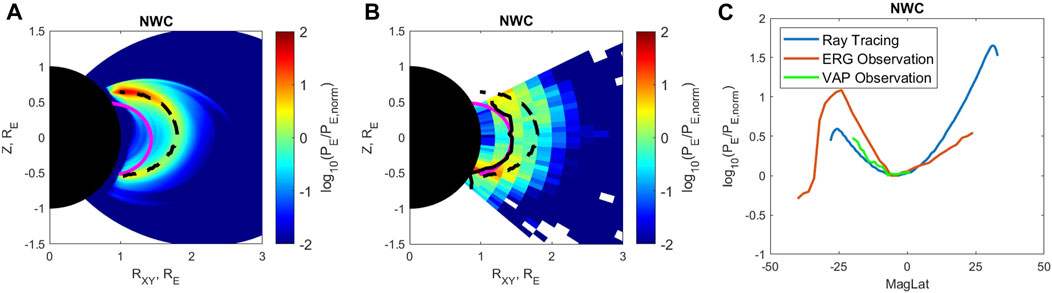
FIGURE 3. The meridional distribution of normalized NWC wave power from ray-tracing simulation (A) and ERG/Arase observation (B). (C) Is the relative change in the peak NWC wave power over magnetic latitude from the ray-tracing simulation (blue line), ERG/Arase observation (red line) and Van Allen Probes (green line). The black dashed lines in (A, B) represent the trajectories of the wave power peak location (r0) from the Ray Tracing simulation. The black solid line in (B) is the trajectory of r0 for the ERG/Arase observation. The magenta solid line is the IGRF magnetic field line starting from the maximum NWC transmitter wave power location observed by DEMETER.
It should be noted that three sets of spectral intensity are used, which are measured by three different instruments from DEMETER, ERG/Arase, and Van Allen Probes. The DEMETER wave spectra that are used as source emission in ray tracing, whose results are compared with ERG/Arase and Van Allen Probes wave spectra. Therefore, the absolute wave powers of the simulation and the observation differ. However, of interest in our study is the relative change in the wave power over the magnetic latitude. For comparison with the simulated distribution, we replot the wave power distribution from the ERG/Arase observation normalized by the minimum value of peak power A0 along the trajectory of r0 (black solid line) near the equator (PE, norm ∼ 3.2 × 10⁻⁷V2/m2) so that the equatorial value of the observed wave power matches that of the simulation (Figure 3A). The comparison exhibits similar latitudinal dependence. The relative changes in the wave power between the equator and ± 25° are of the same order (
In addition to the NWC transmitter, we also analyze the wave power distribution for three other VLF transmitters, i.e., NAA, NLK and NML transmitters. Their respective wave frequencies are 24, 24.8 and 25.2 kHz, and their magnetic longitudinal ranges are [−5°, 16°], [294°, 304°] and [322°, 332°], respectively (similar to the longitude ranges used in Zhang et al. (2018)). The results for these three transmitters are plotted in Figure 4, in a format similar to Figure 3. The normalization factors PE, norm for the NAA, NLK and NML transmitters are 5.2 × 10⁻⁹V2/m2, 4.8 × 10⁻⁹V2/m2 and 4.4 × 10⁻⁹V2/m2 respectively for the simulation result and are 4.4 × 10⁻⁸V2/m2, 1.1 × 10⁻⁸V2/m2, 1.5 × 10⁻⁸V2/m2 respectively for the ERG/Arase observation result. We do not show the results from Van Allen Probes observation because of their limited latitude range. Different from the NWC transmitter, the locations of these three transmitters are in the Northern Hemisphere and at relatively high latitudes
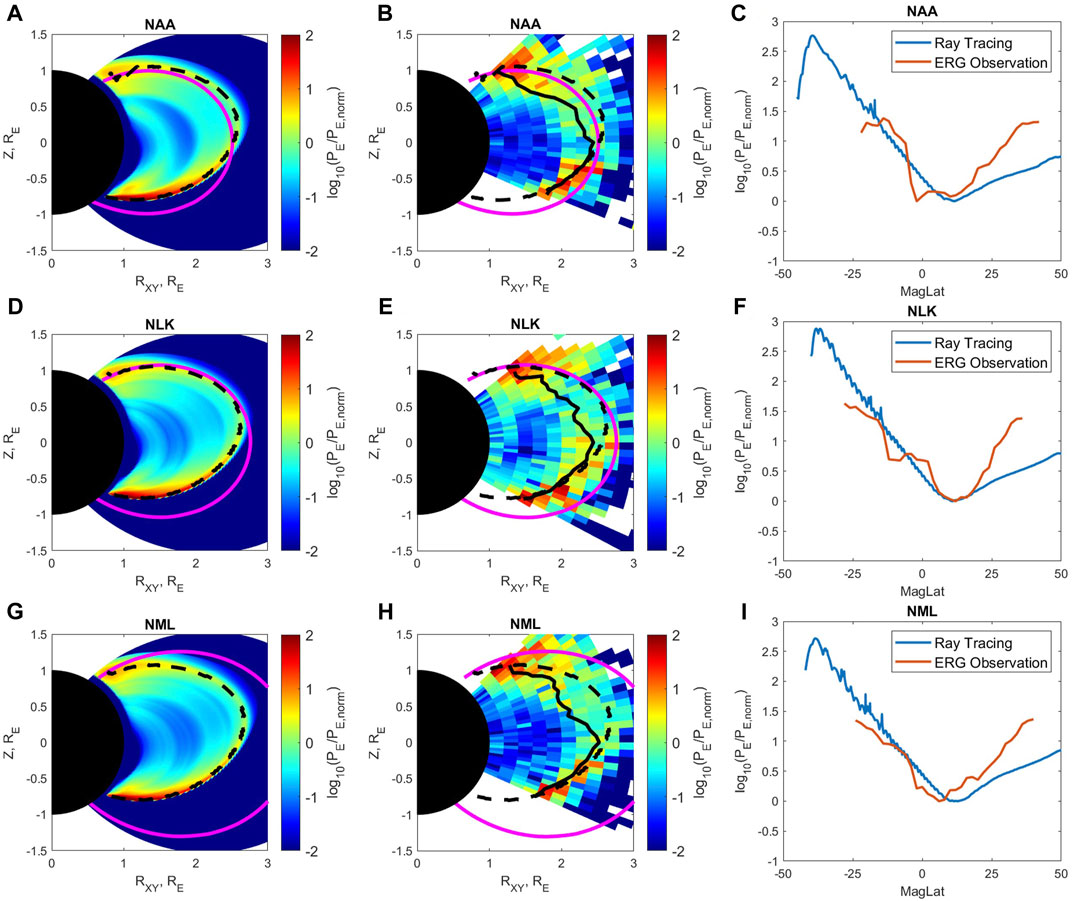
FIGURE 4. Similar analyses results from the Ray Tracing simulation and ERG/Arase observation as Figure 3 for NAA (A–C), NLK (D–F), and NML (G–I) transmitters.
To investigate the cause of the existence of VLF transmitter minimum wave power near the equator, we check the contribution of the three factors in Eq. 3, the dispersion, geometric, and damping factors. For the NWC transmitter, the minimum of the wave power near the equator is in part due to the variation of the dispersion factor but mainly determined by the geometric factor. The geometric factor, which is inversely proportional to the cross-sectional area, decreases when the wave propagates to the equator due to the spread of the rays, and then increases in the high latitude region due to the convergence of the rays (Buckley and Budden, 1982; Hanzelka and Santolík, 2019; Starks et al., 2020). The damping effect is rather weak at such a low L shell region due to the lack of the energetic electrons responsible for Landau damping (Li et al., 2010). For the three high latitude transmitters (NAA, NLK, and NML), both the dispersion and geometric factors play significant roles in forming the wave power minimum near the equator. Moreover, compared with NWC, the emission from these high latitude transmitters can propagate through the higher L shell region. As a result, the Landau damping factor becomes non-negligible and reduces the wave power along the propagation path, which results in the shift of the latitude of the wave power minimum farther away from the transmitter source region.
6 Summary and discussion
In this study, we use approximately 3 years of observations from the ERG/Arase satellite to statistically study the meridional distribution of the NWC transmitter wave power from the equator to the middle latitude region. The result shows significant latitudinal dependence of the wave power: the wave power is minimized near the equator and increases as the latitude increases. This latitudinal dependence is also confirmed by the statistical results of the 7-year observation from Van Allen Probes, although over a narrower latitude range (∼—20° to
The comparison between the observed and simulated wave power distributions also provides some additional information about the propagation mode of the transmitter signal. For the three higher latitude transmitters, the simulated wave power distribution matches the observed distribution very well, which strongly suggests that the dominant propagation mode is the non-ducted mode in the region of L < 3. For the NWC transmitter, in addition to the strong wave power in the non-ducted propagating region, considerable wave power exists in the lower altitude region, which may associate with the ducted and pro-longitudinal (PL) mode (Thomson and Dowden, 1977; Starks et al., 2001). The PL mode usually occurs at lower altitude regions (for low latitude transmitters such as NWC) and is caused by the sharp latitudinal plasma density gradient in the topside ionosphere. As a final remark, the wave power distribution of different VLF transmitters on the meridian plane reproduced in our study not only reveal the physics of wave propagation, but also can be applied to estimate the energetic electron loss caused by VLF transmitter emissions in the inner magnetosphere. The latter will be left as future work.
Data availability statement
The ERG/Arase data used in this paper are provided by the ERG/Arase Science Center https://ergsc.isee.nagoya-u.ac.jp/data/ergsc/satellite/erg/pwe/hfa/l2/spec. The data of Van Allen Probes used in this paper are provided by the Space Physics Data Facility (SPDF) https://spdf.gsfc.nasa.gov/pub/data/rbsp. The meridional wave power data for the ray tracing simulation and ERG/Arase observation can be downloaded from https://doi.org/10.5281/zenodo.7606644.
Author contributions
ZX contributes to the analysis of the ERG/Arase, Van Allen Probes data and the ray tracing simulation results. LC contributes to the calculation of wave power from the ray tracing simulation. WG contributes to the cross-sectional area calculation of the rays. RH contributes to the building of the HOTRAY code. YM, YK, AK, FT SN, MK, and IS contribute to the ERG/Arase mission and the PWE/HFA instruments.
Funding
Work at UTD is supported by NASA grants 80NSSC19K0282, 80NSSC21K0728, and 80NSSC21K1688. RBH was supported by NERC Highlight Topic Grant NE/P01738X/1 (Rad-Sat) and NERC grant NE/V00249X/1 (Sat-Risk).
Acknowledgments
Science data of the ERG/Arase satellite were obtained from the ERG Science Center operated by ISAS/JAXA and ISEE/Nagoya University. The present study analyzed PWE/HFA Lv2 spectrum data v01 (10.34515/DATA.ERG-10000) and Orbit L2 v03 data (10.34515/DATA.ERG-12000).
Conflict of interest
The authors declare that the research was conducted in the absence of any commercial or financial relationships that could be construed as a potential conflict of interest.
Publisher’s note
All claims expressed in this article are solely those of the authors and do not necessarily represent those of their affiliated organizations, or those of the publisher, the editors and the reviewers. Any product that may be evaluated in this article, or claim that may be made by its manufacturer, is not guaranteed or endorsed by the publisher.
References
Bell, T. F., Graf, K., Inan, U. S., Piddyachiy, D., and Parrot, M. (2011). Demeter observations of ionospheric heating by powerful vlf transmitters. Geophys. Res. Lett. 38, 47503. doi:10.1029/2011GL047503
Bortnik, J., Chen, L., Li, W., Thorne, R. M., and Horne, R. B. (2011). Modeling the evolution of chorus waves into plasmaspheric hiss. J. Geophys. Res. Space Phys. 116, 16499. doi:10.1029/2011JA016499
Buckley, R., and Budden, K. G. (1982). On the calculation of intensity in dispersive inhomogenous media in the ray approximation. Proc. R. Soc. Lond. A. Math. Phys. Sci. 380, 201–209. doi:10.1098/rspa.1982.0037
Cerisier, J. (1973). A theoretical and experimental study of non-ducted vlf waves after propagation through the magnetosphere. J. Atmos. Terr. Phys. 35, 77–94. doi:10.1016/0021-9169(73)90217-1
Chen, L., Bortnik, J., Li, W., Thorne, R. M., and Horne, R. B. (2012). Modeling the properties of plasmaspheric hiss: 1. Dependence on chorus wave emission. J. Geophys. Res. Space Phys. 117, 17201. doi:10.1029/2011JA017201
Claudepierre, S. G., Ma, Q., Bortnik, J., O’Brien, T. P., Fennell, J. F., and Blake, J. B. (2020). Empirically estimated electron lifetimes in the earth’s radiation belts: Comparison with theory. Geophys. Res. Lett. 47, e2019GL086056. doi:10.1029/2019gl086056
Clilverd, M. A., Rodger, C. J., Gamble, R., Meredith, N. P., Parrot, M., Berthelier, J. J., et al. (2008). Ground-based transmitter signals observed from space: Ducted or nonducted? J. Geophys. Res. Space Phys. 113, 12602. doi:10.1029/2007JA012602
Cunningham, G. S., Botek, E., Pierrard, V., Cully, C., and Ripoll, J. F. (2020). Observation of high-energy electrons precipitated by nwc transmitter from proba-v low-earth orbit satellite. Geophys. Res. Lett. 47, e2020GL089077. doi:10.1029/2020gl089077
Gamble, R. J., Rodger, C. J., Clilverd, M. A., Sauvaud, J. A., Thomson, N. R., Stewart, S. L., et al. (2008). Radiation belt electron precipitation by man-made vlf transmissions. J. Geophys. Res. Space Phys. 113, 13369. doi:10.1029/2008JA013369
Graf, K. L., Inan, U. S., Piddyachiy, D., Kulkarni, P., Parrot, M., and Sauvaud, J. A. (2009). Demeter observations of transmitter-induced precipitation of inner radiation belt electrons. J. Geophys. Res. Space Phys. 114, 13949. doi:10.1029/2008JA013949
Gu, W., Chen, L., Xia, Z., An, X., and Horne, R. B. (2020). Alpha transmitter signal reflection and triggered emissions. Geophys. Res. Lett. 47, e2020GL090165. doi:10.1029/2020gl090165
Gu, W., Chen, L., Xia, Z., and Horne, R. B. (2021). Direct evidence reveals transmitter signal propagation in the magnetosphere. Geophys. Res. Lett. 48, e2021GL093987. doi:10.1029/2021gl093987
Hanzelka, M., and Santolík, O. (2019). Effects of ducting on whistler mode chorus or exohiss in the outer radiation belt. Geophys. Res. Lett. 46, 5735–5745. doi:10.1029/2019GL083115
Hartley, D. P., Kletzing, C. A., Kurth, W. S., Bounds, S. R., Averkamp, T. F., Hospodarsky, G. B., et al. (2016). Using the cold plasma dispersion relation and whistler mode waves to quantify the antenna sheath impedance of the van allen probes efw instrument. J. Geophys. Res. Space Phys. 121, 4590–4606. doi:10.1002/2016JA022501
Hartley, D. P., Kletzing, C. A., Kurth, W. S., Hospodarsky, G. B., Bounds, S. R., Averkamp, T. F., et al. (2017). An improved sheath impedance model for the van allen probes efw instrument: Effects of the spin axis antenna. J. Geophys. Res. Space Phys. 122, 4420–4429. doi:10.1002/2016JA023597
Helliwell, R. A. (1966). Whistlers and related ionospheric phenomena. Geophys. J. R. Astronomical Soc. 11, 563–564. doi:10.1111/j.1365-246X.1966.tb03172.x
Horne, R. B. (1989). Path-integrated growth of electrostatic waves: The generation of terrestrial myriametric radiation. J. Geophys. Res. Space Phys. 94, 8895–8909. doi:10.1029/JA094iA07p08895
Hua, M., Bortnik, J., Ma, Q., and Bernhardt, P. A. (2022). Radiation belt electron acceleration driven by very-low-frequency transmitter waves in near-earth space. Geophys. Res. Lett. 49, e2022GL099258. doi:10.1029/2022gl099258
Hua, M., Li, W., Ni, B., Ma, Q., Green, A., Shen, X., et al. (2020). Very-low-frequency transmitters bifurcate energetic electron belt in near-earth space. Nat. Commun. 11, 4847. doi:10.1038/s41467-020-18545-y
Hua, M., Ni, B., Li, W., Ma, Q., Gu, X., Fu, S., et al. (2021). Statistical distribution of bifurcation of earth’s inner energetic electron belt at tens of kev. Geophys. Res. Lett. 48, e2020GL091242. doi:10.1029/2020gl091242
Inan, U. S., Golkowski, M., Casey, M. K., Moore, R. C., Peter, W., Kulkarni, P., et al. (2007). Subionospheric vlf observations of transmitter-induced precipitation of inner radiation belt electrons. Geophys. Res. Lett. 34, L02106. doi:10.1029/2006GL028494
Kasahara, Y., Kasaba, Y., Kojima, H., Yagitani, S., Ishisaka, K., Kumamoto, A., et al. (2018). The plasma wave experiment (pwe) on board the arase (erg) satellite. Earth, Planets Space 70, 86. doi:10.1186/s40623-018-0842-4
Kletzing, C. A., Kurth, W. S., Acuna, M., MacDowall, R. J., Torbert, R. B., Averkamp, T., et al. (2013). The electric and magnetic field instrument suite and integrated science (EMFISIS) on RBSP. Space Sci. Rev. 179, 127–181. doi:10.1007/s11214-013-9993-6
Kumamoto, A., Tsuchiya, F., Kasahara, Y., Kasaba, Y., Kojima, H., Yagitani, S., et al. (2018). High frequency analyzer (hfa) of plasma wave experiment (pwe) onboard the arase spacecraft. Earth, Planets Space 70, 82. doi:10.1186/s40623-018-0854-0
Li, W., Thorne, R. M., Bortnik, J., Nishimura, Y., Angelopoulos, V., Chen, L., et al. (2010). Global distributions of suprathermal electrons observed on themis and potential mechanisms for access into the plasmasphere. J. Geophys. Res. Space Phys. 115, 15687. doi:10.1029/2010JA015687
Li, X., Ma, Y., Wang, P., Wang, H., Lu, H., Zhang, X., et al. (2012). Study of the north west cape electron belts observed by demeter satellite. J. Geophys. Res. Space Phys. 117, 17121. doi:10.1029/2011JA017121
Liu, Y., Xiang, Z., Ni, B., Li, X., Zhang, K., Fu, S., et al. (2022). Quasi-trapped electron fluxes induced by nwc transmitter and crand: Observations and simulations. Geophys. Res. Lett. 49, e2021GL097443. doi:10.1029/2021gl097443
Ma, Q., Mourenas, D., Li, W., Artemyev, A., and Thorne, R. M. (2017). Vlf waves from ground-based transmitters observed by the van allen probes: Statistical model and effects on plasmaspheric electrons. Geophys. Res. Lett. 44, 6483–6491. doi:10.1002/2017GL073885
Marshall, R. A., Newsome, R. T., Lehtinen, N. G., Lavassar, N., and Inan, U. S. (2010). Optical signatures of radiation belt electron precipitation induced by ground-based vlf transmitters. J. Geophys. Res. Space Phys. 115, 15394. doi:10.1029/2010JA015394
Mauk, B. H., Fox, N. J., Kanekal, S. G., Kessel, R. L., Sibeck, D. G., and Ukhorskiy, A. (2013). Science objectives and rationale for the radiation belt storm probes mission. Space Sci. Rev. 179, 3–27. doi:10.1007/s11214-012-9908-y
Miyoshi, Y., Shinohara, I., Takashima, T., Asamura, K., Higashio, N., Mitani, T., et al. (2018). Geospace exploration project erg. Earth, Planets Space 70, 101. doi:10.1186/s40623-018-0862-0
Němec, F., Pekař, J., and Parrot, M. (2020). Nwc transmitter effects on the nightside upper ionosphere observed by a low-altitude satellite. J. Geophys. Res. Space Phys. 125, e2020JA028660. doi:10.1029/2020ja028660
Parrot, M., Inan, U. S., Lehtinen, N. G., and Pinçon, J. L. (2009). Penetration of lightning mf signals to the upper ionosphere over vlf ground-based transmitters. J. Geophys. Res. Space Phys. 114, 14598. doi:10.1029/2009JA014598
Parrot, M., Sauvaud, J. A., Berthelier, J. J., and Lebreton, J. P. (2007). First in-situ observations of strong ionospheric perturbations generated by a powerful vlf ground-based transmitter. Geophys. Res. Lett. 34, L11111. doi:10.1029/2007GL029368
Rodger, C. J., Carson, B. R., Cummer, S. A., Gamble, R. J., Clilverd, M. A., Green, J. C., et al. (2010). Contrasting the efficiency of radiation belt losses caused by ducted and nonducted whistler-mode waves from ground-based transmitters. J. Geophys. Res. Space Phys. 115, 15880. doi:10.1029/2010JA015880
Ross, J. P. J., Meredith, N. P., Glauert, S. A., Horne, R. B., and Clilverd, M. A. (2019). Effects of vlf transmitter waves on the inner belt and slot region. J. Geophys. Res. Space Phys. 124, 5260–5277. doi:10.1029/2019JA026716
Sauvaud, J. A., Maggiolo, R., Jacquey, C., Parrot, M., Berthelier, J. J., Gamble, R. J., et al. (2008). Radiation belt electron precipitation due to vlf transmitters: Satellite observations. Geophys. Res. Lett. 35, L09101. doi:10.1029/2008GL033194
Starks, M. J., Albert, J. M., Ling, A. G., O’Malley, S., and Quinn, R. A. (2020). Vlf transmitters and lightning-generated whistlers: 1. Modeling waves from source to space. J. Geophys. Res. Space Phys. 125, e2019JA027029. doi:10.1029/2019ja027029
Starks, M. J., Lee, M. C., and Jastrzebski, P. (2001). Interhemispheric propagation of vlf transmissions in the presence of ionospheric hf heating. J. Geophys. Res. Space Phys. 106, 5579–5591. doi:10.1029/2000JA000090
Starks, M. J., Quinn, R. A., Ginet, G. P., Albert, J. M., Sales, G. S., Reinisch, B. W., et al. (2008). Illumination of the plasmasphere by terrestrial very low frequency transmitters: Model validation. J. Geophys. Res. Space Phys. 113, 13112. doi:10.1029/2008JA013112
Thébault, E., Finlay, C. C., Beggan, C. D., Alken, P., Aubert, J., Barrois, O., et al. (2015). International geomagnetic reference field: The 12th generation. Earth, Planets Space 67, 79. doi:10.1186/s40623-015-0228-9
Thomson, R., and Dowden, R. (1977). Simultaneous ground and satellite reception of whistlers—2. Pl whistlers. J. Atmos. Terr. Phys. 39, 879–890. doi:10.1016/0021-9169(77)90168-4
Keywords: VLF transmitter, whistler wave, wave propagation, ray tracing, inner magnetosphere, ERG/Arase, van allen probes (RBSP)
Citation: Xia Z, Chen L, Gu W, Horne RB, Miyoshi Y, Kasahara Y, Kumamoto A, Tsuchiya F, Nakamura S, Kitahara M and Shinohara I (2023) Latitudinal dependence of ground VLF transmitter wave power in the inner magnetosphere. Front. Astron. Space Sci. 10:1135509. doi: 10.3389/fspas.2023.1135509
Received: 01 January 2023; Accepted: 06 February 2023;
Published: 23 February 2023.
Edited by:
Xu-Zhi Zhou, Peking University, ChinaCopyright © 2023 Xia, Chen, Gu, Horne, Miyoshi, Kasahara, Kumamoto, Tsuchiya, Nakamura, Kitahara and Shinohara. This is an open-access article distributed under the terms of the Creative Commons Attribution License (CC BY). The use, distribution or reproduction in other forums is permitted, provided the original author(s) and the copyright owner(s) are credited and that the original publication in this journal is cited, in accordance with accepted academic practice. No use, distribution or reproduction is permitted which does not comply with these terms.
*Correspondence: Zhiyang Xia, WmhpeWFuZy5YaWFAdXRkYWxsYXMuZWR1