 Nandita Srivastava
 Zavkiddin Mirtoshev
 Wageesh Mishra
- 1Udaipur Solar Observatory, Physical Research Laboratory, Udaipur, India
- 2Institute of Engineering Physics, Samarkand State University, Samarkand, Uzbekistan
- 3Indian Institute of Astrophysics, Bengaluru, India
Interacting coronal mass ejections (CMEs) have been commonly reported during the STEREO era. With the interaction of CMEs in the heliosphere, it is expected that the participating CMEs will either merge to form a single interplanetary CME (ICME) or will arrive as distinct entities or ICMEs at 1 AU. Previous studies have focused on in situ observations of solar wind, i.e., plasma and magnetic field properties to understand the nature of the CME–CME interaction and its impact. In this study, we examine the observations of composition parameters of those ICMEs that resulted due to the interaction of two CMEs during their propagation between the Sun and the Earth. We report two events of the CME–CME interaction observed in 2012, of which one led to a merged structure after the interaction, as observed at 1 AU. The second interaction event was reported to arrive at L1 as two distinct structures. Our analysis reveals distinct composition signatures in the form of ion charge state enhancements. The results improve our understanding of the signatures of ICMEs and different complex structures formed after the interaction. The study reveals that compression can occur due to the passage of the shock associated with the following CME through the preceding CME and not due to the CME–CME interaction. The results also highlight the importance of the comparison of solar wind proton velocity data with the expected temperature data, in particular, to understand the ICME–ICME interaction processes.
1 Introduction
Coronal mass ejections (CMEs) are large expulsions of plasma and magnetic field from the Sun, which have propagation speeds ranging from a few hundred to a few thousand kilometers per second. Depending upon their initial speeds, their travel time from the Sun to the Earth is known to range from 1 to4 days. Around solar maximum, the number of CMEs launched from the Sun is approximately five per day (St. Cyr et al., 2000; Yashiro et al., 2004; Webb and Howard, 2012) in contrast to one CME in 5 days during the solar minimum phase (St. Cyr et al., 2000; Gopalswamy et al., 2005; Gopalswamy et al., 2006; Webb and Howard, 2012). It is also well known that, generally, homologous CMEs originate from the same active region and exhibit a close morphological resemblance in coronal and coronagraphic observation at an interval of several hours (Zhang and Wang, 2002; Chertok et al., 2004; Kienreich et al., 2011; Li and Zhang, 2013). When such CMEs occur in quick succession, particularly as expected during the solar maximum phase, they can interact in the heliosphere if they propagate along the same direction. A detailed review on the interaction of CMEs has been presented by Lugaz et al. (2017) and Manchester et al. (2017).
If the successive CMEs are directed earthward, their interaction can enhance the geo-effectiveness due to the extended period and enhanced strength of the southward magnetic field, which are responsible for causing intense geomagnetic storms (Wang et al., 2003; Farrugia and Berdichevsky, 2004; Farrugia et al., 2006; Lugaz et al., 2013; Lugaz et al., 2017).
As the CMEs interact in the heliosphere, it is expected that the participating CME will either merge to form a single interplanetary CME with different properties than those of the participating CMEs or will arrive as distinct entities of ICMEs at 1 AU, retaining their original properties. Merging of CMEs is expected when reconnection can set in between the trailing edge of the preceding CME and the leading edge of the following CME, resulting in a single flux rope (Palmerio et al., 2021). Simulation studies on the resulting magnetic structure of interacting CMEs carried out by Schmidt and Cargill (2004) and Lugaz et al. (2013) show that, in general, two flux ropes with the opposite orientation offer favorable configuration for efficient magnetic reconnection during the interaction, in particular at the interface between the two flux ropes, where antiparallel fields meet. Kilpua et al. (2019) provided supporting observations for the aforementioned simulation results for the interacting CMEs of June 2012, investigated in the present study. However, irrespective of the orientation of the flux rope between the interacting ICMEs, there is always a radial compression of the preceding CME as the shock driven by CME2 propagates through CME1. When the axial fields of the two CMEs are antiparallel, there is often a short period of overexpansion following the interaction as the rate of overexpansion depends partly on the reconnection rate between the two CMEs (Lugaz et al., 2013). Recently, in situ observations of solar wind, i.e., plasma and magnetic field properties, have been examined to understand the nature of interaction and its impact (Mishra et al., 2015a; Mishra et al., 2016; Mishra et al., 2017; Srivastava et al., 2018). During the STEREO era, several events of interacting CMEs have been reported in detail by Mishra and Srivastava (2013), Mishra and Srivastava (2014), Temmer et al. (2014), Mishra et al. (2015b), and Shen et al. (2017).
In addition to plasma and magnetic parameters, the other class of signatures, which is important, are the composition signatures of the ICMEs (Zurbuchen and Richardson, 2006). Therefore, it is crucial to examine and understand the observations of composition parameters in interacting ICMEs. In the present study, we aim to understand the space weather effects of the interacting CMEs in the heliosphere in the context of composition signatures.
The charge state distributions of heavy ions in ICMEs observed in the in situ data generally provide information on the conditions prevalent in the corona where the CME plasma originates. The charge state has been used to distinguish fast wind from slow wind (von Steiger and Zurbuchen, 2003) as they originate from different source regions in the corona, i.e., coronal holes and streamers, respectively. It is also to be noted that the timescale needed for solar wind expansion is typically much shorter than that of ionization and recombination, thereby freezing-in the relative ionization states and maintaining the values that are present at the source region (Hundhausen et al., 1968). This suggests that the ionic fractions measured in situ are dictated by the physical parameters near the Sun where freeze-in occurs (Rakowski et al., 2007; Gruesbeck et al., 2011; Gruesbeck et al., 2012; Lynch et al., 2011; Song et al., 2015a; Song et al., 2015b), which have been further used to infer the eruption process of flux ropes (Song et al., 2016; Wang et al., 2017; Huang et al., 2018). The high ionization states refer to a hot source region and can also describe the thermal history of the interplanetary plasmas by comparing the freezing-in temperatures of different charge state pairs (Gopalswamy, 2006). One expects that the interacting ICMEs can result in unusual compositional signatures compared to an isolated ICME, partly because of the conditions at the Sun and partly due to the interaction. The launch of successive CMEs from the Sun suggests the possibility that the fraction of heavy elements settling at different solar heights and their confinement time in the solar atmosphere can be different for interacting CMEs as compared to isolated CMEs. Additionally, the sequence of energy release processes leading to successive CMEs may give rise to a higher fraction of ionization in the following CME plasma. Furthermore, CME–CME interactions can lead to different compositional signatures through the mixing of plasma from the two CMEs. This suggests the possibility that plasma from one CME can become entrained within the other CME, which can further lead to a sequence of multiple or longer duration peaks of compositional signatures than those in an isolated ICME.
In the case of isolated CMEs, the well-known composition signatures are the enhanced alpha to proton ratio, and elevated Fe/O, C+6/C+5, and O+7/O+6 ratios (Henke et al., 2001; Lepri et al., 2001; Zurbuchen et al., 2003; Kilpua et al., 2017). Furthermore, in interacting CMEs, it is expected that the charge state of elements will show enhancement with several peaks in between. These peaks may be associated with the arrival of distinct CMEs or different solar wind structures arising due to participating CMEs in the interaction. The interacted CME structures are generally marked by signatures of complex ejecta (Burlaga et al., 2002), which are enhanced for a duration of more than 2 days (Rodkin et al., 2018), implying that composition signatures of interacting CMEs can last longer than those of isolated CMEs (Temmer et al., 2017). Furthermore, the ion composition of ICMEs are generally associated with the solar source regions of CMEs and are frozen-in; therefore, they are expected to remain unaltered during their heliospheric propagation. The ion charge state and mass composition of solar wind plasma can, therefore, be used to identify various components of ICMEs and their source regions (Fisk et al., 1998; Zhao et al., 2009; 2014; Kilpua et al., 2014; Rodkin et al., 2017). As mentioned previously, the important composition parameters, i.e., C+6/C+5, O+7/O+6, alpha to proton density ratio (Nα/Np), and average ion charge state
As per the present understanding, the ion charge state of the solar wind at the L1 point corresponds to its coronal state at a height where it is frozen-in and is normally valid from distances between 1.5 and 4 R⊙ depending upon the type of ion and also the level of activity (Feldman et al., 2005). The ion composition of CME plasma and its evolution largely depend upon the temperature, density, mass, and velocity. The typical composition parameters of ICMEs, as reported by Zurbuchen and Richardson (2006) and Rodkin et al. (2017), are as follows: proton speed
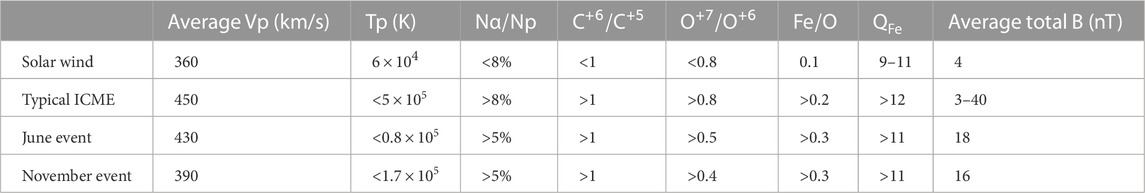
TABLE 1. Composition signatures of normal solar wind, isolated ICMEs, and the June and November 2012 events.
Owing to the interaction of two CMEs or the passage of an IP shock of the following CME through the ejecta of the preceding CME, a compression of the CME is expected. In particular, the propagation of a shock inside magnetic ejecta can lead to compression, resulting in the enhancement of the southward interplanetary magnetic field component along with elevated values of the dynamic pressure. This can further result in intense geomagnetic storms and also trigger substorms. Therefore, it is of interest to investigate whether observations suggest that the interaction of CMEs leads to compression. A previous study by Elliott et al. (2005) on compression and rarefaction of solar wind/CME structures suggested that any compression leads to heating of the plasma. This occurs as the fast solar wind stream overtakes the slow solar wind stream and is accompanied by an increase in the solar wind speed. In rarefaction, cooling occurs and proton speed decreases when the fast solar wind stream surpasses the slow solar wind stream. Elliott et al. (2005) fit the proton temperature and velocity (Tp − −V) curves separately for compression and rarefaction and found that the expected temperature is given by Texp = 640V − 1.56 × 10⁵ (for compression) and Texp = 459V − 1.18 × 10⁵ (for rarefaction).
In this paper, we examine the time profiles of the ion charge composition of two interacting CME events observed in the year 2012. We attempt to identify the sources of the ICMEs and the corresponding composition signatures at L1, with structures corresponding to their sources on the solar surface. We also examine the signatures of compression and rarefaction of ICMEs estimated from the expected temperature and compare them with the proton velocity observations recorded by in situ instruments.
2 Observations
In the present study, we have analyzed the composition parameters of two events of the CME–CME interaction observed in the same year, 2012, one during June 2012 and the other during November 2012.
For the analysis, we obtained 1-h data on the alpha to proton ratio and 2-h data on charge state ratios and elemental abundance ratios collected by the Solar Wind Ion Composition Spectrometer (SWICS) (Gloeckler et al., 1998) onboard the Advanced Composition Explorer (ACE) (Stone et al., 1998). Additionally, we used 1 min averaged solar wind plasma and magnetic field data and hourly averaged latitude (θ) and longitude (ϕ) values of the interplanetary magnetic field from the OMNI database (https://cdaweb.gsfc.nasa.gov).
We mark the time of arrival of shock and the start and end time of the ICMEs based on the Richardson–Cane (RC) catalog (Richardson and Cane, 2004; Richardson and Cane, 2010) for the two events. It is important to mention that in the RC catalog (https://izw1.caltech.edu/ACE/ASC/DATA/level3/icmetable2.htm), the ICME timings are based primarily on plasma and magnetic field signatures (Cane and Richardson, 2003).
3 Data analysis
As mentioned in the previous section, for the present study, we selected two cases of interacting CMEs, which showed distinct signatures in in situ observations of plasma and magnetic parameters at L1, as identified from the RC catalog. The first CME–CME interaction event was observed during 13–14 June 2012 which resulted in a merged structure and has been reported in detail by Srivastava et al. (2018). The second event of 9–10 November 2012 resulted in two distinct structures separated by an interaction region and has been discussed in depth by Mishra et al. (2015a). In what follows, we discuss the composition parameters and their evolution with time for the two events separately.
3.1 Interacting CMEs of 13–14 June 2012
As reported by Srivastava et al. (2018), two CMEs were launched from the same active region NOAA 11504 on 13 and 14 June 2012, separated by approximately 24 h. These CMEs, which were launched with average 3D speeds of 560 km·s−1 and 900 km·s−1, respectively, were observed to interact at a distance of 100 R⊙ from the Sun. The interaction resulted in a geomagnetic storm of moderate intensity (Dst ∼ − 86 nT). The interaction phase and the interplanetary signatures of interaction have been discussed by Srivastava et al. (2018) and also by Kilpua et al. (2019). From the examination of in situ plasma and the magnetic parameters of these interacting CMEs, it was found that it led to the strongest sudden storm commencement (SSC) (
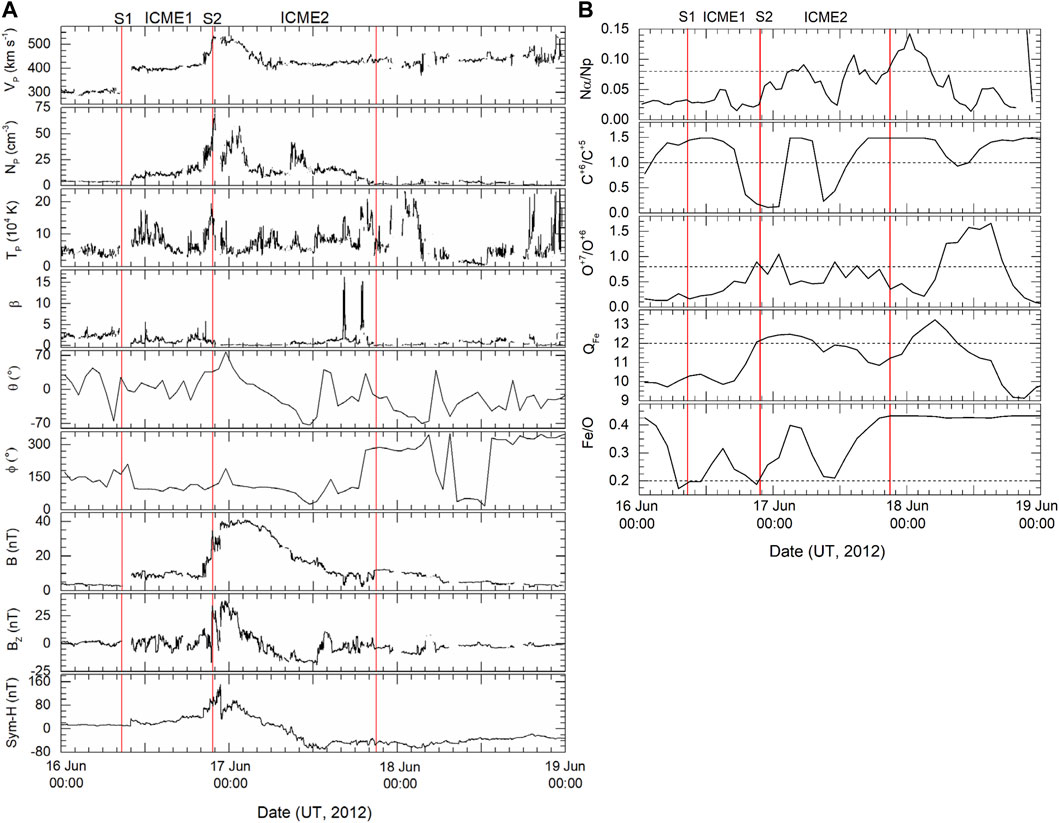
FIGURE 1. (A) Plasma and magnetic parameters observed in situ by the ACE spacecraft for the interacting CMEs of 13–14 June 2012. From the left, the first, second, and third vertical red lines mark the arrival of shock (S1) associated with CME1, shock (S2) associated with CME2, and the trailing boundary of ICME2, respectively. (B) Composition parameters recorded by the ACE spacecraft, marking the arrival of ICMEs associated with the interacting CMEs of the 13–14 June 2012 event. Here, again from the left, the first, second, and third vertical red lines mark the arrival of shock (S1) associated with CME1, shock (S2) associated with CME2, and the trailing boundary of ICME2, respectively, as identified by plasma signatures in (A). The threshold values for the compositional signatures are marked as horizontal dash lines.

TABLE 2. CME and associated flare characteristics for the 13–14 June 2012 event.
We plotted the plasma and magnetic parameters of the interacting ICMEs of June as observed by ACE and WIND (Figure 1A). The ICME arrival is marked by the arrival of the interplanetary shock S1 at 08:42 UT on June 16, followed by the first ICME (ICME1), which is marked by the boundaries between 08:42 UT and 21:40 UT. After the passage of the first CME, the second shock S2 associated with the second CME is observed at 21:40 UT on June 16. Finally, the second ICME (ICME2) arrived, which is marked by the boundaries between 21:40 UT on June 16 and 21:00 UT on June 17. The ICME2 structure marks the presence of a long duration magnetic cloud (MC) of approximately 14 h duration during 22:12 UT on June 16–12:31 UT on June 17. During this period, the plasma β value remained less than 1, the total magnetic field B remained higher than 10 nT, and the magnetic field angle θ rotated from +70° to −70°, fulfilling the criteria of a MC as defined by Burlaga et al. (1981).
3.1.1 Composition signatures
The ICMEs and associated shocks observed at the L1 point by the ACE and WIND spacecraft, corresponding to the June event, are tabulated in Table 3. Among other parameters, the profiles of composition parameters like average values of QFe and the O+7/O+6 ratio during the passage of ICMEs, as measured at L1, were plotted. The O+7/O+6 parameter is temperature dependent, and the Fe/O parameter is known to be magnetic structure dependent (Rodkin et al., 2018). Since the solar wind ion charge states “freeze-in” within a few solar radii from the Sun, ICMEs show an increased abundance of high-charge states. For example, the O+7/O+6 ratio is greater than 1.0 in the majority of the ICMEs (Henke et al., 2001), and it serves as a good signature of the hot plasma (increased electron temperature) in the structure of MCs. On the other hand, the elemental ratios depend on chromospheric temperatures, the magnetic field configuration at the origin of the plasma, and the plasma confinement time before the release [e.g., Laming (2015), and references therein]. In ICMEs, increased amounts of high-charge states of elements, such as Fe, Ne, Si, and Mg, are often observed, suggesting extended confinement times [e.g., Lepri et al. (2001); Zurbuchen et al. (2016)]. We note the maximum values of the aforementioned parameters and also the average values during the passage of interacting ICMEs through the L1 point. It is to be noted that the plasma and magnetic properties of the ICME have values higher than those of the normal solar wind and lie in the range of a typical ICME, as defined by Rodkin et al. (2017) (Table 1).
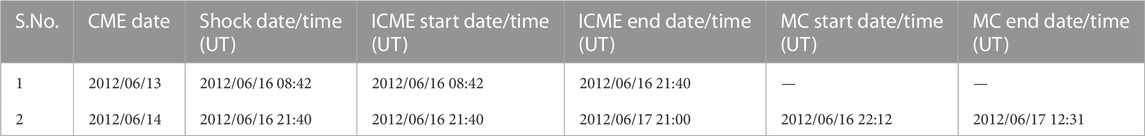
TABLE 3. IP shocks and ICMEs associated with the 13–14 June 2012 CMEs.
In the case of the interacting CMEs of June 2012, on the basis of the composition parameters, we note that ICME1 has Nα/Np > 0.6, C+6/C+5 > 1.5, and O+7/O+6 > 0.6 (only in the trailing edge). The Fe/O ratio is
ICME1 is followed by the passage of the second shock and then an MC, wherein the O+7/O+6 values varied between 1.0 and 0.2, Fe/O varied from 0.2 to 0.4, and QFe from 12 to 10. C+6/C+5 increased from 0 to 1.5 and finally decreased to 0. The Nα/Np ratio showed a gradual increase from the leading to the trailing edge of the MC and also marked the enhancement with two peaks. These values of compositional parameters are in good agreement with those reported for fast MCs (Gopalswamy et al., 2013). Such fast MCs (mean 934 km·s−1) have been reported with the O+7/O+6 value exceeding 0.6 and QFe > 11 (Table 4).
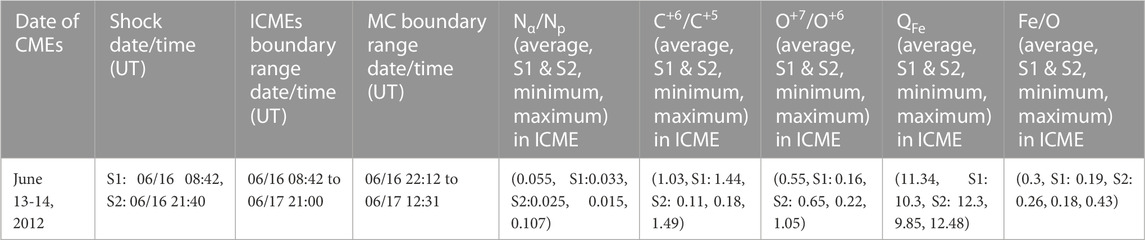
TABLE 4. Compositional parameters of June 2012 ICMEs.
3.1.2 Duration of ICMEs based on composition signatures
As mentioned in Section 3.1, conventionally, the ICME boundaries are defined based on the plasma and magnetic signatures of ICMEs (Cane and Richardson, 2003). However, some authors also take composition signatures into consideration to mark the ICME boundaries (Lepping et al., 1997; Lepri et al., 2001; Huttunen et al., 2005; Richardson and Cane, 2010).
We have compared the ICME boundaries of these interacting CMEs derived from plasma and magnetic parameters with those derived from the composition parameters. For this purpose, we identify the boundaries within which QFe and the O+7/O+6 ratio remain above the threshold values. Normally, these values are expected to drop to their normal or threshold values after the passage of the ICMEs. However, in a few cases, the composition parameters do not show the expected decrease. As per the aforementioned criteria, we marked the end of the ICME boundary at 14:00 h on June 18, which suggests that the duration of the ICME is extended by approximately 17 h compared to that defined by the plasma parameters.
The ICME duration as obtained from the plasma and magnetic field parameters, i.e., from June 16, 9:00 UT to June 17, 21:00 UT, is approximately 36 h, which is close to the mean values of a normal ICME duration (Dasso et al., 2009; Lugaz et al., 2013; Lugaz and Farrugia, 2014; Lugaz et al., 2015). However, if we include the charge state signatures, the duration of the June event is estimated to be approximately 53 h. This increased duration in charge state enhancement has also been reported previously for isolated ICMEs (Lepri et al., 2001; Richardson and Cane, 2004; Zurbuchen and Richardson, 2006; Gopalswamy et al., 2013; Owens, 2018).
Furthermore, we also found that out of the total ICME duration, the charge state enhancement is observed only for a short period and not continuously throughout the ICME. The times for the enhancement of different parameters, i.e., Nα/Np, QFe, O+7/O+6, C+6/O+5, and Fe/O are reported for
3.1.3 Associated flares and ICME composition
The associated flares with the interacting CMEs in the June event are M-class flares, i.e., M1.2 and M1.9 class, respectively. As mentioned previously, the two flares originated in the same active region NOAA AR 11504, located at around S16E18 on 13 June 2012. It is expected that heating during the early rise phase of CMEs will create very high ionic charge states. The charge state values reached may depend on the amount of energy available through reconnection and related processes and also on the amount of energy available for the associated flare. Furthermore, the heating and associated acceleration of the CME can drag the heavier elements from the lower corona and carry further out. It was suggested that the physical mechanisms causing heavier elements in the ICME flux ropes and those leading to higher ionization states of elements in ICMEs are related (Reinard, 2008), although it may have some spatial dependence, i.e., different plasma parcels may get affected differently by these mechanisms during the eruption. Reinard (2005) reported that all CMEs show a slight-to-moderate correlation between the charge states and the associated flare magnitude or class. They noticed that O+7/O+6 and QFe are better correlated when the in situ spacecraft is likely to cross the center of the CME ejecta (i.e., between E30 and W45). Furthermore, they conclude that the charge states in these “central events” display a moderate correlation with flare magnitude, indicating that enhanced charge states in the solar wind are the result of flare-related heating in the corona. For June 2012 ICMEs, the values of O+7/O+6, QFe, and Nα/Np are enhanced with peak values of
3.1.4 Relationship between the expected and observed proton temperatures with proton velocity
Using Elliott et al.’s (2005) formulae mentioned in Section 1, we calculated the expected proton temperature values for compression and rarefaction for preceding and following ICMEs separately for the June event. The empirical formulae by Elliott et al. (2005) are based on ACE data for the estimation of the expected solar wind proton temperature. These formulae should hold good for data obtained by any spacecraft located at the L1 point. Furthermore, it is to be noted that minor variations are expected in the formulae derived from observations by different spacecraft located close to L1, e.g., WIND, ACE, STA, and STB, primarily due to the different heliocentric distances of the probes (Yu et al., 2016). However, as the empirical relationship is derived from a statistical study over a certain period of the solar cycle, we expect the overall trend (within error bars) to remain the same for the selected ICMEs in our study. Figure 2 shows the variation of the observed proton velocity Vp (lower panel), proton temperature Tp (black curve), and overplotted expected temperatures for compression and rarefaction (red and blue curves) in the upper panel.
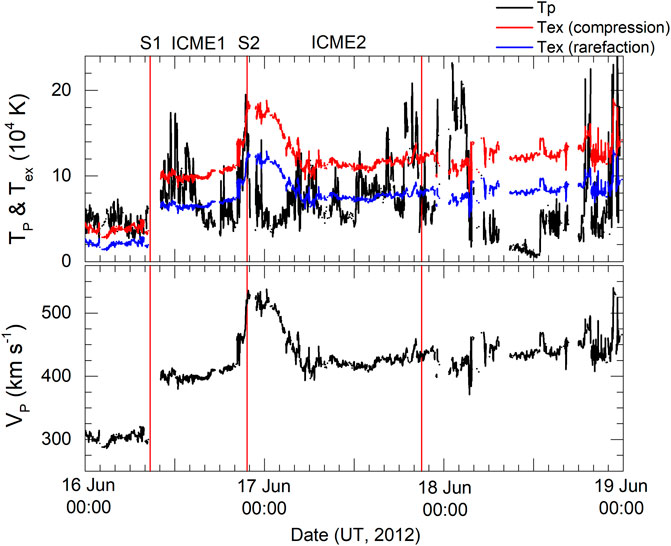
FIGURE 2. Variation of the proton velocity, proton temperature, and overplotted expected temperature of compression and rarefaction for interacting CMEs of the 13–14 June 2012 event.
From a close inspection of the observed proton temperature and the expected temperature plots for the June events in Figure 2, we examine whether the majority of the data points lie close to the compression or rarefaction profiles. Furthermore, we corroborate the same by comparing with the observed proton velocity data (lower panel). From Figure 2, we note that the expected temperature for ICME1 at the leading and trailing edge shows compression, while the central part shows rarefaction. However, the observed proton velocity is clearly close to compression during ICME1 and does not show any signatures of rarefaction at the central part. Based on the expected temperature profile for ICME2, the leading edge, trailing edge, and central part all show rarefaction. However, the observed proton velocity plot shows signatures of rarefaction in the leading edge only, and compression in the central and trailing part of ICME2.
This analysis clearly suggests the importance of comparing the expected temperature profile with that of the observed proton temperature and speed profile, particularly in the case of the CME–CME interaction.
3.2 Interacting CMEs of 9–10 November 2012
Another interaction event was recorded in the same phase of solar cycle 24 when two CMEs with similar 3D speeds 620 km·s−1 and 910 km·s−1 were launched within a 24-h period on 9 and 10 November 2012 from NOAA AR 11608. These CMEs propagated in the same direction and were observed to interact at a distance of 35 R⊙ from the Sun. The detailed study of this interaction event by Mishra et al. (2015a) showed that it led to a strong geomagnetic storm (Dst ∼ − 108 nT). In the following section, we describe the composition signatures of the interacting CMEs of 9 and 10 November 2012. The ICME and associated flare properties are listed in Table 5. ICMEs associated with the interacting CMEs and their times are tabulated in Table 6.
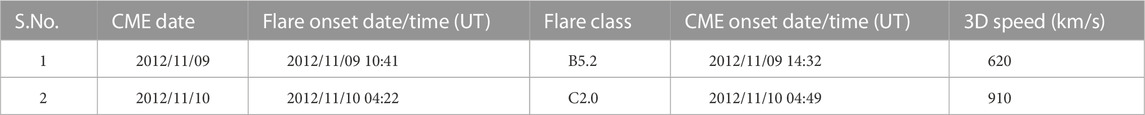
TABLE 5. CME and associated flare characteristics for the 9–10 November 2012 event.
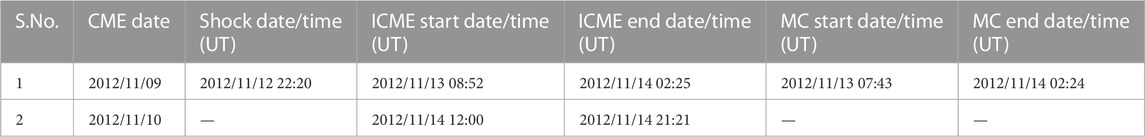
TABLE 6. IP shocks and ICMEs associated with the 9–10 November 2012 CMEs.
3.2.1 Composition signatures
From Figure 3, we note that the first ICME is an MC based on the criteria of Burlaga et al. (1981). Prior to the arrival of ICME, a long-duration sheath region was observed from 12 November 22:20 UT to 13 November 08:52 UT. An enhancement of the alpha to proton ratio was observed from ∼ 2% to 10% in the sheath region. The value of C+6/C+5 dropped from ∼ 1 to 0.3, O+7/O+6 ratio from ∼ 0.1 to 0.7, QFe increased from ∼ 10.5 to 12.8, and Fe/O ranged between ∼ 0.3 and 0.4 in the sheath region.
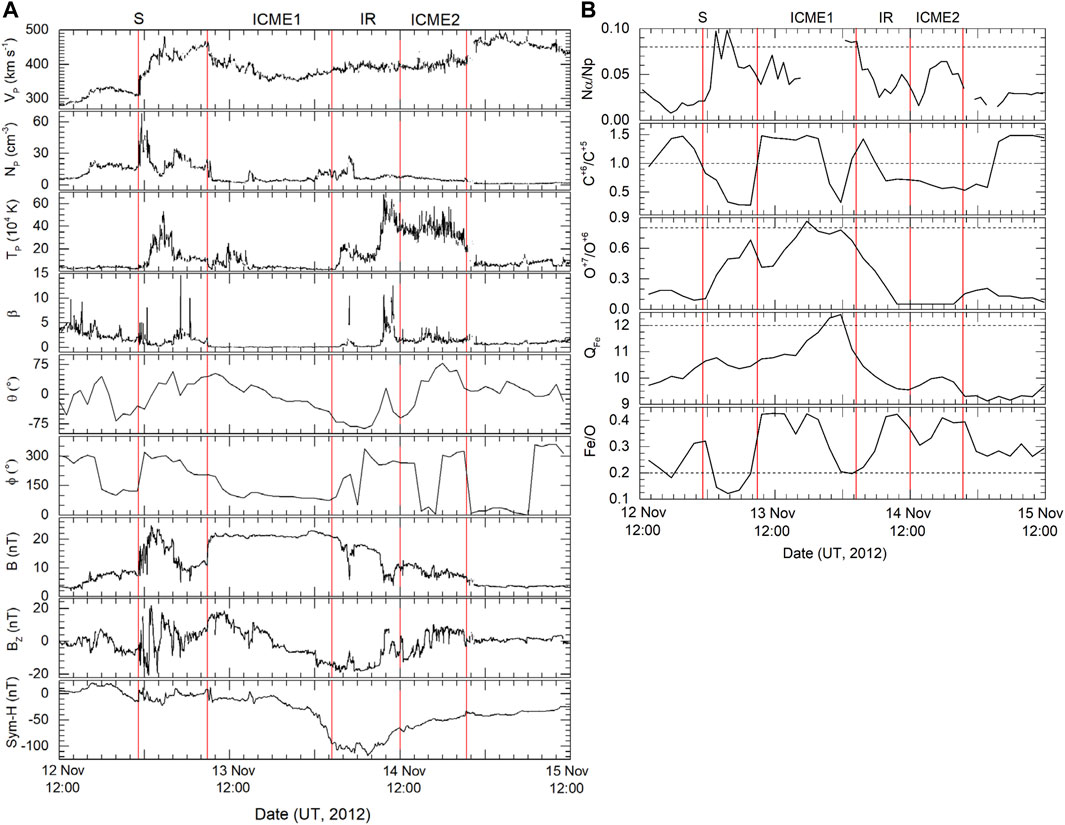
FIGURE 3. (A) Plasma and magnetic parameters observed in situ by the ACE spacecraft for the interacting CMEs of 9–10 November 2012. The vertical lines marked in red, from left to right, denote the arrival of the shock, ICME1 leading and trailing boundaries, ICME2 leading and trailing boundaries. Between the third and fourth vertical lines are marked by a small interaction region (IR) in between the two ICMEs. (B) Composition parameters marking the arrival of ICMEs associated with the interacting CMEs of November 2012. Here, again the vertical lines marked in red denote, from left to right, the arrival of shock, ICME1 leading and trailing boundaries, ICME2 leading and trailing boundaries, as identified by plasma signatures in (A). The IR region is between the third and fourth vertical lines. The threshold values for the compositional signatures are marked as horizontal dash lines.
The sheath region was followed by a long-duration MC from 13 November 08:52 UT to 14 November 02:25 UT. In the MC region, the O+7/O+6 ratio ranged between ∼ 0.4 and 0.9, which is enhanced compared to a normal ICME (
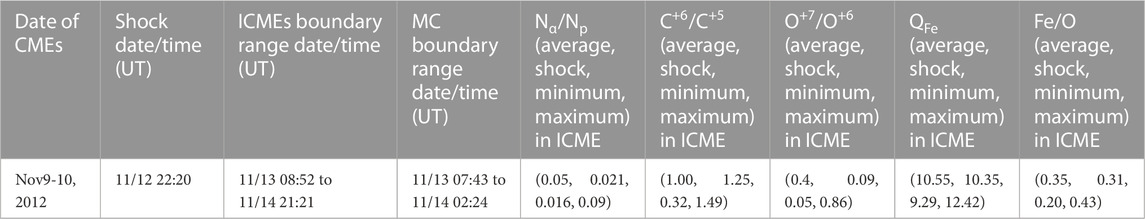
TABLE 7. Compositional parameters of November 2012 ICMEs.
3.2.2 Duration of ICMEs based on the composition signatures
According to the RC catalog, based on the plasma properties, the shock arrival is marked on 12 November at 23:11 UT. The ICME started at 08:00 UT on 13 November and ended on 14 November at 03:00 UT. In this case, the Fe/O ratio peaked twice, once in the MC and then in the interaction region and ICME2 to ∼0.4. A low value is reported in between, i.e., corresponding to the trailing edge of the MC. As the FIP bias depends on the magnetic field topology in the source region at the Sun, the behavior of the Fe/O parameter in this case suggests that the interacting CME events comprise plasma of different magnetic structures. It is interesting to note that other important composition parameters like the enhanced values of the O+7/O+6 ratio and QFe > 12 do not extend to the interaction region and ICME2. This is suggestive of the fact that although different magnetic structures are present in the ICME, the temperature is not high enough, as for typical ICMEs (Table 1).
On the basis of the composition parameters, we found that the ICME duration is extended by 15 h, i.e., up to 22:00 UT 14 November 2012. The identified ICME boundaries are in accordance with those reported by Mishra et al. (2015a). It is important to mention that the total duration of the ICME is ∼46 h if the composition signatures are considered.
Furthermore, as observed for the June event, in this case also, out of the total ICME duration, the charge state enhancement is observed only for a short period and not continuously throughout the ICME. The times for enhancement of the different parameters Nα/Np, QFe, O+7/O+6, C+6/C+5, and Fe/O are reported for ∼34%, ∼26%, ∼22%, ∼32%, and ∼30% of the total duration of the ICME in the present case, respectively. This result reconfirms that interacting CMEs do not comprise uniformly distributed hot plasma components, as was found for the June event.
3.2.3 Associated flares and ICME composition
The associated flares with the interacting CMEs in the November event are of the B5.2 and C2.0 flare classes. As mentioned previously, the two flares originated in the same active region NOAA AR 11608, located at around S21 W04 on 10 November 2012. For November 2012 ICMEs, the values of O+7/O+6, QFe, and Nα/Np seem to be enhanced (right panel of Figure 3B). The average values of O+7/O+6, QFe, and Nα/Np are ∼0.4, ∼10.55, and ∼0.05, respectively. These values are much lower than the range of the values of the composition signatures listed for C-class flares [Table 3 in Reinard (2008)]. This may be because CME1 is associated with a B-class flare. However, the maximum values of the aforementioned parameters are ∼0.86, ∼12.42, and ∼0.09, respectively, which are indicative of the presence of ICME hot plasma.
The stronger a flare is, the hotter the flare plasma is expected to be, which is directly related to the enhancements in the ionic composition signatures of the ICMEs. To the best of our knowledge, no study showing that flare intensity dictates the duration of the compositional signatures has been reported previously. However, we expect that the duration of the compositional signatures will strongly depend on the relative position of the intercepting in situ spacecraft with respect to the central core of the ICME/flux rope. This is because the enhanced ionic and elemental composition associated with the CME flux rope system can drag additional material along with it, including the overlying plasma that are magnetically connected, creating an envelope of material that indirectly and only partially participates in the eruption. Therefore, an in situ spacecraft intercepting the central part of the flux rope system can observe enhanced elemental and ionic compositional signatures of ICMEs.
3.2.4 Relationship between the expected and observed proton temperatures with proton velocity
Similar to the June event, we calculated the expected temperature Texp for compression and rarefaction for preceding and following ICMEs of the November event (Figure 4). We note that during ICME1, the expected temperature at the leading edge suggests compression, although the central part and trailing edge clearly suggest rarefaction. On the contrary, the observed proton velocity data show rarefaction during the leading edge of ICME1 and are moderately compressed in the trailing part. This implies inconsistency in the inferred heating from the expected temperature and observed proton velocity profile. However, during the interaction region and ICME2, both the expected temperature and proton velocity are suggestive of high compression.
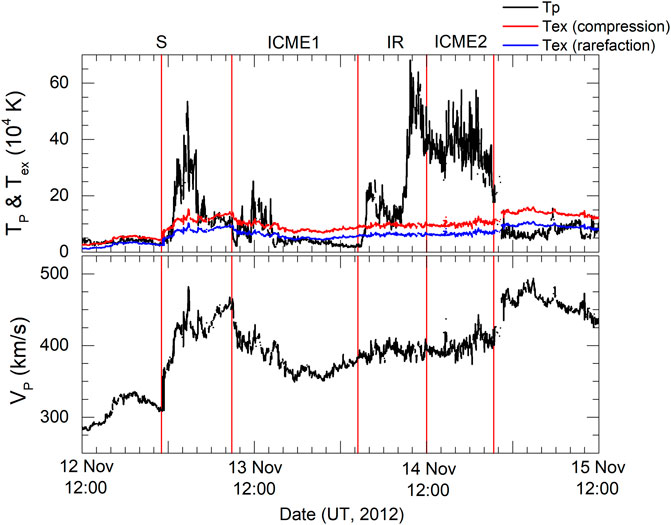
FIGURE 4. Variation of the proton velocity, proton temperature, and overplotted expected temperature of compression and rarefaction for interacting CMEs of the 9–10 November 2012 event.
4 Results and discussion
The two interacting CME events of June and November 2012 occurred in the rising phase of solar cycle 24. These two events manifested different structures at 1 AU in in situ data after the interaction of the associated CMEs. The composition and compression signatures of the two interacting events were examined.
4.1 Composition signatures of the interacting events
Our analysis shows that the boundaries for the two interacting ICME events defined by plasma and magnetic parameters differ from those defined by composition parameters. The durations of the two events of interacting CMEs are 53 h (2.2 days) and 48 h (2.0), respectively, as found on the basis of the enhancement of ion composition parameters, which is comparable to 2.4 days, as found for multiple source events by Rodkin et al. (2018), and almost twice the duration that was found for single isolated events (Temmer et al., 2017). The duration of charge state enhancement is much longer and extended by several hours in the June 2012 case, in which two distinct ICME structures arrive as a result of the CME–CME interaction. However, the November 2012 event does not show such a long enhancement in the composition signatures. This may be attributed to the association of different classes of flares in the two events. In the June 2012 case, both the flares were M-class flares, wherein the charge state enhancement was observed. In the second case of the November 2012 events, the charge state enhancement is not significant as the associated flares are only B- and C-class flares. Accordingly, the Fe charge state enhancement is less in the November event than that in the June events. This is further attributed to the fact that the Fe charge state is strongly related to flare class and temperature (Reinard, 2008).
The analysis also reveals that the duration of the charge state enhancement above the threshold values is considerably smaller than the total ICME duration derived from the solar wind plasma and magnetic parameters and ranges between ∼30% and 35%, suggesting that the charge state enhancement is not uniform throughout the complex structures of the interacting CMEs that arrive at the Earth.
The maximum and average values of QFe and O+7/O+6 for the two interacting CME events are representative of the values for isolated ICMEs observed in SC24 and are lower than those observed in SC23 (Gopalswamy et al., 2013). Furthermore, the interacting CMEs are released from the Sun in succession at an interval of 24 h, and usually, the interaction of two distinct CMEs is expected to occur farther out in the corona, where the chances of the two CME plasmas mixing are remote and one would, therefore, presume that the two participating CMEs would retain the composition signatures of the associated flares. This is why charge state values of the corresponding CMEs are in agreement with the associated source flare and in agreement with the values of the single isolated event in SC24.
In the two events reported in this paper, both the events involved one fast (
4.2 Signatures of compression/rarefaction in interacting events
June events: As discussed in the previous section, based on the expected temperature data, we find that ICME1 leading and trailing edges show signatures of compression in the June event. However, the central part of ICME1 appears to be rarefied as the observed temperature is lower than the expected temperature. We further note that the duration of ICME1 is approximately 12 h, out of which for approximately 8 h, the ICME is compressed. For 4 h only, we observe signatures of rarefaction in the temperature data. For the entire ICME1, the observed constant value of the proton velocity data reveals that the CME is significantly compressed.
As it is difficult to identify the signatures of compression or rarefaction in the mid region of ICME1 based on the proton velocity data alone, this essentially highlights the importance of the comparison of solar wind proton velocity data with the expected temperature data, in particular to understand the ICME–ICME interaction processes.
Furthermore, the expected proton temperature profile reveals that ICME2 underwent rarefaction. However, the observed proton velocity plot shows rarefaction in the leading part, and the trailing part is moderately compressed as it remains constant.
November events: In this particular case, the expected proton temperature profile suggests moderate compression in the leading part of ICME1. On the other hand, the trailing part of ICME1 showed clear signatures of over-rarefaction. The proton velocity signified rarefaction during the leading part, as is also evident by a decrease of proton speed, suggesting the expansion of ICME1 (Figure 4) and moderate compression in the trailing part.
Furthermore, ICME2 showed overcompression, which is suggested by a constant solar wind velocity. Overcompression is also observed in the interaction region between the two ICMEs marked by a constant solar wind speed profile. It is important to note here that the preceding CME, despite being hit by the following CME, has not undergone compression. However, the following ICME2 shows significant compression in both the expected temperature and proton velocity data. Such signatures of heating may be attributed to a probable flank encounter of the following ICME2 with the in situ spacecraft, as also reported by Mishra et al. (2015a) for the same event.
A comparison of June and November interacting CME events shows that ICME1 shows a signature of compression and ICME2 shows clear rarefaction in the June event. However, in the November case, ICME1 shows a signature of rarefaction, but during the interacting region and ICME2, clear signatures of compression are noted. The analysis of observations also suggests that if the following CME is not driving a strong shock, it is unlikely that the preceding CME will get compressed. Basically, our study supports the idea that compression can occur due to the passage of the shock associated with the following CME through the preceding CME and not the CME–CME interaction.
5 Conclusion
Among other parameters of solar transients or ICMEs, the ion charge composition of the plasma is one of the crucial identifiers of their source regions for isolated CMEs. In this study, we investigate the ion charge state evolution of the ICME plasma by considering the ratios of alpha to proton, carbon, C+6/O+5, and oxygen, O+7/O+6, Fe/O, and the average charge of iron ions, QFe, which were measured in situ with ACE. Although the ion charge states of interacting CMEs are not expected to be altered by the interaction process, the ion composition profiles in interacting events, at 1 AU, are difficult to interpret and depend on the parameters of the participating CMEs, their temporal boundaries, the mutual orientation of their magnetic fields, the presence of shocks, and sheath regions.
Our present study on interacting CMEs of June and November 2012 and their ion charge state and mass composition of the solar wind plasma helps us to separate their different components and their source (Fisk et al., 1998; Zhao et al., 2009; 2014; Wang, 2012; Kilpua et al., 2014).
The main conclusions of the present study are as follows:
1. The two reported events of 12–13 June 2012 and 9–10 November 2012, were accompanied by M-class flares or below. The associated CMEs also had moderately high speeds ranging from 560 to 900 km·s−1. Both CMEs were associated with MCs that displayed strong composition signatures.
2. In the CME–CME interaction events, the ion composition profiles can have several peaks corresponding to the plasma temperatures in the individual solar sources/flares of associated ICMEs. In the interacting CMEs reported here, the ion composition profiles displayed several maxima, suggesting the inhomogenous nature of plasma due to the participating CMEs. As in this case, CME plasma mixing is generally not expected and the peak values of O+7/O+6 and QFe correspond to the plasma temperatures in the individual solar sources of these CMEs.
3. The duration of interacting CMEs is found to be twice as long, as found for the individual CMEs, if the boundaries are identified, based on the composition parameters.
4. It is also concluded that the duration of the charge state-enhanced plasma in the interacting CME events is shorter and that they are observed for approximately 35% or less of the entire duration of the ICME, implying the passage of different magnetic structures with plasma at different temperatures.
5. The study reconfirms the finding of previous studies (Lugaz et al., 2005; Liu et al., 2012; Mishra et al., 2015b; Lugaz et al., 2016; Srivastava et al., 2018), which showed that compression can occur due to the passage of the shock associated with the following CME through the preceding CME and not the CME–CME interaction processes.
6. The results also highlight the importance of the comparison of solar wind proton velocity data with the expected temperature data, in particular to understand the ICME–ICME interaction processes.
Our study emphasizes the importance of examining the compositional signatures of interacting CMEs, which helps in distinguishing the portions of individual parts of the interacting ICMEs and thus the interaction process. The present study is limited because of the lack of composition observations of the ICMEs before the interaction phase. The composition observations of the interacting ICMEs from the multi-spacecraft at different heliocentric distances, in particular before and after the interaction, will be useful in understanding the plasma processes involved in altering the composition.
Data availability statement
The original contributions presented in the study are included in the article/Supplementary Material. Further inquiries can be directed to the corresponding author.
Author contributions
NS and WM contributed to the initial conception of the paper. The analysis was carried out primarily by ZM under the guidance of NS. The main draft was prepared by NS, WM, and ZM. All of the authors have read the paper and approved its final version.
Funding
This work and the authors are supported by the India–Uzbekistan joint projects INT-UZBEK/P-15 and UZB-IND-2021-95. The major part of the work was carried out during the visit of ZM to Udaipur Solar Observatory, Udaipur, in May 2022. The visit was funded by the project grant.
Acknowledgments
The authors would like to acknowledge the use of the Richardson–Cane catalog of ICMEs and CDA Web for providing the in situ observations of solar wind at 1 AU for the selected ICMEs. The authors also thank the referees for their helpful comments.
Conflict of interest
The authors declare that the research was conducted in the absence of any commercial or financial relationships that could be construed as a potential conflict of interest.
Publisher’s note
All claims expressed in this article are solely those of the authors and do not necessarily represent those of their affiliated organizations, or those of the publisher, the editors, and the reviewers. Any product that may be evaluated in this article, or claim that may be made by its manufacturer, is not guaranteed or endorsed by the publisher.
References
Burlaga, L. F., Plunkett, S. P., and Cyr, St.O. C. (2002). Successive CMEs and complex ejecta. J. Geophys. Res. Space Phys.107, 1266. doi:10.1029/2001JA000255
Burlaga, L., Sittler, E., Mariani, F., and Schwenn, R. (1981). Magnetic loop behind an interplanetary shock: Voyager, Helios, and IMP 8 observations. J. Geophys. Res. Space Phys.86, 6673–6684. doi:10.1029/JA086iA08p06673
Cane, H. V., and Richardson, I. G. (2003). Interplanetary coronal mass ejections in the near-Earth solar wind during 1996-2002. J. Geophys. Res. Space Phys.108, 1156. doi:10.1029/2002JA009817
Chertok, I. M., Grechnev, V. V., Hudson, H. S., and Nitta, N. V. (2004). Homologous large-scale activity in solar eruptive events of 24-26 November 2000. J. Geophys. Res. Space Phys.109, A02112. doi:10.1029/2003JA010182
Dasso, S., Mandrini, C. H., Schmieder, B., Cremades, H., Cid, C., Cerrato, Y., et al. (2009). Linking two consecutive nonmerging magnetic clouds with their solar sources. J. Geophys. Res. Space Phys.114, A02109. doi:10.1029/2008JA013102
Elliott, H. A., McComas, D. J., Schwadron, N. A., Gosling, J. T., Skoug, R. M., Gloeckler, G., et al. (2005). An improved expected temperature formula for identifying interplanetary coronal mass ejections. J. Geophys. Res. Space Phys.110, A04103. doi:10.1029/2004JA010794
Farrugia, C., and Berdichevsky, D. (2004). Evolutionary signatures in complex ejecta and their driven shocks. Ann. Geophys.22, 3679–3698. doi:10.5194/angeo-22-3679-2004
Farrugia, C. J., Jordanova, V. K., Thomsen, M. F., Lu, G., Cowley, S. W. H., and Ogilvie, K. W. (2006). A two-ejecta event associated with a two-step geomagnetic storm. J. Geophys. Res. Space Phys.111, A11104. doi:10.1029/2006JA011893
Feldman, U., Landi, E., and Schwadron, N. A. (2005). On the sources of fast and slow solar wind. J. Geophys. Res. Space Phys.110, A07109. doi:10.1029/2004JA010918
Fisk, L. A., Schwadron, N. A., and Zurbuchen, T. H. (1998). On the slow solar wind. Space Sci. Rev.86, 51–60. doi:10.1023/A:1005015527146
Gloeckler, G., Cain, J., Ipavich, F. M., Tums, E. O., Bedini, P., Fisk, L. A., et al. (1998). Investigation of the composition of solar and interstellar matter using solar wind and pickup ion measurements with SWICS and SWIMS on the ACE spacecraft. Space Sci. Rev.86, 497–539. doi:10.1023/A:1005036131689
Gopalswamy, N., Mäkelä, P., Akiyama, S., Xie, H., Yashiro, S., and Reinard, A. A. (2013). The solar connection of enhanced heavy ion charge states in the interplanetary medium: Implications for the flux-rope structure of CMEs. Sol. Phys.284, 17–46. doi:10.1007/s11207-012-0215-2
Gopalswamy, N., Mikić, Z., Maia, D., Alexander, D., Cremades, H., Kaufmann, P., et al. (2006). The pre-CME sun. Space Sci. Rev.123, 303–339. doi:10.1007/s11214-006-9020-2
Gopalswamy, N. (2006). Properties of interplanetary coronal mass ejections. Space Sci. Rev.124, 145–168. doi:10.1007/s11214-006-9102-1
Gopalswamy, N., Xie, H., Yashiro, S., and Usoskin, I. (2005). “Coronal mass ejections and ground level enhancements,” in 29th international cosmic ray conference (ICRC29). Editors B. S. Acharya, S. Gupta, P. Jagadeesan, J. Jain, S. Karthikeyan, S. Morriset al. (Tata Institute of Fundamental Research), 169–172.
Gruesbeck, J. R., Lepri, S. T., Zurbuchen, T. H., and Antiochos, S. K. (2011). Constraints on coronal mass ejection evolution from in situ observations of ionic charge states. Astrophysical J.730, 103. doi:10.1088/0004-637X/730/2/103
Gruesbeck, J. R., Lepri, S. T., and Zurbuchen, T. H. (2012). Two-plasma model for low charge state interplanetary coronal mass ejection observations. Astrophysical J.760, 141. doi:10.1088/0004-637X/760/2/141
Henke, T., Woch, J., Schwenn, R., Mall, U., Gloeckler, G., von Steiger, R., et al. (2001). Ionization state and magnetic topology of coronal mass ejections. J. Geophys. Res. Space Phys.106, 10597–10613. doi:10.1029/2000JA900176
Huang, J., Liu, Y. C. M., Peng, J., Qi, Z., Li, H., Klecker, B., et al. (2018). The distributions of iron average charge states in small flux ropes in interplanetary space: Clues to their twisted structures. J. Geophys. Res. Space Phys.123, 7167–7180. doi:10.1029/2018JA025660
Hundhausen, A. J., Gilbert, H. E., and Bame, S. J. (1968). The state of ionization of oxygen in the solar wind. Astrophysical J.152, L3. doi:10.1086/180165
Huttunen, K. E. J., Schwenn, R., Bothmer, V., and Koskinen, H. E. J. (2005). Properties and geoeffectiveness of magnetic clouds in the rising, maximum and early declining phases of solar cycle 23. Ann. Geophys.23, 625–641. doi:10.5194/angeo-23-625-2005
Kienreich, I. W., Veronig, A. M., Muhr, N., Temmer, M., Vršnak, B., and Nitta, N. (2011). Case study of four homologous large-scale coronal waves observed on 2010 april 28 and 29. Astrophysical J. Lett.727, L43. doi:10.1088/2041-8205/727/2/L43
Kilpua, E. K. J., Good, S. W., Palmerio, E., Asvestari, E., Lumme, E., Ala-Lahti, M., et al. (2019). Multipoint observations of the June 2012 interacting interplanetary flux ropes. Front. Astronomy Space Sci.6, 50. doi:10.3389/fspas.2019.00050
Kilpua, E. K. J., Mierla, M., Zhukov, A. N., Rodriguez, L., Vourlidas, A., and Wood, B. (2014). Solar sources of interplanetary coronal mass ejections during the solar cycle 23/24 minimum. Sol. Phys.289, 3773–3797. doi:10.1007/s11207-014-0552-4
Kilpua, E., Koskinen, H. E. J., and Pulkkinen, T. I. (2017). Coronal mass ejections and their sheath regions in interplanetary space. Living Rev. Sol. Phys.14, 5. doi:10.1007/s41116-017-0009-6
Laming, J. M. (2015). The FIP and inverse FIP effects in solar and stellar coronae. Living Rev. Sol. Phys.12, 2. doi:10.1007/lrsp-2015-2
Lepping, R. P., Burlaga, L. F., Szabo, A., Ogilvie, K. W., Mish, W. H., Vassiliadis, D., et al. (1997). The Wind magnetic cloud and events of October 18-20, 1995: Interplanetary properties and as triggers for geomagnetic activity. J. Geophys. Res. Space Phys.102, 14049–14063. doi:10.1029/97JA00272
Lepri, S. T., Zurbuchen, T. H., Fisk, L. A., Richardson, I. G., Cane, H. V., and Gloeckler, G. (2001). Iron charge distribution as an identifier of interplanetary coronal mass ejections. J. Geophys. Res. Space Phys.106, 29231–29238. doi:10.1029/2001JA000014
Li, T., and Zhang, J. (2013). Homologous flux ropes observed by the solar dynamics observatory atmospheric imaging assembly. Astrophysical J. Lett.778, L29. doi:10.1088/2041-8205/778/2/L29
Liu, Y. D., Luhmann, J. G., Möstl, C., Martinez-Oliveros, J. C., Bale, S. D., Lin, R. P., et al. (2012). Interactions between coronal mass ejections viewed in coordinated imaging and in situ observations. Astrophysical J. Lett.746, L15. doi:10.1088/2041-8205/746/2/L15
Lugaz, N., and Farrugia, C. J. (2014). A new class of complex ejecta resulting from the interaction of two CMEs and its expected geoeffectiveness. Geophys. Res. Lett.41, 769–776. doi:10.1002/2013GL058789
Lugaz, N., Farrugia, C. J., Manchester, W., and Schwadron, N. (2013). The interaction of two coronal mass ejections: Influence of relative orientation. Astrophysical J.778, 20. doi:10.1088/0004-637X/778/1/20
Lugaz, N., Farrugia, C. J., Smith, C. W., and Paulson, K. (2015). Shocks inside CMEs: A survey of properties from 1997 to 2006. J. Geophys. Res. Space Phys.120, 2409–2427. doi:10.1002/2014JA020848
Lugaz, N., Farrugia, C. J., Winslow, R. M., Al-Haddad, N., Kilpua, E. K. J., and Riley, P. (2016). Factors affecting the geoeffectiveness of shocks and sheaths at 1 AU. J. Geophys. Res. Space Phys.121 (10), 10861–10879. doi:10.1002/2016JA023100
Lugaz, N., Manchester, W., and Gombosi, T. I. (2005). Numerical simulation of the interaction of two coronal mass ejections from sun to Earth. Astrophysical J.634, 651–662. doi:10.1086/491782
Lugaz, N., Temmer, M., Wang, Y., and Farrugia, C. J. (2017). The interaction of successive coronal mass ejections: A review. Sol. Phys.292, 64. doi:10.1007/s11207-017-1091-6
Lynch, B. J., Reinard, A. A., Mulligan, T., Reeves, K. K., Rakowski, C. E., Allred, J. C., et al. (2011). Ionic composition structure of coronal mass ejections in axisymmetric magnetohydrodynamic models. Astrophysical J.740, 112. doi:10.1088/0004-637X/740/2/112
Manchester, W., Kilpua, E. K. J., Liu, Y. D., Lugaz, N., Riley, P., Török, T., et al. (2017). The physical processes of CME/ICME evolution. Space Sci. Rev.212, 1159–1219. doi:10.1007/s11214-017-0394-0
Mishra, W., Srivastava, N., and Chakrabarty, D. (2015a). Evolution and consequences of interacting CMEs of 9 - 10 november 2012 using STEREO/SECCHI and in situ observations. Sol. Phys.290, 527–552. doi:10.1007/s11207-014-0625-4
Mishra, W., and Srivastava, N. (2013). Estimating the arrival time of earth-directed coronal mass ejections at in situ spacecraft using COR and HI observations from STEREO. Astrophysical J.772, 70. doi:10.1088/0004-637X/772/1/70
Mishra, W., and Srivastava, N. (2014). Morphological and kinematic evolution of three interacting coronal mass ejections of 2011 february 13-15. Astrophysical J.794, 64. doi:10.1088/0004-637X/794/1/64
Mishra, W., Srivastava, N., and Singh, T. (2015b). Kinematics of interacting CMEs of 25 and 28 september 2012. J. Geophys. Res. Space Phys.120, 10,221–10,236. doi:10.1002/2015JA021415
Mishra, W., Wang, Y., and Srivastava, N. (2016). On understanding the nature of collisions of coronal mass ejections observed by STEREO. Astrophysical J.831, 99. doi:10.3847/0004-637X/831/1/99
Mishra, W., Wang, Y., Srivastava, N., and Shen, C. (2017). Assessing the nature of collisions of coronal mass ejections in the inner heliosphere. Astrophysical J. Suppl. Ser.232, 5. doi:10.3847/1538-4365/aa8139
Owens, M. J. (2018). Solar wind and heavy ion properties of interplanetary coronal mass ejections. Sol. Phys.293, 122. doi:10.1007/s11207-018-1343-0
Palmerio, E., Kilpua, E. K. J., Witasse, O., Barnes, D., Sánchez-Cano, B., Weiss, A. J., et al. (2021). CME magnetic structure and IMF preconditioning affecting SEP transport. Space19, e2020SW002654. doi:10.1029/2020SW002654
Rakowski, C. E., Laming, J. M., and Lepri, S. T. (2007). Ion charge states in halo coronal mass ejections: What can we learn about the explosion?Astrophysical J.667, 602–609. doi:10.1086/520914
Reinard, A. A. (2008). Analysis of interplanetary coronal mass ejection parameters as a function of energetics, source location, and magnetic structure. Astrophysical J.682, 1289–1305. doi:10.1086/589322
Reinard, A. (2005). Comparison of interplanetary CME charge state composition with CME-associated flare magnitude. Astrophysical J.620, 501–505. doi:10.1086/426109
Richardson, I. G., and Cane, H. V. (2004). Identification of interplanetary coronal mass ejections at 1 AU using multiple solar wind plasma composition anomalies. J. Geophys. Res. Space Phys.109, A09104. doi:10.1029/2004JA010598
Richardson, I. G., and Cane, H. V. (2010). Near-earth interplanetary coronal mass ejections during solar cycle 23 (1996 - 2009): Catalog and summary of properties. Sol. Phys.264, 189–237. doi:10.1007/s11207-010-9568-6
Rodkin, D., Goryaev, F., Pagano, P., Gibb, G., Slemzin, V., Shugay, Y., et al. (2017). Origin and ion charge state evolution of solar wind transients during 4 - 7 august 2011. Sol. Phys.292, 90. doi:10.1007/s11207-017-1109-0
Rodkin, D., Slemzin, V., Zhukov, A. N., Goryaev, F., Shugay, Y., and Veselovsky, I. (2018). Single ICMEs and complex transient structures in the solar wind in 2010 - 2011. Sol. Phys.293, 78. doi:10.1007/s11207-018-1295-4
Schmidt, J., and Cargill, P. (2004). A numerical study of two interacting coronal mass ejections. Ann. Geophys.22, 2245–2254. doi:10.5194/angeo-22-2245-2004
Shen, F., Wang, Y., Shen, C., and Feng, X. (2017). On the collision nature of two coronal mass ejections: A review. Sol. Phys.292, 104. doi:10.1007/s11207-017-1129-9
Song, H. Q., Chen, Y., Zhang, J., Cheng, X., Wang, B., Hu, Q., et al. (2015a). Evidence of the solar EUV hot channel as a magnetic flux rope from remote-sensing and in situ observations. Astrophysical J. Lett.808, L15. doi:10.1088/2041-8205/808/1/L15
Song, H. Q., Zhang, J., Chen, Y., Cheng, X., Li, G., and Wang, Y. M. (2015b). First taste of hot channel in interplanetary space. Astrophysical J.803, 96. doi:10.1088/0004-637X/803/2/96
Song, H. Q., Zhong, Z., Chen, Y., Zhang, J., Cheng, X., Zhao, L., et al. (2016). A statistical study of the average iron charge state distributions inside magnetic clouds for solar cycle 23. Astrophysical J. Suppl. Ser.224, 27. doi:10.3847/0067-0049/224/2/27
Srivastava, N., Mishra, W., and Chakrabarty, D. (2018). Interplanetary and geomagnetic consequences of interacting CMEs of 13 - 14 June 2012. Sol. Phys.293, 5. doi:10.1007/s11207-017-1227-8
St. Cyr, O. C., Plunkett, S. P., Michels, D. J., Paswaters, S. E., Koomen, M. J., Simnett, G. M., et al. (2000). Properties of coronal mass ejections: SOHO LASCO observations from january 1996 to June 1998. J. Geophys. Res. Space Phys.105, 18169–18186. doi:10.1029/1999JA000381
Stone, E. C., Frandsen, A. M., Mewaldt, R. A., Christian, E. R., Margolies, D., Ormes, J. F., et al. (1998). The advanced composition explorer. Space Sci. Rev.86, 1–22. doi:10.1023/A:1005082526237
Temmer, M., Reiss, M. A., Nikolic, L., Hofmeister, S. J., and Veronig, A. M. (2017). Preconditioning of interplanetary space due to transient CME disturbances. Astrophysical J.835, 141. doi:10.3847/1538-4357/835/2/141
Temmer, M., Veronig, A. M., Peinhart, V., and Vršnak, B. (2014). Asymmetry in the CME-CME interaction process for the events from 2011 february 14-15. Astrophysical J.785, 85. doi:10.1088/0004-637X/785/2/85
von Steiger, R., and Zurbuchen, T. H. (2003). “Composition signatures of interplanetary coronal mass ejections,” in Solar variability as an input to the earth’s environment. Editor A. Wilson (ESA Publications Division), 835–840.
Wang, W., Liu, R., Wang, Y., Hu, Q., Shen, C., Jiang, C., et al. (2017). Buildup of a highly twisted magnetic flux rope during a solar eruption. Nat. Commun.8, 1330. doi:10.1038/s41467-017-01207-x
Wang, Y. M. (2012). Semiempirical models of the slow and fast solar wind. Space Sci. Rev.172, 123–143. doi:10.1007/s11214-010-9733-0
Wang, Y. M., Ye, P. Z., and Wang, S. (2003). Multiple magnetic clouds: Several examples during March-April 2001. J. Geophys. Res. Space Phys.108, 1370. doi:10.1029/2003JA009850
Webb, D. F., and Howard, T. A. (2012). Coronal mass ejections: Observations. Living Rev. Sol. Phys.9, 3. doi:10.12942/lrsp-2012-3
Yashiro, S., Gopalswamy, N., Michalek, G., Cyr, St.O. C., Plunkett, S. P., Rich, N. B., et al. (2004). A catalog of white light coronal mass ejections observed by the SOHO spacecraft. J. Geophys. Res. Space Phys.109, A07105. doi:10.1029/2003JA010282
Yu, W., Farrugia, C. J., Galvin, A. B., Lugaz, N., Luhmann, J. G., Simunac, K. D. C., et al. (2016). Small solar wind transients at 1 AU: STEREO observations (2007-2014) and comparison with near-earth wind results (1995-2014). J. Geophys. Res. Space Phys.121, 5005–5024. doi:10.1002/2016JA022642
Zhang, J., and Wang, J. (2002). Are homologous flare-coronal mass ejection events triggered by moving magnetic features?Astrophysical J.566, L117–L120. doi:10.1086/339660
Zhao, L., Landi, E., Zurbuchen, T. H., Fisk, L. A., and Lepri, S. T. (2014). The evolution of 1 AU equatorial solar wind and its association with the morphology of the heliospheric current sheet from solar cycles 23 to 24. Astrophysical J.793, 44. doi:10.1088/0004-637X/793/1/44
Zhao, L., Zurbuchen, T. H., and Fisk, L. A. (2009). Global distribution of the solar wind during solar cycle 23: ACE observations. Geophys. Res. Lett.36, L14104. doi:10.1029/2009GL039181
Zurbuchen, T. H., Fisk, L. A., Lepri, S. T., and von Steiger, R. (2003). “The composition of interplanetary coronal mass ejections,” in Solar wind ten: Proceedings of the tenth international solar wind conference. Editors M. Velli, R. Bruno, F. Malara, and B. Bucci (AIP Conference Proceedings), 604–607.
Zurbuchen, T. H., and Richardson, I. G. (2006). In-situ solar wind and magnetic field signatures of interplanetary coronal mass ejections. Space Sci. Rev.123, 31–43. doi:10.1007/s11214-006-9010-4
Keywords: CME–CME interaction, ICME, solar wind, compositional signatures, charge states
Citation: Srivastava N, Mirtoshev Z and Mishra W (2023) Investigating the variations in the composition and heating of interacting ICMEs. Front. Astron. Space Sci. 10:1154612. doi: 10.3389/fspas.2023.1154612
Received: 30 January 2023; Accepted: 24 April 2023;
Published: 30 May 2023.
Edited by:
Divya Oberoi, Tata Institute of Fundamental Research, IndiaCopyright © 2023 Srivastava, Mirtoshev and Mishra. This is an open-access article distributed under the terms of the Creative Commons Attribution License (CC BY). The use, distribution or reproduction in other forums is permitted, provided the original author(s) and the copyright owner(s) are credited and that the original publication in this journal is cited, in accordance with accepted academic practice. No use, distribution or reproduction is permitted which does not comply with these terms.
*Correspondence: Zavkiddin Mirtoshev, em1pcnRvc2hldkBnbWFpbC5jb20=