 Baozhu Zhou1,2
 Wen Yi1,2*
 Xianghui Xue1,2,3,4,5*
 Hailun Ye1,2
 Jie Zeng1,2
 Guozhu Li6Masaki Tsutsumi7
 Njål Gulbrandsen8Tingdi Chen1,2Xiankang Dou1,5
- 1School of Earth and Space Sciences, University of Science and Technology of China, Hefei, China
- 2CAS Key Laboratory of Geospace Environment/CAS Center for Excellence in Comparative Planetology, Anhui Mengcheng Geophysics National Observation and Research Station, University of Science and Technology of China, Hefei, China
- 3Hefei National Laboratory for the Physical Sciences at the Microscale, University of Science and Technology of China, Hefei, China
- 4Hefei National Laboratory, University of Science and Technology of China, Hefei, China
- 5Collaborative Innovation Center of Astronautical Science and Technology, Hefei, China
- 6Key Laboratory of Earth and Planetary Physics, Institute of Geology and Geophysics, Chinese Academy of Sciences, Beijing, China
- 7National Institute of Polar Research, Tachikawa, Japan
- 8Tromsø Geophysical Observatory, UiT—The Arctic University of Norway, Tromsø, Norway
In this study, the neutral density and horizontal wind observed by the four meteor radars, as well as the temperature measured by the Microwave Limb Sounder (MLS) onboard the Aura satellite are used to examine the response of neutral density, wind, and temperature in the MLT region to the stratospheric sudden warmings (SSWs) during 2005 to 2021 in the Northern Hemisphere. The four meteor radars include the Svalbard (78.3°N, 16°E) and Tromsø (69.6°N, 19.2°E) meteor radars at high latitudes and the Mohe (53.5°N, 122.3°E) and Beijing (40.3°N, 116.2°E) meteor radars at middle latitudes. The superposed epoch analysis results indicate that: 1) the neutral density over Svalbard and Tromsø at high latitude increased at the beginning of SSWs and decreased after the zonal mean stratospheric temperature reached the maximum. However, the neutral density over Mohe at midlatitudes decreased in neutral density at the beginning of SSW and increase after the zonal mean stratospheric temperature reached the maximum. 2) The zonal wind at high latitudes show a westward enhancement at the beginning of SSWs and then shows an eastward enhancement after the stratospheric temperature reaches maximum. However, the zonal wind at midlatitudes shows an opposite variation to at high latitudes, with an eastward enhancement at the onset and changing to westward enhancements after the stratospheric temperature maximum. The meridional winds at high and midlatitudes show a southward enhancement after the onset of SSW and then show a northward enhancement after the stratospheric temperature maximum. 3) In general, the temperature in the MLT region decreased throughout SSWs. However, as the latitudes decrease, the temperature cooling appears to lag a few days to the higher latitudes, and the degree of cooling will decrease relatively.
1 Introduction
Sudden stratospheric warming is a large-scale meteorological event that frequently occurs in the winter polar stratosphere almost exclusively in the Northern Hemisphere. The typical feature of this event is characterized by a rapid increase in polar stratospheric temperature by at least 25 K within a few days (Liu et al., 2014; Paula et al., 2015). Simultaneously, the eastward wind becomes weaker or even reverses to westward, thus dividing it into two types, i.e., minor warming and major warming. The widely accepted generation mechanism of SSW is the nonlinear interaction between stationary planetary waves and zonal mean flow (Matsuno, 1971).
Although SSW is a dramatic phenomenon in the polar stratosphere, SSW-induced effects have been proven to extend well beyond the stratosphere and can significantly alter the state of the mesosphere, thermosphere, and ionosphere globally (Goncharenko et al., 2010; Liu et al., 2014; Maute et al., 2015; Liu et al., 2019; Gupta et al., 2021; Ye et al., 2021). Goncharenko and Zhang (2008) and Chau et al. (2009) clearly showed an unprecedented result of the ion temperature at midlatitudes and plasma E × B drifts at equatorial regions, respectively, associated with the January 2008 SSW. An obvious decrease of thermospheric neutral density was observed at the altitudes of the Challenging Minisatellite Payload (CHAMP) and Gravity Recovery and Climate Experiment (GRACE) satellites in the predawn and presunset sectors during the January 2009 SSW (Liu et al., 2011). A superposed epoch analysis of 37 SSW events reveals a reduction in the global mean thermosphere density at 250–575 km (Yamazaki et al., 2015). Many studies have also reported the characteristics of the atmospheric wave response to SSWs in the upper atmosphere (Gong et al., 2013; Yamazaki et al., 2015; Baldwin et al., 2021). These findings present strong and direct links between the disturbed lower atmosphere and the state of the upper atmosphere (Goncharenko and Zhang, 2008; Chau et al., 2009; Baldwin et al., 2021), which has attracted the interests of the aeronomy community.
In the mesosphere and lower thermosphere (MLT) region, the large variability associated with SSW is also evident in observational studies and numerical simulations. These changes include cooling at high latitudes and a weakening and/or reversal of the westward direction of zonal winds (opposite to the stratospheric situation), which are mainly caused by planetary wave and gravity wave forcing (Hoffmann et al., 2007; Chau et al., 2012; Yamazaki et al., 2020). Using a global-scale wave model (GSWM), Stening et al. (1997) reported that the semidiurnal lunar tide in the MLT region increased significantly during SSWs, which was further verified by observational results in recent years (e.g., Paulino et al., 2012; Yuan et al., 2012; Xiong et al., 2013). Overall, previous studies of SSW effects on the MLT region have focused on changes in the behavior of winds, temperature, and tides (Dowdy et al., 2004; Li et al., 2021). As mentioned before, satellite data have shown a large density decrease in the upper thermosphere during SSWs (Liu et al., 2011; Yamazaki et al., 2015), indicating strong thermospheric cooling. However, it is still unclear how the neutral density in the MLT region responds to SSWs. Continuous measurements of neutral atmospheric density in the MLT region are relatively scarce. Ground-based medium-frequency radar and very high frequency radar are commonly used to study the dynamics and structure of MLT regions, but they do not generally measure neutral density (Igarashi et al., 1999; Wang et al., 2022; Zhou et al., 2022). LIDAR can provide density profiles with high temporal resolution and accuracy, but clear sky conditions are required and many systems are further restricted to nighttime operation (Zhao et al., 2017). The neutral density in the MLT region can be estimated by using the diffusion coefficients from the meteor radar and temperatures from the different measurements such as the satellites and OH airglow (e.g., Takahashi et al., 2002; Younger et al., 2015; Yi et al., 2018; Yi et al., 2019).
In this study, we apply the neutral density and horizontal wind observed from four meteor radars, and the temperature obtained from the MLS/Aura to investigate the response of MLT density, temperature, and wind to the SSWs. Our paper is organized as follows. The dataset and methods are briefly described in Section 2. The results are given in Section 3. The possible mechanisms are discussed in Section 4. Conclusions are presented in Section 5.
2 Data and method
2.1 Meteor radars
In this study, data from four meteor radars, namely, Svalbard (78.3° N, 16° E), Tromsø (69.6° N, 19.2° E), Mohe (53.5° N, 122.3° E), and Beijing (40.3° N, 116.2° E) meteor radars, were used. Table 1 summarizes the operational frequencies, geographic locations, and observational periods for the meteor radars used in this study. These meteor radars are all part of the ATRAD Meteor Detection Radar series, which is similar to the Buckland Park Meteor Radar (Holdsworth et al., 2004). Figure 1 shows the locations of these four meteor radars. The Svalbard and Tromsø meteor radars are located at high latitudes in the northern hemisphere, and the Mohe and Beijing meteor radars are located at midlatitudes. The neutral atmospheric density used in this study can be estimated by using the ambipolar diffusion coefficient (Da) observed by the meteor radars and temperature measured by the Aura/Microwave Limb Sounder (MLS). The ambipolar diffusion coefficient describes the rate at which plasma diffuses in a neutral background and is a function of atmospheric temperature (T) and density (ρ) (see, e.g., Younger et al., 2014; Yi et al., 2018; Yi et al., 2019) as given by,
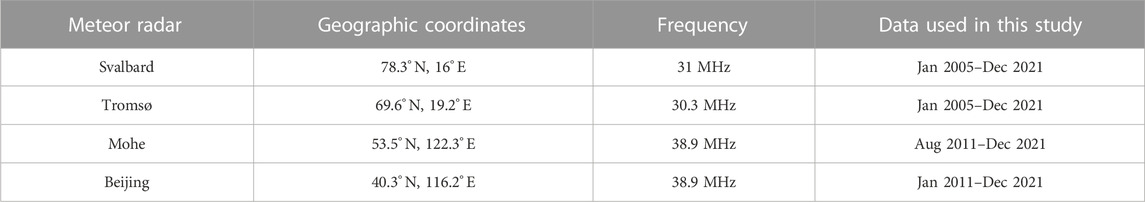
TABLE 1. Main operation parameters, geographic coordinates and observational time periods for the meteor radars used in this study.
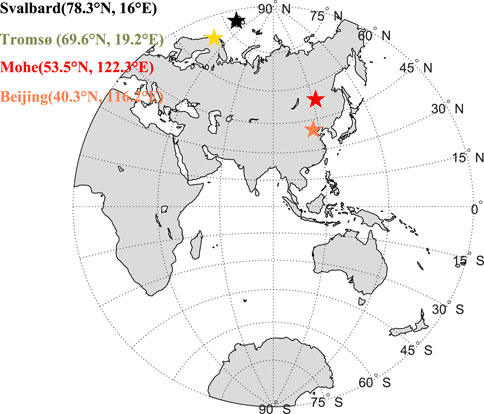
FIGURE 1. The locations of the meteor radars used in this study.
K0 is the ion zero-field mobility, usually assumed to be 2.5 × 10⁴ m-2s-1 V−1. More details of the density estimation and their errors are described by Yi et al. (2018), Yi et al. (2019).
2.2 EOS Aura/MLS temperature and GPH measurements
In this study, the Microwave Limb Sounder (2004-present) on Aura provides temperature and geopotential height (GPH) data (version 4) (Schwartz et al., 2008), which were obtained limited to a range of 10° × 20° centered on the four meteor radar positions mentioned above. To generate temperature and geopotential height profiles, daily mean temperature and GPH observations from the Aura MLS were interpolated to within 1 km between 85 and 95 km, covering the years 2004 to 2021. Meanwhile, to study the response of temperature and GPH to SSWs at different latitudes, we analyze the latitudinal variation of temperature and GPH by superimposing a range of 10° in latitude and then averaging over the entire latitudinal circle. In this study, we examine the zonal and daily means of the temperature and geopotential height in each 10° latitude bin from 40°N to 80°N, which covers the latitude range of meteor radars.
2.3 Identification of SSWs
To identify SSWs, we utilized the zonal mean zonal wind at 60°N and stratospheric temperature at 90°N at 10 hPa (−32 km) from the National Centers for Environmental Prediction (NCEP)/National Center for Atmospheric Research (NCAR) reanalysis datasets. The NCEP/NCAR reanalysis dataset was generated by NCEP/NCAR using a cutting-edge analysis/forecasting system that assimilates data by utilizing past data from 1948 to the present (Kalnay et al., 1996; Jia et al., 2015; Wan et al., 2019). Table 2 presents a list of all SSWs occurred from 2005 to 2021 and the covered period with meteor radars. In Table 2, the left column shows the year when SSW occurred and the right column shows the date when the maximum value of stratospheric temperature at 90°N at 10 hPa occurred.
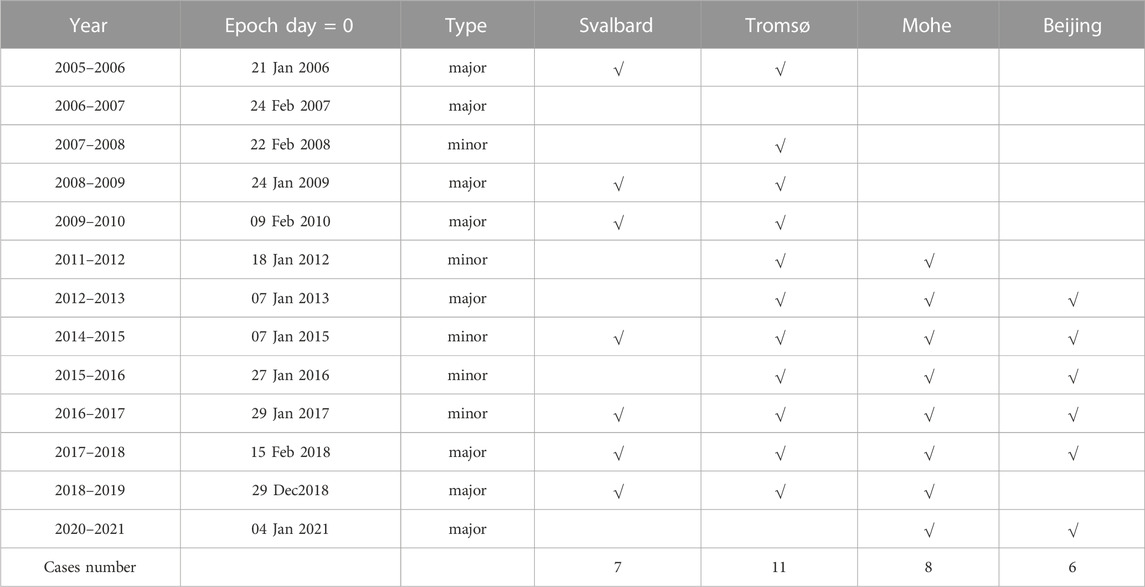
TABLE 2. Dates of SSW Events during 2005 to 2021 and cover period with meteor radars.
2.4 Method
In this study, a superposed epoch analysis, which is an important statistical analysis manner, that is, widely used in geophysical research (e.g., Yamazaki et al., 2015; Yu et al., 2017; Yi et al., 2021), is used to estimate the characteristic response of neutral parameters in the MLT region to SSWs. We define the maximum value of stratospheric temperature at 90°N at 10 hPa during the whole process of SSW as “epoch day = 0”, and 61 days of data were selected centered on epoch day = 0 to study the neutral atmospheric densities during SSW. By superposing 61 days of data during different SSW events, we estimate the characteristic response of the neutral atmospheric parameter to SSW events at high and middle latitudes.
We use the residual as a variable to study neutral density by removing the background of the neutral atmospheric density with a 10-day window for smoothing. However, since the atmospheric density follows an exponential distribution in height, we just focus on the relative variability of the neutral density. The geopotential height and both the stratospheric/MLT wind and temperature are conducted the same way to derive the residual.
3 Results
Figure 2 shows the variability in MLT neutral densities during the 2018 SSW event derived from four meteor radars. The left vertical dot-dashed lines, day = −6, denote the warming onset of SSW on February 9, 2018. The middle vertical dashed lines, day = 0, denote the maximum value of zonal mean stratospheric temperature at 90°N at 10 hPa on February 15, 2018. As shown in Figures 2A, B, from the onset of SSW to day = 0, the residual of zonal mean stratospheric temperature at 90°N at 10 hPa increases and reaches a maximum of −246 K and then decrease after day = 0. Meanwhile, the residual of the zonal mean zonal wind at 60°N at 10 hPa show obvious decreases of approximately −20 m/s and then increase after day 2. In this event, the zonal mean wind reversed its direction from eastward to westward, indicating a major warming event.
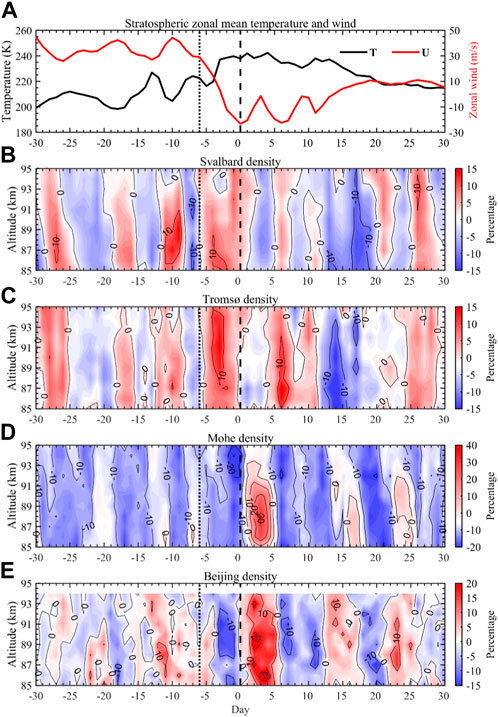
FIGURE 2. Variations in (A) zonal mean stratospheric temperature residual at 90°N (black line), zonal mean zonal wind residual at 60°N at 10 hPa (red line), and residual of the relative neutral density obtained by (B) Svalbard, (C) Tromsø, (D) Mohe and (E) Beijing meteor radar at 85–95 km during December 2017-February 2018. The dot-dashed lines denote the onset of the warming on February 09, 2018 (day = −6) and the dashed lines denote the day = 0 (maximum value of zonal mean stratospheric temperature on February 15, 2018 at 90°N at 10 hPa during SSW).
In Figures 2C, D, after the onset of SSW, the residual of neutral density observed by Svalbard and Tromsø meteor radars at high latitudes shows an obvious increase of approximately 15% and 13%, respectively, after the beginning of the SSW event (day = −6). Then, the density shows a decrease of approximately −10% and −8% after the maximum stratospheric temperature (day = 0), respectively. On the contrary, as shown in Figures 2E, F, the density residuals observed by the Mohe and Beijing meteor radars at midlatitudes show an obvious decrease of approximately −10% and −15%, after the beginning of the SSW event (day = −6), respectively, and then show the increases ∼38% and ∼20%, after the maximum of stratospheric temperature (day = 0), respectively. The MLT density shows an obvious response to the 2018 major SSW. Note that the variation of neutral density between high latitudes and midlatitudes is different.
To further examine the significance of SSW effects on MLT density, we perform a superposed epoch analysis of data from the four meteor radars during the selected SSW events (shown in Table 2). In Figure 3A, the stratospheric temperatures at 90°N show a significant increase after the beginning of the SSWs (epoch day = −6) and reach the maximum over 20 K on epoch day = 0. The westward changing value of stratospheric zonal mean wind at 60°N is 15 m/s during the epoch day −6 to 0. Figures 3B, C show that after superposed epoch analysis, the mean densities have strong corresponding responses to the SSW events.
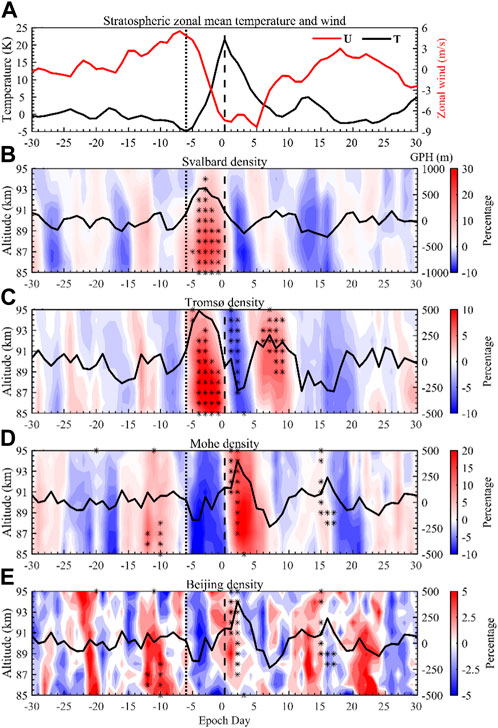
FIGURE 3. Variations in (A) zonal mean stratospheric temperature residual at 90°N (red line) and zonal mean zonal wind residual at 60°N at 10 hPa (black line), and residual of the relative neutral density obtained by the (B) Svalbard, (C) Tromsø, (D) Mohe and (E) Beijing meteor radars at an altitude of 85–95 km obtained by the superposed epoch analysis. The dot-dashed lines denote the epoch day = −6 (beginning enhancement of stratospheric temperature at 90°N at 10 hPa during SSWs). The dashed lines denote the epoch day = 0 (maximum value of stratospheric temperature at 90°N at 10 hPa during SSWs). The black solid lines (B–E) denote the GPH residual of Aura MLS at 0.22 Pa obtained by the superposed epoch analysis. The black star markers denote the significance over the 95% level according to the 10000 times Monte-Carlo test.
In Figures 3B, C, after the onset of the SSWs, the residual of neutral density observed by Svalbard and Tromsø meteor radars at high latitudes shows an obvious increase of approximately 28% and 10%, respectively. After the epoch day = 0, the densities show a decrease of approximately −8% and −10%, respectively. As shown in Figure 3D, the densities over Mohe at the higher-middle latitudes decrease approximately −10% after epoch day = −6 and then show an increase of −8% after epoch day = 0. However, the response of neutral density to SSWs over Beijing at the middle latitude (40°N) seems too weak to be significantly observed in Figure 3E. It is different from the results shown in Figure 2F possibly due to that the SSW in 2018 is a major event and affects a wider range of latitudes.
The GPH at 0.22 Pa over Svalbard and Tromsø at high latitudes shows an increase after epoch day = −6 and a decrease after epoch day = 0, while the GPH at 0.22 Pa over Mohe and Beijing at midlatitudes shows an opposite variability with the results in high latitudes. The GPH at 0.22 Pa over four meteor radars shows similar variability with the neutral density. The GPH measurements observed by Aura MLS are an independent technique that can serve as a proxy for the variation of the atmospheric density observed by the meteor radars in the MLT region (Yi et al., 2018). It is interesting to note that the variation of neutral density during the SSWs between the Svalbard and Tromsø at high latitudes and the Mohe at midlatitudes are opposite.
In addition, the meteor radar can observe the horizontal wind in the MLT region, which provides the opportunity to examine the response of horizontal wind to the SSWs. As shown in Figure 4, the zonal winds observed by the Svalbard and Tromsø meteor radars at high latitudes show a westward enhancement after epoch day = −6 and then show an eastward enhancement after epoch day = 0. However, the zonal winds in Figures 4D, E obtained by Mohe and Beijing meteor radar at 90 km at midlatitudes show an eastward enhancement after epoch day = −6 and then show a westward enhancement after epoch day = 0. In general, the zonal wind at midlatitudes shows opposite variations with observations at high latitudes during the SSWs. Note that as the zonal winds change westward, the neutral densities show an increase and vice versa. Miyoshi et al. (2015) investigated the impacts of an SSW event on the thermosphere using a high resolution-general circulation model (GCM) and found that the westward enhancements at high latitudes and eastward enhancements at midlatitudes in zonal wind component in the MLT region. As shown in Figure 5, the meridional wind from meteor radar shows a southward enhancement after epoch day = −6 and then shows a northward enhancement after epoch day = 0 at high and midlatitudes. The variation of zonal wind is different between high and midlatitudes while the meridional wind has no significant latitude independence. Liu and Roble (2002) suggested that SSW modifies the meridional circulation in the lower thermosphere and leads to the southward wind during the SSWs. Miyoshi et al. (2015) reported a clear reversal of the meridional winds and a change in the meridional atmospheric circulation that at altitudes of 80–100 km, the northward flow disappeared and a weak southward flow appeared during SSW, which is consistent with the meridional wind changes to southward. The wind variations during the SSWs observed by the meteor radars are generally consistent with the modeling results.
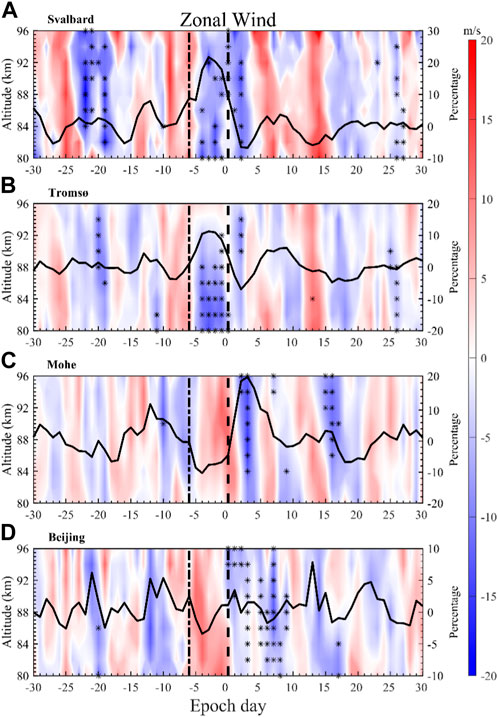
FIGURE 4. The superposed epoch analysis results of zona wind residuals observed by the (A) Svalbard, (B) Tromsø, (C) Mohe and (D) Beijing meteor radars from top to bottom at altitude of 80–96 km. The black lines indicate that the superposed epoch analysis results of the neutral density at 88 km in Figure 3. The dot-dashed lines denote the epoch day = −6 (beginning enhancement of stratospheric temperature at 90°N at 10 hPa during SSWs). The dashed lines denote the epoch day = 0 (maximum value of stratospheric temperature at 90°N at 10 hPa during SSWs). The black star markers denote significance over the 95% level according to the 10000 times Monte-Carlo test.
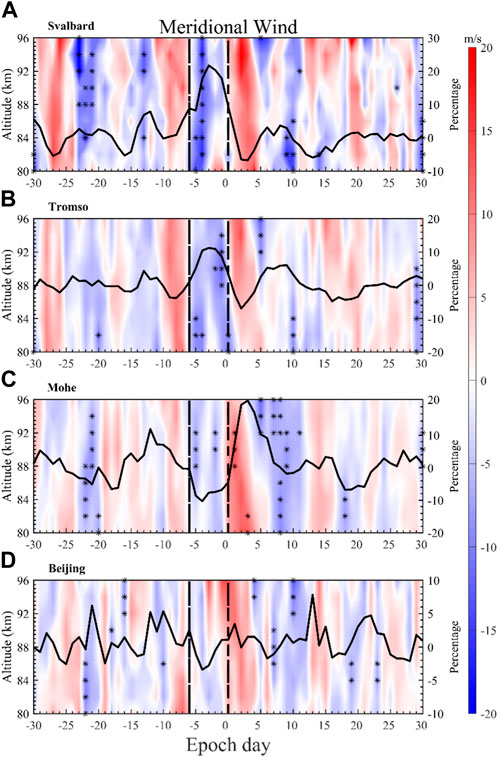
FIGURE 5. The superposed epoch analysis results of meridional wind residuals observed by the (A) Svalbard, (B) Tromsø, (C) Mohe, and (D) Beijing meteor radars from top to bottom at altitude of 80–96 km. The black lines indicate that the superposed epoch analysis results of the neutral density at 88 km in Figure 3. The dot-dashed lines denote the epoch day = −6 (beginning enhancement of stratospheric temperature at 90°N at 10 hPa during SSWs). The dashed lines denote the epoch day = 0 (maximum value of stratospheric temperature at 90°N at 10 hPa during SSWs). The black star markers denote significance over the 95% level according to the 10000 times Monte-Carlo test.
In addition to the density obtained by the meteor radars, the temperatures observed by the Aura/MLS are also used to examine the temperature variations during the SSWs. As shown in Figure 6, the residual of zonal mean temperature between 80°N and 60°N at high latitudes shows an obvious decrease after epoch day = −6 and reaches a minimum of approximately −8 K during the SSWs. The variations of zonal mean temperature between 50°N and 40°N show a relatively weak decrease compared to the high latitudes and delay a few days in the temperature decrease. Yuan et al. (2012) presented that the mean temperature in MLT region observed by Lidar at 40°N show a generally weak decrease during 2009 SSW event. Pedatella et al. (2012) reported that the residual temperature shows an obvious decrease at high latitudes in the mesosphere, showing a slight increase lower than 50°N during SSW by WACCM model simulations. Our observations generally agree with the model results and other measurement.
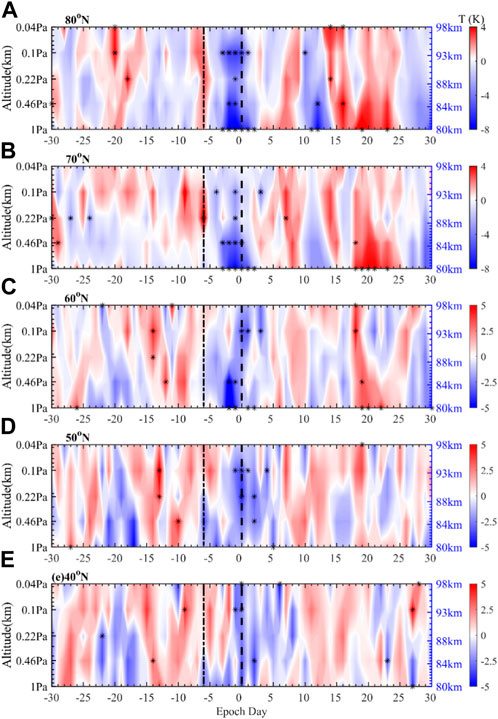
FIGURE 6. The zonal mean temperature residual observed by the Aura MLS by the superposed epoch analysis at high and middle latitudes (80°N to 40°N from (A–E)). The black stars denote significance over the 95% level according to the 10000 times Monte-Carlo test. The dot-dashed lines denote the day (the beginning enhancement of stratospheric temperature at 90°N at 10 hPa during SSWs). The dashed lines denote the day = 0 (maximum value of stratospheric temperature at 90°N at 10 hPa during SSWs).
4 Discussion
The results in Section 3 demonstrate that the neutral densities, temperatures, and winds in the MLT region change significantly during SSWs. We now briefly discuss what may be the driving mechanism for the changes in the neutral densities, temperatures, and winds. SSW occurred in the winter polar region and is a signature event in the middle atmosphere, involving dramatic changes in temperature, winds, and circulation over a short period. First, our observations show that the temperatures in the MLT region significantly decrease during SSWs. Numerous studies have reported that the MLT cooling at high latitudes is accompanied by stratospheric warming during SSWs (Liu and Roble, 2002; Funke et al., 2010; Liu et al., 2014; Yamazaki et al., 2015; Li et al., 2021; Pedatella et al., 2012). They suggested that the interaction decelerates and reverses the eastward jet flow in the winter stratosphere, while leading to a significant upward circulation in the mesosphere, resulting in adiabatic cooling.
Second, the zonal winds at high latitudes show a westward enhancement at the beginning of SSWs and then show an eastward enhancement after the stratospheric temperature reaches maximum. SSW events lead to dramatic wind changes in the mesosphere and lower thermosphere, for example, the reversal of the zonal mean wind from westward to eastward, which is opposite as in the stratosphere (Baldwin et al., 2021, and the references therein). As the background wind changes, the MLT region changes during SSWs are primarily due to changes in gravity wave drag. In general, the weakening, and potential reversal, of the eastward stratospheric winds leads to more eastward propagating gravity waves reaching the MLT region. And then, as the breaking of gravity waves, the enhanced eastward forcing reverses the MLT wind from westward to eastward (Liu & Roble, 2002; Limpasuvan et al., 2016). Meanwhile, the drag of the westward gravity waves is also decreasing or even reversing due to the reversal of temperature at middle-to-low latitudes in the Northern Hemisphere (Miyoshi et al., 2015), hence resulting in the reversal of the zonal wind at 50°N as shown in the results observed by the Mohe and Beijing meteor radars.
On the other hand, the meridional winds at high and middle latitudes show a northward enhancement after the onset of SSWs and then show a southward enhancement after the onset of SSW and then show a northward enhancement after stratospheric temperature maximum. The deceleration of stratopause and mesosphere mean wind flow in the high-latitude winter changes the filtering of gravity waves by allowing more eastward gravity waves to propagate into the mesosphere and lower thermosphere (MLT), which causes eastward forcing and reverses the westward jet in the MLT region. This also changes the meridional circulation in the upper mesosphere from northward to southward (Liu and Roble, 2002). Miyoshi et al. (2015) also reported a clear reversal of the meridional winds and a change in the meridional atmospheric circulation in the MLT region, the northward flow disappeared and a weak southward flow appeared during SSW, which is consistent with the meridional wind changes to southward observed by the four meteor radars.
Our observations of neutral density variation in the MLT region are the first ones to show the latitudinal changes during SSWs. The high latitude neutral densities increase at the beginning of SSWs and decreased after the zonal mean stratospheric temperature reaches maximum. The deceleration of stratopause and mesosphere mean wind flow changes the eastward forcing and reverses the westward jet in the MLT region, meanwhile this also leads to a significant upward circulation in the mesosphere. The atmosphere lifts upward leading to an increase in MLT neutral density at high latitudes. At middle latitudes, the interaction is opposite of the polar region. The westward forcing also induces changes in the mean meridional residual circulation in the middle atmosphere, leading the previously strong poleward/downward circulation in the polar mesosphere becomes poleward/upward (Liu and Roble, 2002). This interaction leads to the relative cooling of the stratosphere at the middle and lower latitudes and then leads to atmospheric compression and downward transport resulting in a decrease of neutral density in the MLT region at middle latitudes (Yamashita et al., 2010; Limpasuvan et al., 2016).
In this study, we discussed the variation of the neutral atmospheric density, temperature and the wind in MLT region with the latitudinal differences. However, our meteor radar stations are currently limited and possible longitude differences need to be studied by atmosphere model in the future.
5 Conclusion
In this study, we investigate the response of neutral density obtained from the meteor radars distributed at high and middle latitudes in the MLT region to the SSWs from 2005 to 2021 in the Northern Hemisphere. The meteor radars used in this study are the Svalbard and Tromsø meteor radars at high latitudes and the Mohe and Beijing meteor radars at midlatitudes. The main findings of our study can be summarized as follows:
(1) The neutral density over Svalbard and Tromsø at high latitudes increased at the beginning of SSWs and decreased after the zonal mean stratospheric temperature reached the maximum. However, the neutral density over Mohe at midlatitudes decreased in neutral density at the beginning of SSW and increase after the zonal mean stratospheric temperature reached the maximum.
(2) The zonal wind at high latitudes show a westward enhancement at the beginning of SSWs and then shows an eastward enhancement after the stratospheric temperature reaches maximum. However, the zonal wind at midlatitudes shows an opposite variation to at high latitudes, with an eastward enhancement at the onset and changing to westward enhancements after the stratospheric temperature maximum. The meridional winds at high and midlatitudes show a southward enhancement after the onset of SSW and then show a northward enhancement after the stratospheric temperature maximum.
(3) The temperature in the MLT region decreased throughout SSWs. However, as the latitudes decrease, the temperature cooling appears to lag a few days to the higher latitudes, and the degree of cooling will decrease relatively.
In this study, we analyze the impact of SSWs on neutral density, as well as the variability of temperature throughout the Northern Hemisphere high to middle latitudes, and infer the process of influence on the circulation during the occurrence of SSW in conjunction with the wind. Future study will extend our analysis to more stratospheric warming events and their effects on atmospheric dynamics such as gravity waves, tides, and planetary waves.
Data availability statement
The original contributions presented in the study are included in the article/Supplementary Material, further inquiries can be directed to the corresponding authors.
Author contributions
The manuscript was edited by and discussed with all authors. BZ and WY performed the data analysis and wrote the first draft of the paper. The conceptual idea of the manuscript was developed by WY and XX. MT and NG contributed with the Tromsø and Svalbard meteor radar data, read and edited the manuscript and helped with the discussions. HY and JZ partly computed the meteor radar datasets. All of the authors discussed the results and commented on the paper.
Funding
This work is supported by the Project of Stable Support for Youth Team in Basic Research Field, CAS (YSBR-018), the National Natural Science Foundation of China (41974174, 41831071, and 42174183), the Innovation Program for Quantum Science and Technology (Grant No. 2021ZD0300300), the B-type Strategic Priority Program of CAS Grant No. XDB41000000, and the foundation of the National Key Laboratory of Electromagnetic Environment and the Fundamental Research Funds for the Central Universities. WY was also funded the Anhui Provincial Natural Science Foundation (Grant No. 2008085MD113), and the Joint Open Fund of Mengcheng National Geophysical Observatory (MENGO-202209).
Conflict of interest
The authors declare that the research was conducted in the absence of any commercial or financial relationships that could be construed as a potential conflict of interest.
Publisher’s note
All claims expressed in this article are solely those of the authors and do not necessarily represent those of their affiliated organizations, or those of the publisher, the editors and the reviewers. Any product that may be evaluated in this article, or claim that may be made by its manufacturer, is not guaranteed or endorsed by the publisher.
References
Baldwin, M. P., Ayarzagüena, B., Birner, T., Butchart, N., Butler, A. H., Charlton-Perez, A. J., et al. (2021). Sudden stratospheric warmings. Rev. Geophys. 59, e2020RG000708. doi:10.1029/2020RG000708
Chau, J. L., Fejer, B. G., and Goncharenko, L. P. (2009). Quiet variability of equatorial E × B drifts during a sudden stratospheric warming event. Geophys. Res. Lett. 36, L05101. doi:10.1029/2008GL036785
Chau, J. L., Goncharenko, L. P., Fejer, B. G., and Liu, H. L. (2012). Equatorial and low latitude ionospheric effects during sudden stratospheric warming events: Ionospheric effects during SSW events. Space Sci. Rev. 168, 385–417. doi:10.1007/s11214-011-9797-5
Dowdy, A. J., Vincent, R. A., Murphy, D. J., Tsutsumi, M., Riggin, D. M., and Jarvis, M. J. (2004). The large-scale dynamics of the mesosphere-lower thermosphere during the southern hemisphere stratospheric warming of 2002. Geophys. Res. Lett. 31, L14102. doi:10.1029/2004gl020282
Funke, B., López-Puertas, M., Bermejo-Pantaleón, D., García-Comas, M., Stiller, G. P., von Clarmann, T., et al. (2010). Evidence for dynamical coupling from the lower atmosphere to the thermosphere during a major stratospheric warming. Geophys. Res. Lett. 37, L13803. doi:10.1029/2010GL043619
Goncharenko, L., and Zhang, S. R. (2008). Ionospheric signatures of sudden stratospheric warming: Ion temperature at middle latitude. Geophys. Res. Lett. 35, L21103–L21107. doi:10.1029/2008GL035684
Goncharenko, L. P., Chau, J. L., Liu, H. L., and Coster, A. J. (2010). Unexpected connections between the stratosphere and ionosphere. Geophys. Res. Lett. 37. doi:10.1029/2010GL043125
Gong, Y., Zhou, Q., and Zhang, S. (2013). Atmospheric tides in the low-latitude e and F regions and their responses to a sudden stratospheric warming event in January 2010. J. Geophys. Res. Sp. Phys. 118, 7913–7927. doi:10.1002/2013JA019248
Gupta, S., Upadhayaya, A. K., and Siingh, D. (2021). Ionospheric response to sudden stratospheric warming events across longitudes during solar cycle 24. J. Geophys. Res. Space Phys. 126, e2021JA029206. doi:10.1029/2021JA029206
Hoffmann, P., Singer, W., Keuer, D., Hocking, W. K., Kunze, M., and Murayama, Y. (2007). Latitudinal and longitudinal variability of mesospheric winds and temperatures during stratospheric warming events. J. Atmos. Sol. Terr. Phys. 69, 2355–2366. doi:10.1016/j.jastp.2007.06.010
Holdsworth, D. A., Reid, I. M., and Cervera, M. A. (2004). Buckland Park all-sky interferometric meteor radar. Radio Sci. 39, RS5009. doi:10.1029/2003rs003014
Igarashi, K., Murayama, Y., Hocke, K., Yamazaki, R., Kunitake, M., Nagayama, M., et al. (1999). Coordinated observations of the dynamics and coupling processes of mesosphere and lower thermosphere winds with MF radars at the middle-high latitude. Earth Planet Sp. 51, 657–664. doi:10.1186/BF03353223
Jia, Y., Zhang, S. D., Yi, F., Huang, C. M., Huang, K. M., Gan, Q., et al. (2015). Observations of gravity wave activity during stratospheric sudden warmings in the Northern Hemisphere. Sci. China Technol. Sci. 58, 951–960. doi:10.1007/s11431-015-5806-3
Kalnay, E., Kanamitsu, M., Kistler, R., Collins, W., Deaven, D., Gandin, L., et al. (1996). The NCEP/NCAR 40-year reanalysis project. Bull. Am. Meteorological Soc. 77, 437–471. doi:10.1175/1520-0477(1996)077<0437:tnyrp>2.0.co;2
Li, N., Lei, J., Huang, F., Yi, W., Chen, J., Xue, X., et al. (2021). Responses of the ionosphere and neutral winds in the mesosphere and lower thermosphere in the Asian-Australian sector to the 2019 southern hemisphere sudden stratospheric warming. J. Geophys. Res. Space Phys. 126, e2020JA028653. doi:10.1029/2020JA028653
Limpasuvan, V., Orsolini, Y. J., Chandran, A., Garcia, R. R., and Smith, A. K. (2016). On the composite response of the MLT to major sudden stratospheric warming events with elevated stratopause. J. Geophys. Res. Atmos. 121, 4518–4537. doi:10.1002/2015JD024401
Liu, H.-L., and Roble, R. G. (2002). A study of a self-generated stratospheric sudden warming and its mesospheric-lower thermospheric impacts using the coupled TIME-GCM/CCM3. J. Geophys. Res. 107 (D23), ACL 15-1–ACL 15-18. doi:10.1029/2001JD001533
Liu, H., Doornbos, E., Yamamoto, M., and Tulasi Ram, S. (2011). Strong thermospheric cooling during the 2009 major stratosphere warming. Geophys. Res. Lett. 38, 1–5. doi:10.1029/2011GL047898
Liu, H., Miyoshi, Y., Miyahara, S., Jin, H., Fujiwara, H., and Shinagawa, H. (2014). Thermal and dynamical changes of the zonal mean state of the thermosphere during the 2009 SSW: GAIA simulations. J. Geophys. Res. Sp. Phys. 119, 6784–6791. doi:10.1002/2014ja020222
Liu, J., Zhang, D.-H., Hao, Y.-Q., and Xiao, Z. (2019). The comparison of lunar tidal characteristics in the low-latitudinal ionosphere between east asian and American sectors during stratospheric sudden warming events: 2009–2018. J. Geophys. Res. Space Phys. 124, 7013–7033. doi:10.1029/2019JA026722
Matsuno, T. (1971). A dynamical model of the stratospheric sudden warming. J. Atmos. Sci. 28, 1479–1494. doi:10.1175/1520-0469(1971)028<1479:admots>2.0.co;2
Maute, A., Hagan, M. E., Yudin, V., Liu, H.-L., and Yizengaw, E. (2015). Causes of the longitudinal differences in the equatorial vertical E × B drift during the 2013 SSW period as simulated by the TIME-GCM. J. Geophys. Res. Space Phys. 120, 5117–5136. doi:10.1002/2015JA021126
Miyoshi, Y., Fujiwara, H., Jin, H., and Shinagawa, H. (2015). Impacts of sudden stratospheric warming on general circulation of the thermosphere. J. Geophys. Res. Space Phys. 120 (10), 10,897–10,912. doi:10.1002/2015JA021894
Paula, E. R., Jonah, O. F., Moraes, A. O., Kherani, E. A., Fejer, B. G., Abdu, M. A., et al. (2015). Low-latitude scintillation weakening during sudden stratospheric warming events. J. Geophys. Res. Sp. Phys. 120, 2212–2221. doi:10.1002/2014JA020731
Paulino, A. R., Batista, P. P., Clemesha, B. R., Buriti, R. A., and Schuch, N. (2012). An enhancement of the lunar tide in the MLT region observed in the Brazilian sector during 2006 SSW. J. Atmos. Solar-Terrestrial Phys. 90–91, 97–103. doi:10.1016/j.jastp.2011.12.015
Pedatella, N. M., Liu, H.-L., Richmond, A. D., Maute, A., and Fang, T.-W. (2012). Simulations of solar and lunar tidal variability in the mesosphere and lower thermosphere during sudden stratosphere warmings and their influence on the low-latitude ionosphere. J. Geophys. Res. 117, A08326. doi:10.1029/2012JA017858
Schwartz, M., Lambert, A., Manney, G., Read, W., Livesey, N., Froidevaux, L., et al. (2008). Validation of the Aura Microwave Limb sounder temperature and geopotential height measurements. J. Geophys. Res. 113, D15S11. doi:10.1029/2007JD008783
Stening, R. J., Forbes, J. M., Hagan, M. E., and Richmond, A. D. (1997). Experiments with a lunar atmospheric tidal model. J. Geophys. Res. 102 (D12), 13465–13471. doi:10.1029/97JD00778
Takahashi, H., Nakamura, T., Tsuda, T., Buriti, R., and Gobbi, D. (2002). First measurement of atmospheric density and pressure by meteor diffusion coefficient and airglow OH temperature in the mesopause region. Geophys. Res. Lett. 29, 6-1–6-4. doi:10.1029/2001GL014101
Wan, X., Xiong, C., Wang, H., Zhang, K., Zheng, Z., He, Y., et al. (2019). A statistical study on the climatology of the Equatorial Plasma Depletions occurrence at topside ionosphere during geomagnetic disturbed periods. J. Geophys. Res. Space Phys. 124, 8023–8038. doi:10.1029/2019JA026926
Wang, J., Yi, W., Wu, J., Chen, T., Xue, X., Zeng, J., et al. (2022). Coordinated observations of migrating tides by multiple meteor radars in the equatorial mesosphere and lower thermosphere. J. Geophys. Res. Space Phys. 127, e2022JA030678. doi:10.1029/2022JA030678
Xiong, J., Wan, W., Ding, F., Liu, L., Ning, B., and Niu, X. (2013). Coupling between mesosphere and ionosphere over Beijing through semidiurnal tides during the 2009 sudden stratospheric warming. J. Geophys. Res. Sp. Phys. 118, 2511–2521. doi:10.1002/jgra.50280
Yamashita, C., Liu, H. L., and Chu, X. (2010). Responses of mesosphere and lower thermosphere temperatures to gravity wave forcing during stratospheric sudden warming. Geophys. Res. Lett. 37, 1–5. doi:10.1029/2009GL042351
Yamazaki, Y., Kosch, M. J., and Emmert, J. T. (2015). Evidence for stratospheric sudden warming effects on the upper thermosphere derived from satellite orbital decay data during 1967-2013. Geophys. Res. Lett. 42, 6180–6188. doi:10.1002/2015GL065395
Yamazaki, Y., Matthias, V., Miyoshi, Y., Stolle, C., Siddiqui, T., Kervalishvili, G., et al. (2020). September 2019 antarctic sudden stratospheric warming: Quasi-6-Day wave burst and ionospheric effects. Geophys. Res. Lett. 47, 1–12. doi:10.1029/2019GL086577
Ye, H., Xue, X., Yu, T., Sun, Y. Y., Yi, W., Long, C., et al. (2021). Ionospheric F-layer scintillation variabilities over the American sector during sudden stratospheric warming events. Sp. Weather 19, 1–20. doi:10.1029/2020SW002703
Yi, W., Xue, X., Reid, I., Younger, J., Chen, J., Chen, T., et al. (2018). Estimation of mesospheric densities at low latitudes using the Kunming meteor radar together with SABER temperatures. J. Geophys. Res.-Space Phys. 123, 3183–3195. doi:10.1002/2017JA025059
Yi, W., Xue, X., Reid, I. M., Murphy, D. J., Hall, C. M., Tsutsumi, M., et al. (2019). Climatology of the mesopause relative density using a global distribution of meteor radars. Atmos. Chem. Phys. 19, 7567–7581. doi:10.5194/acp-19-7567-2019
Yi, W., Reid, I. M., Xue, X., Murphy, D. J., Vincent, R. A., Zou, Z., et al. (2021). First observations of Antarctic mesospheric tidal wind responses to recurrent geomagnetic activity. Geophys. Res. Lett. 48, e2020GL089957. doi:10.1029/2020GL089957
Younger, J. P., Lee, C. S., Reid, I. M., Vincent, R. A., Kim, Y. H., and Murphy, D. J. (2014). The effects of deionization processes on meteor radar diffusion coefficients below 90 km. J. Geophys. Res. Atmos. 119, 10027–10043. doi:10.1002/2014JD021787
Younger, J., Reid, I., Vincent, R., and Murphy, D. (2015). A method for estimating the height of a mesospheric density level using meteor radar. Geophys. Res. Lett. 42, 6106–6111. doi:10.1002/2015GL065066
Yu, B., Xue, X., Lu, G., Kuo, C., Dou, X., Gao, Q., et al. (2017). The enhancement of neutral metal Na layer above thunderstorms. Geophys. Res. Lett. 44, 9555–9563. doi:10.1002/2017GL074977
Yuan, T., Thurairajah, B., She, C.-Y., Chandran, A., Collins, R. L., and Krueger, D. A. (2012). Wind and temperature response of midlatitude mesopause region to the 2009 Sudden Stratospheric Warming. J. Geophys. Res. 117, D09114. doi:10.1029/2011JD017142
Zhao, R., Dou, X., Xue, X., Sun, D., Han, Y., Chen, C., et al. (2017). Stratosphere and lower mesosphere wind observation and gravity wave activities of the wind field in China using a mobile Rayleigh Doppler lidar. J. Geophys. Res. Space Phys. 122, 8847–8857. doi:10.1002/2016JA023713
Keywords: meteor radar (MR), mesopheric winds, mesospheric temperature, sudden stratospheric warming (SSW), mesosphere and lower thermosphere (MLT)
Citation: Zhou B, Yi W, Xue X, Ye H, Zeng J, Li G, Tsutsumi M, Gulbrandsen N, Chen T and Dou X (2023) Impact of sudden stratospheric warmings on the neutral density, temperature and wind in the MLT region. Front. Astron. Space Sci. 10:1192985. doi: 10.3389/fspas.2023.1192985
Received: 24 March 2023; Accepted: 21 April 2023;
Published: 04 May 2023.
Edited by:
Xuguang Cai, University of Colorado Boulder, United StatesReviewed by:
Tao Yuan, Utah State University, United StatesSumedha Gupta, University of Colorado Boulder, United States
Copyright © 2023 Zhou, Yi, Xue, Ye, Zeng, Li, Tsutsumi, Gulbrandsen, Chen and Dou. This is an open-access article distributed under the terms of the Creative Commons Attribution License (CC BY). The use, distribution or reproduction in other forums is permitted, provided the original author(s) and the copyright owner(s) are credited and that the original publication in this journal is cited, in accordance with accepted academic practice. No use, distribution or reproduction is permitted which does not comply with these terms.
*Correspondence: Wen Yi, eWl3ZW5AdXN0Yy5lZHUuY24=; Xianghui Xue, eHVleGhAdXN0Yy5lZHUuY24=