 G. J. Fasel1*
 L. C. Lee2
 E. Lake1D. Csonge1B. Yonano1O. Bradley1J. Briggs1S. H. Lee3J. Mann1
 F. Sigernes4D. Lorentzen4
- 1Natural Science Department, Pepperdine University, Malibu, CA, United States
- 2Institute of Earth Sciences, Academia Sinica, Taipei City, Taiwan
- 3NASA Goddard Space Flight Center, Greenbelt, MD, United States
- 4Geophysical Department, University Centre in Svalbard, Longyearbyen, Norway
In 1961, Dungey suggested that magnetic reconnection occurs due to the solar-terrestrial interaction. The interplanetary magnetic field (IMF) is thought to merge with Earth’s geomagnetic field (GMF). After the reconnection process the newly formed magnetic flux tube, consisting of both the IMF and GMF, moves anti-sunward. Poleward-moving auroral forms (PMAFs) are believed to be the ionospheric signatures of this process, which transfers magnetic flux from the dayside to the nightside. This paper looks at the connection between the solar wind speed and the motion of the PMAF as it moves from the auroral oval, anti-sunward, into the polar cap. PMAFs are identified using both the meridian scanning photometer (MSP) and colored all-sky camera (ASC). Once the PMAFs are identified, the PMAF-SLOPE,
1 Introduction
The solar-terrestrial interaction provides an astrophysical laboratory to study how a star interacts with a magnetized planet. During this interaction, magnetic flux is transferred from the dayside to the nightside via magnetic reconnection when the interplanetary magnetic field (IMF) merges with a geomagnetic field (GMF) on the dayside magnetopause. As the IMF moves anti-sunward, it drags the newly formed flux tube (IMF + GMF) towards the nightside.
Dungey (1961) first suggested that magnetic reconnection takes place at two magnetic neutral lines: one at the sub-solar magnetopause and the other in the geomagnetic tail. This process is now believed to be the main mechanism for the transfer of solar wind momentum and energy into the magnetosphere. High latitude satellite observations were first used to identify magnetic reconnection at the dayside magnetopause (Haerendel et al., 1978; Russell and Elphic, 1978). Haerendel et al. (1978) used HEOS 2 observations to conclude that reconnection could be an “intermittent, localized process which does not lead to the buildup of a regular boundary flow”. Russell and Elphic [1979]; CT Russell and Elphic [1978] using USEE 1 and 2 magnetometer data identified flux transfer events (FTEs). Statistical studies (Berchem and Russell, 1984; Daly et al., 1984; Paschmann et al., 1982; Rijnbeek et al., 1984; Saunders et al., 1984) of FTEs have borne out observed signatures, spatial location of occurrences, and the relation of solar wind parameters for these reconnection events. The above mentioned studies of FTEs show that they 1) are spatially localized, (Russell and Elphic, 1979), 2) are of short time duration, (Russell and Elphic, 1979), 3) have a bipolar signature of the magnetic normal component normal to the magnetopause, Bn, (Daly et al., 1984; Rijnbeek et al., 1984; Russell and Elphic, 1979), 4) sometimes have a twisted core magnetic field (Saunders et al., 1984), 5) are on the order of one Earth radius in the direction normal to the magnetopause (Rijnbeek et al., 1984; Saunders et al., 1984), 6) have a mixture of magnetospheric and magnetosheath plasmas (Paschmann et al., 1982), 7) have an average of ≈8 min between events (Lockwood and Wild, 1993; Rijnbeek et al., 1984), 8) occur mainly when the IMF Bz-component is southward, but there have been very few events observed when the IMF Bz is northward (Berchem and Russell, 1984).
During the southward turning of the IMF Bz-component the merging rate on the dayside increases (Newell and Meng, 1987) leading to the erosion of the dayside magnetopause. Aubry et al. (1970) reported inward motion of the magnetopause of ≈2RE in 2 h from Ogo 5 satellite observations. This inward motion of the magnetopause is associated with a change in the IMF Bz-component, from Bz>0 to Bz<0, and since the inward movement is not associated with a compression of the magnetospheric cavity, they concluded that magnetic flux was being transferred from the dayside magnetopause to the magnetotail (Aubry et al., 1970). Meng [1970] also reported the inward movement of the dayside magnetopause from its nominal position, from IMP 2 data, during the occurrences of polar substorms.
Measurements of the polar cusp position by low altitude satellites have shown that the boundary of the cusp moves equatorward for the southward turning of the IMF Bz-component (Burch, 1973; Friis-Christensen, 1986; Meng, 1983; Newell and Meng, 1987; Newell et al., 1989; Russell et al., 1971). Newell and Meng [1987] stated that the cusp narrows for the IMF Bz <0 and attribute this to enhanced tailward convection of magnetic flux.
Observations of the dayside auroral oval from ground observations (Feldsten and Starkov, 1967; Horwitz and Akasofu, 1977; Sandholt et al., 1986; Sandholt et al., 1989) showed that the dayside auroral oval shifts equatorward(poleward) when the IMF Bz-component is negative(positive). During the periods when the dayside auroral oval is expanding, poleward-moving auroral forms (PMAFs) are observed moving away from the dayside auroral oval into the polar cap (Drury et al., 2003; Fasel et al., 1994b; Fasel et al., 1992; Horwitz and Akasofu, 1977; Sandholt et al., 1986; Vorobjev et al., 1975; Xing et al., 2012) Both Vorobjev et al. (1975) and (Horwitz and Akasofu, 1977) attributed these PMAFs to magnetic flux being eroded from the dayside magnetopause and transported antisunward.
Combined ground-based optical and low altitude satellites observations have shown optical auroral events moving from the region with cusp/low-latitude boundary particle precipitation into that of mantle precipitation (Denig et al., 1993; Sandholt et al., 1993). Elphic et al. (1990) reported the first direct link of FTEs to PMAFs by using simultaneous ISEE spacecraft, radar, and ground optical data.
A few studies have connected the antisunward motion of the PMAFs with plasma flow via radar data, as they move from the dayside auroral oval into the polar cap [Oksavik et al., 2005; P E Sandholt et al., 1990]. Pudovkin et al. (1996) related the speed of the PMAF to the magnetopause electric field intensity. Kan and Lee [1979] found an expression for the polar cap electric field (
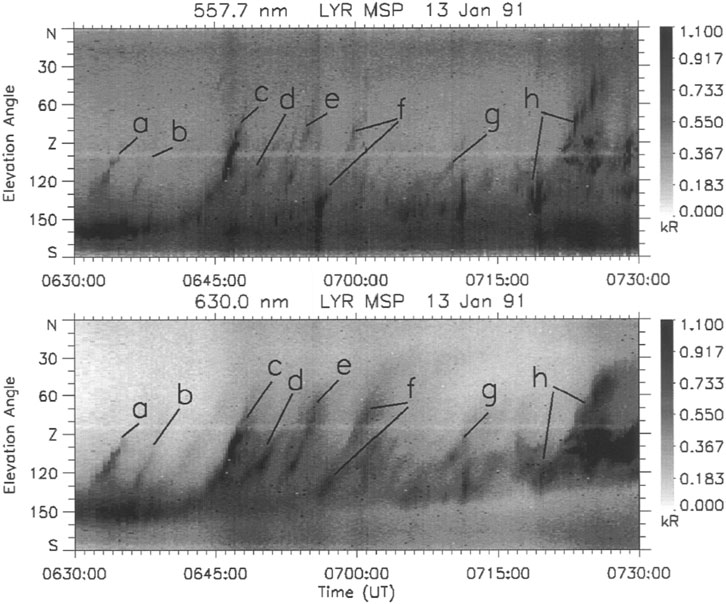
FIGURE 1. MSP grayscale plot showing the intensity of the [OI] 557.7 nm (top panel) and [OI] 630.0 nm (bottom panel) emissions for 13 January 1991 from Longyearbyen, Norway. The auroral line emission intensities are plotted as a function of the elevation angle along the magnetic meridian. Poleward-moving auroral forms (PMAFs) are indicated by lower case letters. Note that each PMAF (a, b, c, d, e, f, g, and h) have approximately the same slant signature, making an angle αPMAF (which will be measured in this study) with the horizontal axis (Time axis) of the MSP emission plots, for the specific aspect ratio and axes ranges of the above plots.
Figure 2 represents an MSP plot, with the black line representing a PMAF signature. αPMAF is angle the PMAF makes with the horizontal (Time) axis of the MSP emission plots. NOTE: this angle is dependent upon the choice of aspect ratio and the axis ranges of the emission plots. The PMAF-SLOPE,
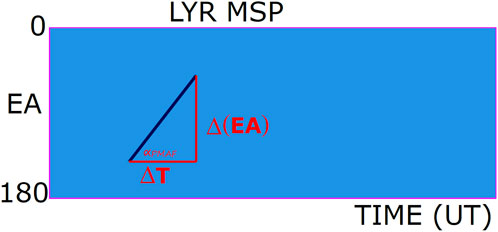
FIGURE 2. A Meridian Scanning Photometer (MSP) plot is represented by the above cartoon. The elevation angle (EA), where the MSP sweeps through 0–180° every 8 s, is the vertical axis. Time (in UT) is the horizontal axis. The black slanted line represents a PMAF. αPMAF is the angle the black slanted line (PMAF) makes with the time axis for the specific plot panels used here. The PMAF-SLOPE is defined by
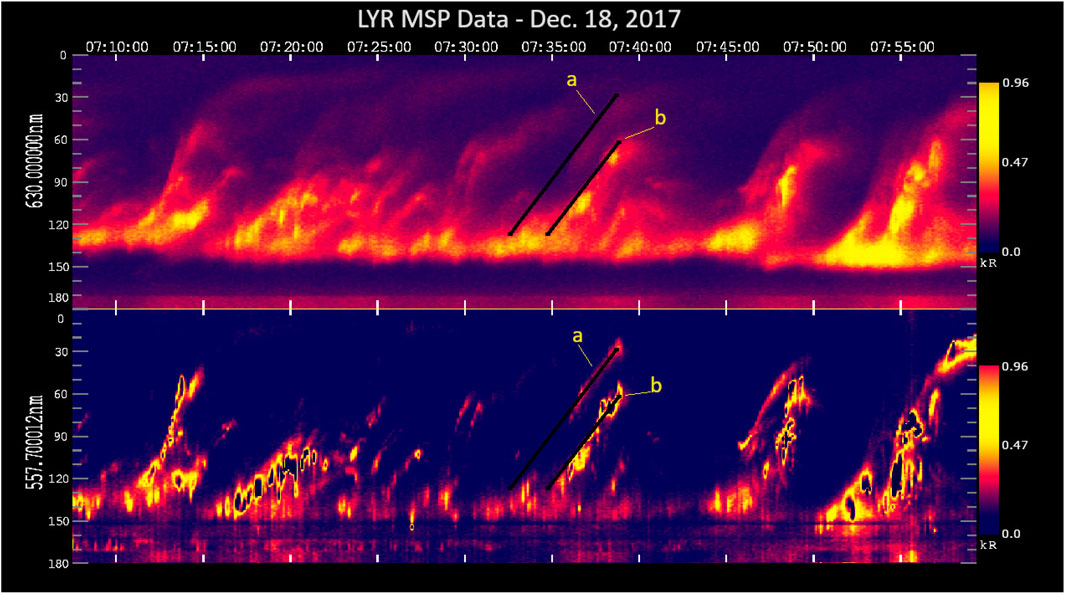
FIGURE 3. MSP plot showing the intensity of the [OI] 630.0 nm (top panel) and [OI] 557.7 nm (bottom panel) emissions for 18 December 2017 from the Kjell Henriksen Observatory; Longyearbyen, Norway. The axes are the same as Figure 1. PMAFs are labeled a and b. The black lines are drawn between the start and end times of each PMAF event. These times are obtained using both the MSP and ASC data. The PMAF-SLOPE,
2 Ground-based optical and satellite data
The Meridian Scanning Photometer (MSP) and BACC colored All-Sky Camera (ASC) are located at the Kjell Henriksen Observatory, located in Longyearbyen, Svalbard (GEO:
The PMAF emissions from the [OI] 630.0 nm red line and the [OI] 557.7 nm green line are analyzed using the meridian scanning photometer (MSP) (Fasel et al., 1994a). Auroral line emission intensities are plotted as function of the elevation angle along the magnetic meridian. The MSP has a spatial resolution of 1° and makes a scan along the magnetic meridian, from the southern to the northern horizon, every 8 s. A plot is constructed using the elevation angle and the time in UT. Figures 1, 3 are MSP emission plots, each containing several PMAFs. Each figure contains both the [OI] 557.7 nm green line emission and the [OI] 630.0 nm red line emission. The PMAF events, in both the ASC and MSP, are identified by lower case letters; see Figures 1, 3. Every PMAF event originates at the dayside auroral oval which was south of the zenith and then moves anti-sunward into the polar cap. The drawn slanted lines on the MSP in Figure 3 indicate motion, similar to a distance versus time graph. The PMAF-SLOPE,
The ASC instrument is designed to capture the visible part of the electromagnetic spectrum, 4,000–7,000 Å and captures the evolution of each PMAF as it moves into the polar cap (Fasel and Sigernes, 2022). The PMAF never loses its identity during its lifetime, i.e., the poleward moving auroral arc or rayed band never disappeared from the optical instruments and then appeared again further north of its previous position. Observations are restricted to the dayside between 0630 and 1030 UT, so that the data collected are due to the direct interaction between the solar wind and the magnetopause. Figure 4 (A–I) shows the evolution of PMAF events a and b. Figure 4A shows the start of PMAF event a at 07:32:00 UT. By 07:32:25 UT PMAF event a is moving poleward. In Figure 4B, the auroral oval begins to brighten on the poleward edge in the east (E). Figure 4C at 07:35:30 UT, shows PMAF event a crossing the zenith (W-E line) with PMAF event b just leaving the expanded dayside auroral oval. Also notice in Figure 4C how the brightening in PMAF event b has westward when compared to Figure 4B. Figures 4D–F shows both PMAF events a and b propagating anti-sunward, towards the northwest (NW, geographical). PMAF events a and b can be observed fading in brightness as they propagate anti-sunward in frames 4G-I. PMAF event b does not drift as far as PMAF event b. This can also be observed in the MSP emission plots in Figure 3. Both PMAF events (a and b) are labeled on the MSP plot in Figure 3.
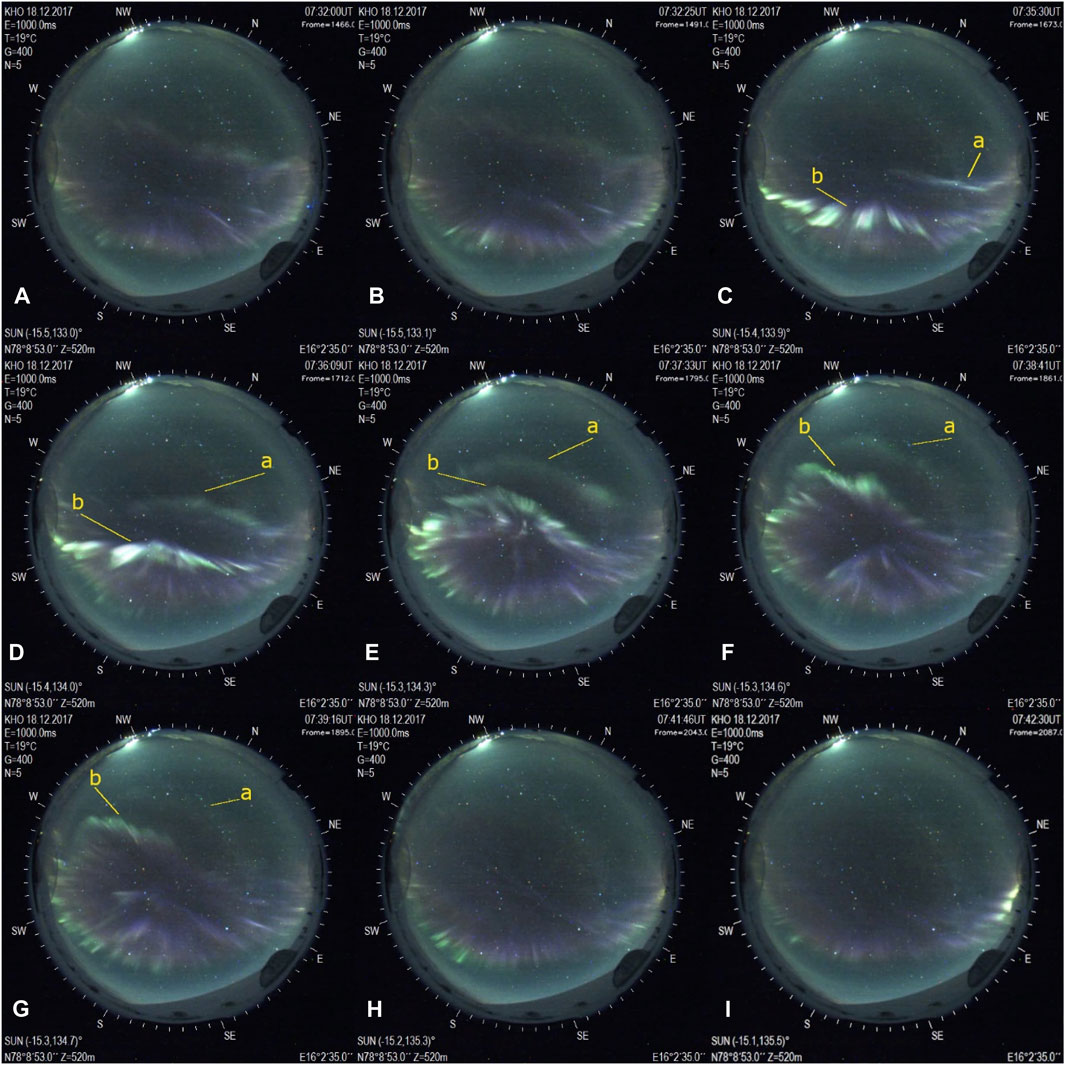
FIGURE 4. All-sky camera images are from the Kjell Henriksen Observatory in Longyearbyen, Norway for 18 December 2017. PMAF events are indicated by a and b, which are yellow in color. Each frame is labeled with capital letter, (A-I). these labels represent the time evolution of the PMAF events a and b. 4B shows the begininning of pmaf event A, at the poleward edge of the dayside auroral oval. (G-I) show PMAF events a and b fading from view at the end of their anti-sunward journey. These are the same PMAF events indicated in the MSP plot in Figure 5.
Satellite shifted to bow shock-nose (BSN) data from WIND, ACE, and DSCOVR are used to determine the solar wind speed for each PMAF event. The x-component
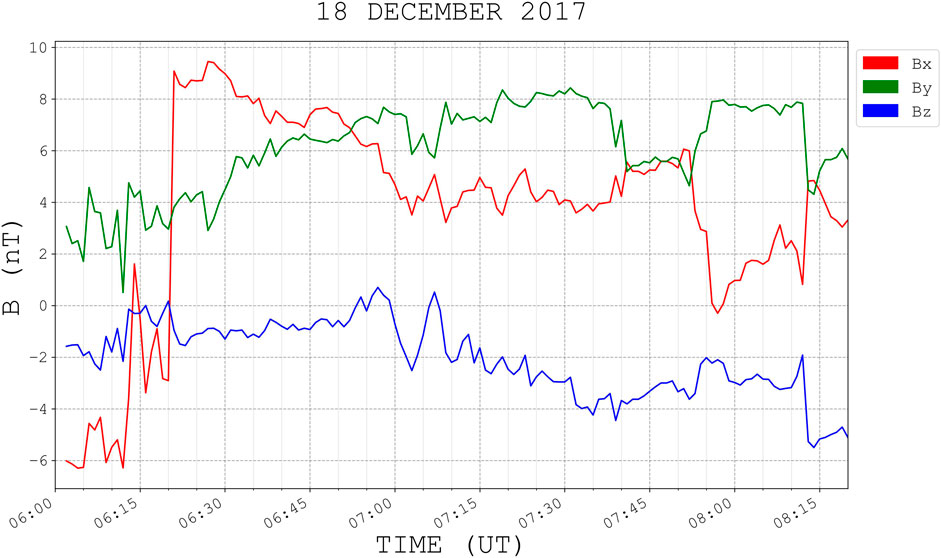
FIGURE 5. IMF data [1 min bow shock-nose (BSN)-time shifted data] from DSCOVR spacecraft (XGSE≈ 231.36 RE, YGSE≈ 39.58 RE, ZGSE≈ −4.7 RE) for 18 December 2017: IMF components.
Figure 5 is the calculated clock angle between 06:00 UT and 08:20 UT. The IMF clock angle
Figure 5 contains 21 PMAFs generated (18 December 2017) during the clock angle interval in Figure 6. Two (PMAF events a and b) of the fifty-seven PMAF events are shown in Figures 3, 4 (MSP, ASC). The 57 events ( day and start time for each event) used in this study are found in Table 1.
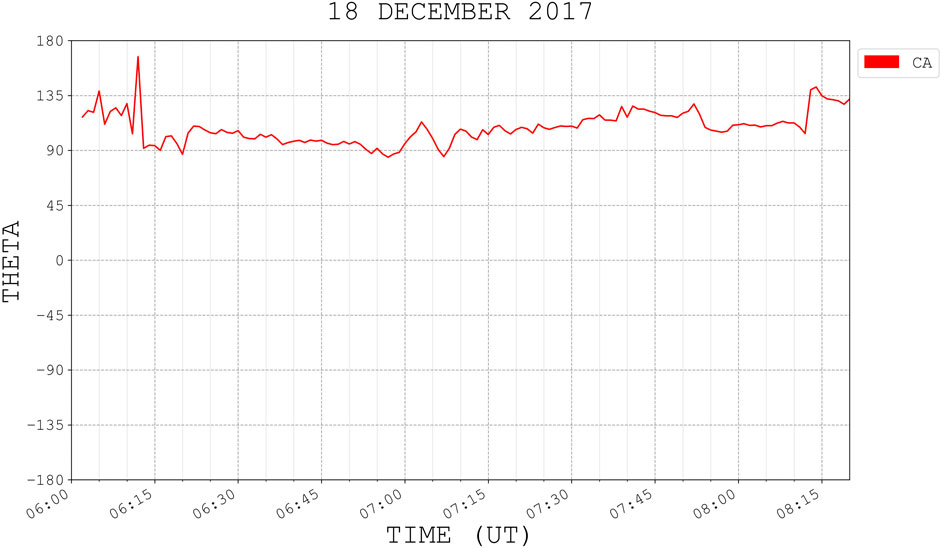
FIGURE 6. The clock angle (CA in red) obtained from the IMF data in Figure 5. 21 PMAFs in Figure 6 occurred during this interval, which was favorable for dayside magnetic reconnection and
The x-component of the solar wind speed,
3 Analysis
All of the PMAF events for this study were identified using both the meridian scanning photometer (MSP) and the colored ASC. Note that the PMAFs for each day have a similar slanted signature, see Figure 1 for multiple examples of PMAFs during a 1-h interval. This indicates that PMAF events for each interval move at roughly the same rate through the polar cap away from the dayside auroral oval. This study will compare the PMAF-SLOPE and αPMAF, the angle the slanted PMAF signatures make with respect to with the horizontal (time axis) on the MSP plot panels (see Figures 1–3), with the
This study contains 57 PMAFs. The PMAFs’ start and stop times were determined using both the [OI] 557.7 nm green line emission, the [OI] 630.0 nm red line emissions and the colored all-sky camera. A density plot from the colored ASC (Fasel and Sigernes, 2022) was made for each PMAF event. First, the ASC data were used to identify the PMAFs. To identify the PMAF on the MSP, both the ASC and density plot for each PMAF event are used to determine when the PMAF begins to separate from the dayside auroral oval and move anti-sunward. The MSP intensities were varied until a clear starting point on each emission plot was determined and could be correlated with the beginning of the poleward motion of the PMAF on the ASC and density plots. Initially, the [OI] 557.7 nm green line emission is used to identify the start and stop times of the PMAF events. The [OI] 630.0 nm red line emission is also viewed to see if a similar start and stop time matched the green line emission. Several points were selected for each PMAF event to determine its slanted line signature on the MSP. After the PMAF slanted line is identified on the MSP, two points are selected (start and stop) to find
After
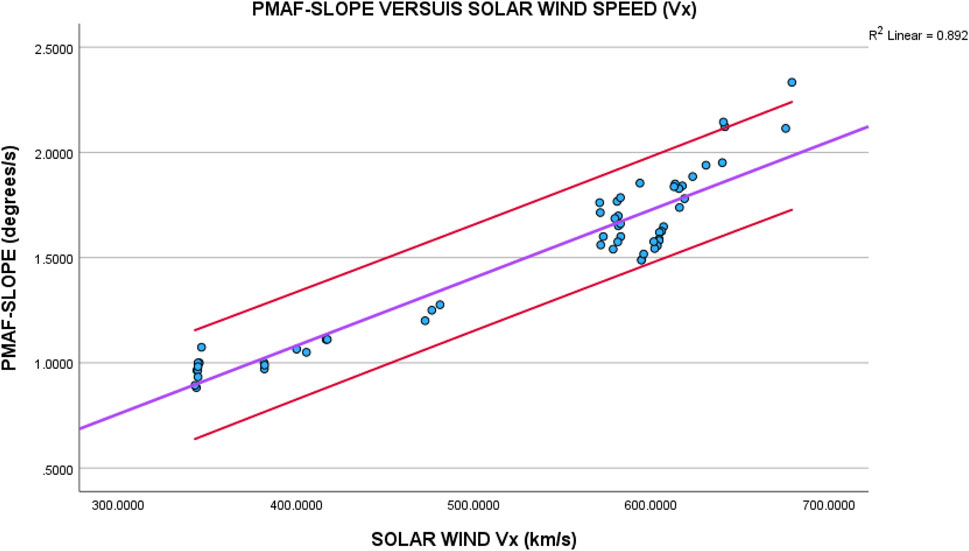
FIGURE 7. The horizontal axis of this plot contains the average solar wind speed (
Figure 8 plots αPMAF against the solar wind flow speed
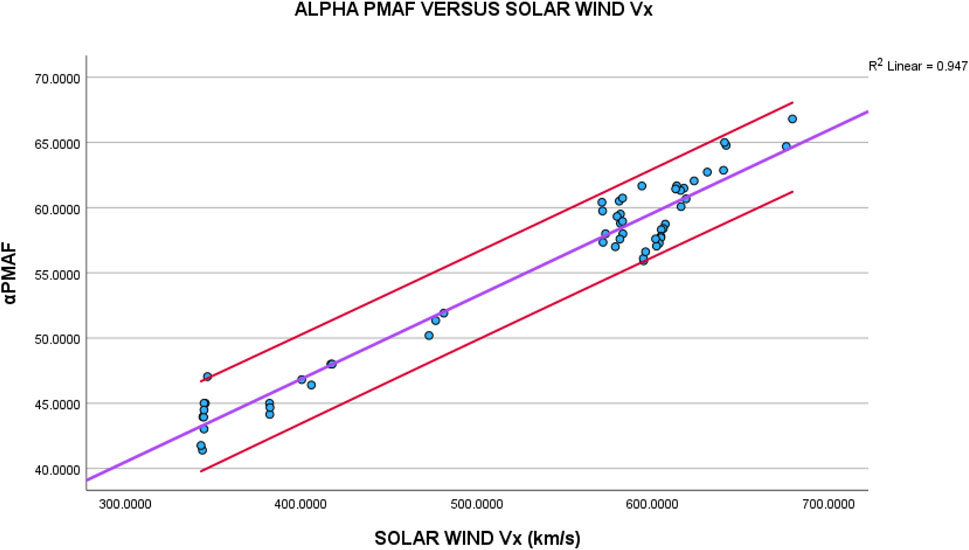
FIGURE 8. The horizontal axis of this plot contains the average solar wind speed (
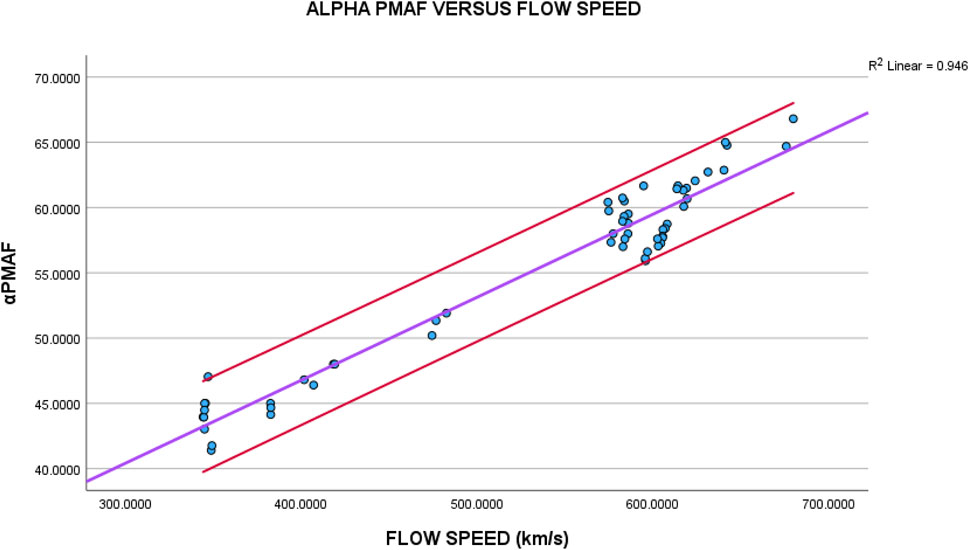
FIGURE 9. The horizontal axis of this plot contains the average solar wind flow speed
4 Discussion and conclusion
Magnetic reconnection at the subsolar magnetopause occurs when the IMF Bz component turns southward, Bz>0 to Bz<0. This process provides a number of observable events as shown by numerous satellite and ground observations:
(1) Earthward displacements of the dayside magnetopause (Aubry et al., 1970; Meng, 1970),
(2) Equatorward displacements of the cusp (Burch, 1973; Meng, 1983; Newell et al., 1989; Russell et al., 1971),
(3) Equatorward displacement of the dayside auroral oval (Feldsten and Starkov, 1967; Horwitz and Akasofu, 1977; Sandholt et al., 1986),
One would expect to observe ionospheric signatures generated from magnetic reconnection at the subsolar magnetopause which causes the above three displacements (Drury et al., 2003; Fasel, 1995; Horwitz and Akasofu, 1977; Sandholt et al., 1990; Vorobjev et al., 1975; Xing et al., 2012). PMAFs are considered as possible candidates for ionospheric signatures of magnetic flux erosion from the dayside magnetopause (Fasel, 1995; Fasel et al., 1993; Lockwood, 1991; Sandholt et al., 1986; Vorobjev et al., 1975).
If PMAFs are the result of magnetic reconnection, their movement into the polar cap should be dependent on the solar wind speed. Figures 7–9 provide very good linear relationships between PMAFs and the solar wind speed (either
The following statement can be made regarding this analysis: the anti-sunward movement of the PMAFs into the polar cap depends on the solar wind speed (either the flow speed or the
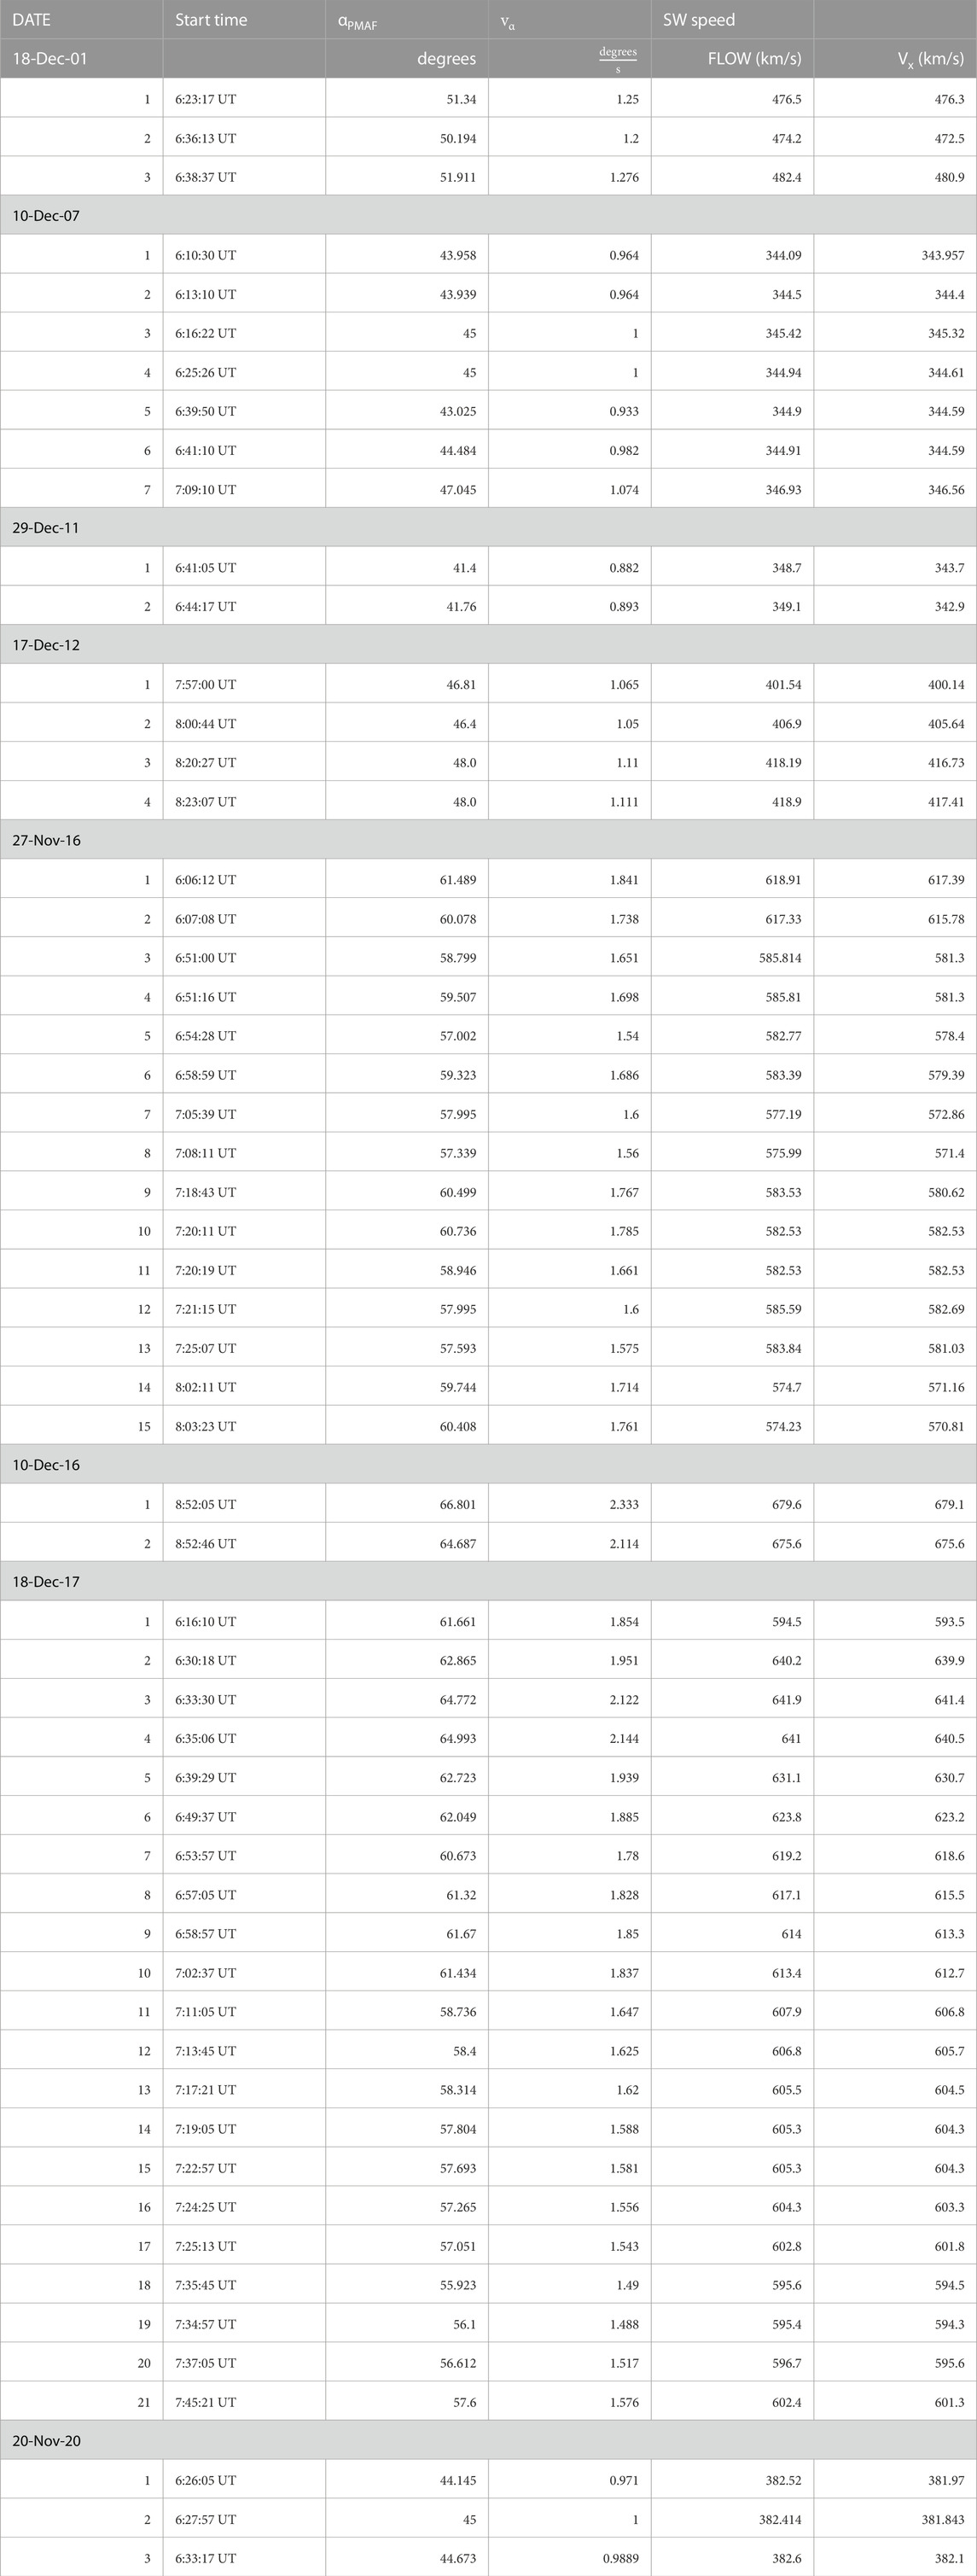
TABLE 1. The 57 PMAF events used in this study, which includes the date, start time, αPMAF,
The strong correlation obtained from this study strongly suggests that PMAFs are indeed the ionospheric footprints of a newly formed magnetic flux tube due to dayside magnetic reconnection. The following conclusions are obtained from this statistical study:
(i) the PMAF-SLOPE
(ii) αPMAF is highly correlated (
(iii) PMAFs must be connected to both the IMF and GMF and are dragged anti-sunward, mostly by the
(iv) PMAF’s are indeed the ionospheric footprints of a newly formed magnetic flux tube, due to dayside magnetic reconnection, being transferred from the dayside to nightside (Horwitz and Akasofu, 1977; Vorobjev et al., 1975).
Data availability statement
The datasets presented in this study can be found in online repositories. The names of the repository/repositories and accession number(s) can be found in the article/Supplementary Material.
Author contributions
GF: Designed the study analyzed data, and wrote the manuscript. LL: Collaborated and provided edits to the manuscript. EL: Analyzed data. DC: Analyzed data. BY: Wrote software to analyze data. OB: Formal analysis, Writing–original draft. JB: Data curation, Formal analysis, Writing–original draft and Analyzed data. SL: Provided satellite data. JM: Wrote software to analyze all-sky camera data. FS: Provided the all-sky camera data. DL: Provided meridian scanning photometer data. All authors contributed to the article and approved the submitted version.
Funding
KECK Grant: Funded student researcher’s during the Academic year and summer research.
Acknowledgments
The authors would like to thank FS and DL for use of the All-sky camera data archived at the Kjell Henriksen Observatory. More information on the Boreal Aurora Camera Constellation is also available via this link: http://kho.unis.no/. GF would like to thank Stephen Mende and Yen-Jung Wu (Space Sciences Laboratory, University of California, Berkeley) for their helpful discussions. The authors would like to thank FS, Chief Scientist at the Kjell Henriksen Observatory, for the ground-based optical data (all-sky camera and meridian scanning photometer). The authors would also like to thank NASA for providing access to their satellite data.
Conflict of interest
The authors declare that the research was conducted in the absence of any commercial or financial relationships that could be construed as a potential conflict of interest.
Publisher’s note
All claims expressed in this article are solely those of the authors and do not necessarily represent those of their affiliated organizations, or those of the publisher, the editors and the reviewers. Any product that may be evaluated in this article, or claim that may be made by its manufacturer, is not guaranteed or endorsed by the publisher.
References
Aubry, M. P., Russell, C. T., and Kivelson, M. G. (1970). Inward motion of the magnetopause before a substorm. J. Geophys. Res. 75 (34), 7018–7031. doi:10.1029/JA075i034p07018
Berchem, J., and Russell, C. T. (1984). Flux transfer events on the magnetopause: spatial distribution and controlling factors. J. Geophys. Res. Space Phys. 89 (A8), 6689–6703. doi:10.1029/JA089iA08p06689
Burch, J. L. (1973). Rate of erosion of dayside magnetic flux based on a quantitative study of the dependence of polar cusp latitude on the interplanetary magnetic field. Radio Sci. 8 (11), 955–961. doi:10.1029/RS008i011p00955
Daly, P. W., Saunders, M. A., Rijnbeek, R. P., Sckopke, N., and Russell, C. T. (1984). The distribution of reconnection geometry in flux transfer events using energetic ion, plasma and magnetic data. J. Geophys. Res. Space Phys. 89 (A6), 3843–3854. doi:10.1029/JA089iA06p03843
Denig, W. F., Burke, W. J., Maynard, N. C., Rich, F. J., Jacobsen, B., Sandholt, P. E., et al. (1993). Ionospheric signatures of dayside magnetopause transients: a case study using satellite and ground measurements. J. Geophys. Res. Space Phys. 98 (A4), 5969–5980. doi:10.1029/92JA01541
Drury, E. E., Mende, S. B., Frey, H. U., and Doolittle, J. H. (2003). Southern Hemisphere poleward moving auroral forms. J. Geophys. Res. Space Phys. 108 (A3). doi:10.1029/2001ja007536
Dungey, J. W. (1961). Interplanetary magnetic field and the auroral zones. Phys. Rev. Lett. 6 (2), 47–48. doi:10.1103/PhysRevLett.6.47
Elphic, R. C., Lockwood, M., Cowley, S. W. H., and Sandholt, P. E. (1990). Flux transfer events at the magnetopause and in the ionosphere. Geophys. Res. Lett. 17 (12), 2241–2244. doi:10.1029/GL017i012p02241
Fasel, G. J. (1995). Dayside poleward moving auroral forms: a statistical study. J. Geophys. Res. Space Phys. 100 (A7), 11891–11905. doi:10.1029/95ja00854
G. J. Fasel, L. C. Lee, and R. Smith (Editors) (1995). Dayside poleward moving aurroal forms: a brief review (Washingto, D.C: American Geophysical Union), 439–447. doi:10.1029/GM090p0439
Fasel, G. J., Lee, L. C., and Smith, R. W. (1993). A mechanism for the multiple brightenings of dayside poleward-moving auroral forms. Geophys. Res. Lett. 20 (20), 2247–2250. doi:10.1029/93GL02487
Fasel, G. J., Minow, J. I., Smith, R. W., Deehr, C. S., and Lee, L. C. (1992). Multiple brightenings of transient dayside auroral forms during oval expansions. Geophys. Res. Lett. 19 (24), 2429–2432. doi:10.1029/92GL02103
Fasel, J. M., and Sigernes, F. (2022). “Chapter 5 - magnetospheric imaging via ground-based optical instruments,” in Understanding the Space environment through global measurements. Editors Y. Colado-Vega, D. Gallagher, H. Frey, and S. Wing (China: Elsevier), 217–229. doi:10.1016/B978-0-12-820630-0.00001-5
Fasel, L., Minow, J. I., Lee, L. C., Smith, R. W., and Deehr, C. S. (1994a), Poleward-moving auroral forms: what do we really know about them? in Physical signatures of magnetospheric boundary layer processes. NATO ASI series (series C: mathematical and physical Sciences), edited by E. A. Holtet, pp. 211–226. Springer, Dordrecht. doi:10.1007/978-94-011-1052-5_15
Fasel, L., Minow, J. I., Smith, R. W., Deehr, C. S., and Lee, L. C. (1994b). “Multiple brightenings of poleward-moving dayside auroral forms,” in Solar wind sources of magnetospheric ultra-low-frequency waves. Editors K. T. M. Engebretson, and M. Scholer (USA: ANGEO), 201–211. doi:10.1029/GM081p0201
Feldsten, Y. I., and Starkov, G. V. (1967), Dynamics of auroral belt polar geomagnetic disturbances, 209–229. doi:10.1016/0032-0633(67)90190-0
Fisher, R. A., and Yates, F. (1963). Statistical tables for biological, agricultural and medical research. 6th ed. Edinburgh: Oliver & Boyd.
Friis-Christensen, E. (1986), Solar wind control of the polar cusp, in Sol. Wind Magnetos. Coupling, edited, p. 423. doi:10.1007/978-90-277-2303-1_31
Haerendel, G., Paschmann, G., Sckopke, N., Rosenbauer, H., and Hedgecock, P. C. (1978). The frontside boundary layer of the magnetosphere and the problem of reconnection. J. Geophys. Res. Space Phys. 83 (A7), 3195–3216. doi:10.1029/JA083iA07p03195
Horwitz, J. L., and Akasofu, S.-I. (1977). The response of the dayside aurora to sharp northward and southward transitions of the interplanetary magnetic field and to magnetospheric substorms. J. Geophys. Res. 82 (19), 2723–2734. doi:10.1029/JA082i019p02723
Kan, J. R., and Lee, L. C. (1979). Energy coupling function and solar wind-magnetosphere dynamo. Geophys. Res. Lett. 6 (7), 577–580. doi:10.1029/GL006i007p00577
Lockwood, M. (1991). The excitation of ionospheric convection. J. Atmos. Terr. Phys. 53 (3), 177–199. doi:10.1016/0021-9169(91)90103-E
Lockwood, M., and Wild, M. N. (1993). On the quasi-periodic nature of magnetopause flux transfer events. J. Geophys. Res. Space Phys. 98 (A4), 5935–5940. doi:10.1029/92ja02375
Meng, C. I. (1970). Variation of the magnetopause position with substorm activity. J. Geophys. Res. 75 (16), 3252–3254. doi:10.1029/JA075i016p03252
Meng, C. I. (1983). Case studies of the storm time variation of the polar cusp. J. Geophys. Res. Space Phys. 88 (A1), 137–149. doi:10.1029/JA088iA01p00137
Newell, P. T., and Meng, C.-I. (1987). Cusp width and Bz: observations and a conceptual model. J. Geophys. Res. Space Phys. 92 (A12), 13673–13678. doi:10.1029/JA092iA12p13673
Newell, P. T., Meng, C.-I., Sibeck, D. G., and Lepping, R. (1989). Some low-altitude cusp dependencies on the interplanetary magnetic field. J. Geophys. Res. Space Phys. 94 (A7), 8921–8927. doi:10.1029/JA094iA07p08921
Oksavik, K., Moen, J., Carlson, H., Greenwald, R., Milan, S., Lester, M., et al. (2005). Multi-instrument mapping of the small-scale flow dynamics related to a cusp auroral transient. Ann. Geophys. 23, 2657–2670. doi:10.5194/angeo-23-2657-2005
Paschmann, G., Haerendel, G., Papamastorakis, I., Sckopke, N., Bame, S. J., Gosling, J. T., et al. (1982). Plasma and magnetic field characteristics of magnetic flux transfer events. J. Geophys. Res. Space Phys. 87 (A4), 2159–2168. doi:10.1029/JA087iA04p02159
Pudovkin, M. I., Zaitseva, S. A., Sandholt, P., and Egeland, A. (1996). Relationship between the cusp aurora poleward motion velocity and solar wind parameters, 737.
Rijnbeek, R. P., Cowley, S. W. H., Southwood, D. J., and Russell, C. T. (1984). A survey of dayside flux transfer events observed by ISEE 1 and 2 magnetometers. J. Geophys. Res. Space Phys. 89 (A2), 786–800. doi:10.1029/JA089iA02p00786
Ross, S. M. (2014). “Chapter 9 - regression,” in Introduction to probability and statistics for engineers and scientists Editor S. M. Ross Fifth Edition (Boston: Academic Press), 357–444. doi:10.1016/B978-0-12-394811-3.50009-5
Russell, C. T., Chappell, C. R., Montgomery, M. D., Neugebauer, M., and Scarf, F. L. (1971). Ogo 5 observations of the polar cusp on November 1, 1968. J. Geophys. Res. 76 (28), 6743–6764. doi:10.1029/JA076i028p06743
Russell, C. T., and Elphic, R. C. (1978). Initial ISEE magnetometer results: magnetopause observations. Space Sci. Rev. 22 (6), 681–715. doi:10.1007/bf00212619
Russell, H., and Elphic, R. C. (1979). ISEE observations of flux transfer events at the dayside magnetopause. Geophys. Res. Lett. 6 (1), 33–36. doi:10.1029/GL006i001p00033
Sandholt, P. E., Lockwood, M., Oguti, T., Cowley, S. W. H., Freeman, K. S. C., Lybekk, B., et al. (1990). Midday auroral breakup events and related energy and momentum transfer from the magnetosheath. J. Geophys. Res. Space Phys. 95 (A2), 1039–1060. doi:10.1029/JA095iA02p01039
Sandholt, P. E., Lybekk, B., Egeland, A., Nakamura, R., and Oguti, T. (1989). Midday auroral breakup. J. geomagnetism Geoelectr. 41 (4), 371–387. doi:10.5636/jgg.41.371
Sandholt, P. E., Moen, J., Opsvik, D., Denig, W. F., and Burke, W. J. (1993). Auroral event sequence at the dayside polar cap boundary: signature of time-varying solar wind-magnetosphere-ionosphere coupling. Adv. Space Res. 13 (4), 7–15. doi:10.1016/0273-1177(93)90305-U
SandholtDeehr, C. S. A., Egeland, B., Lybekk, R., Romick, G. J., and Viereck, R. (1986). Signatures in the dayside aurora of plasma transfer from the magnetosheath. J. Geophys. Res. Space Phys. 91 (A9), 10063–10079. doi:10.1029/JA091iA09p10063
Saunders, M. A., Russell, C. T., and Sckopke, N. (1984). Flux transfer events: scale size and interior structure. Geophys. Res. Lett. 11 (2), 131–134. doi:10.1029/GL011i002p00131
Vorobjev, V. G., Gustafsson, G., Starkov, G. V., Feldstein, Y. I., and Shevnina, N. F. (1975). Dynamics of day and night aurora during substorms. Planet. Space Sci. 23 (2), 269–278. doi:10.1016/0032-0633(75)90132-4
Xing, Z. Y., Yang, H., Han, D., Wu, Z., Hu, Z., Zhang, Q., et al. (2012). Poleward moving auroral forms (PMAFs) observed at the Yellow River Station: a statistical study of its dependence on the solar wind conditions. J. Atmos. Solar-Terrestrial Phys. 86, 25–33. doi:10.1016/j.jastp.2012.06.004
Zhang, L., Wang, C., Wang, J. Y., and Lui, A. (2019). Statistical properties of the IMF clock angle in the solar wind with northward and southward interplanetary magnetic field based on ACE observation from 1998 to 2009: dependence on the temporal scale of the solar wind. Adv. Space Res. 63, 3077–3087. doi:10.1016/j.asr.2019.01.023
Keywords: magnetosphere, reconnection, solar wind, ionosphere, transients
Citation: Fasel GJ, Lee LC, Lake E, Csonge D, Yonano B, Bradley O, Briggs J, Lee SH, Mann J, Sigernes F and Lorentzen D (2024) Correlation between the solar wind speed and the passage of poleward-moving auroral forms into the polar cap. Front. Astron. Space Sci. 10:1233060. doi: 10.3389/fspas.2023.1233060
Received: 01 June 2023; Accepted: 14 November 2023;
Published: 03 January 2024.
Edited by:
John C. Dorelli, National Aeronautics and Space Administration, United StatesReviewed by:
Kristina A. Lynch, Dartmouth College, United StatesShishir Priyadarshi, GMV NSL, United Kingdom
Copyright © 2024 Fasel, Lee, Lake, Csonge, Yonano, Bradley, Briggs, Lee, Mann, Sigernes and Lorentzen. This is an open-access article distributed under the terms of the Creative Commons Attribution License (CC BY). The use, distribution or reproduction in other forums is permitted, provided the original author(s) and the copyright owner(s) are credited and that the original publication in this journal is cited, in accordance with accepted academic practice. No use, distribution or reproduction is permitted which does not comply with these terms.
*Correspondence: G. J. Fasel, Z2Zhc2VsQHBlcHBlcmRpbmUuZWR1