 Xiukuo Sun1
 Shouding Li1,2*
 Juan Li2,3*
 Yanfang Wu1,4
 Shuo Zhang5Bo Zheng1,2Zhaobin Zhang1,2Tao Xu1,2Xinshuo Chen1,2Yiming Diao1,2
- 1Key Laboratory of Shale Gas and Geoengineering, Institute of Geology and Geophysics, Chinese Academy of Sciences, Beijing, China
- 2College of Earth and Planetary Sciences, University of Chinese Academy of Sciences, Beijing, China
- 3Key Laboratory of Earth and Planetary Physics, Institute of Geology and Geophysics, Chinese Academy of Sciences, Beijing, China
- 4School of Mathematics, North University of China, Taiyuan, China
- 5Aerospace Information Research Institute, Chinese Academy of Sciences, Beijing, China
The rock characteristic and size–frequency distribution (SFD) on Mars are important for understanding the geologic and geomorphic history of the surface, for evaluating the trafficability of roving, and for planning the potential infrastructure construction. Tianwen-1, China’s first autonomous Mars exploration mission, formed an excavated depression during touchdown, which has been the deepest depression on the Martian surface so far compared with others. According to the images captured using the Navigation and Terrain Cameras (NaTeCams) onboard the rover, Zhurong, the SFD of rocks is calculated and compared inside the excavated depression, within and out of the blast zone. For the first time, the rock size distribution inside the excavated depression is obtained, exposing the geological features of the shallow subsurface on Mars at a depth of tens of centimeters, which will surely be important for future drilling missions. It is found that the rock abundance in the depression is smaller than the original abundance on the surface, and the distribution of rocks in the blast zone on the surface is greatly influenced by the touchdown. In addition, based on the fractal dimension of rock sizes, the rocks (>10 mm) at the shallow subsurface of the Zhurong landing site may experience two different geological processes.
1 Introduction
The size–frequency distribution (SFD) of rocks has been widely investigated on the previous Mars exploration missions (Golombek et al., 1997; Golombek and Rapp, 1997; Golombek et al., 2003; Ward et al., 2005; Golombek et al., 2006; Grant et al., 2006; Golombek et al., 2008; Grant et al., 2011; Craddock and Golombek, 2016; Golombek et al., 2021; Wu et al., 2021; Chen et al., 2022; Wu et al., 2022). Since rock distributions result from the geological process, including impacts, volcanic activities, aeolian processes, and even water transportation, the SFD of rocks could be an important target for the Martian geological history (Craddock and Golombek, 2016; Chen et al., 2022) and past climate analysis (Kereszturi, 2012). In addition, it plays an important role in quantifying the hazards of spacecraft landing and evaluating the risks for rover moving (Golombek et al., 2003; Golombek et al., 2021). Furthermore, it is significant for planning the potential infrastructure construction on Mars for the future.
The Tianwen-1 probe is China’s first autonomous Mars exploration mission, which was launched on 23 July 2020 and then entered the Mars orbit on 10 February 2021. After circling Mars for more than 3 months, the Zhurong rover, which was onboard the Tianwen-1 lander, finally successfully landed in the lowland area of southern Utopia Planitia on Mars on 15 May 2021. Among all the six scientific instruments mounted on the Zhurong rover, the Navigation and Terrain Cameras (NaTeCams) are used to take photographs of the Martian surface to provide support for the guidance, navigation, and control of the rover. In addition, these photographs could also be used for scientific observations. The rock SFD analysis in this paper is all based on the pictures captured using NaTeCams.
During the landing process, due to the impact of the retro-rocket engine on the Martian surface, an excavated depression was formed just below the lander. Compared with other depressions caused by the plume surface interaction (PSI), this depression is the deepest with an excavated depth of ∼ 40 cm (Xu et al., 2023), exposing the shallow depth of the soil here and the geological information beneath the surface. Since the high-resolution imaging camera (HiRIC) on the orbit and NaTeCams on the ground both provide images of the surface, the high-frequency and low-frequency radar detect the zones with a depth of several meters to tens of meters below the surface, the depth range of tens of centimeters has not been detected yet, and the investigation on this exposed depression just makes up for the research gaps in this depth. Most importantly, the structure of soil and rocks at the subsurface will definitely be more important for future drilling missions (Baker and Carter, 2019; Altieri et al., 2023), such as the future ExoMars rover with 2-m-deep subsurface access (Kereszturi et al., 2016). It is inferred that subsurface sampling will also be significant in the prospective Mars exploration, for example, according to the China National Space Administration, the collection and return of samples on Mars will be accomplished around 2030, and the preliminary research has already begun (Wei, et al., 2018; Hou et al., 2019). Thus, the geological structure at this depth can provide an important basis for the selection of future landing sites (Kereszturi et al., 2016) and drilling missions.
Apart from the excavated depression, the region around the lander was also disturbed during Zhurong touchdown, which was called the blast zone. It is known that the blast zone is brighter, having extremely different photometric properties from the surroundings, which may result from the smoothing of the surface and the redistribution of fine particles (Clegg et al., 2012). This means that small particles in the blast zone might be blown away by the plume, which affected the rock distribution here.
Before Zhurong went dormant, it had driven 1,921 m in total for the last 361 Sols and kept taking photographs along its route. These photographs enlarge our view of the southern Utopia Planitia and provide more information about the Martian surface, including the rock characteristics and distributions. Therefore, in this paper, the rock SFD is calculated and compared inside the excavated depression, within and out of the blast zone, and the influence of touchdown is also analyzed. Finally, we attempt to discuss the fractal dimension of rock sizes and its potential indication briefly and preliminarily.
2 Methods
Below the lander, there is a depression excavated by the retrorocket during touchdown. The NaTeCams mounted on the Zhurong rover are binocular stereo cameras, which can capture a pair of photographs of the observed object through their two camera lenses, CamB and CamA, from slightly different perspectives at the same time. Such a pair of photographs of the depression (shot on sol 12) is shown in Figures 1A, B. After the adjustment of contrast, the depression of the pictures is enlarged so that it can be seen more clearly (Figures 1C, D). It is worth noting that only one large columnar-like rock block with a height > 15 cm (Xu et al., 2023) stands separately in the deep center of the depression and that other small rocks are all embedded in the wall.

FIGURE 1. Rocks in the excavated depression of Zhurong. (A) Image shot by CamB; (B) image shot by CamA; (C) depression enlarged from (A); and (D) depression enlarged from (B).
The calculation of the rock size and area includes four steps. The first step is the rock identification. Here, the regions of the excavated depression and inside rocks are outlined manually by brown and red lines (Figure 1C) for preparation. Second, based on the digital image correlation (DIC) algorithm (Blaber, 2023), the same depression region and rocks in the CamA image are matched automatically (Figure 1D). The size of the whole picture (Figures 1A, B) is 2048 × 2048 pixel. During automatic matching, a smaller area shown in Figure 1A, which is 300 × 300 pixel covering the depression, is selected. After tracking the features of this small area using the DIC algorithm, the matching area is shown in Figure 1B, and the displacement between them is calculated. According to this displacement of the small area, the displacement of each pixel within this area is also obtained, and the matching pixels in Figure 1B are found one by one. Based on the automatic matching of pixels, the third step is followed subsequently. According to the stereo vision 3D reconstruction method (Zhang et al., 2017; Zhang et al., 2020; Zhang et al., 2022), the 3D coordinates (X, Y, and Z) in the CamB coordinate system of each pixel with the corresponding root mean square error are calculated. To ensure the accuracy of the calculation, the pixel coordinates whose root mean square errors are larger than 1.0 mm were deleted and replaced based on the interpolation method. Furthermore, if the distance between the pixel and the CamB projection center along the optical axis (optical axis distance, represented by coordinate Z) is larger than 8.0 m, then this pixel was also excluded from the calculation. At last, the areas and sizes of rocks are computed. Since there is no notable evidence proving that the rocks are arranged in a specific direction, the observed apparent width is considered an average sample of the actual rock diameter (Golombek et al., 2021), which is the length in the horizontal direction of each rock. We chose this length as the rock size. According to the 3D coordinates, the areas of the three-dimensional surface of the outlined rocks and depression are also calculated. Thus, an important parameter reflecting the richness of rocks—rock abundance—is obtained, which equals the ratio of total rock areas to the depression area.
The blast zone (Figure 2A) is the region around the lander that was disturbed during descent (Clegg et al., 2012). For Tianwen-1, it was approximately 88.21 m wide and 129.60 m long, according to a rough estimate based on the threshold segmentation of the blast zone image (Figure 2B), captured by the High Resolution Imaging Science Experiment (HiRISE). After the touchdown, Zhurong started its tour mainly toward the south on Mars. This journey began from the center of the blast zone (Site A, Figures 2A, 3A), passing through its wing (sites B and C, Figures 2A, 3B, C), and reached the edge (Site D, Figures 2A, 3D) on 13–15 June (sol 30–32). After that, the rover kept walking, passing through a sand dune (Site S, Figures 2A, 4A) and also observing some normal and typical scenes (Site N, Figures 2A, 4B). Affected by the touchdown, the characteristics of rocks at sites A, B, C, and D in the blast zone varied. For comparison, the rock characteristics in unaffected regions, for example, at sites S and N out of the blast zone, were also analyzed. The number of these image pairs captured using the NaTeCams of each site is shown in Supplementary Table S1.
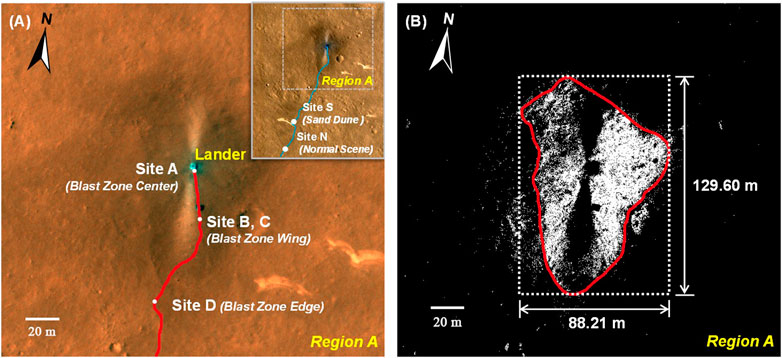
FIGURE 2. Blast zone with the Zhurong route (modified from HiRISE image “ESP_069665_2055-1”). (A) Blast zone with the Zhurong route projected on it. (B) Range of the blast zone.
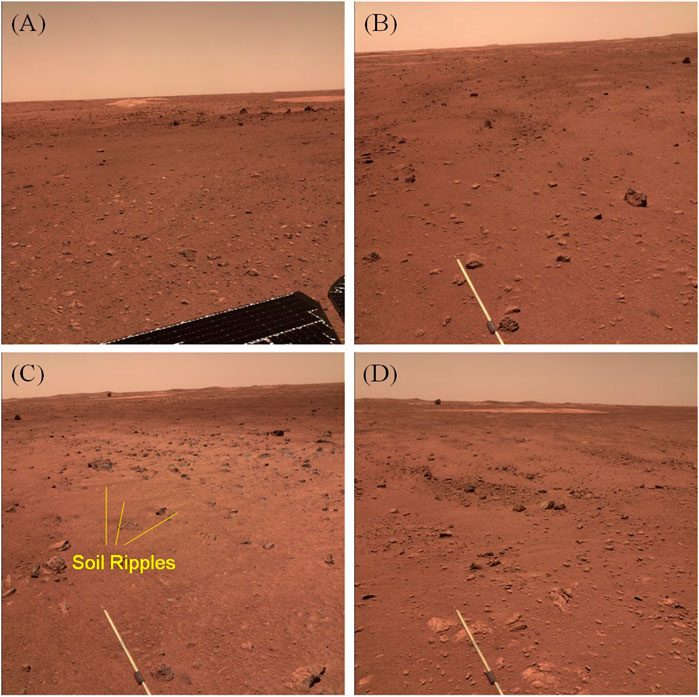
FIGURE 3. Rocks in the blast zone. (A) Rocks at Site A, the center of the blast zone; (B, C) rocks at sites B and C, the wing of the blast zone; and (D) rocks at Site D, the edge of the blast zone.
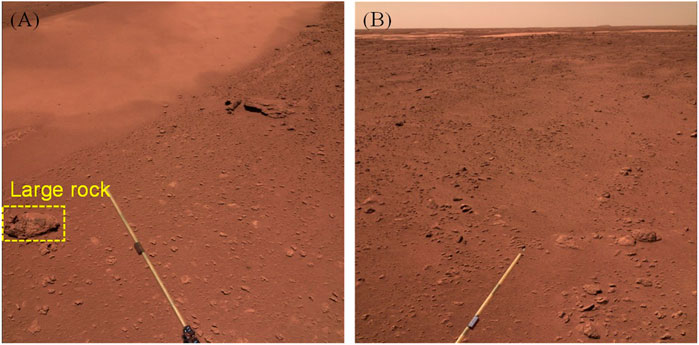
FIGURE 4. Rocks out of the blast zone. (A) Rocks at Site S, near a sand dune. (B) Rocks at Site N, a normal scene along the route.
The calculation of rock sizes and areas out of the depression also takes the similar four steps. The difference is that when identifying the rocks at the first step, the Cascade region-based convolutional neural network (Cascade R-CNN) (Cai and Vasconcelos, 2018) is used instead of outlining manually, given the large number of rocks in the pictures (Figures 3, 4). This is a multi-stage object detection algorithm. In this study, ResNet-50 is used as the backbone of the model, which is augmented with a feature pyramid network for robust feature extraction (Lin et al., 2017). Then, a region proposal network (RPN) and a differentiable region of interest (RoI) pooling layer (Girshick, 2015) are used to generate proposal feature maps. For training and validation purposes, a dataset comprising 4,007 images with annotated bounding boxes highlighting Martian rocks is curated. We used weights pretrained on ImageNet (Deng et al., 2009) as the initial model and fine-tuned on our datasets to obtain the final model. Based on this method (Wang et al., 2022), the rocks are identified automatically. To identify as many rocks with different diameters as possible, only the rocks in the lower half of the picture are used for recognition and calculation because the upper half is far away from the camera, and small-sized rocks are easy to be ignored. The identification results of rocks are shown in Supplementary Figures S1, S2. We checked the recognition results of the rocks in the five images by a human, and the accuracy turns out to be 94.6% on average. The picture size in Figures 3, 4 is 2048 × 2048 pixel. Among these six pictures, the longest optical axis distance from the center of the picture to the projection center of the CamB is 7.97 m in Figure 3A, and the shortest distance is 3.62 m in Figure 4A.
As the distance from the camera increases, the actual size represented by each pixel (Sp) changes regularly, as well as the size of the smallest rock (Sr) identified at each distance. For example, at the optical axis distance (D) of 3.0 m, Sp and Sr are 1.58 mm and 9.98 mm on average, respectively; while at the D value of 8.0 m, Sp and Sr both increase to 10.81 mm and 107.89 mm on average, respectively. This means that at the optical axis distance D, the rocks smaller than Sr will not be identified in this research. In the log–log plot, Sp and Sr both show linear fits with D (Equations 1, 2 and Figure 5):
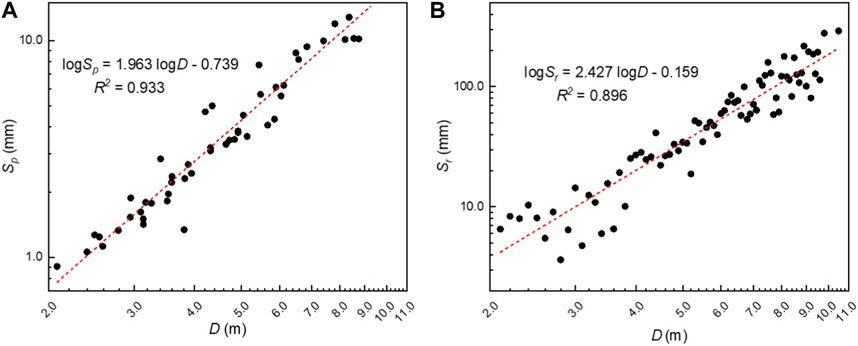
FIGURE 5. Pixel size (Sp) and the identified smallest rock size (Sr) at different optical axis distances (D). (A) Sp versus D. (B) Sr versus D.
When calculating the areas of rocks out of the depression, we follow the hypothesis: the undersurfaces of the rocks are considered to be circles, and their diameters are the observed apparent width, as described previously. In addition, the area of the whole region is also calculated as a flat plane, and the rock abundance equals the ratio of the area of all rocks here to the area of this region.
There are some inevitable uncertainties in the calculation of rock sizes and areas. To start with, because of the limit of the image resolution, the small and more distant rocks are ignored. Second, some small rocks may be sheltered by the bigger ones. In addition, some rocks are partly buried or hidden in the depression wall or under the surface, and only the sides of exposed rocks facing the camera can be seen, which certainly affected the size and area calculation. Furthermore, the hypothesis that the undersurfaces of rocks are round may lead to inaccuracies in the calculation of the rock areas. The rock sizes and areas in different sites are shown in Table 1.
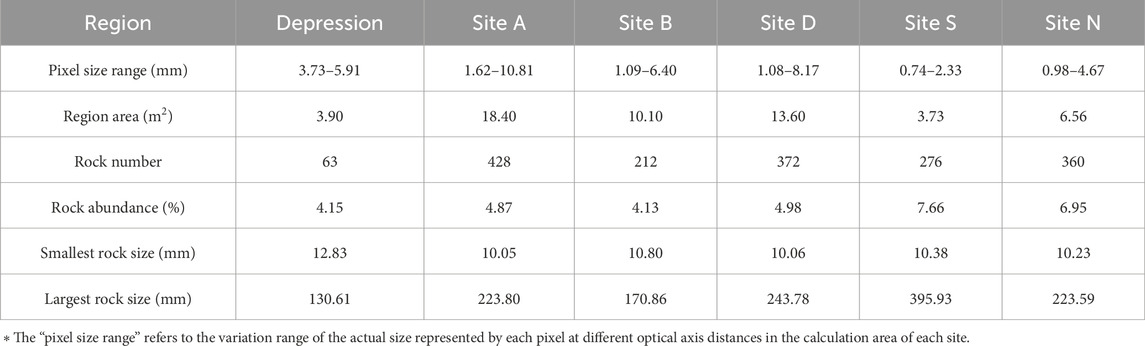
TABLE 1. Rock sizes and areas in different sites.
3 Results
3.1 The SFD of rocks in the excavated depression
The SFD of rocks in the excavated depression of Zhurong is shown in Figure 6 as the dark red curves. If the rock size is larger than the value shown on the horizontal axis, the cumulative fractional area (CFA) of these rocks is indicated in Figure 6A, and the cumulative number per m2 (CN) of these rocks is indicated in Figure 6B. In order to compare and describe the distributions quantitatively, the CFA of rocks measured from the Martian surface is usually fitted as an exponential model, according to Equations 3, 4 (Golombek and Rapp, 1997; Wu et al., 2022):
where Fk(D) is the CFA, meaning the cumulative fractional area of rocks whose diameter is larger than D; k is the rock abundance; q(k) is the exponential factor, which defines the rate of drop-off in the exponential function at large rock diameters; and A and B are the fitting constants fitted by the data from Viking 1 and Viking 2, respectively, and A = 1.79 and B = 0.152. Therefore, the exponential model curves shown in Figure 6A reflect the CFA of different rock abundances.
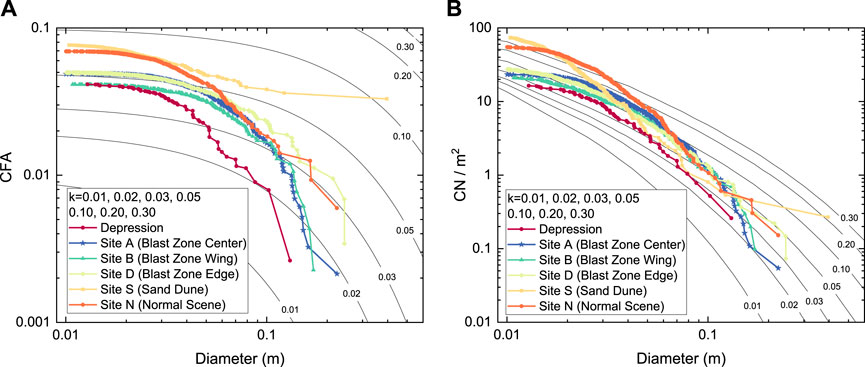
FIGURE 6. Rock size–frequency distribution (SFD) of six sites along with exponential model curves for different total CFA or k of 1%, 2%, 3%, 5%, 10%, 20%, and 30%. (A) Cumulative fractional area (CFA) of rocks larger than any given diameter versus diameter. (B) Cumulative number of rocks per m2 larger than any given diameter (CN) versus diameter.
The rock abundance in the depression is 4.15%. The size of the rocks here ranges from 12.83 to 130.61 mm, and the largest rock block is at the bottom of the depression, whose width and height are 130.61 and 145.16 mm, respectively, with an area of 20,354.27 mm2 (0.02 m2). The SFD versus diameter in the depression conforms to the 1.4%–4.2% CFA model curve (Figure 6A). It is almost parallel to the model of 4% at relatively small rocks, while starts to gradually drop off for a rock diameter of >25.54 mm. Then, at 51.43 and 102.37 mm, this curve meets the 3% and 2% exponential models, respectively. Finally, it reaches 1.4% model at the largest diameter of 130.61 mm.
Similarly, the SFD curve in the depression also follows the CN model. The difference is that the cumulative number of SFDs is parallel to CN curves with slightly higher k than the CFA plots (Golombek et al., 2021). The smallest rock falls to the 3.0% CN model, and then, with the increase in the rock size, this curve reaches up to the 5%–10% model at the diameter of approximately 30 mm, and finally, drops to the 2%–3% model at the largest rock.
3.2 The SFD of rocks in the blast zone
The scenes of the Blast Zone Center, Wing, and Edge are shown in Figure 3. The rocks at the center of the blast zone (Figure 3A) are relatively uniform in size and spatial distribution compared with the other two sites. Since the plume surface interactions during touchdown were so strong that it dug a deep depression below the lander, the original small rocks on the surface might be blown away, and those previously in the depression were blown out and left at the Blast Zone Center. They formed the SFD features here together with the original half-buried or large rocks. However, the region of the Blast Zone Wing (Figures 3B, C) shows completely different characteristics, lacking the separate small rocks. The reason is that the plume kept blowing when the lander was adjusting its posture while selecting the suitable landing area, and during this process, the plume blew away the small original isolated rocks, leaving the large or half-buried ones. In Figure 3C, some “soil ripples” can be seen clearly on the surface, proving the influence resulted from the plume. This image shows the wing of the blast zone vividly, but the rocks are too far away from the camera, causing large errors in rock recognition and coordinate calculation, so it is only used for illustration rather than the following SFD calculation. At the edge of the blast zone (Figure 3D), the rock features are also different. Isolated small rocks could be observed again. Some of them may be the ones blown out of the blast zone, while the others are in situ. In summary, among these three zones, due to the remolding effect on the Martian surface of the touchdown, the characteristics of rocks change prominently, further resulting in differences in their distribution features.
The rock abundances of the Blast Zone Center, Blast Zone Wing, and Blast Zone Edge are 4.87%, 4.13%, and 4.98%, respectively, which is consistent with the previously discussed rock distribution variation in the three locations: the rocks at the Blast Zone Center contain the original large or half-buried rocks, plus the small rocks splashed away from the depression; while the rocks at the Blast Zone Wing lack the splashed ones compared with the Blast Zone Center, which shows the lowest rock abundance; and as for the Blast Zone Edge, the rocks here include the original ones and the blown-out ones from the blast zone, allowing this place the highest rock abundance.
The same variation trend of the rock SFD in these three regions is also shown in Figure 6. It can be seen from the curves that the CFA of the Blast Zone Edge is consistently larger than that of the other two regions (Figure 6A). For small rocks (the diameter of < 50 mm), the CFA of the Blast Zone Center is close to the Blast Zone Edge; for rocks with a diameter between 50 and 90 mm, it decreases, approaching the CFA of the Blast Zone Wing gradually; and then, for large rocks (the diameter of > 90 mm), the CFA of the Blast Zone Wing is a little higher than that of the Blast Zone Center, meaning that the abundance of large rocks here is higher than that of the Blast Zone Center. The cumulative number of rocks in the Blast Zone Center, Wing, and Edge is 23.3/m2, 21.0/m2, and 27.4/m2, respectively, which owns the same variation as the rock abundance. Furthermore, the SFD of CN curves (Figure 6B) shows similar trends as the CFA of rocks (Figure 6A).
3.3 The SFD of rocks out of the blast zone
After completely passing through the blast zone, the Zhurong rover kept moving south, and the next regions it captured were not affected by the Tianwen-1 touchdown. In other words, the rock characteristics and SFD there can be regarded as undisturbed and original features on southern Utopia Planitia on Mars.
Two classes of typical regions are selected to analyze (Figure 4). The first one contains some part of a sand dune (Site S, Figure 4A); the rock distribution here shows a sudden transformation from the ground surface to the dune, where the rocks which can be distinguished by the naked eye abruptly disappear, replaced by tiny sand grains. The second region shows a normal scene along the Zhurong rover’s route (Site N, Figure 4B). It seems that in the natural environment of Mars, there are many blocks on the ground, whose albedo is normally brighter than the soil matrix.
The rock abundance of sites S and N is 7.66% and 6.95%, respectively, and the SFD curves of these two sites are also shown in Figure 6. The CFA curve of Site N (Figure 6A) gradually drops off to a smaller exponential model, which is from 6.6% to 2.9%, with the diameter increases from 10.23 mm to 223.59 mm. However, unlike this situation, the final point of the Site S curve does not descend to a smaller model curve but goes up to meet the 10% model. This is because at the left part of Site S, there is an extremely large rock (Figure 4A), whose size is 395.93 mm, dominantly larger than other blocks, which makes the final point shift. Apart from that, the two CN curves (Figure 6B) where the rocks are smaller than 30 mm are a lot higher than other CN curves, which may illustrate that the number of these small rocks here is a lot more than that of the other four sites. This proves that the plume during touchdown does blow away small rocks and affects the rock distribution in the blast zone.
In addition to Mars, humans have also explored the Moon and asteroids and calculated the SFD there. An interesting comparison can be made about the rock distribution of them. For the rocks with a size of >50 mm, the number density is 3.0–11.5 per m2, according to the statistics of the landing sites of Zhurong, Pathfinder, Spirit, Phoenix, and InSight on Mars (Lorenz, 2023). As for the Moon, it is 0.4–8.9 per m2, a little lower than that on Mars, based on the statistics of the landing sites of Surveyor Ⅰ, Ⅲ, Ⅴ, Ⅵ, Ⅶ, the Apollo 11, and Chang-E-3 (Lorenz, 2023). However, it is rather different for asteroids. Since the vast majority of asteroids between ∼0.2 and 10 km in size are rubble piles, the rocks there are extremely large. For example, the largest boulder on Itokawa is more than 1/10 the diameter of the asteroid, which makes the rock density (>2.0 m) approximately 3,000 per km2 (Pajola et al., 2022).
4 The fractal dimension of rock sizes
Fractal geometry can well-describe the regularity of irregular things in nature quantitatively, for example, the fractal characteristic of rock sizes reflects its fragmentation mode, in other words, the physical mechanism of rock evolution (Mandelbrot, 1998; Badge et al., 2002; Tu et al., 2005). This may illustrate that different fractal dimensions represent different geological processes during the formation of the rock blocks.
The fractal dimension of rock sizes could be calculated as follows: if rock size l > L, where L is a specific value, then the cumulative number of rocks N(l > L) with the characteristic size L varies as (Turcotte, 1986; Mandelbrot, 1998; Badge et al., 2002; Tu et al., 2005)
where D is the fractal dimension of the size distribution of the rocks. Performing a logarithmic operation to both sides of Equation 5, it can be obtained:
According to Equation 6, the least square method is used for linear fitting based on the rock sizes computed previously; then, the fractal dimension of rocks (D) and the corresponding adjusted determination coefficient (R2) are obtained (Table 2). Figure 7 shows the cumulative rock number in the depression versus the rock size in a log–log plot. It is notable that we cannot use a single power-law exponent to characterize the particle distribution, for in that case, both the relatively smaller and larger rocks are excluded (Figure 7A). Therefore, we roughly divide the rocks at each site into small rocks and large rocks to calculate the fractal dimensions (Figure 7B). The dimension of small rocks is called D1 with an adjusted determination coefficient R21 and that of large rocks is called D2 and R22. The size that distinguishes these two kinds of rocks with different sizes is called the demarcation size (Sd). We develop a scheme to divide the rocks—that R21 and R22 for each place are set to be as high as possible (>0.92)—with the highest average of all possible attempts. The fractal dimensions are shown in Table 2. For the rocks inside the depression, D1 and D2 are 0.43 and 2.06, respectively. The difference in fractal dimensions may reflect different fragmentation processes (Charalambous, 2015), in other words, different geological processes during the formation of rocks. This means that in the depth of tens of centimeters of the Zhurong landing site, the small rocks (12.83–21.72 mm) may experience different geological processes from the large rocks (>21.72 mm).
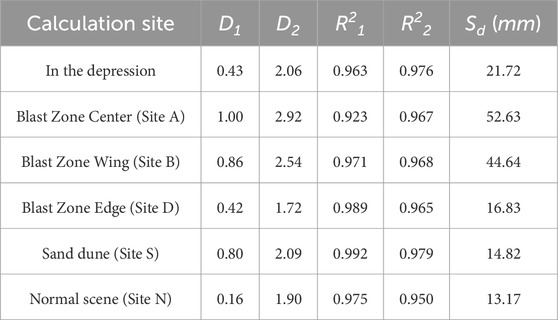
TABLE 2. Fractal dimension of rock sizes in the Zhurong landing site.
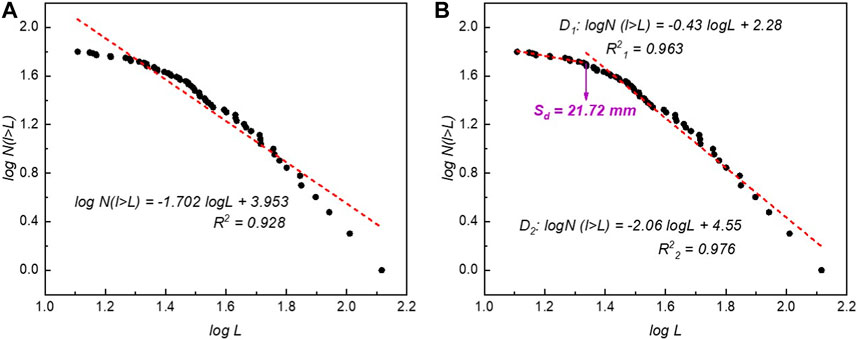
FIGURE 7. Fractal dimensions of rock sizes in the depression. (A) A single dimension for all rocks. (B) Dimensions for small and large rocks respectively.
Through the fractal dimensions of rock sizes, we can infer that different geological processes have been involved; however, it is difficult to confine what process it exactly is. On the Earth, based on the particle size distribution of soil, the depositional environments could be inferred, according to the judgment formula established by Sahu (1964). However, this work is built on a large number of statistical results of particle sizes and the corresponding known environments. Unfortunately, the depositional environments on Mars are still unclear for now, and the particle size distribution is confined to only several landing regions. Thus, it is extremely hard to determine the geological process just through Mars’s rock distribution. This requires much other geological research studies and evidence, which is very important work in the future.
The fitting curves of the other five regions out of the depression are shown in Supplementary Figures S3–S7, and the fractal dimensions are also presented in Table 2. A similar phenomenon is observed. Since at each distance from the camera, the rocks smaller than a certain size cannot be identified (Figure 5), such small rocks are excluded in the calculation of fractal dimension D1, which makes this value not precise. Thus, only the dimension D2 is used to analyze. For the touchdown-disturbed Blast Zone Wing, D2 is 2.54, and in the center of it, where the rocks had a greater influence by the touchdown, D2 is as high as 2.92. For the undisturbed regions like sites S and N, D2 is 2.00 on average, and it is similar for rocks in the depression. However, although the Blast Zone Edge is also affected by the descent, considering that it has largely maintained the original distribution of rocks, D2 is closer to that of sites S and N.
Similarly, Sd shows the same regulation as D2. For the Blast Zone Center and Wing, where the rock distribution is greatly influenced by the touchdown, Sd of small and large rocks is 44.64–52.63 mm; however, for sites S and N where the rock distribution is undisturbed, this size is 13.17–14.82 mm, which is a lot smaller. With regard to the Blast Zone Edge, Sd is also much closer to that of sites S and N, which is 16.83 mm. This means that the rocks in the Blast Zone Center smaller than 52.63 mm may be disturbed by the touchdown, as well as the rocks smaller than 44.64 mm in the Blast Zone Wing. In addition, the fractal dimension for large rocks at the disturbed regions is usually higher than that of the undisturbed regions.
5 Conclusion
In this paper, the rock size–frequency distributions are calculated in six regions of the Zhurong landing site, Mars, including regions inside the depression, within and out of the blast zone. Among them, the distribution of rocks in the depression is the first time to be obtained, before which the shallow subsurface on Mars with a depth of tens of centimeters has not been investigated. Apart from that, the fractal dimension is calculated to quantitatively describe the size distribution and reflect the geological process experienced by them in an attempt. The following conclusions are drawn:
1) The rocks in the depression and out of the blast zone are original, without disturbance by touchdown. The rock abundance in the depression is 4.15%, smaller than that of the surface out of the blast zone (the rock abundance at sites S and N is 7.66% and 6.95%, respectively).
2) The rocks in the blast zone are affected by the touchdown. Some small rocks are splashed from the depression to the Blast Zone Center, and some are blown away at the Blast Zone Wing; at the edge, in situ rocks and small blown-out rocks coexist. This makes the rock abundance first decrease then increase as getting further away from the lander.
3) At the shallow subsurface of the Zhurong landing site, the large rocks may experience different geological processes from the small rocks. The rocks in the Blast Zone Center and Wing smaller than 52.63 mm and 44.64 mm, respectively, may be disturbed by the touchdown, and the fractal dimension for large rocks in the regions affected by the touchdown is usually higher than that of the unaffected regions.
For future Mars exploration missions, the analysis of the rock SFD in this research will provide important reference, especially for landing, drilling, and sampling. According to Golombek et al. (2021), rocks whose sizes are larger than 700–900 mm are considered to pose a potential threat to landing. Based on this research, on the surface we investigate, only one rock reaches a size of ∼400 mm; others are all < 250 mm. To be more conservative, even if we consider any rock larger than 400 mm to be a landing hazard, this place is still relatively safe. This could also be proved by the low density of larger rocks. The density of rocks with a size of > 100 mm is 0.5–1.3/m2, and that for rocks > 200 mm is 0–0.3/m2, which means the probability that the spacecraft will encounter a rock larger than 100 mm is relatively low. However, the excavated depression under the Tianwen-1 lander exposes a large rock, which might be in situ (Xu et al., 2023). It shows that the rock size of the shallow subsurface is not uniform, and it is likely that there are large blocks buried in it, which may cause deflection and obstruction of the drill bit during drilling and sampling.
Data availability statement
The raw data supporting the conclusion of this article will be made available by the authors, without undue reservation.
Author contributions
XS: conceptualization, data curation, formal analysis, investigation, methodology, software, visualization, writing–original draft, and writing–review and editing. SL: conceptualization, funding acquisition, methodology, project administration, resources, supervision, and writing–review and editing. JL: conceptualization, formal analysis, investigation, methodology, project administration, supervision, and writing–review and editing. YW: data curation, methodology, and writing–review and editing. SZ: data curation, methodology, and writing–review and editing. BZ: conceptualization, investigation, and writing–review and editing. ZZ: supervision and writing–review and editing. TX: investigation, validation, and writing–review and editing. XC: validation and writing–review and editing. YD: validation and writing–review and editing.
Funding
The author(s) declare financial support was received for the research, authorship, and/or publication of this article. This research was supported by the National Natural Science Foundation of China (Grant 42230111), the Key Research Program of the Institute of Geology and Geophysics, CAS (Mars Mission; Grant IGGCAS-202102), the Key Research Program of the Institute of Geology and Geophysics, CAS (Grant IGGCAS-201904), and the CAS Key Technology Talent Program.
Acknowledgments
The authors thank all the scientists and engineers who were involved in the Tianwen-1 mission, including the China National Space Administration (CNSA), the National Astronomical Observatories of the Chinese Academy of Sciences (NAOC), China Academy of Space Technology (CAST), Beijing Aerospace Control Center (BACC), and other critical institutes. The data set used in this article is processed and produced by “Ground Research and Application System (GRAS) of China’s Lunar and Planetary Exploration Program, provided by CNSA (http://moon.bao.ac.cn).” The TensorFlow implementation of the Cascade R-CNN model is based on Wang et al. (2022), and the authors thank Zhuowei Xiao for his assistance in training the model.
Conflict of interest
The authors declare that the research was conducted in the absence of any commercial or financial relationships that could be construed as a potential conflict of interest.
Publisher’s note
All claims expressed in this article are solely those of the authors and do not necessarily represent those of their affiliated organizations, or those of the publisher, the editors, and the reviewers. Any product that may be evaluated in this article, or claim that may be made by its manufacturer, is not guaranteed or endorsed by the publisher.
Supplementary material
The Supplementary Material for this article can be found online at: https://www.frontiersin.org/articles/10.3389/fspas.2024.1270079/full#supplementary-material
References
Altieri, F., Frigeri, A., Lavagna, M., Le, G. A., Yuryevich, N. S., Stoker, C., et al. (2023). Investigating the oxia planum subsurface with the ExoMars rover and drill. Adv. Space Res. 71 (11), 4895–4903. doi:10.1016/j.asr.2023.01.044
Bagde, M. N., Raina, A. K., Chakraborty, A. K., and Jethwa, J. L. (2002). Rock mass characterization by fractal dimension. Eng. Geol. 63, 141–155. doi:10.1016/s0013-7952(01)00078-3
Baker, D. M. H., and Carter, L. M. (2019). Probing supraglacial debris on Mars 1: sources, thickness, and stratigraphy. Icarus Int. J. Sol. Syst. Stud. 319, 745–769. doi:10.1016/j.icarus.2018.09.001
Blaber, J. (2023). GitHub. Avaliable at: https://github.com/justinblaber/ncorr_2D_matlab.
Cai, Z., and Vasconcelos, N. (2018). “Cascade R-CNN: delving into high quality object detection,” in Proceedings of the IEEE Computer Society Conference on Computer Vision and Pattern Recognition, Salt Lake City, UT, USA, 18-23 June 2018 (IEEE), 6154–6162.
Charalambous, C. (2015). On the evolution of particle fragmentation with applications to planetary surfaces. London, United Kingdom: Imperial College London.
Chen, Z., Wu, B., Wang, Y. R., Liu, S., Li, Z. J., Yang, C. Y., et al. (2022). Rock abundance and erosion rate at the Zhurong landing site in southern utopia Planitia on Mars. Earth Space Sci. 9, e2022EA002252. doi:10.1029/2022ea002252
Clegg, R. N., Jolliff, B. L., and Metzger, P. T. (2012). Photometric analysis of the Apollo landing sites. Earth Space 2012, 218–227. doi:10.1061/9780784412190.025
Craddocka, R. A., and Golombek, M. P. (2016). Characteristics of terrestrial basaltic rock populations: implications for Mars lander and rover science and safety. Icarus 274, 50–72. doi:10.1016/j.icarus.2016.02.042
Deng, J., Dong, W., Socher, R., Li, L. J., Li, K., and Li, F. F. (2009). “ImageNet: a large-scale hierarchical image database,” in 2009 IEEE Conference on Computer Vision and Pattern Recognition, Miami, FL, USA, 20-25 June 2009 (IEEE), 248–255.
Girshick, R. (2015). “Fast R-CNN,” in Proceedings of the IEEE International Conference on Computer Vision, 2015 Inter, Santiago, Chile, 07-13 December 2015 (IEEE), 1440–1448.
Golombek, M. P., Cook, R. A., Moore, H. J., and Parker, T. J. (1997). Selection of the Mars pathfinder landing site. J. Geophys. Res. Planets 102 (E2), 3967–3988. doi:10.1029/96je03318
Golombek, M. P., Crumpler, L. S., Grant, J. A., Greeley, R., Cabrol, N. A., Parker, T. J., et al. (2006). Geology of the Gusev cratered plains from the Spirit rover transverse. J. Geophys. Res. Planets 111, E02S07. doi:10.1029/2005je002503
Golombek, M. P., Haldemann, A. F. C., Forsberg-Taylor, N. K., DiMaggio, E. N., Schroeder, R. D., Jakosky, B. M., et al. (2003). Rock size-frequency distributions on Mars and implications for Mars Exploration Rover landing safety and operations. J. Geophys. Res. Planets 108 (E12), 8086. doi:10.1029/2002je002035
Golombek, M. P., Huertas, A., Marlow, J., McGrane, B., Klein, C., Martinez, M., et al. (2008). Size-frequency distributions of rocks on the northern plains of Mars with special reference to Phoenix landing surfaces. J. Geophys. Res. 113, E00A09. doi:10.1029/2007je003065
Golombek, M. P., and Rapp, D. (1997). Size-frequency distributions of rocks on Mars and Earth analog sites: implications for future landed missions. J. Geophys. Res. Planets 102 (E2), 4117–4129. doi:10.1029/96je03319
Golombek, M. P., Trussell, A., Williams, N., Charalambous, C., Abarca, H., Warner, N. H., et al. (2021). Rock size-frequency distributions at the InSight landing site, Mars. Earth Space Sci. 8, e2021EA001959. doi:10.1029/2021ea001959
Grant, J. A., Golombek, M. P., Grotzinger, J. P., Wilson, S. A., Watkins, M. M., Vasavada, A. R., et al. (2011). The science process for selecting the landing site for the 2011 Mars Science Laboratory. Planet. Space Sci. 59, 1114–1127. doi:10.1016/j.pss.2010.06.016
Grant, J. A., Wilson, S. A., Ruff, S. W., Golombek, M. P., and Koestler, D. L. (2006). Distribution of rocks on the gusev plains and on husband hill, Mars. Geophys. Res. Lett. 33, L16202. doi:10.1029/2006gl026964
Hou, X. Y., Ding, T. X., Cao, K. R., Chen, T., Li, L., Yu, Z. J., et al. (2019). Research on multi-pipe drilling and pneumatic sampling technology for deep Martian soil. Adv. Space Res. 64, 211–222. doi:10.1016/j.asr.2019.03.019
Kereszturi, A. (2012). Landing site rationality scaling for subsurface sampling on Mars—case study for ExoMars Rover-like missions. Planet. Space Sci. 72 (1), 78–90. doi:10.1016/j.pss.2012.07.007
Kereszturi, A., Bradak, B., Chatzitheodoridis, E., and Ujvari, G. (2016). Indicators and methods to understand past environments from ExoMars rover drills. Orig. Life Evol. Biosphere 46 (4), 435–454. doi:10.1007/s11084-016-9492-3
Lin, T. Y., Dollár, P., Girshick, R., He, K., Hariharan, B., and Belongie, S. (2017). “Feature pyramid networks for object detection,” in Proceedings - 30th IEEE Conference on Computer Vision and Pattern Recognition, CVPR 2017, Honolulu, HI, USA, 21-26 July 2017 (IEEE), 936–944.
Lorenz, R. D. (2023). Analytic rock abundance distributions and their application to spacecraft landing hazards. Planet. space Sci. 234, 105720. doi:10.1016/j.pss.2023.105720
Mandelbrot, B. B., and Wheeler, J. A. (1998). The fractal geometry of nature. Am. J. Phys. 51, 286–287. doi:10.1119/1.13295
Pajola, M., Barnouin, O. S., Lucchetti, A., Hirabayashi, M., Ballouz, R. L., Asphaug, E., et al. (2022). Anticipated geological assessment of the (65803) didymos–dimorphos system, target of the DART–LICIACube mission. Planet. Sci. J. 3, 210. doi:10.3847/psj/ac880d
Sahu, B. K. (1964). Depositional mechanisms from the size analysis of clastic sediments. J. Sediment. Petrology 34, 73–83. doi:10.1306/74d70fce-2b21-11d7-8648000102c1865d
Tu, X. B., Wang, S. J., and Yue, Z. Q. (2005). Fractal fragmentation of weathered rock and its application in engineering Geology (in Chinese). Chin. J. Rock Mech. Eng. 24 (4), 587–595.
Turcotte, D. L. (1986). Fractals and fragmentation. J. Geophys. Res. 91 (B2), 1921–1926. doi:10.1029/jb091ib02p01921
Wang, Y., Li, G., and Xiao, Z. (2022). The local time and altitude dependences of long-lived nonspecular meteor echoes with weak magnetic aspect sensitivity at low latitudes. J. Geophys. Res. Space Phys. 127, e2022JA030458. doi:10.1029/2022ja030458
Ward, J. G., Arvidson, R. E., and Golombek, M. P. (2005). The size-frequency and areal distribution of rock clasts at the Spirit landing site, Gusev Crater, Mars. Geophys. Res. Lett. 32, L11203. doi:10.1029/2005gl022705
Wei, Y., Yao, Z., and Wan, W. (2018). China’s roadmap for planetary exploration. Nat. Astron. 2 (5), 346–348. doi:10.1038/s41550-018-0456-6
Wu, B., Dong, J., Wang, Y. R., Li, Z. J., Chen, Z. Y., Liu, W. C., et al. (2021). Characterization of the candidate landing region for tianwen-1—China's first mission to Mars. Earth Space Sci. 8, e2021EA001670. doi:10.1029/2021ea001670
Wu, B., Dong, J., Wang, Y. R., Rao, W., Sun, Z. Z., Li, Z. J., et al. (2022). Landing site selection and characterization of tianwen-1 (Zhurong rover) on Mars. J. Geophys. Res. Planets 127, e2021JE007137. doi:10.1029/2021je007137
Xu, T., Zheng, B., Zhang, Z. B., Li, J., Li, S. D., Chen, X. S., et al. (2023). Phenomenology of plume–surface interactions and preliminary results from the Tianwen-1 landing crater on Mars. Earth Planet. Phys. 7, 311–330. doi:10.26464/epp2023044
Zhang, S., Jia, Y., Peng, S., Wen, B., Ma, Y. Q., Qi, C., et al. (2020). Self-Calibration of the stereo vision system of the chang'e-4 lunar rover based on the points and lines combined adjustment. Photogrammetric Eng. Remote Sens. 86 (3), 169–176. doi:10.14358/pers.86.3.169
Zhang, S., Liu, S. C., Ma, Y. Q., Qi, C., Ma, H., and Yang, H. (2017). Self calibration of the stereo vision system of the Chang’e-3 lunar rover based on the bundle block adjustment. ISPRS J. Photogrammetry Remote Sens. 128, 287–297. doi:10.1016/j.isprsjprs.2017.04.004
Keywords: rock, size–frequency distribution, Zhurong rover, excavated depression, Mars
Citation: Sun X, Li S, Li J, Wu Y, Zhang S, Zheng B, Zhang Z, Xu T, Chen X and Diao Y (2024) The characteristic and size–frequency distribution of rocks at the Zhurong landing site, Mars. Front. Astron. Space Sci. 11:1270079. doi: 10.3389/fspas.2024.1270079
Received: 31 July 2023; Accepted: 08 January 2024;
Published: 22 January 2024.
Edited by:
Josep M. Trigo-Rodríguez, Spanish National Research Council (CSIC), SpainReviewed by:
Akos Kereszturi, Hungarian Academy of Sciences (MTA), HungaryJianguo Yan, Wuhan University, China
Copyright © 2024 Sun, Li, Li, Wu, Zhang, Zheng, Zhang, Xu, Chen and Diao. This is an open-access article distributed under the terms of the Creative Commons Attribution License (CC BY). The use, distribution or reproduction in other forums is permitted, provided the original author(s) and the copyright owner(s) are credited and that the original publication in this journal is cited, in accordance with accepted academic practice. No use, distribution or reproduction is permitted which does not comply with these terms.
*Correspondence: Shouding Li, bHNkbHloQG1haWwuaWdnY2FzLmFjLmNu; Juan Li, anVhbmxpQG1haWwuaWdnY2FzLmFjLmNu