- Higher Polytechnic School, University of Almeria, Almería, Spain
The lunar crustal structure is determined to be in a depth range of 0 to 40 km by means of Rayleigh wave analysis. The traces of three moonquakes were used to obtain Rayleigh wave dispersion (group velocities) in the short period range (fundamental mode: 0.5–12.5 s, first mode: 0.5–5.5 s, and second mode: 1–4 s). These moonquakes were registered by two stations placed on the Moon during the Apollo program. The dispersion was calculated with a combination of filtering techniques and was later inverted to the fundamental-mode dispersion to obtain an S-velocity model—an S-velocity distribution with depth. The S-velocity increased with depth, and a rapid S-velocity gradient was observed from 0 to 5 km in depth, while the S-velocity gradient became smaller down to 5 km in depth. While the present S-velocity model contributes to lunar crustal structure determination, more research is needed to precisely determine this structure, which will be possible when higher-quality data are acquired in future missions. Plain language summary: A rapid S-velocity gradient was determined from 0 to 5 km in depth. The low S-velocities (<2 km/s) determined for the first layers (0–2 km-depth) can be associated with the presence of broken and fractured materials at the uppermost lunar strata. The S-velocity increases with depth, but its gradient becomes slower deeper than 5 km.
1 Introduction
An important key for understanding the origin and evolution of the Moon is found in knowledge about its internal structure. Fortunately, the Moon is a body of our solar system for which seismic data have been successfully obtained. The Active Seismic Experiment and Passive Seismic Experiment during the Apollo program (Nunn et al., 2022) provided invaluable seismic data which were analysed to obtain the deep structure from P and S waves (e.g., Matsumoto et al., 2015) and the shallow structure from Raleigh wave modes of high frequency (e.g., Dal (2015) in the frequency range of 1 to 80 Hz. However, the Rayleigh-wave modes have not been analyzed for periods greater than 1 s. This is the goal of the present study, which complements previous research by filtering and inverting the short-period Rayleigh-wave modes to obtain an S-velocity model (i.e., an S-velocity distribution with depth) for a depth range of 0 to 40 km. This methodology has proven to be very useful in several regions of the Earth (Corchete, 2021; 2022).
2 Data, methodology, and results
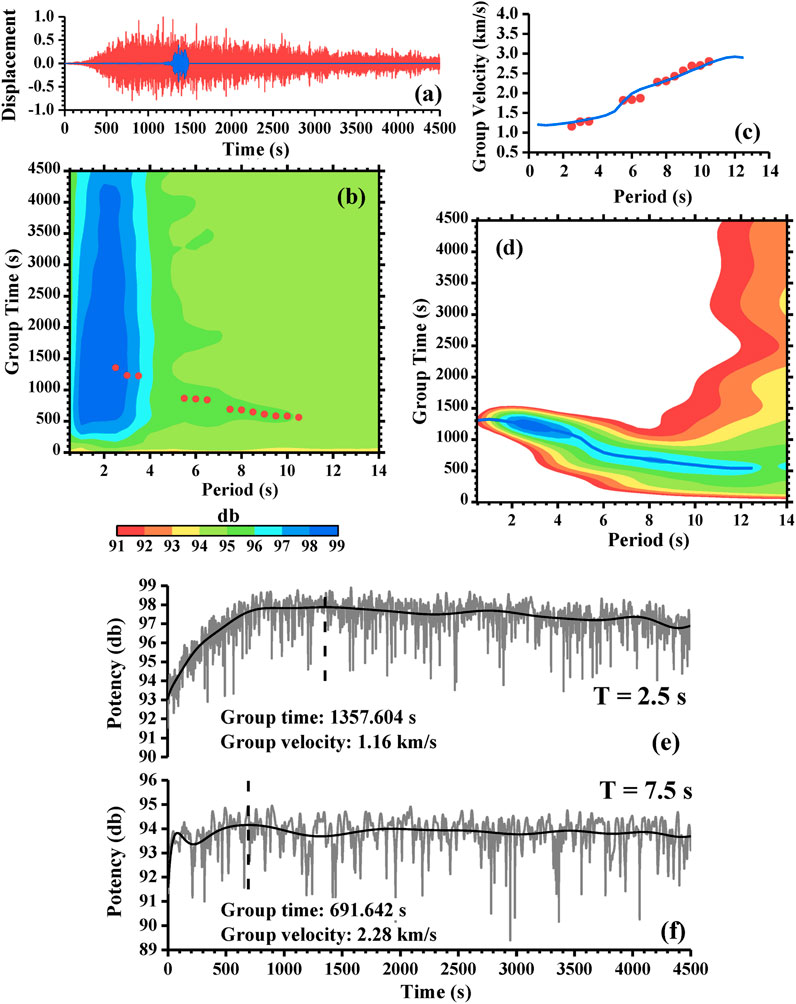
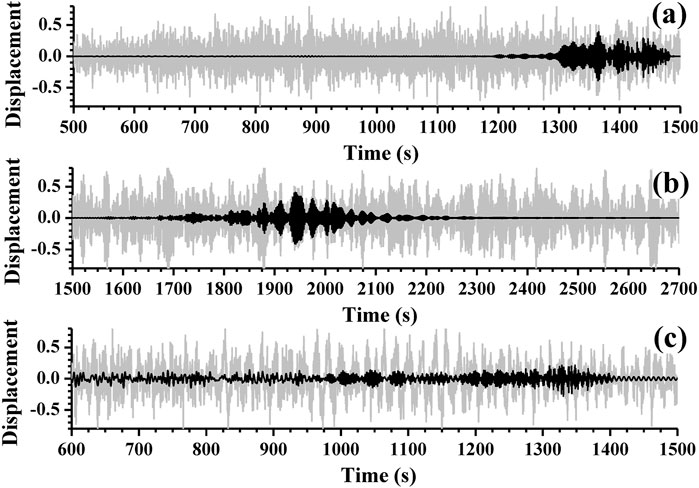
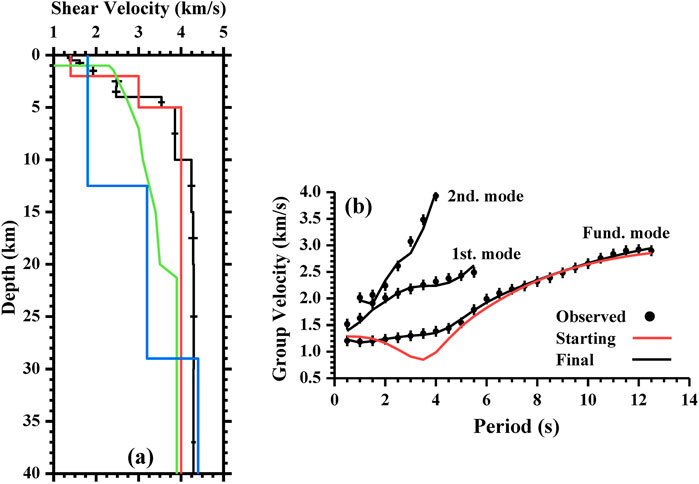
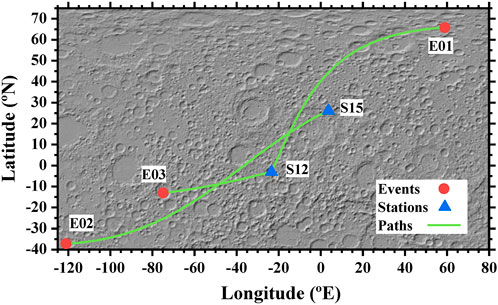
Seismic records obtained from seismometers placed on the Moon during the Apollo program (Nunn et al., 2022) corresponding to 63 seismic events (Garcia et al., 2011) were used to compute Rayleigh-wave group velocities (dispersion curves) (Corchete et al., 2007) by means of dispersion analysis: multiple filter technique (MFT; Dziewonski et al., 1969) and time variable filtering (TVF; Cara, 1973). Unfortunately, most of these records do not present Rayleigh waves; only a few seismic waves have provided adequate Rayleigh-wave trains (Supplementary Material S1, 2). In Supplementary Material S1, the parameters (date, origin time, latitude, and longitude) are provided by Garcia et al. (2011). Figure 1 shows the paths of the Rayleigh waves; the Rayleigh-wave analysis (dispersion analysis) is shown in Figure 2 and Supplementary Materials S3, 4. This analysis consists of a combination of MFT and TVF (Corchete et al., 2007) in which MFT is used to obtain the group-velocity dispersion curve (e.g., Figures 2b,d) from an instrument-corrected seismic record (e.g., Figure 2a, red line; Bath, 1974) or a filtered seismic signal (e.g., Figure 2a, blue line). MFT analysis is improved by performing a polynomial fit of the envelope before the calculation of its maximum because lunar-quake seismic records are highly noisy signals (e.g., Figure 2a, red line). The time of this maximum corresponds to the group time for the considered period (Dziewonski et al., 1969). In Figures 2e and f, the improvements introduced to analyze these noise signals are shown for the trace in Figure 2a (red line) at periods of 2.5 and 7.5 s, respectively. This improvement is applied to all MFT computations performed in this study. The TVF is the filtering technique used to compute a smooth signal (a time-variable filtered signal) in which the energy of all undesirable perturbations has been removed (Figure 3, black lines). The final results of this analysis (MFT and TVF combination) are the dispersion curves shown in Figure 2c (blue line) and Supplementary Materials S3c, 4c (blue lines). The dispersion curve shown in Figure 2c (blue line) is considered the observed data for the inversion process (Supplementary Materials S5–7; Corchete et al., 2007). The errors in these observed data are assumed to be 0.1 km/s (Corchete et al., 2007). The initial model for this inversion process is listed in Supplementary Material S5, and their S-velocity values are plotted in Figure 4a (red line) from 0 to 40 km in depth. This model consists of three principal layers: crust (0–44 km deep, upper mantle (44–500 km deep), and middle mantle (considered a semi-infinite layer) (Matsumoto et al., 2015). These principal layers are subdivided into more layers with an adequate layer thicknesses (Figure 4a and Supplementary Material S6a) selected to improve the solution reliability of the inversion process (Supplementary Material S6b; Corchete et al., 2007). The values of the P- and S-velocities and the density considered for these layers were determined by Matsumoto et al. (2015). The theoretical group velocity calculated by means of forward modeling, from the initial model listed in Supplementary Material S5 (Figure 4a and Supplementary Material S6a, red lines), is plotted with a red line in Figure 4b (and Supplementary Material S6c). The S-velocity models (Figure 4a and Supplementary Material S6a) and the resolving kernels (Supplementary Material S6b) are plotted only for depths above 40 km due to the poor resolution obtained for greater depths. The resolving kernels are representation of the resolution matrix (Corchete et al., 2007). Good coincidence between the maxima of these functions and the reference depths (Supplementary Material S6b), with the absolute maxima of these functions narrow, shows good resolution of the final model determined from the inversion process (Corchete et al., 2007). The S-velocity model shown in Figure 4a (black line) is the final model calculated from the inversion process (Supplementary Material S6). From this model, the Rayleigh-wave phase velocities can be computed for the first and second higher modes (Abo-Zena, 1979; Aki and Richards, 1980), and their corresponding group velocities (theoretical group velocities) can be calculated by derivation of these phase-velocity curves (Ben-Menahem and Singh, 1981). These theoretical group velocities are shown in Figure 4b (black lines) and compared with those (Figure 4b, dots) determined by filtering for events #1 (Supplementary Material S4c, blue line), #2 (Supplementary Material S3c, blue line), and #3 (Figure 2c, blue line). The errors in the dispersion curves shown in Figure 4b (black vertical bars) are assumed as 0.1 km/s (Corchete et al., 2007). It should be noted that all theoretical curves (black lines) fit all observed curves (black dots) within the errors (black vertical bars), showing that the S-velocity model determined in this study (Figure 4a, black line) can be considered valid to describe the subsurface structure beneath the seismic paths (Figure 1). Thus, the results of this study show that the crustal structure beneath the paths (Figure 1) may be considered approximately uniform because a unique S-velocity model fits the observations performed for all paths, and no hypothesis is assumed a priori about this uniformity. This uniformity is a result of the Rayleigh-wave analysis performed.

Figure 2. (a) Observed seismogram (red line) corresponding to the event #03 (Supplementary Material S1) recorded at the station S12 (Supplementary Material S2), instrument corrected (Bath, 1974). Time-variable filtered seismogram (blue line) calculated from the observed seismogram (red line) and the initial group velocity (b and c, red points). Maximum displacement is normalized to the unity. (b) Contour map of relative energy (normalized to 99 dB) as a function of the period and the group time, calculated from the observed seismogram (a, red line) with the MFT. Red points denote the group times inferred from the energy map. (c) Initial (red points) and final (blue line) group velocities calculated from the initial (b, red points) and final (d, blue line) group times and the epicentral distance. (d) Contour map of relative energy calculated from the time-variable filtered seismogram (a, blue line) with the MFT. The blue line denotes the group time inferred from the energy map. The color scale is the same as in (b). (e, f) Envelopes (gray line) calculated from the in-phase and quadrature filtered trace (Dziewonski et al., 1969) for the periods 2.5 and 7.5 s, respectively. The polynomial fit of these envelopes is shown with black line. Vertical dashed lines show the group time for the maximum of the fitted envelope. Group velocity is calculated from this time and the epicentral distance.

Figure 3. The Z-component seismograms (gray line) and their time-variable filtered signals (black line) corresponding to the (a) fundamental-mode, (b) fist higher mode, and (c) second higher mode of the Rayleigh waves, provided by the events #3 (Figure 2A), #2 (Supplementary Material S3a) and #1 (Supplementary Material S4a), respectively. The maximum displacement is normalized to the unity.

Figure 4. (a) Final S-velocity model (black line) obtained after the inversion process shown in Supplementary Material S6. The black horizontal bars show standard deviation of S-velocity for each layer. The S-velocity values of the initial model (Supplementary Material S5) are plotted with red line. The S-velocity models determined by Vinnik et al. (2001) (green line) and Lognonné et al. (2003) (blue line) are plotted for comparison. (b) Theoretical group velocities (black lines) obtained from the final model (a, black line) for the fundamental mode and the first and second higher modes. Theoretical group velocity (fundamental mode) obtained from the initial model (Supplementary Material S5) is plotted in red line. The dots denote the group velocities shown in Figure 2C (blue line) and Supplements 3c and 4c (blue lines). Black vertical bars show the standard deviation in group velocities at each period (1-σ errors).
3 Discussion and conclusions
A rapid S-velocity gradient was determined from 0 to 5 km in depth (Figure 4a, black line) as observed in previous studies (Toksöz et al., 1974; Vinnik et al., 2001; Khan and Mosegaard, 2002; Lognonné et al., 2003; Gagnepain-Beyneix et al., 2006). The low S-velocities (<2 km/s) determined for the first layers (0–2 km-depth) can be associated with the presence of broken and fractured materials at the uppermost lunar strata (Vinnik et al., 2001; Lognonné et al., 2003; Figure 4a). In addition, very low velocities of between 0 and 2 km deep were determined by Kovach and Watkins (1973a), Kovach and Watkins (1973b), and Goins et al. (1977). The S-velocity increases with depth (Figure 4a, black line) as expected, but the S-velocity gradient becomes smaller below 5 km in depth (Larose et al., 2005; Sens-Schönfelder and Larose, 2010). This conspicuous feature is also observed in some publicly available 1-D S-velocity models, as shown in Figure 4 of Garcia et al. (2019). The present S-velocity model (Figure 4a, black line), determined from Rayleigh-wave analysis, is a first step for lunar crustal structure determination. More work is needed to precisely determine this structure, which will be possible when more quality data are measured in future missions.
Data availability statement
The seismic records used for this research are available from the Planetary Data System (PDS) of the National Aeronautics and Space Administration (NASA) at https://pds-geosciences.wustl.edu/lunar/urn-nasa-pds-apollo_pse/data/xa/continuous_waveform/. The station data are available from the MetaData Aggregator of the Seismological Facility for the Advancement of Geoscience (SAGE) at http://ds.iris.edu/mda/XA/?starttime=1969-01-01T00:00:00&endtime=1977-12-31T23:59:59.
Author contributions
VC: conceptualization, data curation, formal analysis, funding acquisition, investigation, methodology, project administration, resources, software, supervision, validation, visualization, writing – original draft, and writing – review and editing.
Funding
The author(s) declare that no financial support was received for the research and/or publication of this article.
Acknowledgments
The Apollo Passive Seismic Experiment has provided the data used in this study.
Conflict of interest
The author declares that the research was conducted in the absence of any commercial or financial relationships that could be construed as a potential conflict of interest.
Publisher’s note
All claims expressed in this article are solely those of the authors and do not necessarily represent those of their affiliated organizations, or those of the publisher, the editors and the reviewers. Any product that may be evaluated in this article, or claim that may be made by its manufacturer, is not guaranteed or endorsed by the publisher.
Supplementary material
The Supplementary Material for this article can be found online at: https://www.frontiersin.org/articles/10.3389/fspas.2025.1433697/full#supplementary-material
References
Abo-Zena, A. (1979). Dispersion function computations for unlimited frequency values. Geophys. J. R. Astronomical Soc. 58, 91–105. doi:10.1111/j.1365-246x.1979.tb01011.x
Aki, K., and Richards, P. G. (1980). “Quantitative seismology,” in Theory and methods. San Francisco: Freeman.
Cara, M. (1973). Filtering of dispersed wavetrains. Geophys. J. R. Astronomy Soc. 33, 65–80. doi:10.1111/j.1365-246x.1973.tb03415.x
Corchete, V. (2021). Crustal and upper-mantle structure beneath the south China sea and Indonesia. Geol. Soc. Am. Bull. 133, 177–184. doi:10.1130/b35641.1
Corchete, V. (2022). 3D S-wave velocity model of the crust and upper mantle beneath the Sea of Okhotsk and the Kamchatka peninsula. Lithosphere 1, 7323670. doi:10.2113/2022/7323670
Corchete, V., Chourak, M., and Hussein, H. M. (2007). Shear wave velocity structure of the Sinai Peninsula from Rayleigh wave analysis. Surv. Geophys. 28, 299–324. doi:10.1007/s10712-007-9027-6
Dal, M. G. (2015). Joint analysis of Rayleigh-wave dispersion and HVSR of lunar seismic data from the Apollo 14 and 16 sites. Icarus 254, 338–349. doi:10.1016/j.icarus.2015.03.017
Dziewonski, A., Bloch, S., and Landisman, M. (1969). A technique for the analysis of transient seismic signals. Bull. Seismol. Soc. Am. 59 (1), 427–444. doi:10.1785/bssa0590010427
Gagnepain-Beyneix, J., Lognonné, P., Chenet, H., Lombardi, D., and Spohn, T. (2006). A seismic model of the lunar mantle and constraints on temperature and mineralogy. Phys. Earth Planet. Interiors 159, 140–166. doi:10.1016/j.pepi.2006.05.009
Garcia, R. F., Gagnepain-Beyneix, J., Chevrot, S., and Lognonné, P. (2011). Very preliminary reference Moon model. Phys. Earth Planet. Interiors 188, 96–113. doi:10.1016/j.pepi.2011.06.015
Garcia, R. F., Khan, A., Drilleau, M., Margerin, L., Kawamura, T., Sun, D., et al. (2019). Lunar seismology: an update on interior structure models. Space Sci. Rev. 215, 50. doi:10.1007/s11214-019-0613-y
Goins, N. R., Dainty, A. M., and Toksöz, M. N. (1977). “The deep seismic structure of the moon,” in Proceedings of the eighth lunar science conference, 471–486.
Khan, A., and Mosegaard, K. (2002). An inquiry into the lunar interior: a nonlinear inversion of the Apollo lunar seismic data. J. Geophys. Res. 107 (E6), 5036. doi:10.1029/2001je001658
Kovach, R. L., and Watkins, J. S. (1973a). Apollo 17 seismic profiling-probing the lunar crust. Science 180, 1063–1064. doi:10.1126/science.180.4090.1063
Kovach, R. L., and Watkins, J. S. (1973b). “The structure of the lunar crust at the Apollo 17 site,” in Proceedings of the fourth lunar science conference, 2549–2560.
Larose, E., Khan, A., Nakamura, Y., and Campillo, M. (2005). Lunar subsurface investigated from correlation of seismic noise. Geophys. Res. Lett. 32, L16201. doi:10.1029/2005gl023518
Lognonné, P., Gagnepain-Beyneix, J., and Chenet, H. (2003). A new seismic model of the Moon: implications for structure, thermal evolution and formation of the Moon. Earth Planet. Sci. Lett. 211, 27–44. doi:10.1016/s0012-821x(03)00172-9
Matsumoto, K., Yamada, R., Kikuchi, F., Kamata, S., Ishihara, Y., Iwata, T., et al. (2015). Internal structure of the Moon inferred from Apollo seismic data and selenodetic data from GRAIL and LLR. Geophys. Res. Lett. 42, 7351–7358. doi:10.1002/2015gl065335
Nunn, C., Nakamura, Y., Kedar, S., and Panning, M. P. (2022). A new archive of apollo’s lunar seismic data. Planet. Sci. J. 3, 219. doi:10.3847/psj/ac87af
Sens-Schönfelder, C., and Larose, E. (2010). Lunar noise correlation, imaging and monitoring. Earthq. Sci. 23 (5), 519–530. doi:10.1007/s11589-010-0750-6
Toksöz, M. N., Dainty, A. M., Solomon, S. C., and Anderson, K. A. (1974). Structure of the moon. Rev. Geophys. Space Phys. 12, 539–567. doi:10.1029/rg012i004p00539
Keywords: Rayleigh wave, shear wave, crust, Moon, Apollo program
Citation: Corchete V (2025) Crustal structure of the Moon determined from short-period Rayleigh wave analysis. Front. Astron. Space Sci. 12:1433697. doi: 10.3389/fspas.2025.1433697
Received: 16 May 2024; Accepted: 30 April 2025;
Published: 26 May 2025.
Edited by:
Jianguo Yan, Wuhan University, ChinaReviewed by:
Sabrina Keil, Ludwig Maximilian University of Munich, GermanyMohamed Amrouche, Schlumberger, United States
Copyright © 2025 Corchete. This is an open-access article distributed under the terms of the Creative Commons Attribution License (CC BY). The use, distribution or reproduction in other forums is permitted, provided the original author(s) and the copyright owner(s) are credited and that the original publication in this journal is cited, in accordance with accepted academic practice. No use, distribution or reproduction is permitted which does not comply with these terms.
*Correspondence: Victor Corchete, Y29yY2hldGVAdWFsLmVz
 Victor Corchete