 Oluwasegun M. Adebayo1*
 Babatunde Rabiu2,3
 Alexandre A. Pimenta1
 Abraham C.-L. Chian1,4
 Oluwakemi Dare-Idowu5Daniel I. Okoh5,6
 Aderonke Akerele5
- 1Heliophysics, Planetary Science and Aeronomy Division, Instituto Nacional de Pesquisas Espaciais (INPE), São José dos Campos, Brazil
- 2National Space Research and Development Agency, Abuja, Nigeria
- 3Insitute of Space Science and Engineering, African University of Science and Technology, Abuja, Nigeria
- 4School of Computer and Mathematical Sciences, Adelaide University, Adelaide, SA, Australia
- 5United Nations African Regional Centre for Space Science and Technology Education - English, UN-ARCSSTE-E, Obafemi Awolowo University, Ile-Ife, Nigeria
- 6Department of Physics, Earth and Environmental Sciences, The Technical University of Kenya, Nairobi, Kenya
This study presents the first comprehensive investigation of low-latitude ionospheric plasma blobs in the African sector during the deep solar minimum period from January 2018 to December 2020, using data from the Swarm satellite mission. Plasma blobs are localized regions of enhanced electron density, often associated with equatorial plasma bubbles (EPBs). While EPBs are traditionally considered a key mechanism for blob formation, our analysis reveals that 55.2% of plasma blob events occurred independently of EPBs, indicating the influence of additional processes such as the fountain effect, local thermospheric winds, and lower atmospheric forcing. The results show that plasma blobs predominantly occur between 16:00 UT and 02:00 UT, with a notable concentration in northern Africa, suggesting regional susceptibility to ionospheric irregularities. Electron density enhancements within blobs range from 5% to over 100%, and with a median of approximately 25%. Cases with enhancements exceeding 100% are likely linked to geomagnetic storm-time activity. This study also identifies hemispheric asymmetry in blob occurrence, potentially driven by seasonal shifts in the Intertropical Convergence Zone (ITCZ), gravity wave activity, and magnetic field geometry unique to the African region. These findings highlight the complex, multifactorial nature of plasma blob formation in the African ionosphere and provide a critical baseline for future studies in this underexplored region. Understanding these dynamics is essential for improving models of ionospheric irregularities and mitigating their impacts on satellite communication and navigation systems over Africa.
1 Introduction
Ionospheric plasma blobs at low latitudes are localized regions of enhanced plasma density, substantially above the surrounding ambient plasma (Watanabe and Oya, 1986; Pimenta et al., 2004; Pimenta et al., 2007; Yokoyama et al., 2007; Huang et al., 2014; Tardelli-Coelho et al., 2017; Klenzing et al., 2011; Kil et al., 2019; Agyei-Yeboah et al., 2021; Park et al., 2022; Adebayo et al., 2023). The first observation of such localized plasma density enhancements, along with depletions in the nighttime tropical F-region, was reported by Watanabe and Oya (1986) using data from the Hinotori satellite. Their statistical analysis suggested that the occurrence probabilities of plasma depletions (bubbles) and enhancements (blobs) appear to be complementary, with plasma blobs typically confined to regions adjacent to those where plasma bubbles occur (Watanabe and Oya, 1986; Yokoyama et al., 2007; Huang et al., 2014; Adebayo et al., 2023). Subsequent observational and modeling studies have investigated the relationship between plasma blobs and other ionospheric phenomena, including Medium-scale Traveling Ionospheric Disturbances (MSTIDs), geomagnetic storms, and the Equatorial Ionization Anomaly (EIA) (Pimenta et al., 2007; Yokoyama et al., 2007; Klenzing et al., 2011; Kil et al., 2019; Park et al., 2022; Adebayo et al., 2023; Thokuluwa, 2025). Simultaneous observations of plasma blobs and plasma bubbles along the same magnetic meridian (Yokoyama et al., 2007; Huang et al., 2014), as well as numerical simulations (Ossakow et al., 1979; Zalesak et al., 1982; Carrasco et al., 2020), suggest a close connection between their generation mechanisms. However, the detection of blobs in the absence of bubbles (Klenzing et al., 2011) indicates that plasma bubbles are not a necessary condition for blob formation.
Recent studies have investigated various mechanisms to explain the formation of ionospheric plasma blobs (Park et al., 2022; Adebayo et al., 2023; Thokuluwa, 2025). For instance, Adebayo et al. (2023) reported the merging and bifurcation of plasma blobs in the Brazilian Amazon region. The merging was attributed to the influence of local neutral winds, while the bifurcation was linked to polarization electric fields within the associated equatorial plasma bubbles (EPBs). In this context, the amplification of polarization electric fields within developing plasma bubbles plays a key role in driving plasma upward, eventually leading to the formation of blobs (Huang et al., 2014; Adebayo et al., 2023). An alternative hypothesis attributes blob formation to meridional winds and nonuniform airflow in the ionosphere, which can modify the plasma distribution along a bubble’s magnetic flux tube, generating localized plasma enhancements or “blobs” (Klenzing et al., 2011; Wang et al., 2019). Also, observations in both the African and South American sectors have revealed occurrences of plasma bubbles without accompanying plasma blobs, highlighting the complex and variable nature of blob formation (Okoh et al., 2017; Chian et al., 2018; Adebayo, 2021). A recent case study over the African region by Park et al. (2023), using data from the GOLD satellite, associated plasma blob occurrences with activity in the Equatorial Ionization Anomaly (EIA). These blobs were found to remain near the EIA crest and poleward of adjacent plasma bubbles, consistent with earlier findings from the Central and South American sectors (Pimenta et al., 2007; Park et al., 2022).
While extensive research has been conducted over the Brazilian tropical sector and other sectors, studies focused on the African region remain limited and incomplete. In this paper, we present the first in-situ observations of ionospheric plasma blobs over the African sector during a deep solar minimum period (January 2018 – December 2020). This study aims to investigate the morphology, dynamics, and spatiotemporal characteristics of these plasma blobs. Key observational features are identified, analyzed, and discussed to improve our understanding of blob behavior in this underexplored region.
2 Data and observations
In this study, plasma blobs are identified as localized regions of enhanced electron density, typically exhibiting a 5%, or more, above ambient plasma density. To prevent potential artifacts, like small peak of electron density (Ne) around the dayside dip equator, as reported by Song et al. (2022), we excluded any enhancements located within ±5° of the 10°N latitude, as all artifacts were observed within this region. The identification of plasma blobs was carried out through a visual inspection (https://vires.services/) using both electron density data and Total Electron Content (TEC) data. Only electron density enhancements that coincided with corresponding TEC enhancements were considered valid. This is because known artifacts in the Swarm electron density data do not exhibit corresponding TEC enhancements (Song et al., 2022). Figure 1 illustrates the methodological workflow, beginning with data pre-processing followed by data analysis. To estimate the north-south scale size of the blobs, we used the along-track extension of the blobs. This extension was then converted into kilometers, where 1° of latitude was assumed to correspond to approximately 110 km. A similar approach was used by Le et al. (2003) for estimating the scale size of plasma blobs.
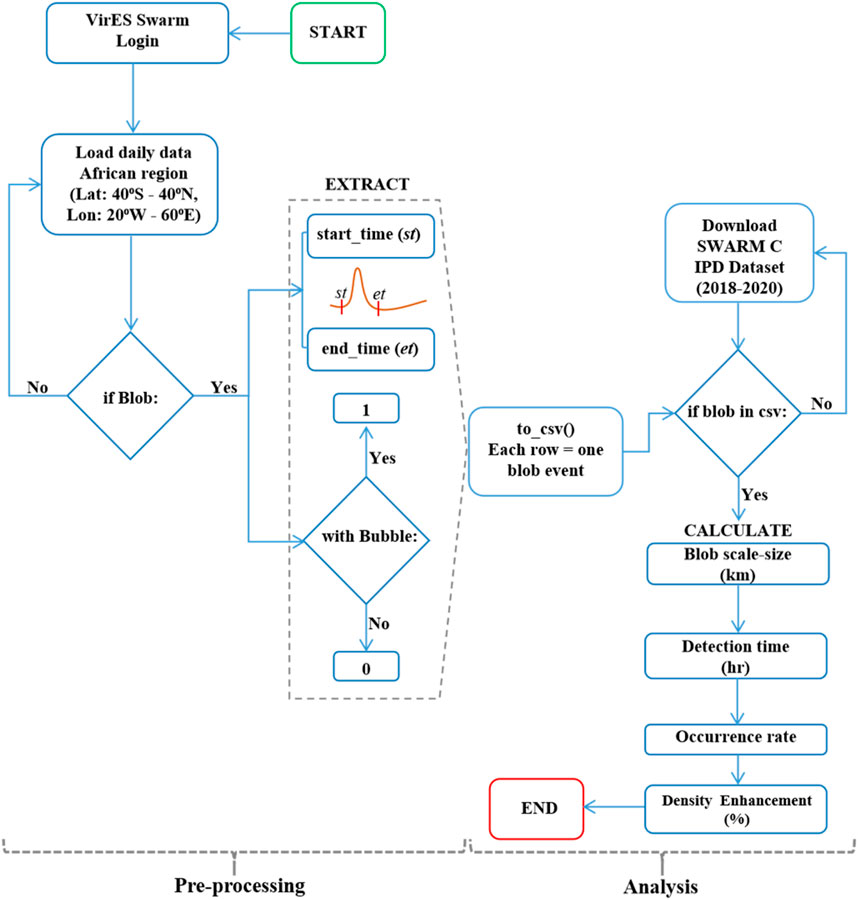
Figure 1. Flowchart illustrating the methodology, including data pre-processing, subsequent data analysis and visualization using Python.
Swarm is a constellation mission by the European Space Agency (ESA) consisting of three identical satellites, namely, Swarm A, B, and C, launched into near-polar orbits in November 2013. Their initial pearl-of-strings configuration allowed for the study of Polar Cap Patches (PCP) evolution, as Spicher et al. (2017) explained. In addition, Park et al. (2015) used the same configuration of the satellites (A, B, C) to study the westward tilt of plasma blobs. By April 2014, the satellites’ orbits had been set, resulting in Swarm A and Swarm C orbiting at about 460 km and Swarm B at approximately 510 km. Each Swarm satellite carries an identical payload comprising several instruments; in this study, we used only the electron density (Ne) and the Total Electron Content (TEC) data from satellite C as A makes practically the same observation as C but with about 1.6° difference in longitude (however, in future work, we plan to incorporate data from Swarm A to examine the possible cross-track (zonal) structure of plasma blobs). Both the Ne and TEC are derived from Electric Field Instrument (EFI) and onboard GPS Receiver (GPSR) instruments, respectively (Jin et al., 2020). In this study, Swarm satellite C data obtained during the period from January 2018 to December 2020 (Low solar activity; average 10.7 cm solar radio flux <80 × l0−22Wm-2Hz-1) were used to analyze the daily and seasonal occurrence of plasma blobs over the African Sector. Figure 2 shows an example of the trajectory of the Swarm satellite C (in blue) on 7 November 2018, and the magnetic equator (dashed line). In addition, the position of the detected plasma blob, and the crests of the EIA are shown as short red and magenta lines, respectively. Typically, Swarm satellite C passes over the African region six (6) times daily at varying longitudes.
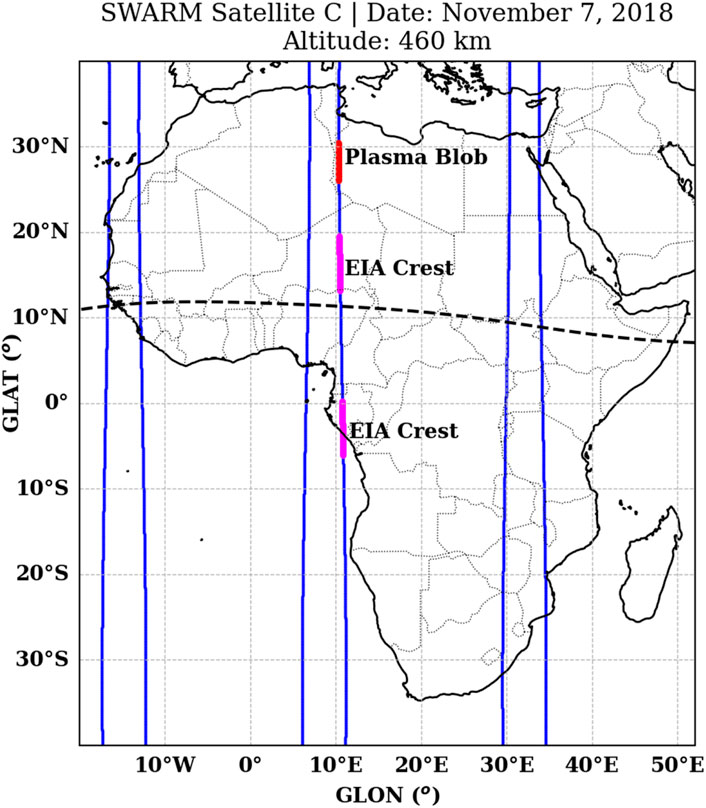
Figure 2. Blue lines show the Swarm Satellite C’s trajectories on 7 November 2018, in the African region. Short red line indicates where the plasma blob was detected for that day, and the two short magenta lines indicate the position of the EIA crests during the trajectory. Dashed line indicates the magnetic equator.
3 Results
3.1 Plasma blobs occurrence and geomagnetic conditions
Figure 3, presents the F10.7 index (upper panel) and the Dst index (bottom panel). In the figure, between the vertical red dashed lines, we have the period of Swarm Satellite C electron density data analyzed. The F10.7 index indicates relatively low solar activity during the period from January 2018 to December 2020, which provides an opportunity to examine the occurrence frequency and physical mechanisms responsible for ionospheric plasma blobs generation in the African sector. The deep solar minimum period of 2018–2020 was selected to minimize the influence of geomagnetic storm-driven ionospheric disturbances, which are frequent during high solar activity (Momeni and Migoya-Orué, 2025). This allows clearer isolation and investigation of lower atmospheric forcing mechanisms contributing to plasma blob formation in the African sector. Understanding these processes under quiet conditions enhances our ability to attribute cause-effect relationships, crucial for improving ionospheric modeling. Given that plasma blobs can impact satellite communication and GNSS reliability even during quiet times (Maruyama, 1991), their study during solar minimum has significant practical implications for space weather forecasting and technological resilience.
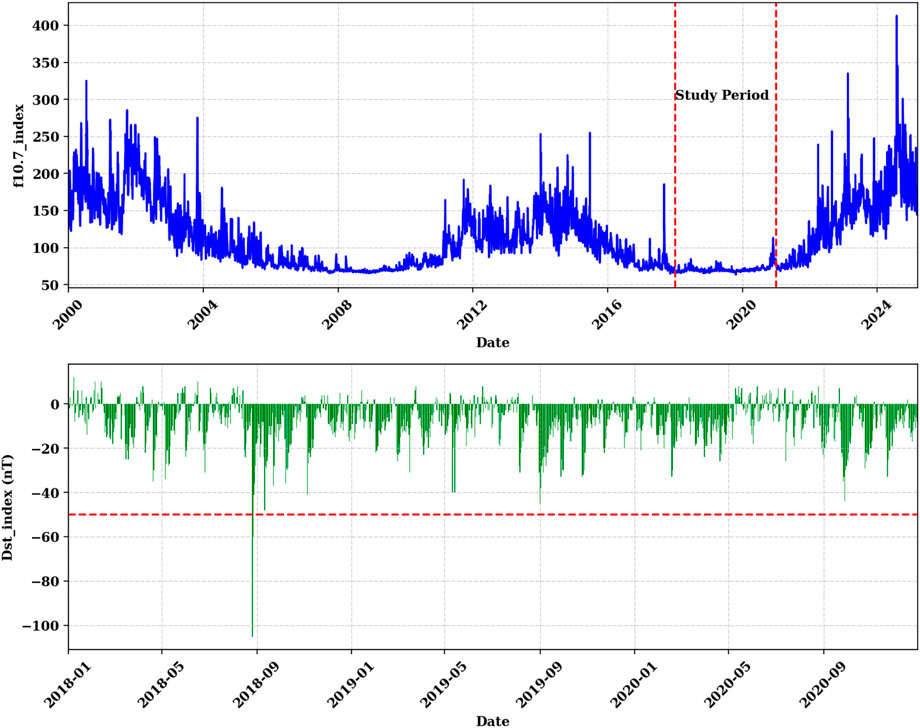
Figure 3. Upper-panel–F10.7 index for data from 2000-01-01 to 2025-03-15 and the two dashed vertical lines indicate the period of study, deep-solar minimum, 2018-01-01 to 2020-12-31. Lower-panel - Dst index for the period of study and the dashed red horizontal line indicates the cut-off Dst value for geomagnetic storm condition. These datasets were obtained from OMNIWeb (OMNIWeb Data Explorer).
In addition, to explore the relationship between geomagnetic conditions and plasma blob occurrence, we use the Dst index for classification. Figure 3 (lower-panel) displays the daily averaged Dst values from 1 January 2018, to 31 December 2020. To determine whether the geomagnetic conditions were calm or disturbed we adopted the criteria described in Gonzalez et al. (1994), in which great (or intense) storms are those with peak Dst of −100 nT or less, moderate storms fall between −50 nT and −100 nT, and weak storms are those between −30 nT and −50 nT. A weak geomagnetic storm occurred only on August 25-26, 2018, while the remaining days in the study period were characterized by relatively quiet geomagnetic conditions, with Dst values consistently above −50 nT (see horizontal dashed red line in Figure 3, lower panel). This suggests that the influence of prompt penetration electric fields from higher latitudes, a known driver of plasma irregularities during storm, is unlikely to be the primary cause of the majority of the blobs observed in this study.
3.2 Selected events of plasma blobs in the African Sector
Figure 4 presents electron density data from the Swarm Satellite C over the African sector on 7 November 2018; 25 October 2019; and 2 May 2020. The blobs, localized electron density enhancements, are indicated by black dashed arrows in the left panel, while the right panel shows the corresponding slant Total Electron Content (sTEC). In each case, the blobs were observed around 20°N to 30°N latitude and the density increased by 35%, 50% and 15% for 7 November 2018; 25 October 2019; and 2 May 2020, respectively. For the sTEC data, the blobs were detected by several Pseudo Random Noise (PRN) codes; however, only one PRN was selected for each case: PRN 5 for 7 November 2018; PRN 14 for 25 October 2019; and PRN 32 for 2 May 2020. Pseudo Random Noise (PRN) codes are unique, predefined binary sequences used in satellite navigation systems (like GPS) to identify and track individual satellites (Geri et al., 2016). Each satellite transmits a distinct PRN code, allowing receivers to distinguish signals from different satellites and measure signal travel time. This is essential for accurate positioning and for deriving ionospheric parameters such as Total Electron Content (TEC). In the context of this study, PRN codes are used to identify signals from GNSS satellites received by Swarm’s onboard GPS receivers, enabling precise TEC measurements along the satellite-to-GNSS signal path. These selected cases represent individual events from each year of the study, and all other events exhibit a similar pattern. Additionally, the Equatorial Ionization Anomaly (EIA) crests, indicated by red arrows, are clearly visible in each of the cases presented. The EIA is a prominent ionospheric feature characterized by two bands of enhanced electron density located approximately 15° north and south of the magnetic equator (Abdu et al., 1991; Balan et al., 2018). This phenomenon results from the combined influence of the fountain effect and inter-hemispheric winds (Xiong et al., 2013). The fountain effect is driven by strong eastward electric fields during the daytime, which, through E × B drift, lift ionospheric plasma vertically at the magnetic equator. Once elevated to higher altitudes where recombination rates are lower, the plasma moves along geomagnetic field lines under the influence of gravity and pressure gradients, descending at off-equatorial latitudes. This redistribution creates the two high-density crests of the EIA on either side of the equator (Batista et al., 2011; Khadka et al., 2018).
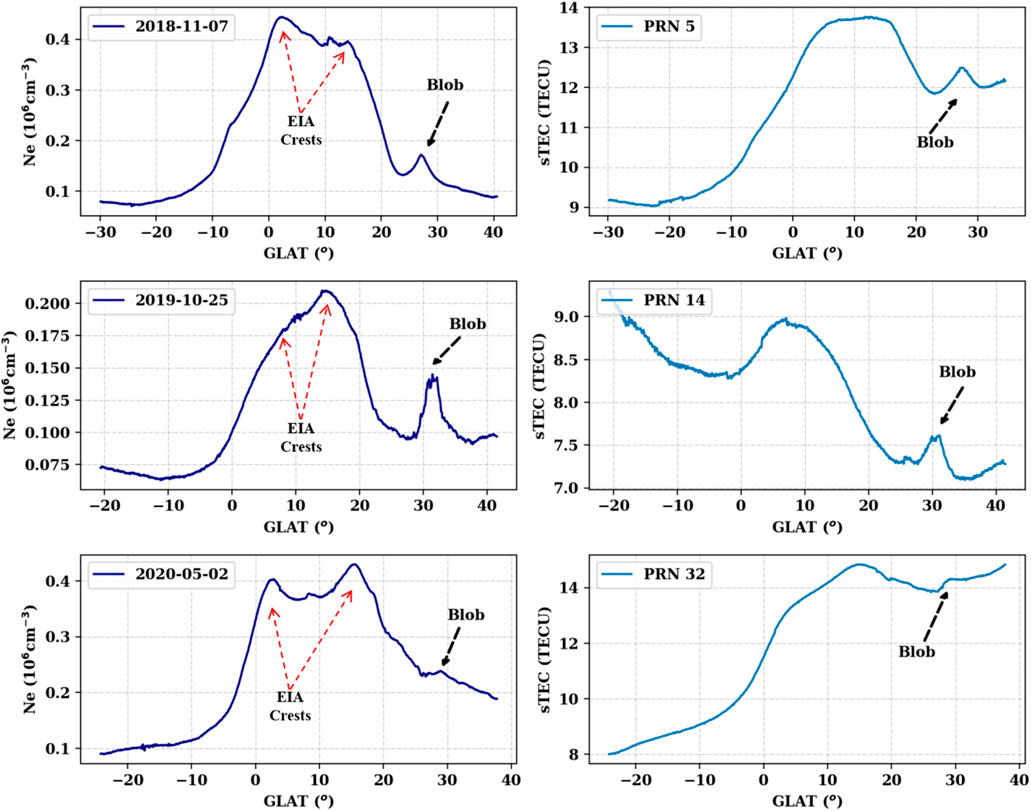
Figure 4. Left panel - Swarm Satellite C Electron density data in the African sector for 7 November 2018, 25 October 2019, and 2 May 2020 with blob indicated by black dashed arrows. Right panel - Corresponding absolute sTEC for 7 November 2018, 25 October 2019, and 2 May 2020 with the detected blob indicated also by black dashed arrows. The EIA crests are indicated by the red dashed arrows.
Complementing this process are inter-hemispheric winds, which can influence the symmetry and intensity of the EIA crests (Xiong et al., 2013; Loutfi et al., 2022). These thermospheric winds, often driven by seasonal heating differences between hemispheres, can push plasma preferentially toward one hemisphere, modulating the latitudinal position and strength of the anomaly (Batista et al., 2011; Khadka et al., 2018; Kwak et al., 2019). For example, during solstices, the wind tends to flow from the summer to the winter hemisphere, enhancing the EIA crest in the winter hemisphere while suppressing it in the summer hemisphere (Huang et al., 2018). Thus, the temporal and spatial behavior of the EIA is largely governed by the dynamics of the fountain effect and modulated by the prevailing inter-hemispheric wind patterns, both of which vary with local time, season, and solar activity.
3.3 Distributions of plasma blobs in the African Sector
Figure 5 shows the distribution of plasma blobs detected by the Swarm Satellite C over the African sector from 1 January 2018, to 31 December 2020. The blobs are color-coded by year: blue for 2018, red for 2019, and green for 2020. A total of 231 blob events were recorded in 2018, 206 in 2019, and 187 in 2020. The difference in the number of events between 2018 and 2019 is 25, and between 2019 and 2020 is 19. This trend suggests a gradual decline in the number of blob events as solar activity begins to increase. In other words, as the solar cycle transitions out of the deep solar minimum and enters its ascending phase, the occurrence rate of plasma blobs appears to decrease. Our findings are consistent with the conclusions of Watanabe and Oya (1986), supporting this observed trend. Additionally, our results reveal for the first time a hemispheric asymmetry in plasma blob occurrence during the deep solar minimum. As shown in Figure 5, blob occurrence frequency is concentrated primarily in the geographic latitude (GLAT) range of 20°–35° in the Northern Hemisphere, whereas in the Southern Hemisphere, it spans a wider range from 0° to 35°. This spatial difference between hemispheres suggests a significant role of land–atmosphere–ionosphere coupling in influencing both the Equatorial Ionization Anomaly (EIA) and local thermospheric winds, thereby affecting the generation and distribution of plasma blobs in the African sector during periods of low solar activity.
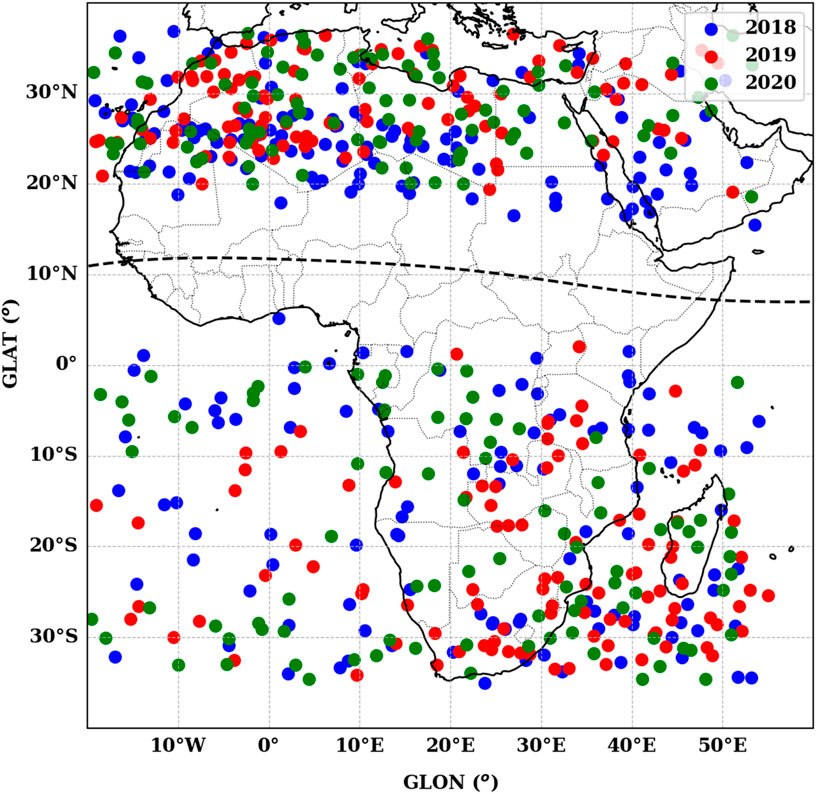
Figure 5. The location of the 650 plasma blobs detected in the African sector by Swarm satellite C. Blue dots represent the blobs detected in year 2018, red dots indicates the blobs detected in year 2019 and green dots indicate the blobs detected in year 2020.
3.4 Seasonal/monthly variations of plasma blobs
Seasonal and monthly distribution of plasma blobs in the African sector during the period from January 2018 to December 2020 are presented in Figure 6. In January, a higher number of events are observed in southern Africa sector compared to northern Africa sector. In February, March, and April, the blobs are more concentrated around 20°N to 30°N, particularly evident in February and March. During the equinoxes, in March and September, the distribution is similar, with blobs clustered at 20°N to 30°N. In contrast, during the solstices in June and December, the occurrence rate of plasma blobs is lower, and no such clustering is observed at 20°N to 30°N. In May, July, and August, plasma blobs appear to be more widespread (in higher latitudes), with occurrences shifting primarily northwestward and southeastward. However, in October and November, the cluster of blobs at 20°N to 30°N reappears. These varying spatial and seasonal patterns suggest that multiple mechanisms are possibly responsible for the generation of these plasma blobs. June, August, and December have the fewest cases of plasma blobs similar to the report of Park et al. (2008a). Several mechanisms have been proposed to explain the generation of plasma blobs, including the development of equatorial plasma bubbles (plasma depletions), the equatorial ionization anomaly (EIA), traveling ionospheric disturbances (TIDs), and non-uniform thermospheric winds (Watanabe and Oya, 1986; Pimenta et al., 2004; 2007; Krall et al., 2010; Huang et al., 2014; Tardelli-Coelho et al., 2017; Kil et al., 2019; Agyei-Yeboah et al., 2021; Adebayo, 2021; 2023; Park et al., 2022; 2023). Thus, the seasonal variations in blob characteristics suggest a possible interplay of multiple mechanisms responsible for their generation.
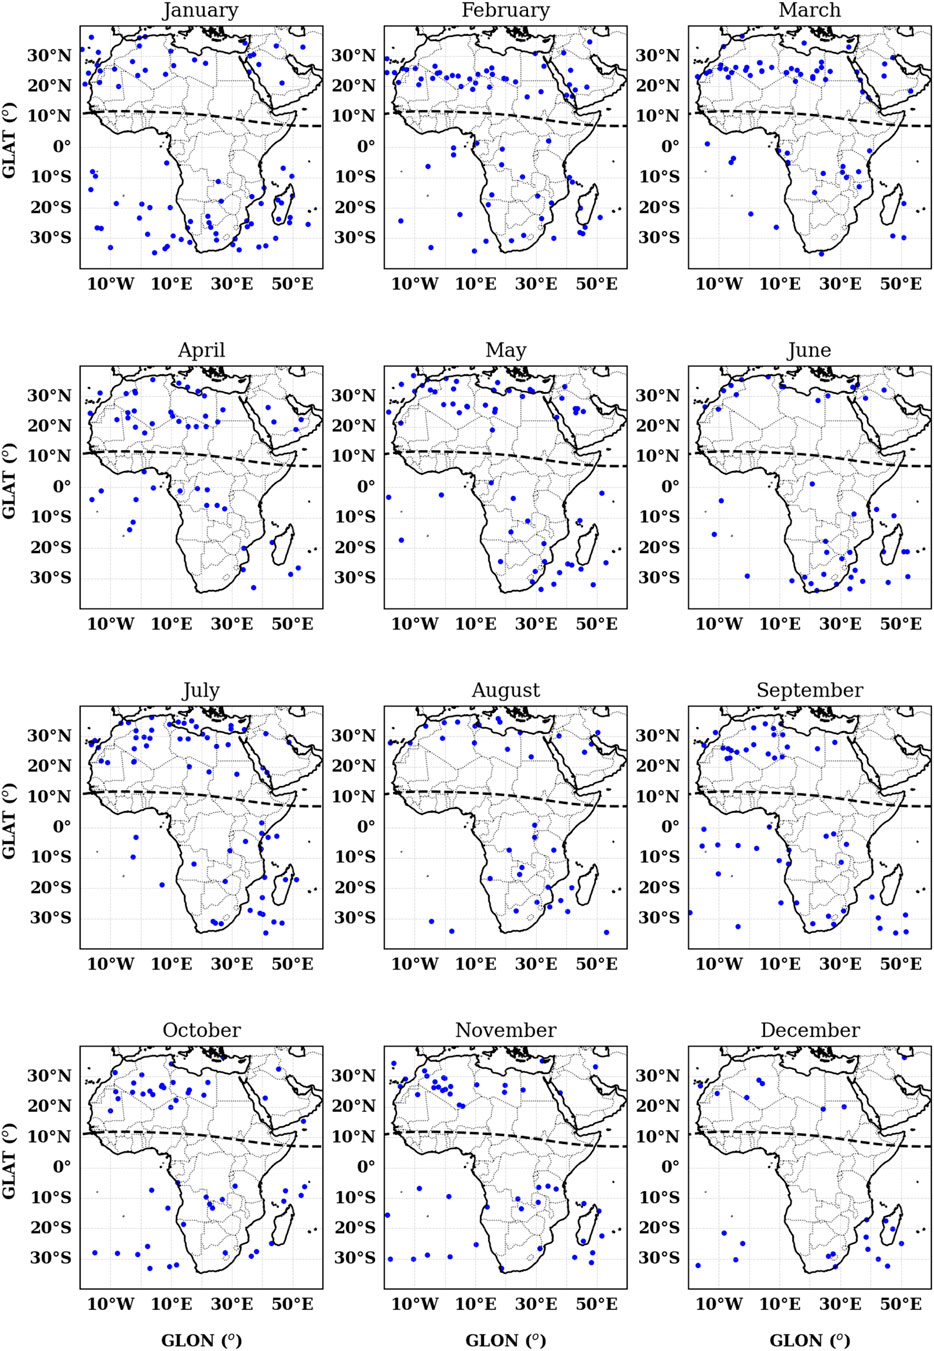
Figure 6. Seasonal/Monthly occurrence pattern of the plasma blobs from 2018 to 2020.
3.5 Detection time and scale-size of plasma blobs
Figure 7 shows the distribution of plasma blob detection times (in UT hours) for each year as well as the combined data (left panel), and the north-south extent (in kilometers) of the blobs (right panel). For 2018, most plasma blobs were detected between 15:00 UT and 05:00 UT, with few or no events observed between 06:00 UT and 14:00 UT. A similar pattern is evident in 2019, with most blobs detected between 16:00 UT and 05:00 UT, and little to no events between 05:00 UT and 15:00 UT. In 2020, the majority of blobs were detected between 15:00 UT and 05:00 UT, with a similar absence of events between 06:00 UT and 14:00 UT. For the combined dataset, the pattern mirrors that of each individual year, with the highest blob occurrences between 15:00 UT and 05:00 UT and very few events from 05:00 UT to 14:00 UT. These findings suggest that plasma blobs in the African sector are most frequently detected after sunset, with peak occurrences in the pre-midnight (22:00 UT) to post-midnight (02:00 UT) hours, followed by a decline towards sunrise. This temporal distribution aligns with the findings of Su et al. (2022) and Park et al. (2008b), who observed peak blob occurrences in the pre- and post-midnight hours. Using an all-sky imager, Adebayo (2021) tracked the scale size of plasma blobs from post-sunset to post-midnight, reporting that the blobs reached full development around local midnight (24:00 h). Later, Adebayo et al. (2023) observed merging and bifurcation of plasma blobs near midnight, after which the structures disappeared from the imager’s field of view. Hence, the results of the present study further support the notion that plasma blobs are most commonly detected between the sunset and pre-midnight hours.
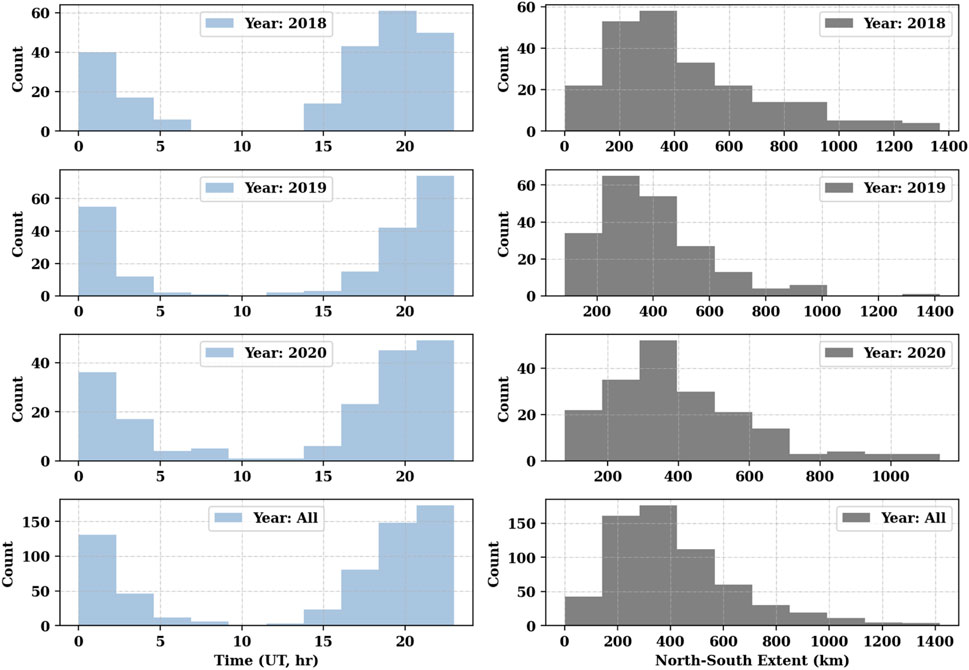
Figure 7. Left-panel - Time distribution of the occurrence of plasma blobs for year 2018, 2019, 2020 and the combined year. Right-panel - North-South extent of the plasma blobs for year 2018, 2019, 2020 and the combined years.
The scale size of the plasma blobs, determined from their along-track north-south extension, shows a right-skewed distribution. The average scale size for 2018, 2019, and 2020 is approximately 440.8 km, 392.5 km, and 401.8 km, respectively. For the combined dataset, the right-skewed distribution remains evident, with an estimated average scale size of 413.2 km. Previous studies report varying estimates of plasma blob scale sizes. Park et al. (2015), using Swarm satellite data, reported a westward tilt in plasma blobs, with a north–south extent of approximately 5°, corresponding to a latitudinal size of about 500 km. Pimenta et al. (2007), using an all-sky imager, found typical east-west and north-south extensions of 110–160 km and 200–460 km, respectively. Wang et al. (2015), based on in-situ measurements from ROCSAT, estimated the scale size to be around 800 km. Adebayo (2021) reported a north-south extent of 110–230 km using an all-sky imager during periods of both high and low solar activity. Similarly, Pimenta et al. (2004) estimated the east-west and north-south extensions to be 100–140 km and 130–170 km, respectively. Considering the scale size distribution observed in Figure 7 and comparing it with these previous findings, most especially Park et al. (2015), it is evident that our results align with the general range of values reported in the literature.
3.6 Spatiotemporal distribution of plasma blobs
To investigate the distribution of plasma blobs in the African sector, including their latitudinal variation, we analyzed data from 2018 to 2020, considering latitude, longitude, day of the year, and event count. Figure 8 illustrates the spatiotemporal distribution of plasma blob occurrences. The upper panel shows the latitudinal occurrence rate throughout the year, with events binned into 5° latitude intervals and 10-day intervals for the Day of Year (DOY). The color intensity represents binned event frequency, highlighting both seasonal and latitudinal variations. The lower panel extends this analysis by incorporating longitudinal information, mapping event occurrences onto a latitude–longitude–day-of-year (DOY) grid. It shows a single slice for DOY 050, while the full temporal distribution is compiled into a video provided as Supplementary Material. Latitude and longitude are discretized into 2° and 5° bins, respectively, while DOY is sampled at 10-day intervals. This provides a comprehensive view of the spatial and temporal distribution of plasma blobs across different African sectors throughout the year. From the upper panel of Figure 8, the latitudinal distribution of blob occurrences shows a higher frequency of events in northern Africa (specifically between 15°N and 30°N, with maximum peak in February and March. The lower panel of Figure 8 shows a similar pattern, with most blobs detected in northern Africa and fewer events observed in southern Africa. This study is the first to highlight the spatiotemporal patterns of plasma blobs in the African sector and to report a significant concentration of occurrences in the northern African region, indicating that this area may be more prone to ionospheric plasma irregularities compared to other parts of the sector. More so, the African Northern Hemisphere is known for strong diurnal heating, which can modulate local neutral winds, subsequently influencing phenomena such as the Equatorial Ionization Anomaly (EIA) and gravity waves, thereby impacting blob morphology and dynamics and pointing to the role of land–atmosphere–ionosphere coupling.
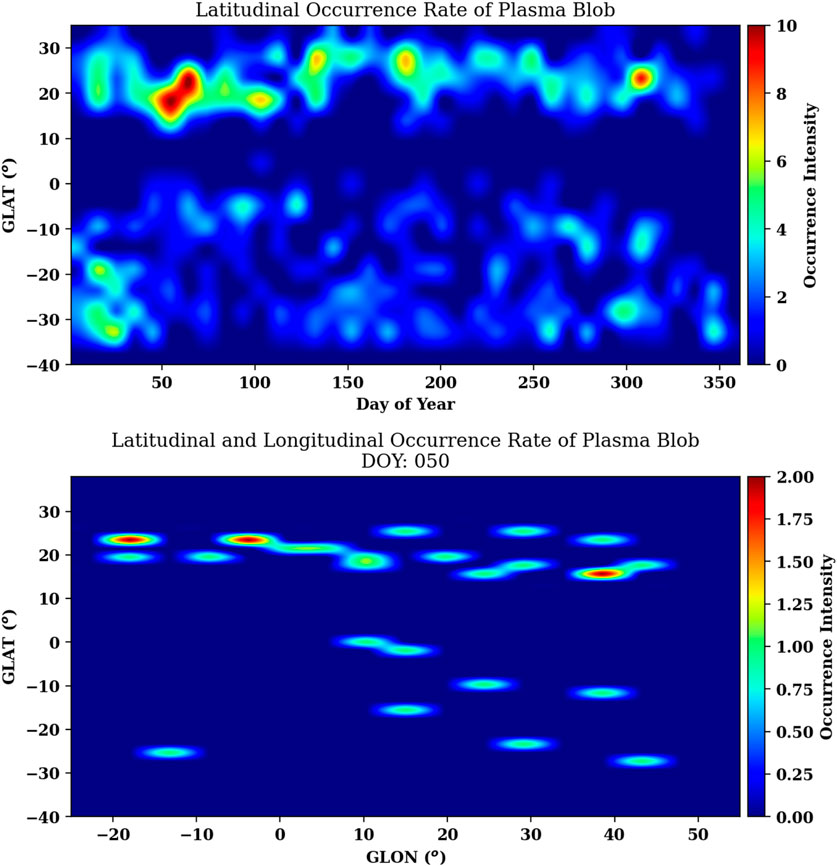
Figure 8. Upper panel - The figure shows the latitudinal occurrence rate of plasma blobs over the year (2018 - 2020), with 10-day intervals for the Days of Year (DOY) and 5° latitude bins. The 2D histogram accumulates counts of events within each DOY and latitude bin. The intensity of the plot represents the binned frequency of occurrences, with color indicating count density. Lower panel - The occurrence of events is mapped onto a latitude-longitude-day-of-year (DOY) grid, where events are binned at 10-day intervals across the year. Latitude and longitude are discretized into 2° and 5° steps, respectively. The 2D histogram accumulates event counts within each spatial and temporal bin.
4 Discussion
This study presents the first comprehensive characterization of ionospheric plasma blob occurrences in the topside ionosphere over the African sector during a deep solar minimum. Plasma blobs, a type of ionospheric plasma irregularity, are known to disrupt radio communication through signal fluctuations and scintillation (Jin et al., 2020). To quantify plasma enhancement within blobs, we calculated the percentage increase in electron density relative to background levels (Figure 9). The results show a right-skewed distribution, with most events exhibiting enhancements between 5% and 100%, and a median around 25%. Unlike previous case-study-based reports, this statistical approach provides a broader perspective. Earlier studies (e.g., Watanabe and Oya, 1986) found enhancements up to 200% during high solar activity, but such levels are less common during deep solar minimum conditions. The lower enhancements observed here are consistent with reduced background densities and lower solar flux. Nevertheless, rare events with >100% enhancement may reflect geomagnetic storm-time effects, as noted by Pimenta et al. (2007). Overall, our findings show that during deep solar minimum, plasma blobs over the African sector typically enhance electron density by 5%–100%, with occasional events exceeding this range due to storm-time dynamics.
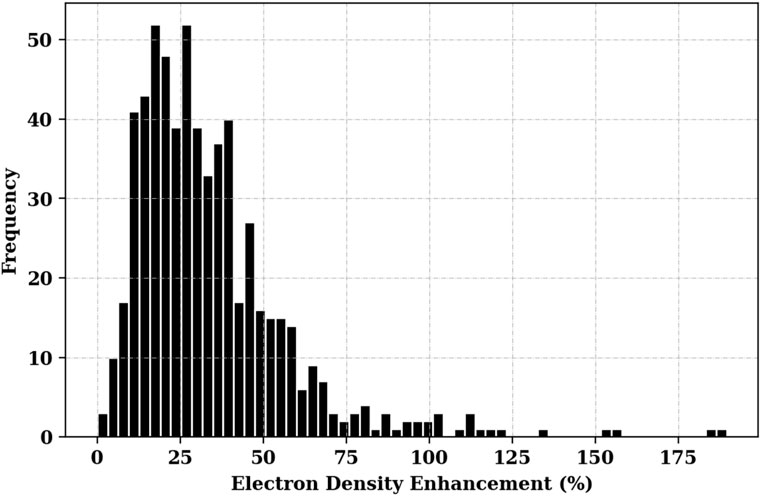
Figure 9. Electron density enhancement (%) for each plasma blob event, calculated as the percentage increase relative to the background density. This quantifies the degree of plasma enhancement associated with each event.
The analysis of plasma blob occurrences in the African sector from January 2018 to December 2020 provides valuable insights into their distribution, timing, and potential generation mechanisms. The results indicate that plasma blobs primarily occur during the post-sunset to post-midnight hours, with peak occurrences around pre-midnight. This pattern is consistent with previous studies in other sectors, such as those by Su et al. (2022), Adebayo (2021) and Park et al. (2010), which suggest a close association between plasma blob formation and nighttime ionospheric dynamics.
One of the leading mechanisms for plasma blob generation is the role of equatorial plasma bubbles (EPBs), which have been widely reported as a key driver (Park et al., 2003; Pimenta et al., 2007; Huang et al., 2014; Tardelli-Coelho et al., 2017; Agyei-Yeboah et al., 2021; Adebayo et al., 2023; Thokuluwa, 2025). EPBs typically form around the magnetic equator and are mapped along geomagnetic field lines to low latitudes, potentially seeding blob formation at varying latitudes during their evolution (Huang et al., 2014). Several cases observed in this study support this hypothesis, as shown in Figure 10 (2018-05-12, 2018-08-30, 2019-02-08). However, in the first panel (2018-05-12), a case study reveals a blob located only at the northern edge of the plasma bubble, with no corresponding southern edge counterpart similar to the report of Park et al. (2010), Figure 2, panel (e). This suggests that plasma blobs associated with EPBs may not always be symmetrical, contrary to the hypothesis put forth by Huang et al. (2014). Meridional thermospheric winds could play a significant role in this asymmetry, as previously suggested by Luo et al. (2018) and Krall et al. (2010). The presence of strong zonal and meridional winds can either enhance or suppress the development of EPBs (Aa et al., 2024), thereby influencing the spatial distribution of blobs. On the other hand, the difference between the northern and southern hemispheres in the spatial distribution of plasma blobs indicates that land–atmosphere–ionosphere coupling may play a key role in modulating both the Equatorial Ionization Anomaly (EIA) and thermospheric winds, thereby influencing the generation and distribution of blobs in the African sector during deep solar minimum.
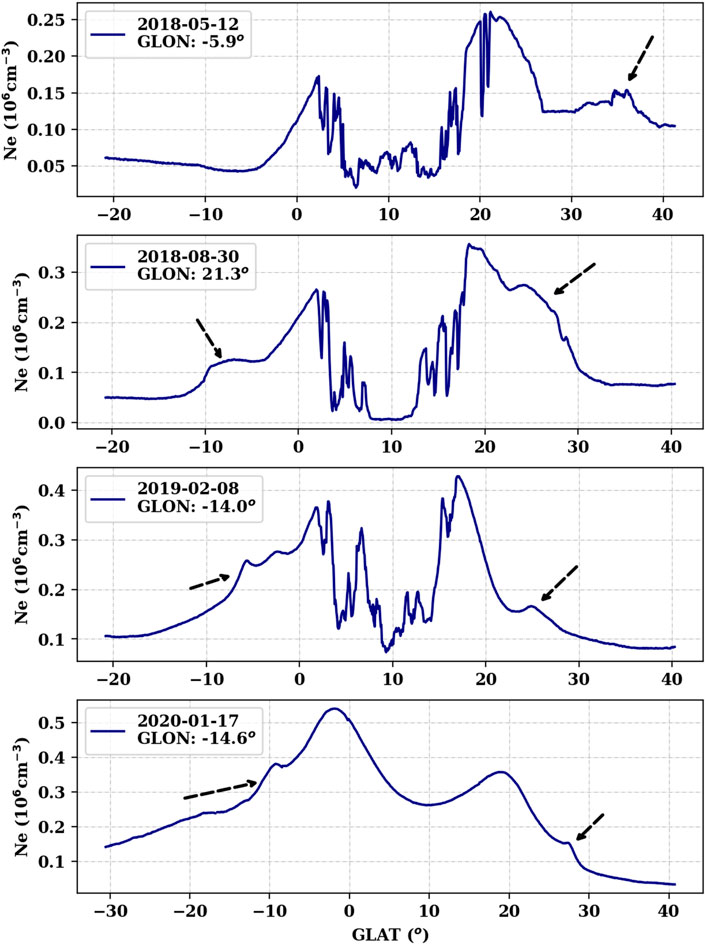
Figure 10. Case studies of plasma blobs and their accompanying ionospheric phenomena. Event 2018-05-12 shows the plasma blobs in the northern edge (poleward) of plasma bubbles and no such blob in the southern edge. Events 2018-08-30 and 2019-02-08 show the asymmetry blobs in both the northern and southern edge of the plasma bubble. Event 2020-01-17 shows an example of asymmetry plasma blobs but in the absence of plasma bubbles. The arrows point to the plasma blobs.
Furthermore, we observed several instances where plasma bubbles were present without accompanying plasma blobs, and vice versa. Quantitatively, 44.8% of the blob events occurred in conjunction with EPBs, either in the same longitude or in adjacent longitudes, while 55.2% of blob events occurred in the absence of EPBs. The absence of EPBs indicates that no depletions were recorded along the trajectories on the days when blobs were detected. For example, the three cases shown in Figure 4 were detected in the absence of EPBs, but we noted deformations in the EIA structure, such as the merging of the two crests in the event of 25 October 2019. Adebayo (2021) observed similar cases of bubbles without blobs over the Brazilian sector using optical instruments, suggesting that polarization electric fields (E) might play a crucial role in the formation of plasma blobs associated with EPBs. They proposed that a threshold of polarization electric field strength might be required to trigger blob development, compared to the cases of bubbles without blobs. In addition, they stated that EPBs without blobs exhibited a relatively shorter depletion band compared to those associated with blobs. Interestingly, several symmetrical blobs were also observed in the EIA without EPBs in the African longitudes (e.g., 2020-01-17, Figure 10), raising the possibility that these blobs are related to fountain effects combined with local neutral wind dynamics as suggested by Pimenta et al. (2007).
Additionally, our results reveal for the first time a hemispheric asymmetry in plasma blob occurrence during the deep solar minimum. Blob occurrence frequency is concentrated primarily in the geographic latitude (GLAT) range of 15°–30° in the Northern Hemisphere, whereas in the Southern Hemisphere, it spans a wider range from 0° to 35°. This spatial difference between hemispheres suggests a significant role of both the Equatorial Ionization Anomaly (EIA) and thermospheric winds in the generation and distribution of plasma blobs in the African sector during periods of low solar activity. Based on these findings, we can infer that the generation of plasma blobs in the African sector is likely driven by a combination of factors, including geomagnetic field variations, EIA dynamics, EPBs, and neutral wind interactions. The diverse characteristics of the observed blobs suggest that a deeper understanding of their physical processes, such as development and morphology, could enhance our knowledge of ionospheric plasma irregularities, particularly in underexplored sectors like Africa.
4.1 Possible mechanisms for the generation of plasma blobs in the African Sector
Considering the observed diverse features of plasma blobs in the current study, the coupling between the land/Earth surface and the upper atmosphere/ionosphere could be a significant underlying factor in why plasma blobs in the African sector show patterns different from other regions. Below, we discuss how such coupling might have influenced the observed results.
4.1.1 Thermospheric wind modulation by lower atmospheric forcing
Large-scale circulation in the thermosphere can be influenced by tides and planetary waves generated in the lower atmosphere (Rishbeth and Garriott, 1969; de Araujo et al., 2020). Over Africa, strong diurnal heating (due to high solar insolation) over land, especially in the northern hemisphere subtropics, can amplify upward-propagating atmospheric tides (Tuenter et al., 2003; Attwood et al., 2024). These tides can modulate EIA strength and plasma transport, potentially leading to asymmetric plasma blob occurrence between hemispheres, as observed in the present study.
4.1.2 Gravity wave forcing from convection
Africa is known for intense deep convective systems, especially near the equator and in northern subtropical regions (e.g., ITCZ migration zones) (Futyan and Del Genio, 2007; Wu et al., 2020). Convective activity can generate gravity waves that propagate upward, perturbing ionospheric electron density (Seba et al., 2021; Essien et al., 2022; Nyassor et al., 2025). Such perturbations can seed instabilities (like localized E × B drifts or plasma density enhancements) that favor blob formation, even without EPBs, possibly accounting for the observed “independent blobs”.
4.1.3 Magnetic field geometry and land–ocean contrast
The African sector’s magnetic declination and inclination differ from South America significantly, affecting how neutral wind patterns (driven from below) project into plasma transport along field lines (Zhang et al., 2012; Sun et al., 2015). The land–ocean thermal contrast is strong in the African sector (west coast upwelling, large inland deserts) (Futyan and Del Genio, 2007), producing pressure gradients that feed into thermospheric wind systems and possibly influence blob latitudinal distribution. This could explain why blobs are more frequent between 15°N and 30°N and have broader occurrence in the southern hemisphere.
4.1.4 Seasonal and hemispheric asymmetry
The seasonal shift of the ITCZ changes where the strongest tropospheric convection occurs (Suzuki, 2011). In the African sector, the ITCZ experiences a seasonal shift, moving northwards during the Northern Hemisphere’s summer and southwards during the winter. This shift is driven by the differential heating of land and ocean, causing the ITCZ to follow the warmest surface temperatures (Nicholson, 2018). In the spatiotemporal results, peaks in February–March match the northern hemisphere’s pre-equinox heating period, when coupling effects from the lower atmosphere are known to be strong. Such seasonal modulation could drive the hemispheric asymmetry observed in the present study.
These proposed mechanisms require further thorough investigation through coordinated ground-based and in-situ observations, as well as modeling efforts.
5 Conclusion
This study provides the first comprehensive investigation into the occurrence and characteristics of plasma blobs in the topside ionosphere over the African sector during a deep solar minimum period (2018–2020). Using Swarm satellite data, we characterized the spatial, temporal, and seasonal patterns of blob occurrences, as well as their internal plasma enhancements. The results show that plasma blobs predominantly form between 16:00 UT and 02:00 UT, aligning with post-sunset ionospheric dynamics. A higher concentration of blobs was observed in northern Africa, likely due to land–atmosphere–ionosphere coupling, processes particularly relevant in the African context and the influence of local thermospheric wind patterns. While equatorial plasma bubbles (EPBs) were confirmed as a major driver of blob formation, our findings also reveal that approximately 55.2% of blobs occurred without any associated EPBs. These independent events suggest the presence of alternative mechanisms. We propose that lower atmospheric processes, such as enhanced atmospheric tides, gravity waves from deep convection, and the strong land–ocean thermal contrasts specific to the African sector, modulate thermospheric winds and electric fields, thus contributing to blob generation. Seasonal ITCZ migration and hemispheric heating asymmetries also appear to influence the latitudinal distribution and hemispheric occurrence of blobs. Our analysis of electron density enhancements within blobs shows a right-skewed distribution, with most events exhibiting a 5%–100% increase over background levels and a median enhancement around 25%. Rare cases exceeding 100% may be linked to geomagnetic storm-time activity, consistent with previous storm-related observations.
These findings show the complex, multifactorial nature of plasma blob formation in the African ionosphere, highlighting the role of regional geophysical conditions and lower atmosphere–ionosphere coupling. This study provides a valuable baseline for future work and reinforces the need for integrated observations across atmospheric layers. In future work, we plan to incorporate data from Swarm A to examine the cross-track (zonal) structure of plasma blobs. This will complement our current along-track (meridional) analysis and allow for a more complete characterization of blob morphology, although such efforts will require substantial re-processing of the dataset.
Data availability statement
The satellite data used for this research can be freely obtained from https://earth.esa.int/web/guest/swarm/data-access.
Author contributions
OA: Investigation, Visualization, Conceptualization, Project administration, Formal Analysis, Software, Methodology, Writing – original draft, Data curation, Writing – review and editing. BR: Project administration, Validation, Investigation, Resources, Supervision, Funding acquisition, Writing – review and editing. AP: Investigation, Resources, Writing – review and editing, Funding acquisition, Supervision, Validation, Formal Analysis. AC: Validation, Writing – review and editing, Formal Analysis. OD-I: Project administration, Writing – review and editing, Investigation. DO: Writing – review and editing, Validation, Project administration. AA: Project administration, Writing – review and editing.
Funding
The author(s) declare that financial support was received for the research and/or publication of this article. Oluwasegun M. Adebayo acknowledges the National Space Research and Development Agency (NASRDA), for the research grant (CAR/R&D/PROJ/2022) supporting the project titled “Characterization of Ionospheric Plasma Irregularities in the African Sector.” Additionally, Oluwasegun M. Adebayo acknowledges the Conselho Nacional de Desenvolvimento Científico e Tecnológico (CNPq) for PhD research fellowship (161901/2022-0). Alexandre A. Pimenta acknowledges support from FAPESP through grants 2022/10144-9 and 2023/04783-1, as well as from the Brazilian Ministry of Science, Technology and Innovation and the Brazilian Space Agency via grant 20VB0009172430.
Acknowledgments
We also acknowledge the European Space Agency (ESA) for generously providing access to Swarm satellite data, which was crucial for our research. Furthermore, Oluwasegun M. Adebayo gratefully acknowledges Kazuo Shiokawa and Yuichi Otsuka for their constructive feedback, which significantly enhanced the quality of this work. We would like to thank both reviewers for their valuable comments and constructive suggestions, which have helped improve the clarity and quality of this work.
Conflict of interest
The authors declare that the research was conducted in the absence of any commercial or financial relationships that could be construed as a potential conflict of interest.
Generative AI statement
The author(s) declare that no Generative AI was used in the creation of this manuscript.
Any alternative text (alt text) provided alongside figures in this article has been generated by Frontiers with the support of artificial intelligence and reasonable efforts have been made to ensure accuracy, including review by the authors wherever possible. If you identify any issues, please contact us.
Publisher’s note
All claims expressed in this article are solely those of the authors and do not necessarily represent those of their affiliated organizations, or those of the publisher, the editors and the reviewers. Any product that may be evaluated in this article, or claim that may be made by its manufacturer, is not guaranteed or endorsed by the publisher.
Supplementary material
The Supplementary Material for this article can be found online at: https://www.frontiersin.org/articles/10.3389/fspas.2025.1648901/full#supplementary-material
References
Aa, E., Pedatella, N. M., and Liu, G. (2024). Impacts of the sudden stratospheric warming on equatorial plasma bubbles: suppression of EPBs and Quasi-6-Day oscillations. Remote Sens. 16 (8), 1469. doi:10.3390/rs16081469
Abdu, M. A., Sobral, J. H. A., De Paula, E. R., and Batista, I. S. (1991). Magnetospheric disturbance effects on the equatorial ionization anomaly (EIA): an overview. J. Atmos. Terr. Phys. 53 (8), 757–771. doi:10.1016/0021-9169(91)90126-r
Adebayo, M. O. (2021). Plasma blobs in the tropical region: a study using ground-based optical and radio techniques and multisatellite data (MSc thesis). Redirection to the bibliographic mirror. Retrieved April 1, 2025, Available online at: http://mtc-m21d.sid.inpe.br/col/sid.inpe.br/mtc-m21d/2021/07.19.19.39/doc/thisInformationItemHomePage.html
Adebayo, M. O., Pimenta, A. A., Savio, S., and Nyassor, P. K. (2023). Airglow imaging observations of plasma blobs: merging and bifurcation during solar minimum over tropical region. Atmosphere 14 (3), 514. doi:10.3390/atmos14030514
Agyei-Yeboah, E., Fagundes, P. R., Tardelli, A., Pillat, V. G., Pignalberi, A., Kavutarapu, V., et al. (2021). Ground and satellite-based observations of ionospheric plasma bubbles and blobs at 5.65 latitude in the Brazilian sector. Adv. Space Res. 67 (8), 2416–2438. doi:10.1016/j.asr.2021.01.034
Attwood, K., Washington, R., and Munday, C. (2024). The southern African heat low: structure, seasonal and diurnal variability, and climatological trends. J. Clim. 37 (10), 3037–3053. doi:10.1175/jcli-d-23-0522.1
Balan, N., Souza, J., and Bailey, G. J. (2018). Recent developments in the understanding of equatorial ionization anomaly: a review. J. Atmos. Solar-Terrestrial Phys. 171, 3–11. doi:10.1016/j.jastp.2017.06.020
Batista, I. S., Diogo, E. M., Souza, J. R., Abdu, M. A., and Bailey, G. J. (2011). “Equatorial ionization anomaly: the role of thermospheric winds and the effects of the geomagnetic field secular variation,” in Aeronomy of the earth's atmosphere and ionosphere (Dordrecht: Springer), 317–328.
Carrasco, A. J., Pimenta, A. A., Wrasse, C. M., Batista, I. S., and Takahashi, H. (2020). Why do equatorial plasma bubbles bifurcate? J. Geophys. Res. Space. Phys. 125 (11), e2020JA028609.
Chian, A., Abalde, J. R., Miranda, R. A., Borotto, F. A., Hysell, D. L., Rempel, E. L., et al. (2018). Multi-spectral optical imaging of the spatiotemporal dynamics of ionospheric intermittent turbulence. Sci. Rep. 8 (1), 10568. doi:10.1038/s41598-018-28780-5
de Araujo, L. R., Lima, L. M., Batista, P. P., and Jacobi, C. (2020). Behaviour of monthly tides from meteor radar winds at 22.7 S during declining phases of 23 and 24 solar cycles. J. Atmos. Solar-Terrestrial Phys. 205, 105298. doi:10.1016/j.jastp.2020.105298
Essien, P., Figueiredo, C. A. O. B., Takahashi, H., Klutse, N. A. B., Wrasse, C. M., Afonso, J. M. D. S., et al. (2022). Intertropical convergence zone as the possible source mechanism for southward propagating medium-scale traveling ionospheric disturbances over South American low-latitude and equatorial region. Atmosphere 13 (11), 1836. doi:10.3390/atmos13111836
Futyan, J. M., and Del Genio, A. D. (2007). Deep convective system evolution over Africa and the tropical Atlantic. J. Clim. 20 (20), 5041–5060. doi:10.1175/jcli4297.1
Geri, W., Shebshaevich, B. V., and Zanzi, M. (2016). Satellite navigation systems. Aerosp. Navig. Syst., 26–108. doi:10.1002/9781119163060.ch2
Gonzalez, W. D., Joselyn, J. A., Kamide, Y., Kroehl, H. W., Rostoker, G., Tsurutani, B. T., et al. (1994). What is a geomagnetic storm? J. Geophys. Res. Space Phys. 99 (A4), 5771–5792. doi:10.1029/93ja02867
Huang, C. S., Le, G., de La Beaujardiere, O., Roddy, P. A., Hunton, D. E., Pfaff, R. F., et al. (2014). Relationship between plasma bubbles and density enhancements: observations and interpretation. J. Geophys. Res. Space Phys. 119 (2), 1325–1336. doi:10.1002/2013ja019579
Huang, H., Lu, X., Liu, L., Wang, W., and Li, Q. (2018). Transition of interhemispheric asymmetry of equatorial ionization anomaly during solstices. J. Geophys. Res. Space Phys. 123 (12), 10–283. doi:10.1029/2018ja026055
Jin, Y., Xiong, C., Clausen, L., Spicher, A., Kotova, D., Brask, S., et al. (2020). Ionospheric plasma irregularities based on in situ measurements from the Swarm satellites. J. Geophys. Res. Space Phys. 125 (7), e2020JA028103. doi:10.1029/2020ja028103
Khadka, S. M., Valladares, C. E., Sheehan, R., and Gerrard, A. J. (2018). Effects of electric field and neutral wind on the asymmetry of equatorial ionization anomaly. Radio Sci. 53 (5), 683–697. doi:10.1029/2017rs006428
Kil, H., Paxton, L. J., Jee, G., and Nikoukar, R. (2019). Plasma blobs associated with medium-scale traveling ionospheric disturbances. Geophys. Res. Lett. 46 (7), 3575–3581. doi:10.1029/2019gl082026
Klenzing, J. H., Rowland, D. E., Pfaff, R. F., Le, G., Freudenreich, H., Haaser, R. A., et al. (2011). Observations of low-latitude plasma density enhancements and their associated plasma drifts. J. Geophys. Res. Space Phys. 116 (A9). doi:10.1029/2011ja016711
Krall, J., Huba, J. D., Joyce, G., and Yokoyama, T. (2010). “Density enhancements associated with equatorial spread F,”, 28. Göttingen, Germany: Copernicus Publications, 327–337. doi:10.5194/angeo-28-327-2010Ann. Geophys.2
Kwak, Y. S., Kil, H., Lee, W. K., and Yang, T. Y. (2019). Variation of the hemispheric asymmetry of the equatorial ionization anomaly with solar cycle. J. Astronomy Space Sci. 36 (3), 159–168. doi:10.5140/jass.2019.36.3.159
Le, G., Huang, C. S., Pfaff, R. F., Su, S. Y., Yeh, H. C., Heelis, R. A., et al. (2003). Plasma density enhancements associated with equatorial spread F: ROCSAT-1 and DMSP observations. J. Geophys. Res. Space Phys. 108 (A8). doi:10.1029/2002ja009592
Loutfi, A., Pitout, F., Bounhir, A., Benkhaldoun, Z., Makela, J. J., Abamni, S., et al. (2022). Interhemispheric asymmetry of the equatorial ionization anomaly (EIA) on the African sector over 3 years (2014–2016): effects of thermospheric meridional winds. J. Geophys. Res. Space Phys. 127 (9), e2021JA029902. doi:10.1029/2021ja029902
Luo, W., Xiong, C., Zhu, Z., and Mei, X. (2018). Onset condition of plasma density enhancements: a case study for the effects of meridional wind during 17–18 August 2003. J. Geophys. Res. Space Phys. 123 (8), 6714–6726. doi:10.1029/2018ja025191
Maruyama, T. (1991). Observations of quasi-periodic scintillations and their possible relation to the dynamics of Es plasma blobs. Radio Sci. 26 (03), 691–700. doi:10.1029/91rs00357
Momeni, M., and Migoya-Orué, Y. (2025). Solar activity and ionospheric variation: a comprehensive study using hurst exponent and probability density functions analysis. Adv. Space Res. 75, 7668–7683. doi:10.1016/j.asr.2025.02.060
Nicholson, S. E. (2018). The ITCZ and the seasonal cycle over equatorial Africa. Bull. Am. Meteorological Soc. 99 (2), 337–348. doi:10.1175/bams-d-16-0287.1
Nyassor, P. K., Wrasse, C. M., Paulino, I., Yiğit, E., Tsali-Brown, V. Y., Buriti, R. A., et al. (2025). Momentum flux characteristics of vertically propagating gravity waves. Atmos. Chem. Phys. 25 (7), 4053–4082. doi:10.5194/acp-25-4053-2025
Okoh, D., Rabiu, B., Shiokawa, K., Otsuka, Y., Segun, B., Falayi, E., et al. (2017). First study on the occurrence frequency of equatorial plasma bubbles over West Africa using an all-sky airglow imager and GNSS receivers. J. Geophys. Res. Space Phys. 122 (12), 12–430. doi:10.1002/2017ja024602
Ossakow, S. L., Zalesak, S. T., McDonald, B. E., and Chaturvedi, P. K. (1979). Nonlinear equatorial spread F: Dependence on altitude of the F peak and bottomside background electron density gradient scale length. J. Geophys. Res. Space. Phys. 84 (A1), 17–29.
Park, J., Min, K. W., Lee, J. J., Kil, H., Kim, V. P., Kim, H. J., et al. (2003). Plasma blob events observed by KOMPSAT-1 and DMSP F15 in the low latitude nighttime upper ionosphere. Geophys. Res. Lett. 30 (21). doi:10.1029/2003gl018249
Park, J., Min, K., Kim, V. P., Kil, H., Kim, H. J., Lee, J. J., et al. (2008a). Statistical description of low-latitude plasma blobs as observed by DMSP F15 and KOMPSAT-1. Adv. Space Res. 41 (4), 650–654. doi:10.1016/j.asr.2007.04.089
Park, J., Stolle, C., Lühr, H., Rother, M., Su, S. Y., Min, K. W., et al. (2008b). Magnetic signatures and conjugate features of low-latitude plasma blobs as observed by the CHAMP satellite. J. Geophys. Res. Space Phys. 113 (A9). doi:10.1029/2008ja013211
Park, J., Lühr, H., Stolle, C., Rother, M., Min, K., and Michaelis, I. (2010). Field-aligned current associated with low-latitude plasma blobs as observed by the CHAMP satellite. Ann. Geophys. 28 (3), 697–703. doi:10.5194/angeo-28-697-2010
Park, J., Lühr, H., Michaelis, I., Stolle, C., Rauberg, J., Buchert, S., et al. (2015). Westward tilt of low-latitude plasma blobs as observed by the Swarm constellation. J. Geophys. Res. Space Phys. 120 (4), 3187–3197. doi:10.1002/2014ja020965
Park, J., Huang, C. S., Eastes, R. W., and Coster, A. J. (2022). Temporal evolution of low-latitude plasma blobs identified from multiple measurements: ICON, GOLD, and Madrigal TEC. J. Geophys. Res. Space Phys. 127 (3), e2021JA029992. doi:10.1029/2021ja029992
Park, J., Min, K. W., Eastes, R. W., Chao, C. K., Kim, H. E., Lee, J., et al. (2023). Low-latitude plasma blobs above Africa: exploiting GOLD and multi-satellite in situ measurements. Adv. Space Res. 72 (3), 726–740. doi:10.1016/j.asr.2022.05.021
Pimenta, A. A., Sahai, Y., Bittencourt, J. A., Abdu, M. A., Takahashi, H., and Taylor, M. J. (2004). Plasma blobs observed by ground-based optical and radio techniques in the Brazilian tropical sector. Geophys. Res. Lett. 31 (12). doi:10.1029/2004gl020233
Pimenta, A. A., Sahai, Y., Bittencourt, J. A., and Rich, F. J. (2007). Ionospheric plasma blobs observed by OI 630 nm all-sky imaging in the Brazilian tropical sector during the major geomagnetic storm of April 6–7, 2000. Geophys. Res. Lett. 34 (2). doi:10.1029/2006gl028529
Rishbeth, H., and Garriott, O. K. (1969). Introduction to ionospheric physics. New York: Academic Press.
Seba, E. B., Nigussie, M., Giday, N. M., and Moldwin, M. B. (2021). The relationship between upward propagating atmospheric gravity waves and ionospheric irregularities during solar minimum periods. Space weather. 19 (11), e2021SW002715. doi:10.1029/2021sw002715
Song, H., Park, J., Buchert, S., Jin, Y., Chao, C. K., Lee, J., et al. (2022). A small peak in the Swarm-LP plasma density data at the dayside dip equator. J. Geophys. Res. Space Phys. 127 (7), e2022JA030319. doi:10.1029/2022ja030319
Spicher, A., Clausen, L. B. N., Miloch, W. J., Lofstad, V., Jin, Y., and Moen, J. I. (2017). Interhemispheric study of polar cap patch occurrence based on Swarm in situ data. J. Geophys. Res. Space Phys. 122 (3), 3837–3851. doi:10.1002/2016ja023750
Su, S. Y., Shih, Y. J., Chao, C. K., Tsai, L. C., and Liu, C. H. (2022). A statistical study on the occurrence characteristics of low-to-midlatitude ionospheric density enhancements (plasma blobs). Adv. Space Res. 69 (8), 2957–2968. doi:10.1016/j.asr.2022.02.017
Sun, Y. Y., Matsuo, T., Maruyama, N., and Liu, J. Y. (2015). Field-aligned neutral wind bias correction scheme for global ionospheric modeling at midlatitudes by assimilating FORMOSAT-3/COSMIC hmF2 data under geomagnetically quiet conditions. J. Geophys. Res. Space Phys. 120 (4), 3130–3149. doi:10.1002/2014ja020768
Suzuki, T. (2011). Seasonal variation of the ITCZ and its characteristics over central Africa. Theor. Appl. Climatol. 103 (1), 39–60. doi:10.1007/s00704-010-0276-9
Tardelli-Coelho, F., Pimenta, A. A., Tardelli, A., Abalde, J. R., and Venkatesh, K. (2017). Plasma blobs associated with plasma bubbles observed in the Brazilian sector. Adv. Space Res. 60 (8), 1716–1724. doi:10.1016/j.asr.2017.06.018
Thokuluwa, R. (2025). Generation of enigmatic equatorial ionospheric plasma blobs during the 17 March 2015 super geomagnetic storm period over the Indian region. Sci. Rep. 15 (1), 15874–14. doi:10.1038/s41598-025-00627-w
Tuenter, E., Weber, S. L., Hilgen, F. J., and Lourens, L. J. (2003). The response of the African summer monsoon to remote and local forcing due to precession and obliquity. Glob. Planet. Change 36 (4), 219–235. doi:10.1016/s0921-8181(02)00196-0
Wang, Z., Shi, J. K., Torkar, K., Wang, G. J., and Wang, X. (2015). A case study on ionospheric scintillations at low latitude associated with a plasma blob observed in situ. Geophys. Res. Lett. 42 (7), 2109–2114. doi:10.1002/2015gl063493
Wang, Z., Liu, H., Shi, J., Wang, G., and Wang, X. (2019). Plasma blobs concurrently observed with bubbles in the Asian-Oceanian sector during solar maximum. J. Geophys. Res. Space Phys. 124 (8), 7062–7071. doi:10.1029/2018ja026373
Watanabe, S., and Oya, H. (1986). Occurrence characteristics of low latitude ionosphere irregularities observed by impedance probe on board the hinotori satellite. J. Geomagnetism Geoelectr. 38 (2), 125–149. doi:10.5636/jgg.38.125
Wu, X., Yuan, T., Qie, K., and Luo, J. (2020). Geographical distribution of extreme deep and intense convective storms on Earth. Atmos. Res. 235, 104789. doi:10.1016/j.atmosres.2019.104789
Xiong, C., Lühr, H., and Ma, S. Y. (2013). The magnitude and inter-hemispheric asymmetry of equatorial ionization anomaly-based on CHAMP and GRACE observations. J. Atmos. Solar-Terrestrial Phys. 105, 160–169. doi:10.1016/j.jastp.2013.09.010
Yokoyama, T., Su, S. Y., and Fukao, S. (2007). Plasma blobs and irregularities concurrently observed by ROCSAT-1 and Equatorial Atmosphere Radar. J. Geophys. Res. Space Phys. 112 (A5). doi:10.1029/2006ja012044
Zalesak, S. T., Ossakow, S. L., and Chaturvedi, P. K. (1982). Nonlinear equatorial spread F: The effect of neutral winds and background Pedersen conductivity. J. Geophys. Res. Space. Phys. 87 (A1), 151–166.
Keywords: plasma blobs, plasma irregularities, ionosphere, Swarm satellite, African sector
Citation: Adebayo OM, Rabiu B, Pimenta AA, Chian AC-L, Dare-Idowu O, Okoh DI and Akerele A (2025) First results of ionospheric plasma blob observations in the African topside ionosphere during a deep solar minimum using Swarm satellites. Front. Astron. Space Sci. 12:1648901. doi: 10.3389/fspas.2025.1648901
Received: 17 June 2025; Accepted: 08 September 2025;
Published: 24 September 2025.
Edited by:
Georgios Balasis, National Observatory of Athens, GreeceReviewed by:
Octav Marghitu, Space Science Institute, RomaniaSampad Kumar Panda, KL University, India
Copyright © 2025 Adebayo, Rabiu, Pimenta, Chian, Dare-Idowu, Okoh and Akerele. This is an open-access article distributed under the terms of the Creative Commons Attribution License (CC BY). The use, distribution or reproduction in other forums is permitted, provided the original author(s) and the copyright owner(s) are credited and that the original publication in this journal is cited, in accordance with accepted academic practice. No use, distribution or reproduction is permitted which does not comply with these terms.
*Correspondence: Oluwasegun M. Adebayo, b2x1d2FzZWd1bi5hZGViYXlvQGlucGUuYnI=