 Wencong Chen
 Denggao Qiu2*
 Jianguo Yan
 Sihai Yi
- 1School of Safety Engineering, North China Institute of Science and Technology, Beijing, China
- 2State Key Laboratory of Information Engineering in Surveying, Mapping and Remote Sensing, Wuhan University, Wuhan, China
- 3Xinjiang Astronomical Observatory, Chinese Academy of Sciences, Urumqi, China
The distribution of FeO and TiO2 reveals mantle source characteristics and basaltic diversity, whereas SiO2 distribution is closely related to magma evolution and crustal differentiation. However, global studies on SiO2 remain limited. To address this gap, we combined the latest lunar sample data, Kaguya Multiband Imager spectra, and Christiansen Feature to develop a One-Dimensional Convolutional Neural Network (1D-CNN) for mapping lunar SiO2. The results reveal a clear spatial asymmetry in SiO2: high-latitude regions on the nearside show higher SiO2, while low-latitude regions exhibit lower values. Mare Tranquillitatis and Oceanus Procellarum have low SiO2 but distinct TiO2 variations, indicating different basaltic types and magmatic sources. The highlands are dominated by ferroan anorthosite, whereas the maria mainly consist of mafic to ultramafic rocks. Incorporating Chang’E-6 samples and Christiansen Feature data improved model accuracy. Future work on silicic volcanic rocks will further refine the global SiO2 map and deepen understanding of lunar crustal evolution.
1 Introduction
Oxide abundance is a crucial indicator for the identification of lunar rocks. Research on FeO, TiO2 and MgO content has been fruitful (Lucey et al., 2000; Otake et al., 2012; Xia et al., 2019), although there is still a scarcity of studies on the global distribution of SiO2 content. In this study, we mainly measure SiO2 within silicate minerals. In these silicates, the infrared signal of SiO2 originates from SiO4 tetrahedra embedded in the crystal lattice and should not be treated as a free oxide. In volcanic rocks, the SiO2 content in amorphous phases differs significantly from that in crystalline silicate minerals. In some volcanic samples, the total SiO2 content can exceed 50%, of which more than 90% exists in crystalline forms such as quartz, feldspar, or pyroxene, while only a small fraction (typically 1%–5%) is present as amorphous SiO2 (Ellerbrock et al., 2024). In addition to the intrinsic complexity of SiO2 spectral characteristics, space weathering and surface amorphization further complicate spectral interpretation. Micrometeorite bombardment and solar wind irradiation produce amorphous rims and glassy coatings on mineral grains, modifying their optical properties. These processes tend to weaken absorption features and increase spectral slopes, and in some cases alter or shift mid-infrared diagnostic features (Chrbolková et al., 2022; Utt et al., 2021). Moreover, the maturity of the lunar regolith (optical maturity) can further affect spectral interpretation and oxide inversion. Variations in regolith maturity can modify reflectance spectra, weaken absorption features, and alter spectral slopes, potentially impacting the estimation of SiO2 content (Blewett et al., 2005). Previous studies have applied optical maturity analyses to young craters, polar terrains, and magnetic anomalies to assess regolith properties and refine compositional mapping (Lemelin et al., 2022; Tomka et al., 2024). Therefore, the appropriate selection of spectral data and SiO2 inversion algorithms is crucial for reliable mapping and interpretation. SiO2 content provides new insights into the evolution of lunar igneous rocks and serves as a reliable basis for understanding the lithological distribution characteristics of the Moon.
Remote sensing data and lunar samples provide a reliable basis to estimate the global lunar oxide abundance. The Clementine Ultraviolet/Visible images were first used to produce the FeO and TiO2 content maps with a spatial resolution of 100 and 200 m/pixel (Blewett et al., 1997; Lucey et al., 2000; Lucey et al., 1995; 1998). In these studies, a linear model was constructed using the potential relationship between band ratios of the spectrum and oxide content. This method was further extended to the Kaguya Multiband Imager (MI) data, Chang’E-1 Interference Imaging Spectrometer data, the Lunar Reconnaissance Orbiter Wide Angle Camera (WAC) data, and Chandrayaan-1 Moon Mineralogy Mapper (Otake et al., 2012; Sato et al., 2017; Surkov et al., 2020; Wu, 2012). However, due to the more complex spectral characteristics and distribution features of SiO2, it is difficult to study using traditional linear models. Currently, the SiO2 content distribution primarily comes from the Lunar Prospector (LP) Gamma-Ray Spectrometer (GRS) (Prettyman et al., 2006). It measures the lunar surface composition by detecting the characteristic gamma-ray energies emitted by different elements in the lunar surface. However, its spatial resolution is relatively low, only 2°/pixel, and the calibration data of returned samples are still being refined, necessitating further updates on the characteristics of SiO2 content distribution on the Moon. Recently, significant progress has been made in using machine learning for lunar oxide inversion. Machine learning techniques enable the inversion of multiple oxides, exploiting the non-linear correlation between spectra and oxide content (Korokhin et al., 2008; Qiu et al., 2022; Xia et al., 2019).
The oxide content maps provide an important basis for the in-depth study of the distribution of various lunar rock suites. The major primitive rock suites include KREEP basalt (KB), mare basalt (MB), ferroan anorthosite suite (FAS), magnesian suite (MS), and alkali suite (Lucey et al., 2006; Wieczorek, 2006). By comparing the oxide content maps with lunar sample return data or lunar meteorite samples, it is possible to map the distribution of these rock suites and infer their potential locations on the lunar surface (Dhingra et al., 2011; Du et al., 2010; Pasckert et al., 2015; Pieters, 2002; Shearer et al., 2015; Whitten and Head, 2015). The distribution of SiO2 content, specifically within silicate minerals, is particularly crucial for the classification and research of volcanic rocks. Based on SiO2 content, volcanic rocks can be classified as ultramafic (SiO2 <45%), mafic (45%–52%), intermediate (52%–63%), and felsic (SiO2 >63%). The SiO2 content map not only provides a scientific basis for lithology identification but also lays the foundation for exploring the diversity and evolutionary processes of lunar volcanic products. However, current studies on the distribution of different rock suites still have controversies, and the potential connections between these rock suites remain unclear. To address these issues, more accurate SiO2 distribution data with higher spatial resolution are needed to advance the in-depth study of lunar volcanic products and their geological evolution.
In this study, we utilized Kaguya MI data and lunar sample datasets, including Apollo, Luna, Chang’E-3, Chang’E-5, and the most recent Chang’E-6 sample data. In addition, we incorporated a novel spectral feature, the Christiansen Feature, which is highly sensitive to SiO2 content. These datasets were processed using a One-Dimensional Convolutional Neural Network (1D-CNN) model to generate a high-resolution map of SiO2 content across the Moon. This new SiO2 content map, with a spatial resolution of 59 m per pixel, effectively eliminates terrain shadowing effects. Based on this map, we conducted a comprehensive analysis of the global distribution characteristics of SiO2 and the lithological diversity of the lunar surface from a fresh perspective. We also discussed the limitations of the inversion model and proposed methods for its future refinement. This study demonstrates the successful application of deep learning techniques to oxide inversion, providing valuable new data for lunar research. It represents an important step toward a deeper understanding of elemental distribution on the lunar surface and the Moon’s evolutionary history. Accurate mapping of SiO2 abundance also holds significant practical value for future lunar exploration and in situ resource utilization (ISRU) (Lucas et al., 2024).
2 Data and methods
The MI has 9 spectral bands, at 415, 750, 900, 950, 1001 nm in ultraviolet-visible spectroscopy and 1000, 1050, 1250, 1550 nm in near-infrared. The MI reflectance has been corrected for the shading effects of topography, with a spatial resolution of 59 m/pixel, covering the latitude range of 65°N to 65°S of the Moon (Ohtake et al., 2013). Since the similarity of reflectance at 1000 nm and 1001 nm, eight bands (415, 750, 900, 950, 1001, 1050, 1250, and 1550 nm) are employed to calculate SiO2 content in this work.
The Christiansen Feature (CF) is a spectral characteristic observed in the thermal-infrared region of the lunar surface, which is highly sensitive to the average silica polymerization of lunar soils (Lucey et al., 2021). The CF occurs where the real part of the complex refractive index passes unity and serves as an indicator of silica polymerization (Kumari et al., 2025). The CF appears as a distinctive absorption feature in the thermal-infrared spectrum, which is influenced by the Si-O bond vibrations in the minerals, its absorption features are shown in Figure 1. The strength and position of this feature are closely related to the silica content and the degree of polymerization of silica structures in the lunar soil. Its wavelength position is inversely correlated to the bulk silica content of the mineral, occurring at shorter wavelengths for silicic minerals and at longer wavelengths for mafic minerals (Christensen et al., 2000). The Christiansen Feature (CF) (7.5–8.5 µm) data acquired from lunar remote sensing instruments such as the Diviner radiometer can indicate the degree of silicate polymerization on the lunar surface. When used in conjunction with MI reflectance spectra as inputs to a one-dimensional convolutional neural network (1D-CNN), this combined approach may help identify spatial variations in SiO2 abundance that are difficult to detect using traditional empirical or linear models.
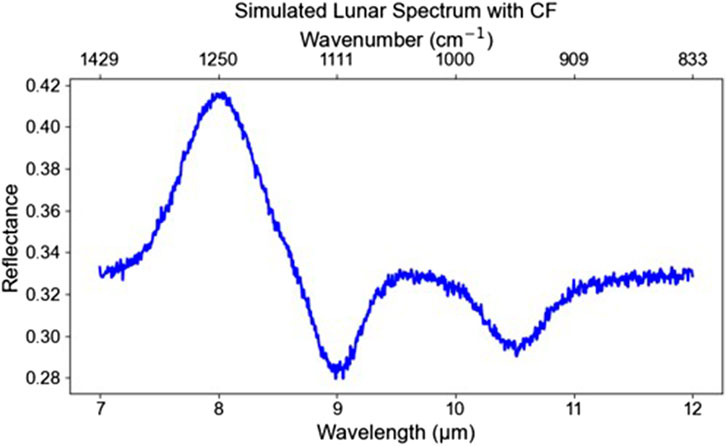
Figure 1. Simulated lunar reflectance spectrum highlighting the christiansen feature (CF).
The ground truth of SiO2 abundance was obtained from 40 lunar sampling sites, including Apollo, Luna, Chang’E-3, Chang’E-5, and the most recent Chang’E-6 landing sites (Supplementary Table S1 in the Supporting Information). The inclusion of Chang’E-6 data will significantly enhance the spatial coverage and accuracy of SiO2 abundance measurements. To reduce noise, the reflectance data and the CF data from each sampling station were averaged using a 2 × 2 pixel window (Lucey et al., 2000).
The 1D-CNN model was constructed to estimate the global distribution of SiO2 abundance in this work. Traditional inversion models rely on physicochemical properties, where crystal field transitions cause absorption features in the ultraviolet, visible, and near-infrared ranges (Lucey et al., 2000; Lucey et al., 1995; 1998; Otake et al., 2012; Sato et al., 2017; Surkov et al., 2020; Wu, 2012). However, these traditional models are not applicable for the inversion of SiO2 content on the lunar surface. The laboratory reflectance data from Lunar Soil Characterization Consortium samples have demonstrated that chemical components significantly affect the albedo values (Pieters, 2002; Wu, 2012; Xia et al., 2019). Lunar mineralogy is relatively simple, consisting primarily of feldspar, pyroxene, olivine, and ilmenite, each with varying SiO2 contents. These minerals exhibit different spectral characteristics across the ultraviolet-visible and near-IR wavelength ranges, with distinct reflectance information corresponding to different SiO2 contents. In this study, we integrate CF data with MI reflectance spectra as inputs to a one-dimensional convolutional neural network (1D-CNN) to improve the accuracy of global SiO2 abundance estimation. The inclusion of CF data offers reliable information on the degree of silicate polymerization on the lunar surface, enabling the model to better distinguish silica-rich regions from other lithological units. It should be noted that the spectral signal of SiO2 depends strongly on its structural context. When SiO2 is incorporated within silicate mineral lattices, the SiO4 tetrahedra produce characteristic infrared absorption features that are readily detectable. In contrast, SiO2 present as an oxide in amorphous phases exhibits much weaker spectral features, and in many cases, its signal may be difficult to identify. This distinction highlights the importance of considering the crystallinity and mineralogical context of SiO2 when interpreting CF-based spectral data.
Therefore, we used a One-Dimensional Convolutional Neural Network (1D-CNN) to explore the relationship between SiO2 content, spectral reflectance, and Christiansen Feature (CF) data. As shown in Figure 2, the network consists of two convolutional layers, one pooling layer, and a final linear output layer. The input to the model includes 40 spectral reflectance bands and CF values, while the output is the corresponding measured SiO2 content. The first convolutional layer scans through the input spectrum and extracts basic local patterns between adjacent bands, such as absorption features. The second convolutional layer then captures more complex relationships by combining these local features. After the convolutional steps, a pooling layer reduces the dimensionality of the data by summarizing neighboring features. This step helps to simplify the representation and reduce the risk of overfitting. The extracted features are passed through a linear activation layer that outputs the predicted SiO2 content. The model’s performance is evaluated by comparing the predicted values with the measured SiO2 contents using the Root Mean Squared Error (RMSE) and the coefficient of determination (R2).
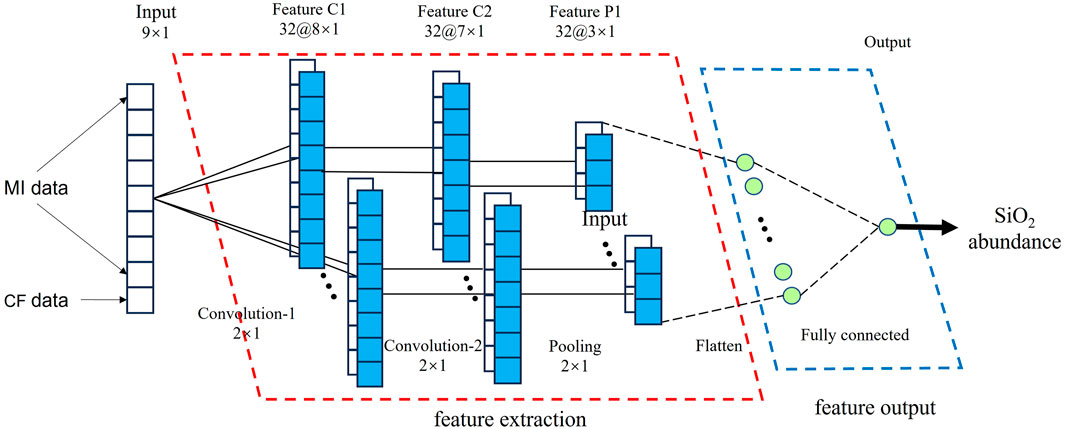
Figure 2. Architecture of the 1D Convolutional Neural Network. The model has four parts, including input data, output data, feature extraction, and feature output. The input data consists of 40 sets of spectral reflectance. The output data is the SiO2 content of the corresponding 40 lunar samples. The feature extraction has two convolutional layers and one pooling layer to extract and compress the feature values. The feature output has a fully connected layer to associate the feature values with SiO2 content.
3 Results
3.1 Map of SiO2 content and model accuracy evaluation
As shown in Figure 3, the eight bands of Kaguya MI data, along with the Christiansen Feature (CF) data, are imported into the 1D-CNN model, resulting in the distribution map of lunar SiO2 content. We sampled histogram statistics for the global distribution of SiO2 content, which were compared to 40 lunar sampling sites. The prediction accuracy of the 1D-CNN model for SiO2 content was evaluated.
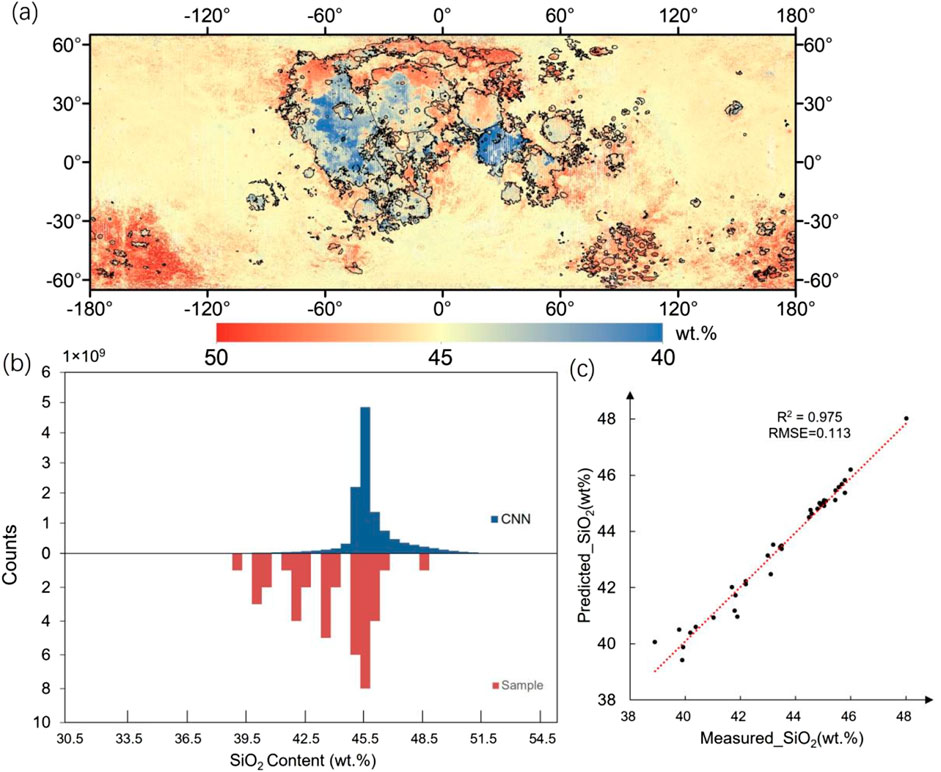
Figure 3. Inversion result for SiO2 content. (a) Distribution map of lunar SiO2 content. Notably, our model predicts a global SiO2 content ranging from 30 to ∼55 wt.%. However, regions with SiO2 content below 40 wt.% and above 50 wt.% are relatively sparse. To more clearly highlight the significant differences predicted by our model between the lunar maria and the highlands, we have restricted the content map to a range of 40–∼50 wt.%. This allows for a more intuitive analysis of the lunar SiO2 distribution. Regions with content below 40 wt.% are represented in deep blue, while those above 50 wt.% are shown in deep red. The black line indicates the lunar mare boundary (Nelson et al., 2014). The map is plotted in the Moon 2000 coordinate system, which is centered on the mean Earth-facing longitude of the Moon. (b) Histograms of global SiO2 content. Red bars represent the training data for SiO2. (c) Scatter plots of the measured and predicted values.
As shown in Figure 3a, the SiO2 content in the new map is ∼40–∼55 wt.%, with an average value of 45.45 wt.%. The region with the lowest measured SiO2 content is Mare Tranquillitatis, with a regional average of 37.95 wt.%, while the highest SiO2 content is found in Lacus Temporis South, with a regional average of 48.37 wt.%. The SiO2 content is noticeably lower than the global average in regions such as Mare Tranquillitatis, Lacus Lenitatis, Mare Fecunditatis, Billy, Mare Vaporum, and Lacus Odii. Conversely, the SiO2 content is generally higher than the global average in Mare Crisium, Leibnitz, Campbell, Mare Ingenii, Mare Undarum, Baldet, Lacus Somniorium, Mare Australe, Von Kármán, South Pole Aitken Basin, Minkowski, Lacus Mortis, Davisson, Maclaurin, and Lacus Temporis South. These high-SiO2-content areas are located in the high-latitude regions of the Moon. There is no significant variation in the SiO2 content of the lunar highlands, with an average value of ∼45.56 wt.%.
The prediction accuracies of the 1D-CNN model for SiO2 are shown in Figure 3c. The R2 for the prediction of SiO2 content is 0.975, and the RMSE for the prediction of SiO2 content is 0.113. This result confirmed the good performance of the 1D-CNN model.
3.2 Comparison with other data
In this work, the SiO2 map from the CNN model was compared with the SiO2 map from the Lunar Prospector (LP) Gamma-Ray Spectrometer (GRS) to validate the reliability of the CNN model. Elemental abundance values for SiO2 derived from the LP GRS observations acquired during the high- and low-altitude portions of the LP mission (Prettyman et al., 2006). The resolution of the SiO2 map of the LP GRS is 2°/pixel. To compare the SiO2 map from the CNN model and LP GRS data, we resampled the CNN SiO2 map to 2°/pixel, the same resolution as the LP GRS data, and a uniform range between 65°N and 65°S. The comparison results are shown in Figure 4.
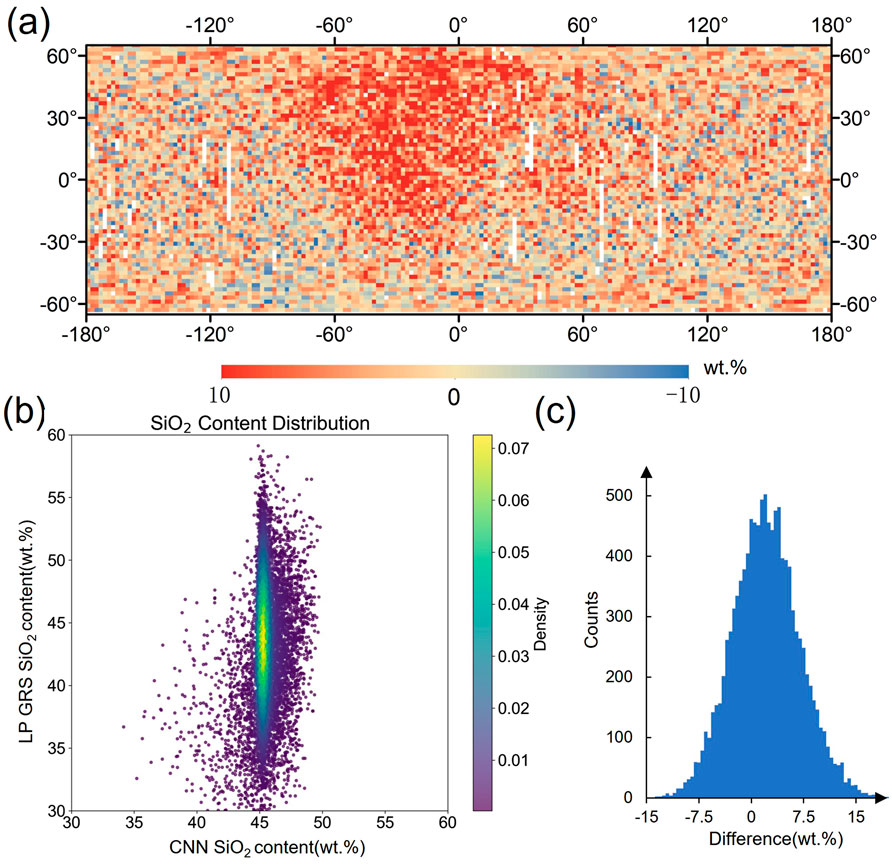
Figure 4. Comparison of the SiO2 content result from Convolutional Neural Network (CNN) and Lunar Prospector (LP) Gamma-Ray Spectrometer (GRS). (a) Difference maps between SiO2 content from CNN and LP GRS. Where red indicates higher values for the CNN result and blue indicates lower values for the CNN result. (b) 2D probability density function scatter plots of SiO2 content derived by the CNN versus the LP GRS. (c) Histograms of difference between SiO2 content from CNN and LP GRS.
As shown in Figure 4a, the SiO2 content predicted by the CNN model for the lunar highlands is in strong agreement with the LP GRS measurements, with most regions showing negligible differences near zero. This reflects a high degree of consistency and reliability. However, a noticeable and stable systematic error is observed in the lunar maria regions. The 2D probability density function scatter plot (Figure 4b) demonstrates a positive correlation between the SiO2 content predicted by the CNN model and that measured by LP GRS, with the abundance predominantly concentrated around 45%, which corresponds to the lunar highlands. Nevertheless, certain regions exhibit significant deviations. The histogram of SiO2 content discrepancies (Figure 4c) illustrates a distinct normal distribution of the differences between the CNN predictions and LP GRS measurements. The CNN model tends to slightly overestimate the SiO2 content, with an average difference of 2.4 wt.% and a standard deviation of 4.84 wt.%. These results indicate a systematic bias in the CNN model’s predictions, which, based on Figure 4a, primarily originates from the lunar maria regions. Conversely, the CNN model provides highly accurate predictions for the lunar highlands.
To further examine the systematic discrepancies in the lunar maria, we separated mare regions from the highlands and compared CNN-predicted SiO2 content with measurements from the Lunar Prospector Gamma Ray Spectrometer (LP GRS) (Prettyman et al., 2006). As shown in Figure 5a, the CNN predictions exhibit a strong correlation with LP GRS data, with a scatter plot trendline slope of 0.69 and an RMSE of 4.63 wt.%. This indicates a significant positive correlation, although some systematic deviation remains, likely due to differences in detection depth and data sources.
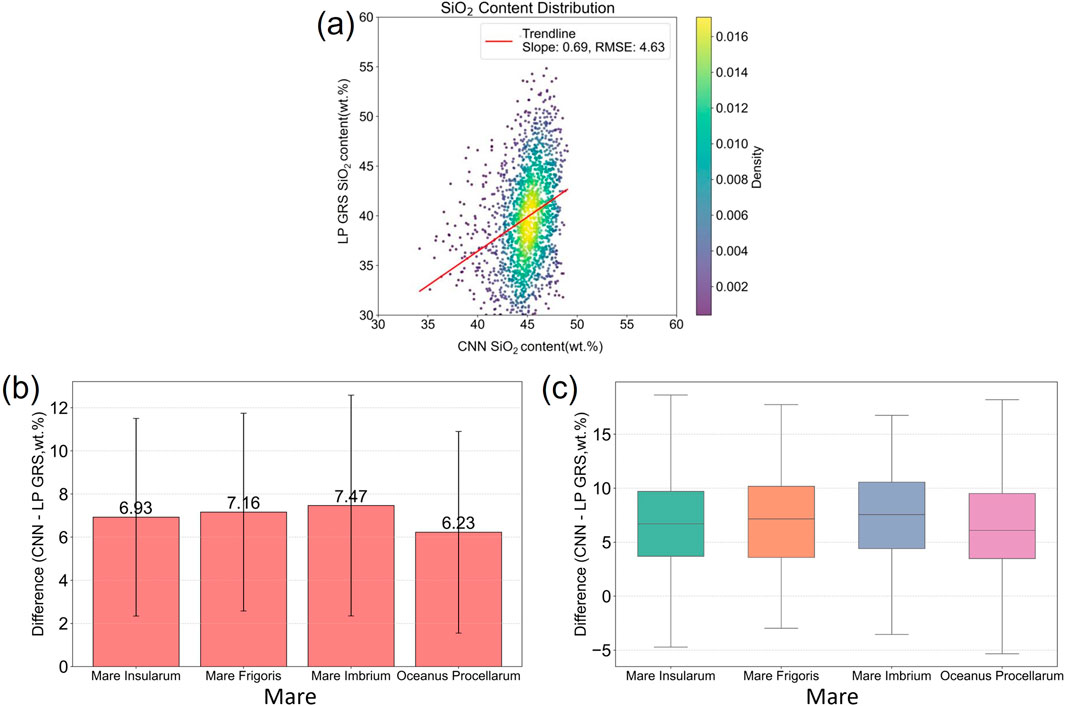
Figure 5. 2D Probability Density Function Scatter Plot of SiO2 Content Derived by CNN versus LP GRS for the Lunar Maria (a). Mean difference between CNN and LP GRS SiO2 contents for different mare regions (b). Distribution of CNN–LP GRS SiO2 content differences across mare regions (c).
To investigate this bias further, we focused on four well-covered maria: Mare Insularum, Mare Frigoris, Mare Imbrium, and Oceanus Procellarum. Figure 5b shows the average differences between CNN-predicted and LP GRS SiO2 contents, ranging from 6.23 wt.% to 7.47 wt.%, demonstrating stable performance across these regions. Error bars are small, indicating minor variations between areas. Figure 5c presents boxplots of the same data, with median differences of 5–7 wt.% and similar interquartile ranges, confirming consistent and stable error distributions without significant outliers.
The stability of errors across these maria suggests that the systematic deviation likely arises from differences in sampling depth: LP GRS measures SiO2 as a volumetric average over the upper ∼20–30 cm of the lunar regolith (Lawrence et al., 2002), while the CNN model reflects surface composition based on spectral data. In some maria, low SiO2 mare material may be mixed with highland ejecta, artificially increasing apparent SiO2 and causing discrepancies. Both methods consistently show higher SiO2 content in highlands (45–50 wt.%) than in maria (35–45 wt.%). This range is comparable to terrestrial anorthositic rocks (41–55 wt.%), suggesting that the lunar highlands represent early, plagioclase-rich crustal materials similar to Earth’s anorthosite complexes (Wiszniewska et al., 2002). The slight overestimation by the CNN model is therefore reasonable and supports its feasibility for estimating SiO2 content (Lawrence et al., 2002; Prettyman et al., 2006).
4 Discussions
4.1 Advantages of the convolutional neural network
The CNN algorithm is a machine learning method focusing on local connections, which was initially used to solve the document recognition problem (Lecun et al., 1998). The neurons can extract elementary visual features in local receptive fields. These features are further analyzed to detect higher order features. The 1D-CNN model is a modified version of 2D-CNN. As Lucey et al. (2000), Lucey et al. (1995), Lucey et al. (1998) discovered the correlation between band ratios and lunar oxide content by statistical methods, the 1D-CNN model can extract the correlation between bands as features and construct the correlation between features and oxide content. The 1D-CNN model is universal, and even if the user does not have extensive theoretical knowledge of spectroscopy and observation ability, the correlation between the spectrum and the oxide content can be found by the performance of the computational method. In addition, the 1D-CNN is much easier to train and implement because of its networks with shallow architectures. Since any standard computer can implement the training of this model with high efficiency, 1D-CNN is well-suited for real-time and low-cost applications (Kiranyaz et al., 2021).
4.2 SiO2 content of maria
The new SiO2 content map (Figure 3a) shows that the lunar SiO2 content varies significantly within the maria region, and less within the highlands. Maria was divided into 97 mare units of various sizes, according to the work by Nelson et al. (2014). Because of the nearside-farside lunar asymmetry (Jones et al., 2022; Zhong et al., 2000), the SiO2 content of the lunar nearside and farside are investigated separately, with the results shown in Figure 6. The central coordinates and SiO2 content of mare units are given in Supplementary Table S2 of the supporting information.
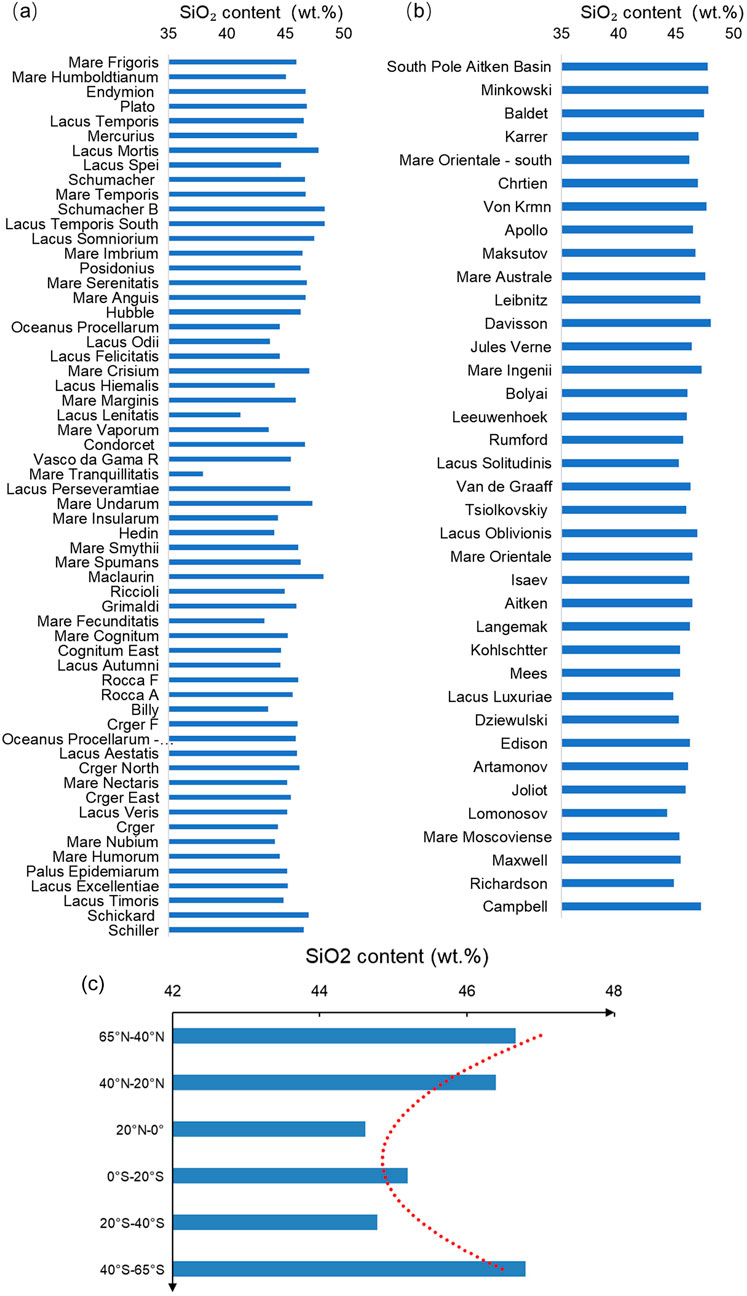
Figure 6. SiO2 content of the mare on the lunar nearside (a), on the lunar farside (b). The SiO2 abundance values correspond to the concentrations measured within the mare terrains. The regions in the map are arranged from north to south, corresponding to the top-to-bottom orientation in the figure. The red dashed line is the trend line. The trend diagram of silica with latitude (c).
As shown in Figure 6a, in the low-latitude regions of the near side of the Moon, Mare Tranquillitatis (29.99°E, 8.25°S) and Lacus Lenitatis (12.15°E, 14.26°S), the average silica (SiO2) content is 37.96 wt.% and 41.18 wt.%, respectively. However, as the latitude increases, the SiO2 content shows a notable increase. In the high northern latitudes, Lacus Temporis South (51.49°E, 40.89°S) and Schumacher_B_region (51.32°E, 42.20°S) show SiO2 contents of 48.37 wt.% and 48.38 wt.%, respectively. Similarly, in the high southern latitudes, South Pole-Aitken Basin (162.73°E, 57.12°S) and Von Krmn (175.93°E, 45.26°S) exhibit SiO2 contents of 47.77 wt.% and 47.70 wt.%, respectively. Additionally, Maclaurin, located at 1.99°N latitude and 68.02°E longitude, has an unusually high SiO2 content of 49.32 wt.%, despite its small area of 512.45 km2. This exceptionally high SiO2 content in Maclaurin may represent an anomaly. Excluding these small, anomalous regions, the lowest SiO2 content in the near side of the Moon is found near the equator in low-latitude regions, whereas the highest SiO2 content is typically observed in high-latitude regions. We divided the SiO2 content map into six latitudinal zones: 65°N to 40°N, 40°N to 20°N, 20°N to the equator, equator to 20°S, 20°S to 40°S, and 40°S to 65°S. The average SiO2 content of the lunar mare in each of these zones was calculated, as shown in Figure 6c. The results reveal a clear correlation between the chemical composition of the lunar basalt and latitude. Specifically, in the near side of the Moon, SiO2 content is lower in the low-latitude regions and increases towards higher latitudes. This variation may be attributed to the Moon’s rotation and large-scale impact events, which have likely induced spatial asymmetry in the Moon’s mantle (Jones et al., 2022). In contrast, the SiO2 content in the mare basalts on the far side of the Moon is generally higher than that on the near side. This finding aligns with the observed asymmetry between the near and far sides of the Moon (Jones et al., 2022; Zhong et al., 2000). The far side of the Moon has relatively fewer mare regions, and SiO2 content in these areas is typically greater than 45%. Notably, due to the sparse distribution and generally smaller area of the lunar seas on the far side, the corresponding pixels are more susceptible to measurement noise or the influence of surrounding highland material, which can lead to locally elevated SiO2 values. Consequently, no clear trend of SiO2 content variation with latitude was observed on the far side (Figure 6b), unlike the near side.
As shown in Figure 7, we identified and mapped the low SiO2 characteristics of Mare Tranquillitatis (6a) and Oceanus Procellarum (6b), which exhibit distinct geochemical signatures not widely noted in previous studies. Specifically, the SiO2 content in Mare Tranquillitatis ranges from 30 wt.% to 40 wt.%, while Oceanus Procellarum has a minimum SiO2 concentration of about 37 wt.%. The low SiO2 content suggests that the rocks in these regions are primarily FeO - rich, low - SiO2 basalts, consistent with lunar basalt characteristics, and likely originated from partial melting of the lunar mantle (Hiesinger et al., 2003). Mare Tranquillitatis is dominated by high-titanium basalt, which corresponds to its spectral features and high Ti content (Giguere et al., 2000), while Oceanus Procellarum is characterized by low-titanium basalt, reflecting different magmatic sources and evolutionary pathways. These basalts likely came from deep lunar mantle sources and underwent minimal fractional crystallization, indicating simple magma formation with limited mixing from the lunar crust.
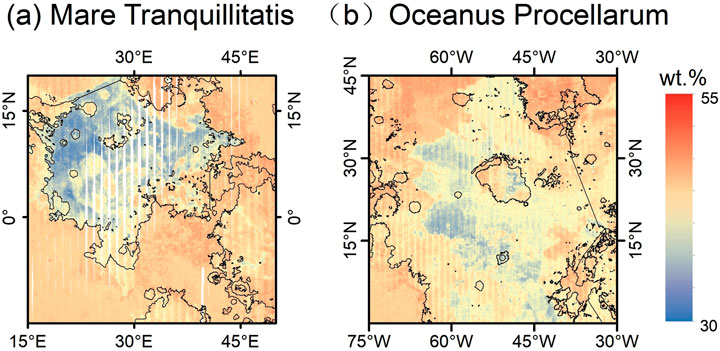
Figure 7. SiO2 distribution map of mare tranquillitatis (a) and oceanus procellarum (b) with mare boundaries indicated by black lines.
The low SiO2 characteristics of these regions are linked to spatial heterogeneity in the lunar mantle composition and regional thermal differences. The high-titanium basalt in Mare Tranquillitatis may suggest a source region enriched in titanium, possibly due to early lunar magma ocean differentiation or localized impact events. Conversely, the low-titanium basalt of Oceanus Procellarum reflects a more uniform source composition, likely tied to deeper melting or varying degrees of partial melting. These regions represent two extremes of lunar mantle-derived magmatic activity: one with high titanium, high iron, and low silicon, and the other with low titanium, high iron, and low silicon. These differences offer insights into lunar mantle evolution, including magma ocean crystallization, thermal reworking from impacts, and potential mantle plume activity. Additionally, the low SiO2 content may be related to early volatile element redistribution during lunar crust and mantle differentiation. The relatively low interaction between magma and crust in these areas could be due to thicker crust, lower tectonic activity, or rapid magma ascent. This isolated magmatic system preserves features of the deep lunar mantle, providing valuable data for further studies.
4.3 Lithology
Lithology provides insight into the evolution of the Moon, and SiO2 content is an indicator to distinguish between rock types. It should be noted that this SiO2 primarily refers to that incorporated within silicate minerals. The spectral signal from amorphous SiO2 (oxide form) is generally weak and does not directly reflect silicate mineral composition. The lunar highlands is dominated by FAS and MS, which represent early crustal materials (Day et al., 2020; Wang and Zhao, 2017). The SiO2 content of the lunar highlands is generally about 45 wt.%, which is consistent with the SiO2 content of the lunar FAS samples in Supplementary Table S2 in Supporting Information. In contrast to FAS, the MS samples have a higher SiO2 content, with the highest of 52.0 wt.%. The distribution map of SiO2 content indicates that there is no evidence for widespread Mg-suite (MS) outcrops in the lunar highlands. This finding is consistent with the interpretation of Shearer et al. (2015), but contrasts with the conclusion of Wang and Zhao (2017), who suggested that MS is widely distributed across the highlands. The Mg-suite formed later than the ferroan anorthosite (FAN) with some temporal overlap (Spudis, 1996). Since FAN represents the primordial lunar crust, MS must have formed as intrusive bodies derived from deeper crustal layers, implying that it cannot be extensively exposed on the lunar surface. The apparent widespread distribution of MS inferred by Wang and Zhao (2017) was likely due to the limitations of their lithology identification model. Their C5.0 decision-tree classifier, based on geochemical ratios such as Th/MgO, TiO2/MgO, FeO/CaO, and Th/CaO, may have suffered from overlapping ratio values and mixed pixels between FAN and MS regions, especially given the resolution differences between the CE-1 IIM and LP-GRNS datasets. As a result, some Th-rich FAN terrains were probably misclassified as MS. This misclassification suggests a strong compositional correlation between FAN and MS, consistent with the genetic linkage among KREEP, FAN, and MS proposed in previous studies (Papike et al., 1996; Shearer et al., 2015; Snyder et al., 1995). The crustal melting model could be considered a likely mechanism in the formation of lunar silicic rocks (Hagerty et al., 2006). This model explains well the genesis of rocks with high SiO2 content. And the rocks of FAN and MS cannot be generated from the same magma (Raedeke and McCallum, 1980). We can reasonably infer that MS have evolved to a higher degree than FAN, and the formation of MS has originated from the melting process between KREEP and the lower lunar crust.
The nonmare areas within the South Pole-Aitken Terrane have significantly higher SiO2 content than the surrounding highlands material. A possible explanation is that these nonmare regions may contain more silicic or evolved lithologies compared to the adjacent highlands, leading to higher SiO2 content. Additionally, localized magmatic differentiation or impact-related processes could have contributed to this enrichment. As shown in Supplementary Table S2, the SiO2 content of AS samples ranged from 43.4 to 74.2 wt.%. The high-Si feature in these nonmare areas is the same as the suggestion by Wang and Zhao (2017), which indicated that the South Pole-Aitken Terrane is dominated by AS.
KB and MB are widely distributed in the maria region, and they are the key records of lunar volcanism and magmatic history. The classical method distinguishes between KB and MB types by the FeO and TiO2 content (Hess and Parmentier, 1995; Xue et al., 2019). Acidity is one of the indicators used to classify igneous rock types. High SiO2 content suggests that the igneous rock is more acidic and more evolved (Rutanen and Andersson, 2008; Simon et al., 2020). As shown in Supplementary Table S2, KB samples have an SiO2 content of 47.3–52.8 wt.%, and MB samples have an SiO2 content of 33.6–50.5 wt.%. The SiO2 content estimated of the maria on the new map is consistent with the measurements from the lunar basalt sample. This result indicates that KB and MB on the Moon are classified as basic or ultrabasic igneous rocks. On the lunar nearside, basalt at higher latitudes is more evolved than those at lower latitudes. It is notable that basalt on the lunar farside has a high SiO2 content. We infer that this phenomenon is caused by the thicker crust on the lunar farside, where the longer distance gives the magma more opportunities to meet the crust as it travels from the mantle to the surface, evolving further in the process. The new SiO2 map provides a new way of understanding the global distribution of lithology, and this new map constrains the distribution of lithological features across the Moon.
4.4 Contribution of Chang’E-6 samples
The Chang’E-6 mission is a significant milestone in lunar exploration, as it marks the first sample collection from the Moon’s far side, particularly from the South Pole-Aitken Basin, the largest and oldest impact basin on the Moon’s surface. These samples provide crucial new data for studying the geochemistry and mineral diversity of the Moon, especially in regions unexplored by the Apollo and Luna missions. The mineral composition of the Chang'E-6 samples differs significantly from the material on the Moon’s near side, with notably higher feldspar content (32.6%) and higher amounts of amorphous glass (29.4%), while the olivine content is relatively low (0.5%) (Li et al., 2024). Inputting these new Chang’E-6 samples into convolutional neural network (CNN) models for training datasets could further enhance the CNN’s ability to predict various rock characteristics, improving the CNN model’s prediction of SiO2 content distribution, especially in regions with similar geological features to the South Pole-Aitken Basin.
To emphasize the impact of including the Chang’E-6 samples on the CNN predictions, we removed the Chang’E-6 samples from the 40 input samples, leaving 39 samples to build the model, following the same construction method as the model with Chang’E-6 samples, and predicted the lunar SiO2 content. The difference between the SiO2 content maps predicted by the CNN with and without the Chang'E-6 samples was calculated to obtain a difference map (Figure 8a). The results show that the inclusion of Chang’E-6 samples caused a more pronounced change in the mare regions, particularly in Mare Tranquillitatis and Oceanus Procellarum, with a change of about 5% in the predicted SiO2 content. Regarding the lunar farside maria, the inclusion of Chang’E-6 samples reveals that the South Pole-Aitken Basin, as well as other maria and highland regions, exhibit relatively noticeable variations in SiO2 content, with an average change of approximately 2–3 wt.% and SiO2 values generally around 46 wt.%. In contrast, the highland regions show much smaller variations, typically less than 1 wt.%. This comparison highlights the relative heterogeneity of SiO2 distribution in maria and SPA regions compared to the more homogeneous highlands.
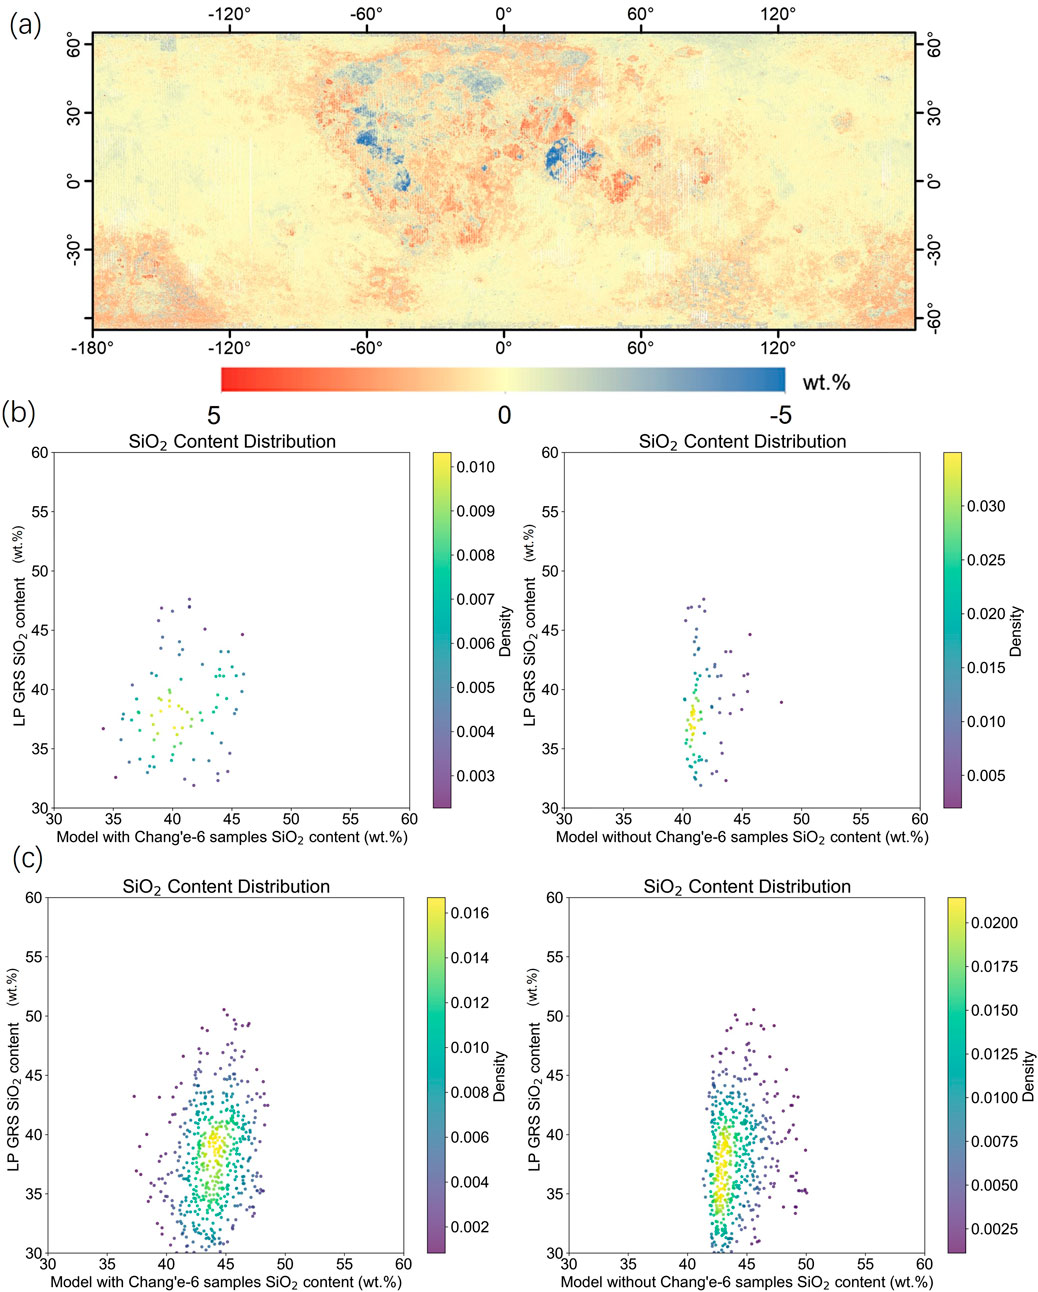
Figure 8. Difference map (a) of SiO2 content predictions between CNN models with and without the inclusion of Chang'E-6 samples. Blue regions indicate lower predicted values with the inclusion of Chang’E-6 samples, while red regions indicate higher predicted values. (b) Shows the 2D probability density function scatter plots for the model with Chang’E-6 samples and the model without Chang’E-6 samples in the Mare Tranquillitatis. (c) Shows the 2D probability density function scatter plots for the model with Chang'E-6 samples and the model without Chang'E-6 samples in Oceanus Procellarum.
The SiO2 content maps predicted by the models with and without the Chang'E-6 samples in Mare Tranquillitatis (Figure 8b) and Oceanus Procellarum (Figure 8c) were compared with the LP GRS (Prettyman et al., 2006), and 2D probability density function scatter plots were created. The results show that the inclusion of Chang’e-6 samples significantly improved the CNN model’s ability to identify low SiO2 content (30 wt.%–40 wt.%) in Mare Tranquillitatis and Oceanus Procellarum, which was verified by the SiO2 content measured by LP GRS. The CNN model without the Chang'E-6 samples had difficulty identifying SiO2 content distributions below 40 wt.%. In Mare Tranquillitatis, the CNN model with the Chang'E-6 samples produced more stable errors compared to the LP GRS predictions for SiO2 content. This error might stem from differences in the detection depth and data sources of LP GRS. In Oceanus Procellarum, the CNN model with Chang'E-6 samples had an RMSE of 4.14 wt.% compared to the SiO2 content measured by LP GRS, while the CNN model without Chang’E-6 samples had an RMSE of 4.19 wt.%. The inclusion of Chang’E-6 samples resulted in improvements in both the recognition of lower SiO2 content and overall prediction accuracy. The South Pole-Aitken Basin is mainly composed of feldspar and pyroxene, Mare Tranquillitatis is predominantly low-titanium basalt, and Oceanus Procellarum contains a variety of basalt types. Although the Chang’E-6 samples are from the South Pole-Aitken Basin, which has geological conditions very different from those of Mare Tranquillitatis and Oceanus Procellarum, the CNN model’s accuracy in predicting SiO2 content in Mare Tranquillitatis and Oceanus Procellarum has significantly improved. This strongly demonstrates the important contribution of the Chang’E-6 samples to the prediction performance and highlights the effective use of CF data in the CNN model, which is closely related to the SiO2 content distribution.
4.5 Limitation
The new SiO2 map gives us an insight into the distribution of SiO2 content across the Moon, but it still has limitations. The predicted SiO2 content results are unsatisfactory in some local regions and deviate significantly from the theoretical values. As shown in Figure 9, the ejecta of Aristarchus Crater, Gruithuisen Domes, Lassell Massif, and Mons Hansteen are associated with nonmare, silicic volcanoes on the Moon. The remote sensing data suggests that the main component of these areas is felsic rock (Hawke et al., 2003; Kiefer et al., 2016; Wagner et al., 2010), which is an acidic igneous rock with a SiO2 content of up to 74 wt.% (Simon et al., 2020). However, the SiO2 predicted by the 1D-CNN model for lunar felsic rocks ranges from 45 wt.% to 49 wt.%. Nonetheless, distinct differences between silicic regions and surrounding areas were also identified, such as in the Aristarchus Crater. The data from 40 lunar sampling sites represents a subset of the numerous rock types found on the Moon, and lunar sample data sets contain no significant high silicic minerals. The absence of calibration points for felsic rock samples caused erroneous predictions for SiO2 content in the silicic volcanic region. Therefore, it is also necessary to consider potential uncertainties in the estimation of FeO and TiO2 contents within silicic volcanic regions. NASA’s upcoming Artemis missions will explore the Gruithuisen Domes for the first time, providing new samples that are expected to improve our understanding of oxide inversion in these areas. In addition, different inversion algorithms and higher-resolution remote sensing datasets may yield varying results for such regions. Future work will focus on applying and comparing multiple inversion methods and datasets to enhance the accuracy of oxide content estimation in silicic terrains.
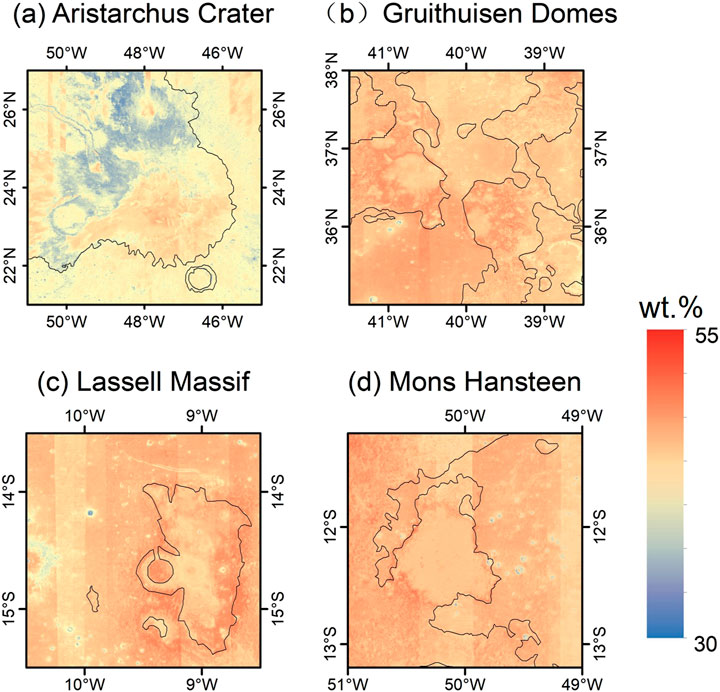
Figure 9. Silicic sites (a) Aristarchus Crater (48.2°W, 23.4°N), (b) Gruithuisen Domes (40.1°W, 36.3°N), (c) Lassell Massif (9.0°W, 14.6°S), and (d) Mons Hansteen (50.2°W, 12.2°S). The black line is lunar mare boundary.
5 Conclusion
We generated a lunar SiO2 distribution map using MI data, CF data, and lunar sample data through the 1D-CNN model. The map achieves a spatial resolution of 59 m per pixel, free from terrain shadows. The CNN model’s accuracy was assessed, with an R2 value of 0.975 and an RMSE of 0.113 for predicting SiO2 content. Comparison with LP GRS observations further validates the CNN model’s effectiveness in estimating SiO2 distribution. The global SiO2 distribution shows a near-side to far-side asymmetry, with the far-side maria exhibiting higher SiO2 content. We have more precisely identified the lower SiO2 content in the mare regions and confirmed different magmatic evolution and sources in Mare Tranquillitatis and Oceanus Procellarum. On the lunar near side, SiO2 content increases with latitude in the maria regions. Our findings support Shearer et al.'s (2015) view that the lunar highlands, predominantly composed of ferroan anorthosite, lack widespread MS outcrops. Additionally, lunar basalts in higher latitudes are more evolved compared to those at lower latitudes. The inclusion of Chang'E-6 samples and the Christiansen Feature significantly improved the CNN model’s accuracy in predicting SiO2 content in regions such as the South Pole-Aitken Basin, Mare Tranquillitatis, and Oceanus Procellarum. Future collection of high-silica samples will further enhance the model’s prediction of SiO2 content in high-silica volcanic regions.
Data availability statement
The original contributions presented in the study are included in the article/Supplementary Material, further inquiries can be directed to the corresponding authors.
Author contributions
WC: Data curation, Writing – original draft, Formal Analysis. DQ: Writing – review and editing, Investigation, Methodology. JY: Supervision, Conceptualization, Writing – review and editing, Project administration, Funding acquisition. SY: Resources, Writing – review and editing, Project administration, Supervision.
Funding
The author(s) declare that financial support was received for the research and/or publication of this article. This work is supported by the National Natural Science Foundation of China (422241116, 42402230, 52274165). JY is supported by the 2022 Project of Xinjiang Uygur Autonomous Region of China for the Heaven Lake Talent Program.
Acknowledgements
We appreciate the Japan Aerospace Exploration Agency (JAXA) and the University of Hawaii for providing the Kaguya Multiband Imager data (https://planetarymaps.usgs.gov/mosaic/Lunar_MI_multispectral_maps/) and the Lunar Prospector team for providing the LP GRS data (https://pds-geosciences.wustl.edu/lunar/lp-l-grs-5-elem-abundance-v1/lp_9001/). We also acknowledge Lucey et al. for providing the improved Diviner Lunar Radiometer Christiansen Feature–derived lunar mineralogy dataset (https://doi.org/10.5281/zenodo.4558194). The CNN model code is included in the supporting information file.
Conflict of interest
The authors declare that the research was conducted in the absence of any commercial or financial relationships that could be construed as a potential conflict of interest.
Generative AI statement
The author(s) declare that no Generative AI was used in the creation of this manuscript.
Any alternative text (alt text) provided alongside figures in this article has been generated by Frontiers with the support of artificial intelligence and reasonable efforts have been made to ensure accuracy, including review by the authors wherever possible. If you identify any issues, please contact us.
Publisher’s note
All claims expressed in this article are solely those of the authors and do not necessarily represent those of their affiliated organizations, or those of the publisher, the editors and the reviewers. Any product that may be evaluated in this article, or claim that may be made by its manufacturer, is not guaranteed or endorsed by the publisher.
Supplementary material
The Supplementary Material for this article can be found online at: https://www.frontiersin.org/articles/10.3389/fspas.2025.1696995/full#supplementary-material
References
Blewett, D. T., Lucey, P. G., Hawke, B. R., and Jolliff, B. L. (1997). Clementine images of the lunar sample-return stations: refinement of FeO and TiO2 mapping techniques. J. Geophys. Res. Planets 102 (E7), 16319–16325. doi:10.1029/97JE01505
Blewett, D. T., Hawke, B. R., and Lucey, P. G. (2005). Lunar optical maturity investigations: a possible recent impact crater and a magnetic anomaly. J. Geophys. Res. Planets 110 (E4). doi:10.1029/2004JE002380
Chrbolková, K., Halodová, P., Kohout, T., Ďurech, J., Mizohata, K., Malý, P., et al. (2022). Sub-surface alteration and related change in reflectance spectra of space-weathered materials. Astronomy and Astrophysics 665, A14. doi:10.1051/0004-6361/202243282
Christensen, P. R., Bandfield, J. L., Hamilton, V. E., Howard, D. A., Lane, M. D., Piatek, J. L., et al. (2000). A thermal emission spectral library of rock-forming minerals. J. Geophys. RESEARCH-PLANETS 105 (E4), 9735–9739. doi:10.1029/1998JE000624
Day, J. M. D., van Kooten, E. M. M. E., Hofmann, B. A., and Moynier, F. (2020). Mare basalt meteorites, magnesian-suite rocks and KREEP reveal loss of zinc during and after lunar formation. Earth Planet. Sci. Lett. 531, 115998. doi:10.1016/j.epsl.2019.115998
Dhingra, D., Pieters, C. M., Boardman, J. W., Head, J. W., Isaacson, P. J., and Taylor, L. A. (2011). Compositional diversity at theophilus crater: understanding the geological context of Mg-spinel bearing central peaks. Geophys. Res. Lett. 38 (11). doi:10.1029/2011gl047314
Du, J.-S., Chen, C., Liang, Q., and Zhou, C. (2010). The characteristics of rock-density distributions on the surface and in the crust of the moon. Chin. J. Geophys. 53 (9), 2059–2067. doi:10.3969/j.issn.0001-5733.2010.09.006
Ellerbrock, R. H., Stein, M., and Schaller, J. (2024). Comparing silicon mineral species of different crystallinity using fourier transform infrared spectroscopy. Front. Environ. Chem. 5, 1462678. doi:10.3389/fenvc.2024.1462678
Giguere, T. A., Taylor, G. J., Hawke, B. R., and Lucey, P. G. (2000). The titanium contents of lunar mare basalts. Meteorit. and Planet. Sci. 35 (1), 193–200. doi:10.1111/j.1945-5100.2000.tb01985.x
Hagerty, J. J., Lawrence, D. J., Hawke, B. R., Vaniman, D. T., Elphic, R. C., and Feldman, W. C. (2006). Refined thorium abundances for lunar red spots: implications for evolved, nonmare volcanism on the moon. J. Geophys. Res. Planets 111 (E6). doi:10.1029/2005je002592
Hawke, B. R., Lawrence, D. J., Blewett, D. T., Lucey, P. G., Smith, G. A., Spudis, P. D., et al. (2003). Hansteen alpha: a volcanic construct in the lunar highlands. J. Geophys. Res. Planets 108 (E7). doi:10.1029/2002JE002013
Hess, P. C., and Parmentier, E. M. (1995). A model for the thermal and chemical evolution of the Moon’s interior: implications for the onset of mare volcanism. Earth Planet. Sci. Lett. 134 (3–4), 501–514. doi:10.1016/0012-821x(95)00138-3
Hiesinger, H., Head III, J. W., Wolf, U., Jaumann, R., and Neukum, G. (2003). Ages and stratigraphy of mare basalts in oceanus procellarum, mare nubium, mare cognitum, and mare insularum. J. Geophys. Res. Planets 108 (E7). doi:10.1029/2002JE001985
Jones, M. J., Evans, A. J., Johnson, B. C., Weller, M. B., Andrews-Hanna, J. C., Tikoo, S. M., et al. (2022). A south pole-aitken impact origin of the lunar compositional asymmetry. Sci. Adv. 8 (14), eabm8475. doi:10.1126/sciadv.abm8475
Kiefer, W. S., Taylor, G. J., Andrews-Hanna, J. C., Head, J. W., Jansen, J. C., and Robinson, K. L. (2016). The bulk density of the small lunar volcanos gruithuisen Delta and. Hansteen Alpha.
Kiranyaz, S., Avci, O., Abdeljaber, O., Ince, T., Gabbouj, M., and Inman, D. J. (2021). 1D convolutional neural networks and applications: a survey. Mech. Syst. Signal Process. 151, 107398. doi:10.1016/j.ymssp.2020.107398
Korokhin, V. V., Kaydash, V. G., Shkuratov, Y. G., Stankevich, D. G., and Mall, U. (2008). Prognosis of TiO2 abundance in lunar soil using a non-linear analysis of clementine and LSCC data. Planet. Space Sci. 56 (8), 1063–1078. doi:10.1016/j.pss.2008.02.001
Kumari, N., Breitenfeld, L. B., Shirley, K., and Glotch, T. D. (2025). Characterizing extreme compositions on the moon using thermal infrared spectroscopy. J. Geophys. Res. Planets 130 (5), e2024JE008814. doi:10.1029/2024JE008814
Lawrence, D. J., Feldman, W. C., Elphic, R. C., Little, R. C., Prettyman, T. H., Maurice, S., et al. (2002). Iron abundances on the lunar surface as measured by the lunar prospector gamma-ray and neutron spectrometers. J. Geophys. Res. Planets 107 (E12), 13-1–13–26. doi:10.1029/2001JE001530
Lecun, Y., Bottou, L., Bengio, Y., and Haffner, P. (1998). Gradient-based learning applied to document recognition. Proc. IEEE 86 (11), 2278–2324. doi:10.1109/5.726791
Lemelin, M., Lucey, P. G., and Camon, A. (2022). Compositional maps of the lunar polar regions derived from the kaguya spectral profiler and the lunar orbiter laser altimeter data. Planet. Sci. J. 3 (3), 63. doi:10.3847/PSJ/ac532c
Li, C., Hu, H., Yang, M.-F., Liu, J., Zhou, Q., Ren, X., et al. (2024). Nature of the lunar far-side samples returned by the Chang’E-6 mission. Natl. Sci. Rev. 11 (11), 328. doi:10.1093/nsr/nwae328
Lucas, M. P., Neal, C. R., Long-Fox, J. M., and Britt, D. (2024). Simulating lunar highlands regolith profiles on Earth to inform infrastructure development and ISRU activities on the moon. Acta Astronaut. 224, 161–171. doi:10.1016/j.actaastro.2024.08.019
Lucey, P. G., Taylor, G. J., and Malaret, E. (1995). Abundance and distribution of iron on the moon. Science 268 (5214), 1150–1153. doi:10.1126/science.268.5214.1150
Lucey, P. G., Blewett, D. T., and Hawke, B. R. (1998). Mapping the FeO and TiO2 content of the lunar surface with multispectral imagery. J. Geophys. Res. Planets 103 (E2), 3679–3699. doi:10.1029/97je03019
Lucey, P. G., Blewett, D. T., and Jolliff, B. L. (2000). Lunar iron and titanium abundance algorithms based on final processing of clementine ultraviolet-visible images. J. Geophys. Res. Planets 105 (E8), 20297–20305. doi:10.1029/1999JE001117
Lucey, P., Korotev, R. L., Gillis, J. J., Taylor, L. A., Lawrence, D., and Campbell, B. A. (2006). Understanding the lunar surface and space-moon interactions. Rev. Mineralogy Geochem. 60 (1), 83–219. doi:10.2138/rmg.2006.60.2
Lucey, P. G., Greenhagen, B., Hanna, K. D., Bowles, N., Flom, A., and Paige, D. A. (2021). Christiansen feature map from the lunar reconnaissance orbiter diviner lunar radiometer experiment: improved corrections and derived mineralogy. J. Geophys. RESEARCH-PLANETS 126 (6), e2020JE006777. doi:10.1029/2020JE006777
Nelson, D. M., Koeber, S. D., Daud, K., Robinson, M. S., Watters, T. R., Banks, M. E., et al. (2014). “Mapping lunar maria extents and lobate scarps using LROC image products,” in Presented at the 45th Annual Lunar and Planetary Science Conference, 2861. Available online at: https://ui.adsabs.harvard.edu/abs/2014LPI…45.2861N.
Ohtake, M., Pieters, C. M., Isaacson, P., Besse, S., Yokota, Y., Matsunaga, T., et al. (2013). One moon, many measurements 3: spectral reflectance. Icarus 226 (1), 364–374. doi:10.1016/j.icarus.2013.05.010
Otake, H., Ohtake, M., and Hirata, N. (2012). “Lunar iron and titanium abundance algorithms based on SELENE (Kaguya) multiband imager data,” in Presented at the 43rd Annual Lunar and Planetary Science Conference, 1905. Available online at: https://ui.adsabs.harvard.edu/abs/2012LPI…43.1905O.
Papike, J. J., Fowler, G. W., Shearer, C. K., and Layne, G. D. (1996). Ion microprobe investigation of plagioclase and orthopyroxene from lunar Mg-suite norites: implications for calculating parental melt REE concentrations and for assessing postcrystallization REE redistribution. Geochimica Cosmochimica Acta 60 (20), 3967–3978. doi:10.1016/0016-7037(96)00212-8
Pasckert, J. H., Hiesinger, H., and Bogert, C. H. (2015). Small-scale lunar farside volcanism. Icarus 257, 336–354. doi:10.1016/j.icarus.2015.04.040
Pieters, C. (2002). Statistical analysis of the links among lunar mare soil mineralogy, chemistry, and reflectance spectra. Icarus 155, 285–298. doi:10.1006/icar.2001.6749
Prettyman, T. H., Hagerty, J. J., Elphic, R. C., Feldman, W. C., Lawrence, D. J., McKinney, G. W., et al. (2006). Elemental composition of the lunar surface: analysis of gamma ray spectroscopy data from lunar prospector. J. Geophys. RESEARCH-PLANETS 111 (E12), E12007. doi:10.1029/2005JE002656
Qiu, D., Li, F., Yan, J., Gao, W., and Chong, Z. (2022). Machine learning for inversing FeO and TiO2 content on the moon: method and comparison. Icarus 373, 114778. doi:10.1016/j.icarus.2021.114778
Raedeke, L. D., and McCallum, I. S. (1980). A comparison of fractionation trends in the lunar crust and the stillwater complex. Pergamon Press.
Rutanen, H., and Andersson, U. B. (2008). Mafic plutonic rocks in a continental-arc setting: geochemistry of 1.87-1.78 Ga rocks from south-central Sweden and models of their palaeotectonic setting. Geol. J. 44, 241–279. doi:10.1002/gj.1133
Sato, H., Robinson, M, S., J. Lawrence, S., Hapke, B., Jolliff, B. L., et al. (2017). Lunar mare TiO2 abundances estimated from UV/Vis reflectance. Icarus 296, 216–238. doi:10.1016/j.icarus.2017.06.013
Shearer, C. K., Elardo, S. M., Petro, N. E., Borg, L. E., and McCubbin, F. M. (2015). Origin of the lunar highlands Mg-suite: an integrated petrology, geochemistry, chronology, and remote sensing perspective. Am. Mineralogist 100 (1), 294–325. doi:10.2138/am-2015-4817
Simon, J. I., Christoffersen, R., Wang, J., Mouser, M. D., Mills, R. D., Ross, D. K., et al. (2020). Volatiles in lunar felsite clasts: impact-related delivery of hydrous material to an ancient dry lunar crust. Geochimica Cosmochimica Acta 276, 299–326. doi:10.1016/j.gca.2020.02.008
Snyder, G. A., Neal, C. R., Taylor, L. A., and Halliday, A. N. (1995). Processes involved in the formation of magnesian-suite plutonic rocks from the highlands of the Earth’s moon. J. Geophys. Res. Planets 100 (E5), 9365–9388. doi:10.1029/95je00575
Spudis, P. D. (1996). The once and future moon. Washington: Smithsonian Institution Press. Available online at: http://archive.org/details/oncefuturemoon0000spud.
Surkov, Y., Shkuratov, Y., Kaydash, V., Korokhin, V., and Videen, G. (2020). Lunar ilmenite content as assessed by improved Chandrayaan-1 M3 data. Icarus 341, 113661. doi:10.1016/j.icarus.2020.113661
Tomka, R., Boazman, S., Bradák, B., Heather, D. J., Kereszturi, A., Pal, B. D., et al. (2024). Boulder distribution, circular polarization, and optical maturity: a survey of example lunar polar terrains for future landing sites. Adv. Space Res. 73 (4), 2243–2260. doi:10.1016/j.asr.2023.10.005
Utt, K. L., Ogliore, R. C., Bechtel, H. A., Gillis-Davis, J. J., and Jolliff, B. L. (2021). Detecting sub-micron space weathering effects in lunar grains with synchrotron infrared nanospectroscopy. J. Geophys. Res. Planets 126 (9), e2021JE006921. doi:10.1029/2021JE006921
Wagner, R., Head, J. W., Wolf, U., and Neukum, G. (2010). Lunar red spots: stratigraphic sequence and ages of domes and plains in the hansteen and helmet regions on the lunar nearside. J. Geophys. Res. 115 (E6), 06015. doi:10.1029/2009je003359
Wang, X., and Zhao, S. (2017). New insights into lithology distribution across the moon: lithologic characteristic across the moon. J. Geophys. Res. Planets 122 (10), 2034–2052. doi:10.1002/2017je005394
Whitten, J. L., and Head, J. W. (2015). Lunar cryptomaria: physical characteristics, distribution, and implications for ancient volcanism. Icarus 247, 150–171. doi:10.1016/j.icarus.2014.09.031
Wieczorek, M. A. (2006). The constitution and structure of the lunar interior. Rev. Mineralogy Geochem. 60 (1), 221–364. doi:10.2138/rmg.2006.60.3
Wiszniewska, J., Claesson, S., Stein, H., Auwera, J. V., and Duchesne, J.-C. (2002). The north-eastern Polish anorthosite massifs: petrological, geochemical and isotopic evidence for a crustal derivation. Terra nova. 14 (6), 451–460. doi:10.1046/j.1365-3121.2002.00443.x
Wu, Y. (2012). Major elements and mg# of the moon: results from Chang’E-1 interference imaging Spectrometer (IIM) data. Geochimica Cosmochimica Acta 93, 214–234. doi:10.1016/j.gca.2012.07.011
Xia, W., Wang, X., Zhao, S., Jin, H., Chen, X., Yang, M., et al. (2019). New maps of lunar surface chemistry. ICARUS 321, 200–215. doi:10.1016/j.icarus.2018.10.031
Xue, Z., Xiao, L., Neal, C. R., and Xu, Y. (2019). Oldest high-Ti basalt and magnesian crustal materials in feldspathic lunar meteorite Dhofar 1428. Geochimica Cosmochimica Acta 266, 74–108. doi:10.1016/j.gca.2019.06.022
Keywords: moon, oxide, spectrum, SiO2, 1D-CNN
Citation: Chen W, Qiu D, Yan J and Yi S (2025) New insight into the composition of the lunar surface from SiO2 map. Front. Astron. Space Sci. 12:1696995. doi: 10.3389/fspas.2025.1696995
Received: 01 September 2025; Accepted: 27 October 2025;
Published: 14 November 2025.
Edited by:
Ludmila Carone, Austrian Academy of Sciences, AustriaReviewed by:
Akos Kereszturi, Hungarian Academy of Sciences (MTA), HungaryYoussef Moulane, Mohammed VI Polytechnic University, Morocco
Copyright © 2025 Chen, Qiu, Yan and Yi. This is an open-access article distributed under the terms of the Creative Commons Attribution License (CC BY). The use, distribution or reproduction in other forums is permitted, provided the original author(s) and the copyright owner(s) are credited and that the original publication in this journal is cited, in accordance with accepted academic practice. No use, distribution or reproduction is permitted which does not comply with these terms.
*Correspondence: Denggao Qiu, ZGVuZ2dhb3FpdUB3aHUuZWR1LmNu; Jianguo Yan, amd5YW5Ad2h1LmVkdS5jbg==