 Joshua D. Gamble
 Gary W. Feyereisen1*
- 1Soil and Water Management Research Unit, Agricultural Research Service, United States Department of Agriculture, Saint Paul, MN, United States
- 2North Central Agricultural Research Laboratory, Agricultural Research Service, United States Department of Agriculture, Brookings, SD, United States
- 3North Central Soil Conservation Research Laboratory, Agricultural Research Service, United States Department of Agriculture, Morris, MN, United States
Leaching of nitrate (NO3-N) from manure-applied cropping systems can represent a substantial N-loss to the environment for dairy farms, particularly in fields with artificial subsurface drainage. In this on-farm study, we used a Before/After analysis to assess the effectiveness of summer fertigation with reduced manure rates (years 2010-2015) vs. fall injection (2007-2009) of dairy slurry in terms of subsequent corn silage yield, corn N removal, soil NO3-N distribution, and NO3-N losses in subsurface tile drainage from a 65-ha field in Minnesota, USA. Yield was similar between periods (average of 18.8 Mg ha−1), but crop %N, N removal, and manurial N-use efficiency (MNUE) were 15, 12, and 126% greater during the fertigation than injection period. Fertigation reduced spring soil NO3-N concentrations to 60-cm depth by an average of 53% relative to injection, except in the 15–30 cm increment, where no difference was found. Similarly, fall soil NO3-N concentrations from 30 to 90 cm were 48% lower, on average, under fertigation than injection. Weekly flow-weighted mean NO3-N concentration in tile drainage was lower during fertigation (47.7 mg L−1) than injection (56.8 mg L−1), although mean weekly drainage depth was greater during fertigation (2.3 vs. 1.1 mm). This resulted in similar weekly loads between periods (mean of 0.96 kg NO3-N ha−1). For non-snowmelt flow, relationships between drainage and NO3-N load showed log–log slopes of near 1.0 for injection and 0.97 for fertigation, indicating dilution of concentrations with increased flow during fertigation, but not during injection. Differing intercepts indicated a treatment effect of fertigation independent of flow effects, and corresponded to loads of 5.9 kg NO3-N ha−1 for injection and 4.7 kg NO3-N ha−1 for fertigation, a reduction of 20% at a 10 mm weekly flow depth. The magnitude of the reduction in load increased to 22% at a 25 mm weekly flow depth. Results suggest that summer fertigation with attendant reduction in application rate is a viable method for reducing drainage NO3-N losses without impacting yield of irrigated silage corn in the U.S. Midwest.
Introduction
The US dairy industry has changed dramatically in recent decades, with a trend toward geographic consolidation into fewer, large-scale confinement operations. From 1992 to 2012, the total number of dairy farms declined by about 60%, down to about 44,000 farms, while the number of farms with more than 1,000 cows increased by over 200%, up to over 1,800 farms (USDA-NASS, 2014). By 2012, nearly 50% of all dairy cows in the US were on farms of 1,000 cows or more, up from a mere 10% in 1992. This has resulted in a geographic consolidation of dairy manure production, and has also led to an increased reliance on corn (Zea mays L.) silage for animal feed in place of perennial forages like alfalfa (Medicago sativa L.). In Minnesota, many of the larger dairies are located in the Minnesota River basin, a highly impaired drainage that is the primary source of nitrogen, phosphorus, and sediment exported from the state via the Mississippi River (MPCA, 2014). Much of the cropland in this region is tile-drained, facilitating rapid transport of water and nutrients from the point of application to nearby waterways (David et al., 2010). These factors, coupled with the aforementioned manure consolidation and loss of perennial cover, raise questions about the water quality implications of the trend toward larger operations in the dairy industry.
Manure can be a valuable source of crop nutrients, but it can be challenging to synchronize nutrient availability with plant needs because of variability in the timing of organic N and P mineralization into plant-available inorganic forms. This is a particular challenge for corn silage production, because the N demand of corn is large and must be met within a relatively short time frame. The uncertainty regarding the timing of N availability, along with the narrow window for crop N need, leads producers to err on the high side with respect to manure application rates (Tarkalson et al., 2006). Over time, high-rate manure applications can result in elevated soil NO3-N (Muñoz et al., 2003), which in turn can lead to higher NO3-N concentrations in subsurface drainage (Randall and Mulla, 2001).
While the agglomeration of dairy animals into fewer, but larger, operations within the region may pose a significant risk to downstream water quality, it may also present unique opportunities for improvement. Economies of scale may make it practical to apply practices in large operations that would be prohibitively expensive for smaller operations. Herein we describe an on-farm experiment done in collaboration with a large dairy farm in Minnesota, U.S.A. The cooperating farmer was interested in understanding the environmental impacts of the current manure application practice, fall injection, as well as the viability and environmental impact of a unique alternative application technique—summer fertigation, or applying diluted, screened dairy slurry through an irrigation system. Previous research at the cooperating dairy has evaluated the effects of a rye cover crop on drainage NO3-N and P losses (Krueger et al., 2013), the effects of replacing open surface tile inlets with fine gravel inlets on sediment and P losses (Feyereisen et al., 2015), and changes in soil organic carbon related to agronomic management and terrain (Gamble et al., 2017).
Fall injection of manure following corn silage harvest is a common management practice for dairy producers in the region. Early fall represents the best opportunity to access the field in terms of trafficability, and it also allows producers to shift manure application away from the busy planting season. However, nutrients in fall-applied manure are especially vulnerable to leaching loss over winter and into the wet spring months, particularly in fields with artificial subsurface drainage. Krueger et al. (2013) reported annual losses of up to 89 kg NO3-N ha−1 in drainage from fall manure-injected silage corn at the same dairy, a loss of roughly 20% of the total N applied in manure. Greater synchrony between the timing of manure application and peak crop nutrient demand could improve crop nutrient utilization and reduce N losses in drainage (Magdoff et al., 1997).
In irrigated fields, such as those at our cooperating dairy, fertigation is an appealing alternative to fall injection that could better synchronize nutrient availability with plant needs. Applying manure via an irrigation system requires little machinery traffic across the field, making growing season application a realistic option. It could also allow for lower application rates over time, as a greater fraction of applied N should be utilized for plant growth, rather than lost to the environment. However, little research has been done at the field-scale to evaluate summer fertigation as a viable manure application practice for corn silage production. We assessed the effectiveness of summer fertigation with reduced manure rates vs. fall injection of dairy manure in terms of subsequent corn silage yield, soil nitrate-N dynamics, and nitrate-N losses in subsurface tile drainage effluent from a 65-ha silage-corn production field. We hypothesized that converting to summer fertigation with lower application rates from fall injection would increase crop utilization of manurial N and reduce nitrate-N losses in subsurface tile drainage without reducing silage corn yields.
Materials and Methods
Site Description
The study was conducted on a 65-ha field on a privately owned dairy farm in west-central Minnesota from September 2006 through October 2015. Soils at the site were formed in calcareous loamy glacial till, characteristic of the prairie pothole soils of the Upper Midwest. Soils on higher landscape positions included a well-drained Forman clay loam and moderately well-drained Aastad clay loam. The soil on side slopes surrounding depressions was primarily a somewhat poorly drained Hamerly clay loam, while depressional areas were characterized by poorly drained Parnell silty clay loam, Parnell-Flom silty clay loam, and Nuttie-Hatley clay soils.
The study field is extensively tile drained (Figure 1). Mapping of the study site with light detection and ranging (LiDAR) revealed low relief with elevation varying by approximately 5 m across the 65-ha research site. From the resulting topographic map, a watershed of 26.6 ha was delineated in ArcGIS 10.1 (ESRI, Inc., Redlands, CA) for sampling of subsurface drainage. The drainage system included 18 surface inlets designed to quickly drain depressional areas during spring snow melt and after large rain events. These were open inlets from the start of the study through the fall of 2009. In October 2009, all of the open inlets in the field were converted to gravel inlets and some additional tile drainage was added to the field. These changes resulted in a slight increase in the watershed area, from 26.6 to 26.7 ha. The drainage discharged into the subsurface drainage system of an adjacent field. Approximately 0.74 ha of the study watershed lay on the adjacent field.
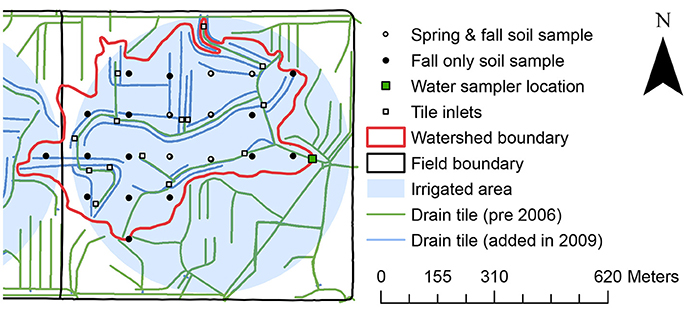
Figure 1. Map of tile lines, irrigation, watershed boundary, tile inlets, water sampler location, and soil sample locations for the study field in west central Minnesota.
Precipitation was measured at the site beginning on 4 September 2007 using a tipping bucket gauge with a manual rain gauge backup. Frozen precipitation was not measured, so October to April precipitation data were obtained from the University of Minnesota West Central Research and Outreach Center (WCROC), located 16 km away. Any other missing precipitation data throughout the study period were filled with data from the WCROC.
Agronomic Management
The field was planted to corn (Zea mays L.) each year of the study on dates ranging from 22 April to 22 May, and was harvested for silage each late summer/early fall on dates ranging from 28 August to 29 September (Table 1). In the fall of 2006, 2007, and 2008, liquid dairy manure was injected by drag-line injection at 97,000–150,000 L ha−1, with dates of application ranging from 28 August to 4 November. In 2006, manure was pumped directly from the stirred lagoon, while some solids were removed before injection in 2007 and 2008. After all applications, the field was tilled to a depth of 23–30 cm with a disk ripper (Ecolo-Tiger 870, Case IH, Racine, WI, USA), except in 2008 when tillage occurred before manure application. Center pivot irrigators with drop nozzles (T3000 Trashbuster, Nelson Irrigation Corp., Walla Walla, WA, USA) were installed in October 2008, and irrigation began in May 2009 and continued each year throughout the study. No manure was applied in 2009 during the transition to fertigation. Starting in 2010, manure was fertigated via center-pivot irrigation system at 46,000–143,000 L ha−1 (Table 1) on dates ranging from 24 June to 9 July. Two applications were made in 2010 as the producer was experimenting with application techniques. During the first application, undiluted manure was applied. During second application, manure was diluted to a 50/50 mixture with well-water, and all subsequent applications were done this way. In 2015, manure was applied to less than a third of the field due to irrigator malfunction, and 84 kg N ha−1 of mineral fertilizer was applied to the remainder of the field.
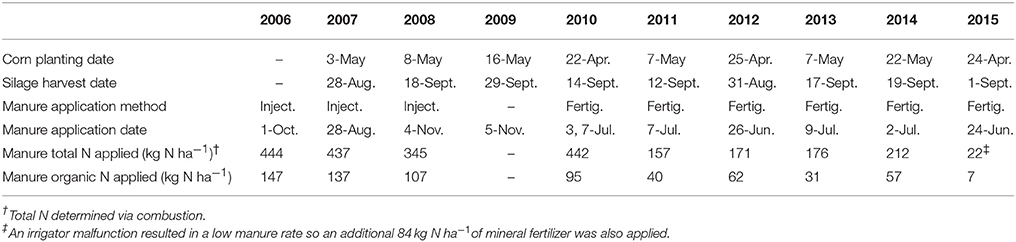
Table 1. Summary of agronomic management at the study site.
Water Sampling
Subsurface flow measurement and water sampling equipment were deployed in a manhole access to a 38-cm submain at the edge of the field. Details of the water monitoring and sampling system can be found in Krueger et al. (2013) and Feyereisen et al. (2015). Briefly, for the 2007–2009 period, stage was measured immediately upstream and downstream from a weir with bubbler level gauges (Model 4230, Teledyne Isco, Inc., Lincoln, Nebraska), and a rating curve was used to calculate flow rate. In March 2010, an area-velocity sensor (Model 2150, Teledyne Isco, Inc.) was installed. Water samples were collected on a flow-interval basis with an automated sampler (Model 3700 or 6712, Teledyne Isco, Inc., Lincoln, Nebraska). The autosampler was programmed (2007–2009) or triggered by the area-velocity sensor (2010-2015) to draw a 100-mL subsample per 300 m3 of flow or 0.7 mm of depth (Harmel and King, 2005). Groups of three subsamples were combined into 300-mL glass jars containing 0.6 mL concentrated H2SO4 (Clesceri et al., 1998). Samples were retrieved weekly, filtered using a 0.2 μm nylon filter, and refrigerated. Determination of NO3-N was by cadmium (Cd) reduction with an Alpkem RFA300 (Alpkem Corp., Clackamas, Oregon).
Crop Yield and N Sampling
In 2007, total wet mass of corn silage was recorded by the farmer by weighing each truckload of corn silage removed from the field, and five approximately 1.5-kg subsamples were collected for dry matter (DM) determination. In all remaining years, corn DM yield was determined by hand harvesting and weighing a 3 m length of row in at least 16 randomly-selected locations, collecting a subsample of three plants in each location. Subsamples were dried at 65°C for 48 h for DM determination and ground to pass through a 1 mm sieve for N analysis by dry combustion (Bremner and Mulvaney, 1982) using a Leco TruSpec CHN Analyzer (Leco Corp., St. Joseph, Michigan). Crop N removal was calculated as the product of crop DM yield and N concentration. Manurial N-use efficiency (MNUE) was calculated as the ratio of crop N removal to manure N applied.
Soil Sampling
Soil samples were collected after corn silage harvest and before manure application, on dates ranging from 25 August to 10 September, and again in spring on dates ranging from 14 May to 9 June. Late summer/early fall samples were collected within the watershed at 21 locations in a grid pattern with approximately 113 m between sample locations (Figure 1). Spring soil samples were collected from 15 locations in the watershed from a subset of the fall locations. Samples were collected to a depth of 60 cm in the spring and 90 cm in the fall using a hydraulic sampling probe with a core inner diameter of 6.5 cm, except in fall 2009 when a sampler core with an inner diameter of 3.8 cm was used. Cores were subdivided into 0–5-, 5 to 15-, 15–30-, 30–60-, and 60–90-cm layers, dried at 37°C, and ground to <0.5 mm for chemical analysis. Soil samples were extracted with 1 M KCl and NO3-N was determined colorimetrically using flow injection analysis (Alpkem Corp., Clackamas, Oregon).
Experimental Design and Statistical Analysis
Analysis was conducted using the Before/After design of Spooner et al. (1985), splitting the dataset into periods when manure was injected (2007-2009) and when it was applied through fertigation (2010-2015), hereafter referred to as the “injection period” and “fertigation period,” respectively. For water samples during the injection period, the corresponding manure application occurred the previous fall. It is important to note that these periods also correspond with the conversion of open tile inlets to closed, gravel inlets in late fall 2009. Previous research suggests no clear difference in NO3-N loading in drainage between open tile inlets and gravel inlets (Smith and Livingston, 2013), though we acknowledge this change in the drainage system as part of any treatment effects observed in our analysis. A transition period from 1 October 2009 to 31 December 2009 during drainage renovation was excluded from analysis here. All statistical analyses described herein were conducted in program R (R Core Team, 2016).
Flow weighted mean (FWM) concentrations were calculated for each week. Loads were calculated by multiplying the sample concentration by the volume of water passing the sampling point during subsampling using the midpoint in flow as the point of divide between samples. Loads and flow depth were then summed by week for further analysis.
Weekly Mean Flow, Nitrate Concentration, and Nitrate Load Comparisons
We used t-tests to compare average weekly flow depth, FWM NO3-N concentrations, and NO3-N loads between periods (manure injection vs. fertigation). In these comparisons, we used only non-zero weekly values, and data were square transformed (concentrations) or natural log transformed (flow and loads) to meet assumptions of Normality. There were 88 weekly observations during the injection period and 104 weekly observations during the fertigation period with recorded flow. Serial correlation was present in the weekly datasets, so errors were not independent over time. To account for this effect, we adjusted the standard error equation for the t-tests as Ramsey and Schafer (2013):
where s is the pooled standard deviation, n is the total number of weeks (sample size), and r1 is the first order serial correlation coefficient. Under the condition where r1 is zero (i.e., no serial correlation), the above equation becomes the usual standard error equation. We calculated the first order serial correlation coefficient using the acf function in the “stats” package of program R (R Core Team, 2016). Means reported in the text are back-transformed to the original scale.
Effects of Manure Rate and Timing on Drainage Nitrate Concentrations
We hypothesized that water samples collected following high rates of manure N application would exhibit higher concentrations than those following lower application rates, regardless of manure application method. Further, we hypothesized that concentrations would remain higher over time (weeks) following high application rates. For this analysis, we created variables in the weekly nitrate concentration dataset to account for two factors related to the potential impacts of manure. The first was a categorical variable to account for the N rate of the most recent manure application for each weekly observation, where manure rates were grouped into equally sized intervals of 0–150, 150–300, and 300–450 kg N ha−1. The second was a continuous variable that specified the number of weeks since the most recent manure application.
These variables were then regressed onto the weekly FWM nitrate concentrations to determine if and how manure N rates impacted nitrate losses over time. For this analysis, we first fit an intercept-only model to evaluate potential serial correlation in model residuals. This model was then fit with different temporal correlation structures using the gls function in the R package “nlme” (Pinheiro et al., 2013), and results were compared using AIC to determine the correlation structure that best accounted for temporal patterns in the data. These results were confirmed by examining autocorrelation plots of the normalized residuals and plots of the normalized residuals vs. predicted values. Once a suitable correlation structure was selected, all possible explanatory variables were added to the model and significance was determined via t-test of each coefficient in the regression summary output at α = 0.05.
Nitrate Transport Dynamics
To assess NO3-N transport dynamics, we evaluated the relationship between weekly nitrate load and flow depth for each period. This analysis also allows for comparison of the water quality implications between periods. In this analysis, we fitted a linear regression to the natural logarithm of weekly NO3-N load (kg ha−1) vs. natural logarithm of weekly flow depth (mm). When the slope of this regression line equals one, the nutrient concentration remains constant with varying flow depth (Tomer et al., 2003; Ghane et al., 2016). When the slope is greater than one, high flows lead to increased concentration, and/or low flows lead to lower concentrations. Moreover, the slope is the percent increase in contaminant load induced by 1% increase in flow depth.
For this analysis, we followed the same model-fitting procedure as described above. We first fit an intercept only model, then determined the best correlation structure, then added all explanatory variables and determined the significance of each model coefficient at α = 0.05. We hypothesized that the effect of flow on NO3-N loads would vary by season, so we also fit a fixed effect for season, where “snowmelt” was 1 March to 15 April, “growing season” was 16 April to September 30, and “winter” was 1 October to the following 28 February.
Soil and Crop Analysis
Crop DM yield and crop N were analyzed with mixed-effects ANOVA treating period (injection or fertigation) as a fixed effect and sampling site within year as a random, repeated measure. MNUE was analyzed in the same manner. Fall residual soil NO3-N, and spring soil NO3-N were also analyzed with mixed-effects ANOVA, treating period and depth as categorical fixed effects, and sampling site within year as a random, repeated measure. Mixed effects ANOVA was conducted with the lme and anova.lme functions in the R package “nlme” (Pinheiro et al., 2013).
Results and Discussion
Weather and Drainage
Mean daily air temperature ranged from −29 to 30°C over the study period. Mean annual temperature was 0.8°C higher than the 30-year climatological normal of 5.8°C in 2007, but 0.6 and 0.7°C below normal in 2008 and 2009 (Figure 2, Table 2). Mean annual temperatures were 0.8, 0.2, 2.4, and 1.8°C above normal in 2010, 2011, 2012, and 2015, but 1.1 and 0.8°C below normal in 2013 and 2014. Averaged over years, mean annual temperature was 0.1°C lower than normal during the injection period and 0.5°C higher than normal during the fertigation period. Annual precipitation during the injection period ranged from a high of 720 mm in 2007 to a low of 562 mm in 2009, although in 2009, 194 mm of the precipitation fell during the transition period. An additional 102 mm of water was applied as irrigation during the summer of 2009. During the fertigation period, annual precipitation ranged from 493 mm in 2012 to 854 mm in 2010. Annual irrigation rates ranged from 0 mm in 2015 to 126 mm in 2010, with an annual average of 68 mm yr−1 applied as irrigation, which includes water applied during fertigation. Total water applied (precipitation plus irrigation) was, on average, 79 mm yr−1 higher during the fertigation period (707 mm yr−1) than the injection period (628 mm yr−1), primarily as a result of the additional water applied as irrigation.
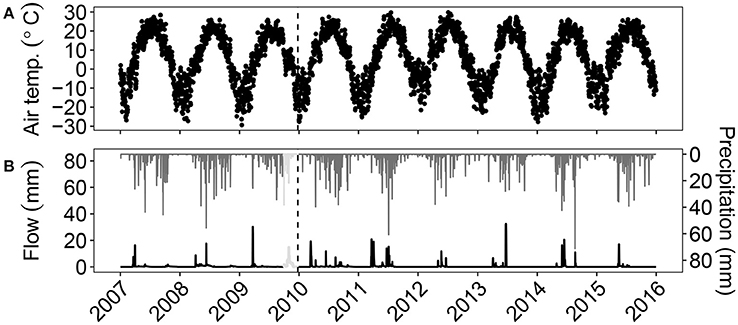
Figure 2. Daily mean air temperature (A) and Daily precipitation and drainage flow (B) at the study site. The vertical dashed line denotes the start of the fertigation period. The light gray lines denote data from the transition period that were excluded from the present analysis.
Table 2. Annual precipitation, average air temperature, irrigation, tile drainage, and nitrate-N load for the study field.
Annual drainage during the three-year injection period ranged from 95 to 160 mm yr−1, with an annual average of 119 mm. During the six-year fertigation period, annual drainage ranged from 59 to 252 mm yr−1, with an annual average of 140 mm. During the transition period in fall 2009, there was 165 mm of drainage that was excluded from subsequent analysis. The average ratio of drainage to total water applied was strikingly similar between periods, averaging 0.19 ± 0.03 (mean ± SE) during the injection period and 0.19 ± 0.04 during the fertigation period. This suggests that the changes to the tile drainage system in 2009 had little impact on the fraction of drainage, and that a before/after pairing is appropriate for the two periods. However, because total water inputs were greater during fertigation, the average weekly flow depth was also greater during the fertigation period (μ = 2.3 mm) than the injection period (μ = 1.1 mm; t = 2.22, df = 172, P = 0.0348) when weeks with no flow were excluded (Figure 3).
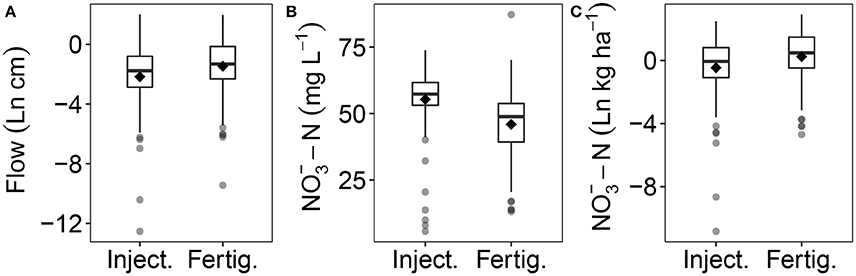
Figure 3. Distribution of natural-log transformed weekly average flow depth (A), weekly flow-weighted NO3-N concentrations (B), and natural-log transformed weekly NO3-N loads (C) in subsurface drainage during the injection (2007-2009) and fertigation (2010-2015) periods from the study field. Box plots show the mean (♦), 25, 50, and 75th percentiles (lower, middle, and upper bars on each box). Whiskers indicate 10 and 90th percentiles.
Nitrate-N Concentrations in Drainage
Weekly FWM NO3-N concentrations ranged from 5.6 to 87.3 mg L−1, with the highest concentrations generally occurring during the growing season and lowest generally in snowmelt (Figure 4). Weekly FWM NO3-N concentrations exhibited substantial autocorrelation, with r1 = 0.59. After accounting for this autocorrelation, we found that NO3-N concentration in tile drainage was 16% lower during fertigation (μ = 47.7 mg L−1) than the injection period (μ = 56.8 mg L−1; t = 2.96, df = 172, P = 0.0054, Figure 3). However, given the difference in flow between periods, this could be a dilution effect of greater flow during fertigation. This possibility is explored further in section Nitrate Transport Dynamics below.
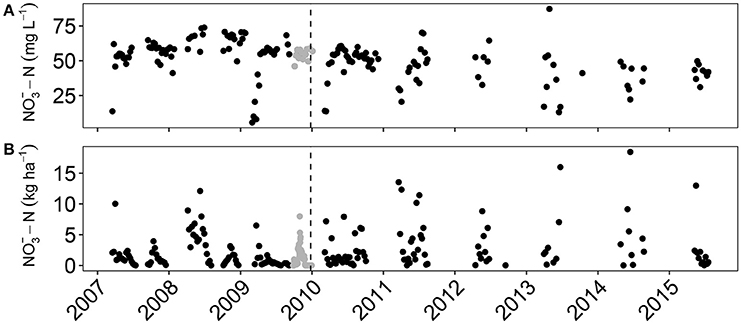
Figure 4. Weekly flow-weighted mean NO3-N concentrations (A) and loads (B) in subsurface drainage from the study field. The vertical dashed lines denote the start of the fertigation period. Gray points denote data from the transition period that were excluded from the present analysis.
A 16% reduction in NO3-N concentration is a substantial improvement, but 47.7 mg L−1 is still well above the EPA drinking water standard of 10 mg L−1. Concentrations exceeding this standard also contribute to downstream acidification, eutrophication, and toxicity to aquatic organisms (Camargo et al., 2005; Camargo and Alonso, 2006). However, by the final two years of the study, average concentration was further reduced to 37 mg L−1, suggesting continued improvement as manure rates were reduced and the soil N pool was drawn down.
Nitrate-N Loads
Total load during the three-year injection period was 166.6 kg NO3-N ha−1, with an annual average of 55.5 kg NO3-N ha−1 yr−1. Total load during the six-year fertigation period was 282.3 kg N ha−1, with an annual average of 47.1 kg NO3-N ha−1 yr−1. The total load during the transition period (winter 2009) was 90.5 kg NO3-N ha−1, which was excluded from further analysis because of the management transition to fertigation and construction on the drainage system. During the injection period, over half of the losses (86 kg ha−1, 52% of total) occurred during the growing season of 2008 (Figure 5). Total load was low in 2007, and loads were similar among seasons, as were 2009 loads prior to the transition period. During the fertigation period, very few losses were observed during snowmelt and the winter; the majority of loss (89%) occurred during the growing season. Loads were highest during 2010 and 2011 when manure rate remained high. From 2012 to 2015, loads were considerably lower, which corresponded to a reduction in manure rate.
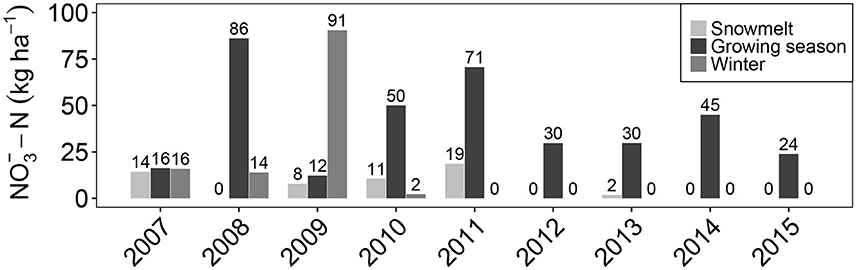
Figure 5. Seasonal cumulative NO3-N loads in subsurface drainage from the study field. The numbers above each bar denote the total load in kilograms per hectare.
Weekly NO3-N loads ranged from 0 to 25.4 kg NO3-N ha−1, with the highest weekly loads generally observed during the growing season and the lowest during winter. Weekly loads exhibited substantial autocorrelation, with r1 = 0.44. After accounting for this autocorrelation, we found that weekly mean NO3-N load in tile drainage was similar for the fertigation (μ = 1.28 kg NO3-N ha−1) and injection periods (μ = 0.63 kg NO3-N ha−1; t = 1.84, df = 180, P = 0.1222, Figure 3). This was caused by greater flow during fertigation, as NO3-N concentrations were lower during this period.
Soil Nitrate Concentrations
Preliminary analysis indicated that both spring and fall soil NO3-N concentrations varied with depth. Therefore, all further analyses were conducted by depth increment. In the spring, soil NO3-N concentrations were greater during injection than fertigation for all depth increments except 15–30 cm (Figure 6). From 0 to 5 cm, geometric mean spring NO3-N concentration was nearly 70% lower during fertigation (μ = 13.0 ppm) than injection years (μ = 39.9 ppm; F = 10.5, P = 0.0022). Likewise from 5 to 15 cm, NO3-N concentration was 55% lower during fertigation (μ = 14.5 ppm) than injection years (μ = 32.5 ppm; F = 8.7, P = 0.0050). From 30 to 60 cm, NO3-N concentration was 35% lower during fertigation (μ = 12.1 ppm) than during injection years (μ = 18.6 ppm; F = 10.0, P = 0.0027).
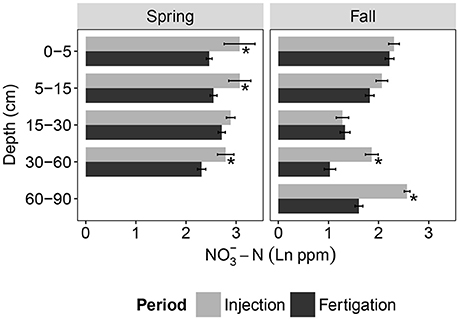
Figure 6. Natural-log transformed spring and fall-residual soil NO3-N concentrations by sample depth during manure injection (2007–2009) and fertigation (2010–2015). Error bars represent ± one standard error of the mean. Within season and depth, pairs of bars followed by “*” are significantly different, P < 0.05.
Fall-residual soil NO3-N concentrations were similar during injection and fertigation periods for the 0–5-, 5–15-, and 15–30-cm depths. From 30 to 60 cm, NO3-N concentration was nearly 40% lower during fertigation (μ = 6.3 ppm; F = 27.3, P = < 0.0001) than during injection (μ = 10.3 ppm). From 60 to 90 cm, soil NO3-N concentration was 55% lower during fertigation (μ = 6.6 ppm) than injection years (μ = 14.6 ppm; F = 49.6, P ≤ 0.0001).
These results demonstrate that summer fertigation of moderate rates of manure N can reduce the amount of NO3-N in the soil profile during two critical times of the year relative to fall injection. This appears to be a function of both manure timing and placement. Fall injection resulted in higher spring concentrations, but this N was of limited benefit to the crop, as root development is typically just underway by mid-May (Chaudhary and Prihar, 1974). Much of the N mineralized from the manure was, therefore, subject to loss during the wettest time of the year. In contrast, summer fertigation appeared to provide greater synchrony by supplying N just before peak crop demand, around the six-leaf stage for corn (Magdoff, 1991). This was evident in fall soil NO3-N concentrations, which were reduced in deeper soil increments during fertigation relative to injection. This suggests either less mineralization at these depths during fertigation or less percolation of mineralized N to depth. Given that soil nitrate concentrations were similar in the upper soil increments between periods, we think these patterns suggest that the timing and placement of manure with fertigation resulted in less percolation of NO3-N below the crop root zone.
Nitrate Transport Dynamics
The model that best accounted for the autocorrelation in weekly NO3-N loads included an autoregressive moving average (ARMA) correlation structure accounting for correlation up to 1 lag (week), along with a 3-lag moving average. We then fit effects of log-transformed flow, season, and period, as well as all two- and three-way interactions among these variables (“full model,” hereafter). Results from the full model show that the effect of flow on NO3-N load was similar for winter and the growing season (t = 0.71, P = 0.4789), but differed during snowmelt (t = 6.67, P < 0.0001; Table 3). Therefore, snowmelt data are treated separately hereafter, and growing season and winter data were grouped for further analysis (“non-snowmelt” hereafter).
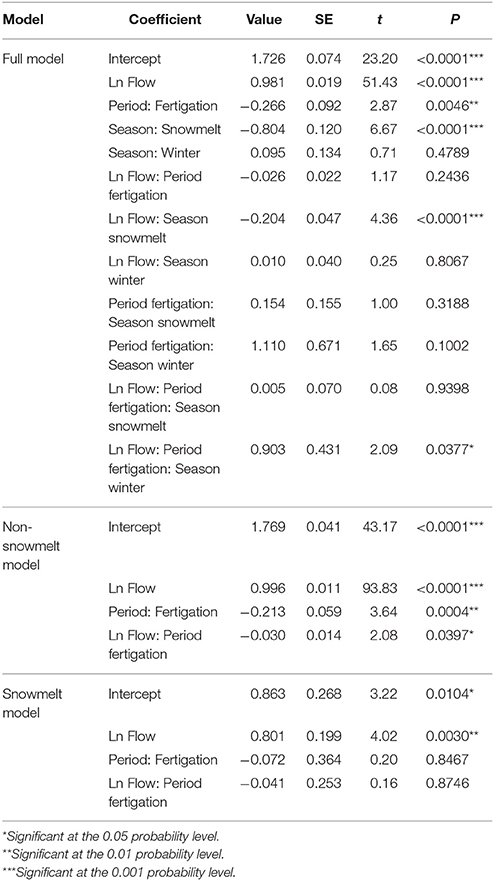
Table 3. Parameter estimates, standard errors, t-statistics, and P-values for the full and best-fitted regression models for nitrate-N transport dynamics.
Analysis of log-log plots of NO3-N load vs. flow rate for the non-snowmelt data showed differences in the effect of flow between periods, as evidenced by significantly different slopes (t = 2.08, P = 0.0397) and intercepts (t = 3.64, P = 0.0004; Figure 7). During the injection period, the slope was β = 0.996 ± 0.017 (mean ± 95% CI), indicating that for each 1% increase in flow depth, there was a corresponding 1% increase in NO3-N load (i.e., concentration did not vary by flow rate). For the fertigation period, the slope was β1 = 0.966 ± 0.023, indicating that for each 1% increase in flow depth, there was a corresponding 0.97% increase in NO3-N load. Thus, high flows resulted in slightly reduced NO3-N concentrations during the fertigation period. Additionally, the intercept was lower during the fertigation period (β0 = 1.556 ± 0.102) than the injection period (β0 = 1.769 ± 0.080), which indicates a treatment effect of fertigation, independent of flow effects.
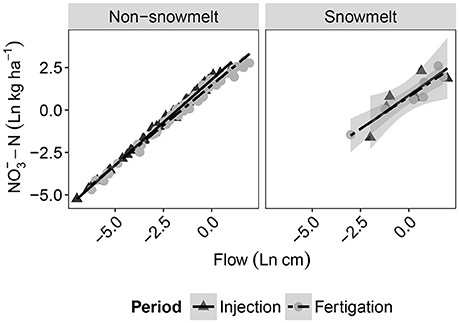
Figure 7. Relationship between natural log-transformed weekly subsurface tile flow depth and NO3-N loads for non-snowmelt and snowmelt periods. When the slope is one, the nutrient concentration remains constant with varying flow depth. When the slope is greater than one, high flows lead to increased concentration, and/or low flows lead to lower concentrations. Moreover, the slope is the percent increase in contaminant load induced by 1% increase in flow depth.
For snowmelt, results showed no difference in the effect of flow on NO3-N loads between periods as evidenced by similar slopes (t = 0.16, P = 0.8746) and intercepts (t = 0.20, P = 0.8467). Across both periods, the slope was β1 = 0.801 ± 0.45. Given this high variability, the slope for snowmelt was not different from 1, indicating that NO3-N load was proportional to flow depth in spring snowmelt.
The lower slope and intercept of the log NO3-N load vs. log flow rate line for the fertigation period is evidence of a water quality benefit of the fertigation treatment. The lower intercept for the fertigation period indicates lower NO3-N loads when the natural-log flow depth was 0, which corresponds to a weekly flow depth of 10 mm. The back transformed intercept values were 5.9 kg NO3-N ha−1 for injection and 4.7 kg NO3-N ha−1 for fertigation, a reduction of 20%. Furthermore, the slope was lower during fertigation, which indicates that the magnitude of the reduction in NO3-N load increases with increasing flow beyond 10 mm depth. However, below 10 mm flow, the magnitude of reduction is lower. For example, at a flow depth of 5 mm the average loads were 2.96 kg NO3-N ha−1 for injection and 2.43 kg NO3-N ha−1 for fertigation, a reduction of only 18%. In contrast, for a weekly flow of 25 mm flow, the magnitude of reduction was 22%, with average loads of 15.0 kg NO3-N ha−1 for injection and 11.7 kg NO3-N ha−1 for fertigation. This represents a substantial reduction in nitrate load, as there were 22 weeks that exceeded 25 mm in flow during the fertigation period. These events accounted for 74% (620 mm) of the total flow and 65% (184 kg NO3-N ha−1) of the total load during this period. Given that this represents a 22% reduction in load compared to injection, we would expect a load of 209 kg NO3-N ha−1 for a similar number of 25 mm events, or an additional 25 kg NO3-N ha−1 exported, had injection continued to be used in this field. Our analysis demonstrates that loads were lower during the fertigation period than they would have been during injection under the same meteorological and hydrological conditions.
The dilution of concentrations with increasing flow suggests that the supply of NO3-N available for leaching was reduced during fertigation relative to injection. Tomer et al. (2003) note that large flows may flush contaminants and exhibit an increased concentration, or may lead to diluted concentrations, with the outcome dependent upon location and land-use. Ghane et al. (2016) provide compelling evidence that soil N status is one such land-use characteristic that affects nitrate transport dynamics. The authors evaluated relationships between drainage and NO3-N load and reported log-log slopes of 0.99 for unfertilized and 1.07 for mineral fertilized corn fields with subsurface-drainage in central Minnesota. Our findings are similar in that a lower slope was observed when soil NO3-N concentration was lower (i.e., during fertigation). It is intuitive then, that under low soil NO3-N conditions, increases in flow would cause reduced nitrate-N concentrations in drainage as the soil N supply is leached from the profile and becomes increasingly limiting. In contrast, with higher available soil N, the supply of nitrate-N for leachate is not readily exhausted, and increases in flow can result in consistent or increasing nitrate concentrations in drainage.
Despite the water quality benefit, it is important to note that fertigation may increase the risk of N-loss via other pathways. Research has shown that surface-broadcast of liquid manure results in higher losses of N via ammonia volatilization than manure injection, primarily due to lack of soil incorporation with surface methods (Sommer and Hutchings, 2001; Duncan et al., 2017). Dilution of the slurry with an equal part well-water results in rapid percolation into the soil, which may help mitigate ammonia losses relative to other surface application methods. Denitrification is another potential N-loss pathway worth exploring. Previous research has shown that manure injection can increase cumulative N2O emissions by 84–152% relative to manure broadcast (Duncan et al., 2017), especially for spring manure applications. However, soil saturation during fertigation may increase N2O emissions relative to other surface application methods. These potential tradeoffs among N-loss pathways associated with switching to fertigation of manure require further exploration.
Effects of Manure Rate and Time on Drainage Nitrate Concentrations
Our hypothesis was that water samples collected following high rates of manure N application would exhibit higher concentrations than those following lower application rates. Further, we hypothesized that concentrations would remain higher over time following high application rates. Regression analysis indicated that the N rate of the most recent manure application (t = 1.49, P = 0.1383) and the weeks since manure application (t = 1.77, P = 0.0787) had no discernible effect on weekly FWM NO3-N concentrations. We can, therefore, reject our hypotheses regarding the effects of manure N rate and time-since-manure-application on weekly nitrate concentrations. Even when manure rates were relatively low, nitrate concentrations in drainage remained high. This likely occurred because of the cumulative loading effect of repeated high-rate manure applications over the first four years of the study, and resulting carry-over of soil N from year to year.
During the first four years of the study, 345-444 kg total N ha−1 yr−1 were added to the soil N pool in manure, of which 107–147 kg N ha−1 yr−1 was organic N. Slow mineralization of this pool, along with that in SOM, surely contributed to the lack of decline in nitrate concentrations in the weeks following manure application. Furthermore, carry over of organic N into the fertigation years is likely why we observed high nitrate concentrations during 2010 and 2011, despite lower manure rates. So-called “legacy N” can persist in soils for years or even decades (Van Meter et al., 2016). However, decreasing NO3-N concentrations over time suggest that soil N loading was gradually decreasing in response to reduced application rates.
Crop Yield and N Removal
Crop yield ranged from 10.6 to 21.2 Mg ha−1 yr−1 (Table 4) and was similar between periods (F = 0.29, P = 0.593), with mean yields of 18.9 and 18.6 Mg DM ha−1 during the injection and fertigation periods, respectively. In contrast, crop %N and total N removal (kg ha−1) were greater during the fertigation than injection period. Following conversion to fertigation, silage corn N at harvest increased from 1.07 to 1.23% (F = 35.5, P < 0.0001), which corresponded to an increase in N removal from 205 to 230 kg N ha−1 yr−1 (F = 6.32, P = 0.0133). This resulted in greater MNUE during fertigation (μ = 1.20 kg/kg) than injection (0.53 kg/kg, F = 68.28, P < 0.0001).
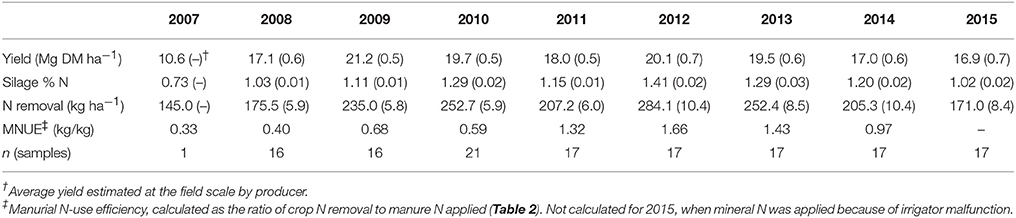
Table 4. Silage corn yield, nitrogen concentration, and nitrogen removal at the study site. Means are presented followed by standard errors.
Although there was no difference in yields between periods, data suggest that yields were beginning to decline slightly by 2014 and 2015, down to approximately 17 Mg ha−1. Manure rates had been dramatically reduced since 2010, perhaps too much so. Crop MNUE was greater than 1 during much of the fertigation period, suggesting that the crop was mining additional N from the soil. Over time, a slight increase in the manure rates may be required to maintain crop nutrition and yield with fertigation, though tradeoffs with water quality should be closely monitored.
Summary and Conclusions
Switching from fall injection to summer fertigation allowed this producer to reduce manure N rates, thereby reducing tile NO3-N concentrations and loads, without impacting corn silage yield. Greater flows were observed during the fertigation period than the injection period because of increased precipitation and irrigation. This resulted in similar weekly NO3-N loads between periods, but over time resulted in decreases in annual loads, due to lower nitrate-N concentrations in tile drainage during fertigation.
Analysis of NO3-N flow dynamics suggested that the change in concentrations between periods was not solely a result of dilution, but also a treatment effect of fertigation, independent of flow effects. The treatment effect was the result of a combination of factors. Manure N rates were reduced during fertigation, which undoubtedly helped reduce losses, but the timing and placement of manure N was also important. Crop N uptake and MNUE were greater during fertigation than injection, which suggests that summer fertigation is a more efficient means of delivering N to the crop. This greater utilization, in turn, enables lower manure application rates and results in reduced N losses in drainage.
Results from the soil analyses support these findings. Spring soil NO3-N concentrations were lower at most depths during fertigation than injection. Lower spring soil concentrations should result in lower growing season N losses in drainage, which we observed here. Fall residual soil NO3-N concentrations were also reduced at deeper soil increments with fertigation relative to injection. This suggests that less NO3-N percolated below the crop root zone into drainage tile under fertigation.
Manure N rate and time since manure application had no discernible effect on weekly NO3-N concentrations, most likely due to the cumulative soil N loading effect of repeated manure applications prior to the study. However, decreasing drainage NO3-N concentrations over time suggest that soil N loading was decreasing in response to reduced application rates.
Fertigation requires specialized equipment to pump manure from storage lagoons to the irrigators, as well as the ability to screen solids from the manure slurry to prevent clogging of irrigator nozzles. These and additional economic and technological factors will likely influence producer decisions regarding the suitability of summer fertigation for their operations. However, with increasing awareness of the downstream effects of nitrate pollution, many producers are seeking solutions to NO3-N loss on their farms. We have demonstrated here that summer fertigation reduced NO3-N losses from an irrigated summer-annual cropping system in the US Midwest. Despite this reduction, NO3-N concentrations in the drainage water remained high relative to environmental quality standards. More research is needed to determine if drainage NO3-N concentrations from fertigated silage corn can be further reduced to acceptable levels without impacting silage yield. Additional consideration should be given to potential tradeoffs related to crop injury, crop disease prevalence, risk of pathogen transport to waterways, and alternative N loss pathways with fertigation relative to injection of dairy slurry.
Disclaimer
Mention of trade names or commercial products in this publication is solely for the purpose of providing specific information and does not imply recommendation or endorsement by the U.S. Department of Agriculture. USDA is an equal opportunity provider and employer.
Author Contributions
JB, SP, CW, and GF conceived the experiments. JB, SP, and GF designed the experiments. GF, JB, CW, and SP performed the experiments. JG analyzed the data and wrote the manuscript in consultation with GF, SP, JB, and CW.
Funding
Funding was provided by USDA-ARS through the St. Paul, Minnesota, and Morris, Minnesota, locations.
Conflict of Interest Statement
The authors declare that the research was conducted in the absence of any commercial or financial relationships that could be construed as a potential conflict of interest.
Acknowledgments
The authors thank the operators of the cooperating dairy farm for allowing us field access for sample collection and for performing agronomic management during the study. We also thank Todd Schumacher and William Breiter, USDA-ARS, St. Paul, Minnesota; Steve Wagner, USDA-ARS, Morris, Minnesota; David Schneider, USDA-ARS Brookings, South Dakota; and Eric Krueger, Oklahoma State University.
References
Bremner, J., and Mulvaney, C. (1982). “Nitrogen—total,” in Methods of Soil Analysis. Part 2. No. 2, eds A. L. Page, R. H. Miller, and D. R. Keaney (Madison, WI: American Society of Agronomy). Available online at: https://dl.sciencesocieties.org/publications/books/abstracts/agronomymonogra/methodsofsoilan2/595 [Accessed December 21, 2016].
Camargo, J. A., and Alonso, Á. (2006). Ecological and toxicological effects of inorganic nitrogen pollution in aquatic ecosystems: a global assessment. Environ. Int. 32, 831–849. doi: 10.1016/j.envint.2006.05.002
Camargo, J. A., Alonso, A., and Salamanca, A. (2005). Nitrate toxicity to aquatic animals: a review with new data for freshwater invertebrates. Chemosphere 58, 1255–1267. doi: 10.1016/j.chemosphere.2004.10.044
Chaudhary, M. R., and Prihar, S. S. (1974). Root development and growth response of corn following mulching, cultivation, or interrow compaction. Agron. J. 66, 350–355. doi: 10.2134/agronj1974.00021962006600030004x
Clesceri, L. S., Greenburg, A., and Eaton, D. A. (1998). Standard Methods for the Examination of Water and Wastewater. 20th Edn. Washington, DC: American Public Health Association.
David, M. B., Drinkwater, L. E., and McIsaac, G. F. (2010). Sources of nitrate yields in the Mississippi River Basin. J. Environ. Qual. 39, 1657-1667. doi: 10.2134/jeq2010.0115
Duncan, E. W., Dell, C. J., Kleinman, P. J. A., and Beegle, D. B. (2017). Nitrous oxide and ammonia emissions from injected and broadcast-applied dairy slurry. J. Environ. Qual. 46, 36-44. doi: 10.2134/jeq2016.05.0171
Feyereisen, G. W., Francesconi, W., Smith, D. R., Papiernik, S. K., Krueger, E. S., and Wente, C. D. (2015). Effect of replacing surface inlets with blind or gravel inlets on sediment and phosphorus subsurface drainage losses. J. Environ. Qual. 44, 594–604. doi: 10.2134/jeq2014.05.0219
Gamble, J. D., Feyereisen, G. W., Papiernik, S. K., Wente, C. D., and Baker, J. M. (2017). Regression-kriged soil organic carbon stock changes in manured corn silage–alfalfa production systems. Soil Sci. Soc. Am. J. 81, 1557–1566. doi: 10.2136/sssaj2017.04.0138
Ghane, E., Ranaivoson, A. Z., Feyereisen, G. W., Rosen, C. J., and Moncrief, J. F. (2016). Comparison of contaminant transport in agricultural drainage water and urban stormwater runoff. PLoS ONE 11:e0167834. doi: 10.1371/journal.pone.0167834
Harmel, R. D., and King, K. W. (2005). Uncertainty in measured sediment and nutrient flux in runoff from small agricultural watersheds. Trans. ASABE. 48, 1713–1722. doi: 10.13031/2013.20005
Krueger, E. S., Baker, J. M., Ochsner, T. E., Wente, C. D., Feyereisen, G. W., and Reicosky, D. C. (2013). On-farm environmental assessment of corn silage production systems receiving liquid dairy manure. J. Soil Water Conserv. 68, 438–449. doi: 10.2489/jswc.68.6.438
Magdoff, F. (1991). Understanding the Magdoff pre-sidedress nitrate test for corn. J. Prod. Agric. 4, 297–305. doi: 10.2134/jpa1991.0297
Magdoff, F., Lanyon, L., and Liebhardt, B. (1997). Nutrient cycling, transformations, and flows: implications for a more sustainable agriculture. Adv. Agron. 60, 1–73. doi: 10.1016/S0065-2113(08)60600-8
MPCA (2014). The Minnesota Nutrient Reduction Strategy. St. Paul, MN: Minnesota Pollution Control Agency.
Muñoz, G. R., Powell, J. M., and Kelling, K. A. (2003). Nitrogen budget and soil N dynamics after multiple applications of unlabeled or (15)Nitrogen-enriched dairy manure. Soil Sci. Soc. Am. J. 67, 817–825. doi: 10.2136/sssaj2003.0817
Pinheiro, J., Bates, D., DebRoy, S., and Sarkar, D. (2013). Nlme: Linear and Nonlinear Mixed Effects Models. R Packag. Version 3.1-111.
Ramsey, F. L., and Schafer, D. W. (2013). The Statistical Sleuth : A Course in Methods of Data Analysis. 3rd Edn. Boston, MA: Brooks/Cole, Cengage Learning.
Randall, G. W., and Mulla, D. J. (2001). Nitrate nitrogen in surface waters as influenced by climatic conditions and agricultural practices. J. Environ. Qual. 30, 337. doi: 10.2134/jeq2001.302337x
R Core Team (2016). R: A Language and Environment for Statistical Computing. Vienna: R Foundation for Statistical Computing. Available online at: http://www.R-project.org/
Smith, D. R., and Livingston, S. J. (2013). Managing farmed closed depressional areas using blind inlets to minimize phosphorus and nitrogen losses. Soil Use Manag. 29, 103–113. doi: 10.1111/j.1475-2743.2012.00441.x
Sommer, S. G., and Hutchings, N. J. (2001). Ammonia emission from field applied manure and its reduction - invited paper. Eur. J. Agron. 15, 1–15. doi: 10.1016/S1161-0301(01)00112-5
Spooner, J., Maas, R., Dressing, S., Smole, M., and Humenik, F. (1985). “Appropriate designs for documenting water quality improvements from agricultural NPS control programs,” in Perspectives on Nonpoint Source Pollution. Kansas City, MO: EPA. 440/5-85-001.
Tarkalson, D. D., Payero, J. O., Ensley, S. M., and Shapiro, C. A. (2006). Nitrate accumulation and movement under deficit irrigation in soil receiving cattle manure and commercial fertilizer. Agric. Water Manag. 85, 201–210. doi: 10.1016/j.agwat.2006.04.005
Tomer, M. D., Meek, D. W., Jaynes, D. B., and Hatfield, J. L. (2003). Evaluation of nitrate nitrogen fluxes from a tile-drained watershed in central Iowa. J. Environ. Qual. 32, 642–653. doi: 10.2134/jeq2003.6420
USDA-NASS (2014). United States Department of Agriculture, National Agricultural Statistics Service. Washington, DC.
Keywords: dairy manure, nitrate losses, soil nitrate, manure injection, fertigation, subsurface drainage, irrigation
Citation: Gamble JD, Feyereisen GW, Papiernik SK, Wente CD and Baker JM (2018) Summer Fertigation of Dairy Slurry Reduces Soil Nitrate Concentrations and Subsurface Drainage Nitrate Losses Compared to Fall Injection. Front. Sustain. Food Syst. 2:15. doi: 10.3389/fsufs.2018.00015
Received: 31 January 2018; Accepted: 23 April 2018;
Published: 15 May 2018.
Edited by:
Claudia Wagner-Riddle, University of Guelph, CanadaReviewed by:
Jeff John Schoenau, University of Saskatchewan, CanadaAicam Laacouri, University of Minnesota, United States
Copyright © 2018 Gamble, Feyereisen, Papiernik, Wente and Baker. This is an open-access article distributed under the terms of the Creative Commons Attribution License (CC BY). The use, distribution or reproduction in other forums is permitted, provided the original author(s) and the copyright owner are credited and that the original publication in this journal is cited, in accordance with accepted academic practice. No use, distribution or reproduction is permitted which does not comply with these terms.
*Correspondence: Gary W. Feyereisen, Z2FyeS5mZXllcmVpc2VuQGFycy51c2RhLmdvdg==