 Usman Akram
 Geneviève S. Metson
 Nils-Hassan Quttineh
 Uno Wennergren
- 1Theoretical Biology, Department of Physics, Chemistry and Biology, Linköping University, Linköping, Sweden
- 2Center for Climate Science and Policy Research, Linköping University, Linköping, Sweden
- 3Department of Mathematics/Optimization, Linköping University, Linköping, Sweden
Achieving food security will require closing yield gaps in many regions, including Pakistan. Although fertilizer subsidies have facilitated increased nitrogen (N) application rates, many staple crop yields have yet to reach their maximum potential. Considering that current animal manure and human excreta (bio-supply) recycling rates are low, there is substantial potential to increase the reuse of nutrients in bio-supply. We quantified 2010 crop N, phosphorus (P), and potassium (K) needs along with bio-supply nutrient availability for Pakistani districts, and compared these values to synthetic fertilizer use and costs. We found that synthetic fertilizer use combined with low bio-supply recycling resulted in a substantial gap between nutrient supply and P and K crop needs, which would cost 3 billion USD to fill with synthetic fertilizers. If all bio-supply was recycled, it could eliminate K synthetic fertilizer needs and decrease N synthetic fertilizer needs to 43% of what was purchased in 2010. Under a full recycling scenario, farmers would still require an additional 0.28 million tons of synthetic P fertilizers, costing 2.77 billion USD. However, it may not be prohibitively expensive to correct P deficiencies. Pakistan already spends this amount of money on fertilizers. If funds used for synthetic N were reallocated to synthetic P purchases in a full bio-supply recycling scenario, crop needs could be met. Most recycling could happen within districts, with only 6% of bio-supply requiring between-district transport when optimized to meet national N crop needs. Increased recycling in Pakistan could be a viable way to decrease yield gaps.
Introduction
Meeting the United Nations Second Sustainable Development Goal to “end hunger, achieve food security and improved nutrition and promote sustainable agriculture”1 will require increasing crop yields in many regions. Eleven percent of people currently suffer from undernourishment, and this figure could substantially increase given that population growth is mostly happening in regions where hunger is already prevalent (FAO, 2015). Precarious food security has many causes (Barrett, 2010; Godfray et al., 2010), but areas with low food security also tend to have yield gaps - the difference between maximum potential yield and the yield actually obtained by farmers. For example, Pakistan ranks 77th on the global food security index with 22% of its population undernourished (EIU, 2014). Current wheat yields, a staple crop for the country, are often less than half of what could be harvested given climatic conditions (currently 2.5–3 tons per ha while 6 tons per ha is expected; Prikhodko and Zrilyi, 2013). Closing global yield gaps through better nutrient and water management would go a long way to meet food security goals (Mueller et al., 2013), within a multi-pronged approach (e.g., reducing waste, changing diets, expanding agriculture; Godfray et al., 2010). In fact, closing yield gaps on irrigated and rain-fed land alone could boost globally available calories by 80% (Pradhan et al., 2015). Still, any approach to increase food security, including increasing yields, will have to account for constrained resource availability and increased ecosystem sensitivity to change, notably those associated with essential nutrients (Dawson and Hilton, 2011; Foley et al., 2011).
It is imperative that society find sustainable ways to increase access to essential nutrients, notably nitrogen (N), phosphorus (P), and potassium (K) because inadequate amounts of these nutrients are often a leading cause of yield gaps (Jones et al., 2013; Tittonell and Giller, 2013). Without regular inputs, crops deplete soil nutrient stocks, thereby limiting crop yields. Accessing sufficient synthetic fertilizers is often difficult for farmers in developing countries because of a lack of purchasing power. Although low purchasing power can be linked to low income, when it comes to fertilizers, it can also be linked to high farm-gate fertilizer prices. In fact, prices in many developing counties are higher than in North America or Europe due to additional middle-men and transport costs (e.g., with P; Cordell et al., 2015). In Pakistan, the N fertilizer application rates have increased much faster than for P or K, as the latter two are often considered expensive imports (Solaiman and Ahmed, 2006). Because the majority of agricultural soils in Pakistan are deficient in all three macro-nutrients, the addition of N has increased yields; but yield gaps persist because of remaining P and K limitations (Solaiman and Ahmed, 2006). Such yield limitations (in addition to issues around land availability and ownership) create a poverty trap: Pakistani farmers continue to have low incomes, and thus low purchasing power, and cannot gain access to the combination of nutrients that would allow them to increase their yields.
Recycling high-nutrient organic wastes back into crop production can help reduce yield gaps by meeting crop nutrient needs (van Noordwijk and Brussaard, 2014). In Pakistan, only 50% of animal excreta is collected, where half of the collected waste is used as fuel to heat cooking stoves, leaving the other half for likely reuse in crop production (i.e., 25% of all manure being reused in agriculture; FAO, 2004). In addition, 26% of domestic vegetable production in cities is irrigated with municipal wastewater, which also recycles some nutrients from human excreta at the same time (Ensink et al., 2004). As such, there is still unutilized potential for recycling high nutrient organic waste such as animal manures and human excreta (which we call bio-supply throughout this paper) and meet crop nutrient needs in Pakistan. Here we aim to get a better understanding of the quantitative and logistic potential for nutrient recycling across the country. We ask:
1. What is the national need for N, P, and K to achieve maximum crop yields in 2010?
2. What is the gap between crop needs and 2010 synthetic fertilizer and bio-supply use?
3. How much of 2010 crop needs could be met with complete recycling of bio-supply at national and district levels?
We calculate crop nutrient needs, bio-supply, and transport distances in tons and km, but also in monetary values to estimate the value of bio-supply as synthetic fertilizer as well as transport costs through future scenarios.
Methods
Study Area
Pakistan is divided into 150 districts (PBS, 2017a). Districts are the highest tiers of local government in Pakistani provinces and represent a crucial part of governance (Commonwealth Local Government Forum, 2015). District governments deliver a large proportion of public services related to education, healthcare, roads, environmental protection, and local economic development, including agricultural development. They also work closely with municipalities on issues related to water and sanitation, and waste collection and disposal (Commonwealth Local Government Forum, 2015). Their important role at the junction between agriculture, waste, and infrastructure makes them an appropriate scale to start examining the potential of nutrient recycling. Districts vary drastically in size and governed population; from 182 km2 (FR Lakki Marwat) to 44,527 km2 (Chaghi) and population between 26,000 people (FR Lakki Marwat) to 11 million [Lahore (PBS, 2017b)]. We were able to obtain data for 124 districts for the year 2010 (Figure 1).
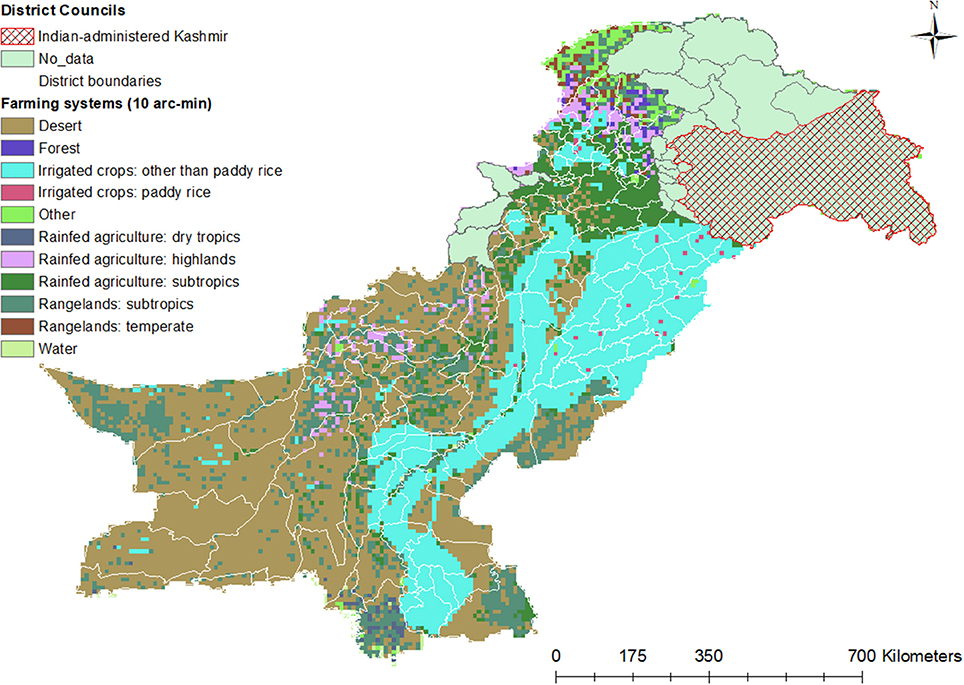
Figure 1. Pakistan's major land uses (FAO, 2012) and district boundaries (University of California, 2015). Due to lack of data some districts were excluded from the study (light green and checkered (Kashmir) area). Colors represent major land uses and farming systems.
Across these districts, a wide range of agro-climatic conditions have created distinct farming systems (Figure 1). These farming systems, and their location, are important in understanding the magnitude and location of nutrient needs and supply across the 39.49% of Pakistan's area which is used as arable land (FAO, 2013). These farming systems can be broadly classified into three categories (Byerlee and Husain, 1993): (1) Irrigated plains, which fall along major river banks in the central-eastern part of the country and where farmers cultivate wheat, rice, and cotton; (2) Rainfed plains (subtropics) in the north-western region where farmers cultivate wheat and pulses; and (3) Nomadic systems in the south-western region which consist mostly of rangeland for animal production (Byerlee and Husain, 1993; Afzal and Naqvi, 2004; FAO, 2012). Except for nomadic sheep, goats, and camels, livestock production (most importantly cattle and buffalo) is closely integrated with crop production (Afzal and Naqvi, 2004).
Data Collection and Processing
Overview
To quantify the potential of bio-supply to meet crop nutrient needs, and potentially enhance food security, we used district-level data to calculate nutrient balances (Equation 3, 4) and estimated transport distances to correct nutrient imbalances. We calculated the annual 2010 bio-supply of N, P, and K for each district as livestock manure and human excreta (Equation 1), as well as crop nutrient needs according to fertilizer recommendations (Equation 2). Based on these bio-supply and crop need estimates, we were able to determine if a district had a net surplus or deficit for each nutrient, represent these balances spatially, and approximate transport distances for surplus nutrients to fill deficits in other districts. We also summed district nutrient estimates to look at national scale bio-supply, crop needs, surplus and deficit, and compare the availability of bio-supply to synthetic fertilizer use.
Below we present the equations, data sources, and assumptions we used in more detail (including summaries of each parameter presented in Table 1).
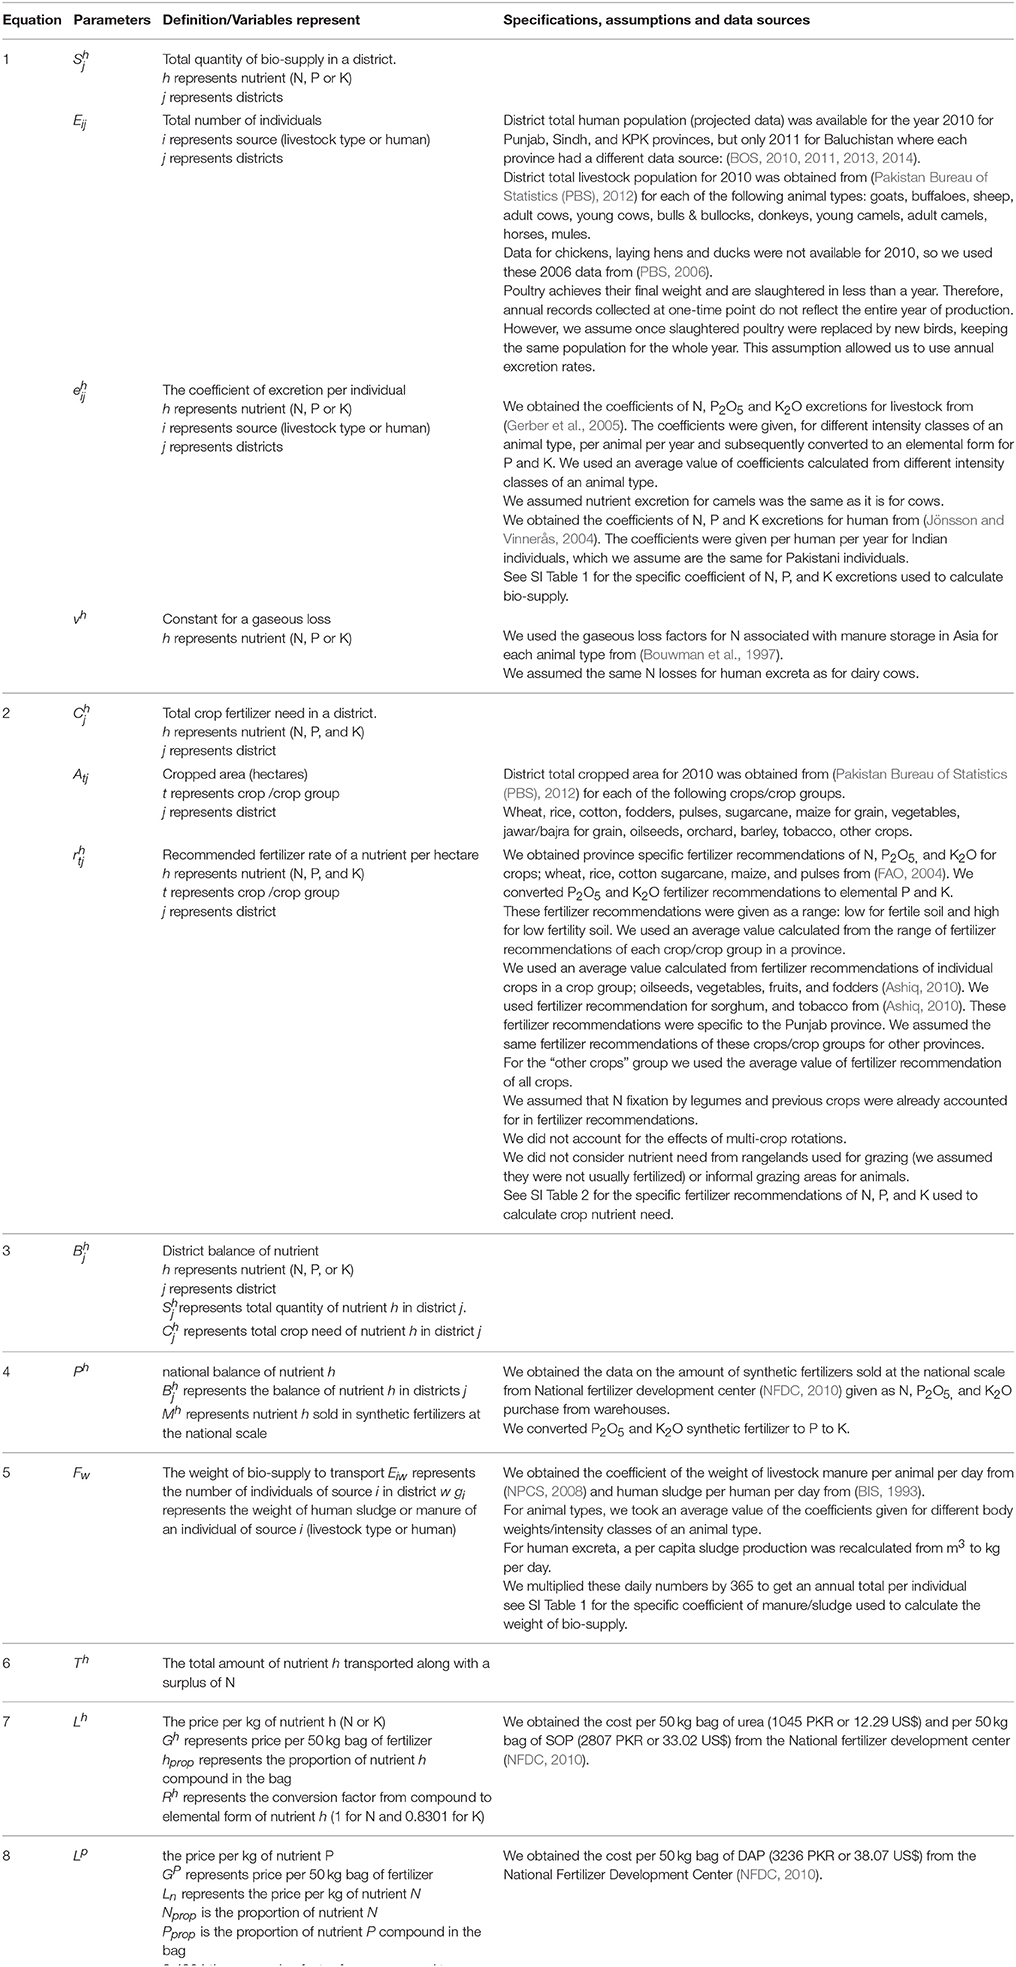
Table 1. Equations' parameters, specifications, assumptions, and data sources used for nutrient balance calculations.
Nutrient Balance Calculations
Bio-supply was calculated by summing the manure of different animals and human excreta present in each district:
where is the total quantity of nutrient supply in district j, where h represents the nutrient (N, P, or K). Eij represents the number of individuals of waste source i in district j (PBS, 2006; BOS, 2010, 2011, 2013, 2014; Pakistan Bureau of Statistics (PBS), 2012), and n is the total number of sources (n = 15 with humans and 14 different animals), represents the coefficient of nutrient excretion in kg per individual per year (see SI Table 1 for the nutrient excretion coefficients, where we selected the average value of different animal intensity classes Jönsson and Vinnerås, 2004; Gerber et al., 2005), vN represents the gaseous loss of N during storage (Bouwman et al., 1997), while vP and vK both are zero. For the national estimate, we summed over all districts.
Crop nutrient needs of a district was calculated summing up the nutrient needs of all crops, where for each crop we multiplied the area under production for a crop type by the fertilizer recommendation for that crop type:
where, is the total crop nutrient need in district j for nutrient h, Atj represents the area in hectares of a crop or crop group t within district j (Pakistan Bureau of Statistics (PBS), 2012), represents the recommended fertilizer application rate in kilograms of nutrient h for a hectare of crop or crop group t within district j (FAO, 2004; Ashiq, 2010). Although past studies have often used crop uptake or harvested nutrients as a proxy for crop nutrient need (Gerber et al., 2005), here we opt to use fertilizer recommendations since yield gaps are large in Pakistan. Using harvest multiplied by nutrient content gives information only on nutrient requirements to keep the system at status quo, which works well in systems where maximum yields have been attained, soils are nutrient rich, or have had a history of over fertilization (Bouwman et al., 2017). This metric however would be an inaccurate way of determining how bio-supply recycling could help close yield gaps. Fertilizer recommendation rates on the other hand are designed to help achieve maximum yields and as such are a better metric for this study (see SI Table 2 for recommended rates, where we selected the average of the given range for each nutrient for each crop or crop group). For the national estimate, we summed over all districts.
We used a simple mass balance approach, as described by Himmeblau (1967), to compare the magnitude of supply (N, P, and K quantities in manure and human excreta) and crop nutrient needs in each district according to Equations 1, 2:
This mass balance approach is commonly used to calculate potential nutrient surpluses and deficits at farm, region, national and global scales (Bindraban et al., 2000; Granstedt et al., 2004; MacDonald et al., 2012; Metson et al., 2016).
where is the district nutrient balance of nutrient h (N, P or K) in district j, is the total quantity of bio-supply of nutrient h in district j (Equation 1), and is the total crop need of nutrient h in district j (Equation 2). For the national estimate, we summed over all districts.
We did not consider synthetic fertilizer application at the district scale as this information was not available for all districts, and because our study focuses on how bio-supply can meet crop needs. Instead, we summed district-scale balances and added the data on synthetic fertilizer sales at the national scale:
where Ph is Pakistan's national gap/surplus to crop needs of nutrient h given 100% recycling, and Mh represents the national synthetic fertilizer sales h (NFDC, 2010), where P2O5, and K2O were converted to their elemental form (Equations 9, 10).
Transport Distance Calculations and Cost Estimates
To be able to estimate transport costs we must determine the distances among all districts as well as the weight of district bio-supply surpluses which require transportation. The weights can partly be derived from the previous calculations (Equations 1, 4). To define a surplus district in the context of transportation, we chose N balances over P or K because it is the only nutrient that had a national surplus when accounting for both synthetic fertilizer use and bio-supply, and thus purchases could be reduced through increased bio-supply recycling. In order to convert surplus N to transport weight, we multiply the surplus N value by a weighted average of the N content per ton of bio-supply conversion based on the average mix of animal and human excreta for each district (Equation 6).
To find transportation distances, we model and solve a well-known optimization problem, the Transportation Problem, first formulated and described by Hitchcock (1941). This optimization model can be used to calculate the total minimum distance required to transport all surplus bio-supply from surplus districts to meet the nutrient needs of deficit districts, as well as the costs associated with such transport. To be able to determine transport distances, we first represent the nutrient budgets spatially. We use ArcMap 10.3.1 to merge district nutrient balance values to district areas (University of California, 2015), and then calculate the distance awy between centroids (center) of the districts where w and y are districts (wϵQ and yϵD). In the optimization problem (Equations 6, 7), we let set Q represent all supply districts (those districts j where ), and set D represent all districts with deficits in N (those districts j where ). We calculate the surplus weights as:
Where Fw represents the weight of surplus of N bio-supply in tons of district w (wϵQ). The coefficient gi is the weight of human or animal excreta from an individual of source i (BIS, 1993; NPCS, 2008; livestock type or human). Eiw represents the number of individuals of source i in district w. It is not possible to meet all crop N needs with bio-supply. Therefore, we want all N surpluses to be redistributed among deficit districts.
We let xwy represent the amount of N (in tons) to be sent from district w to district y, noting that all surplus of a district w is distributed hence . Parameter ow is the concentration (the amount of N in each ton of manure ) for each surplus district w. The optimization problem can now be stated as:
where u is the unit cost for transportation of manure and sludge, 0.02 US$ per ton and km (World Bank, 2008), f is distance factor to approximate the actual road distances given the Euclidian distance between districts (we used 1.33 Gonçalves et al., 2014). Further, parameter is the N surplus (in tons) for each district w ∈ Q and is N crop needs (in tons) for each district y ∈ D. Constraint (7.1) makes sure that the total amount of N sent to a district is less than or equal to its needs. Constraint (7.2) makes sure that the total amount of N sent from a district is equal to its surplus. Constraint (7.3) is to ensure non-negative values throughout. The solution to the problem is thereby the total transport cost in USD according to the right-hand side of Equation 7. The model is implemented in AMPL (see Fourer et al., 2003), and we make use of the commercial solver cplex (ILOG Inc. ILOG CPLEX, 2012).
To calculate P and K nutrients in the bio-supply transported along with N (Equation 8), we can use the previous equations to recalculate new district nutrient balances (Equations 1, 4).
where Th is the total amount of nutrient h transported along with a surplus of N.
Scenarios and Cost Calculations
We construct a few simple scenarios and cost estimates to answer our research questions and put our findings into perspective. First, we report national nutrient surplus and deficit if all bio-supply and synthetic fertilizers are used. Second, we assume that real-world practices in 2010 would be closer to a scenario where, in addition to synthetic fertilizers, 25% of bio-supply is recycled (animal manure FAO, 2004 and human waste Ensink et al., 2004 if rural and urban populations behave similarly). Together these two scenarios give us an idea of (1) the cost of meeting all crop needs with synthetic fertilizer-based 2010 prices in Pakistan; (2) the monetary value of bio-supply nutrients if they replace synthetic fertilizers; and (3) how much of this potential bio-supply monetary value was likely used in 2010. Synthetic fertilizer is usually purchased as 50 kg bags of urea, diammonium phosphate (DAP) and sulfate of potash (SOP), and we calculate the per kg price of elemental nutrient for N and K using Equation 9 and for P using Equation 10:
where Lh represents the price per kg of nutrient h, Gh represents the 2010 price per 50kg bag of fertilizer containing h (for N - urea, for K - SOP; NFDC, 2010), hprop is the proportion of nutrient h compound in the bag and Rh represents the conversion factor from compound to elemental form, i.e., 1 for N in Urea and 0.8301 for K2O in SOP:
where LP is the price per kg of P. GP represents the 2010 price per 50 kg bag of DAP (NFDC, 2010), LN represents price per kg of nutrient N (calculated in Equation 7), Nprop represents the proportion of N in the fertilizer bag, and Pprop represents the proportion of P2O5, and where 0.4364 is the constant to convert P2O5 to P. In other words, a bag of DAP contains 18% N and 46% P2O5 and to calculate the price of elemental P in Equation 10, we deduct the price of N (calculated in Equation 9).
Based on these monetary estimates, we construct a scenario where all bio-supply was used to meet crop nutrient needs first and then supplemented with synthetic fertilizers. We compare 2010 synthetic fertilizer expenditures to what would be needed under this future 100% recycling scenario. Finally, we create a scenario, using the optimization model in Equation 7, where surplus bio-supply is transported based on district N surpluses and deficits. Here, in addition to looking at distances, we compare the cost of transport, right-hand side of Equation 7, to the monetary value (cost) of nutrient transported if purchased as synthetic fertilizers. We subtract any fertilizer value from any over-application of P and K associated with this transportation model to provide a conservative estimate of the transported bio-supply nutrient value. These costs estimates act as a first-order approximation of the economic feasibility of recycling.
Results
In 2010, Pakistan had a surplus of N and K, but a deficit of P at the national level (Figure 2). Total crop nutrient needs, based on fertilizer recommendations, represented 3.1 million tons of N and 1.1 million tons of P and K each (Table 2). Wheat, cotton, and rice together comprised 76% of N needs, and a similarly large fraction of P and K needs (57% for P and 77% for K) while fodder crops were 15% of total P needs (SI Table 3). 2010 synthetic fertilizer use could meet 99 % of N, 31% of P, and 2% of K needs (Table 2). These 3.4 million tons of synthetic fertilizer cost approximately 2.8 billion USD and 90% of it was N (Figure 2 and Table 2). Surpluses of N and K only occur at the national scale when we assumed both synthetic fertilizer use and total bio-supply recycling; under this scenario there would while still be a 26% gap between supply and crop P needs (Figure 2).
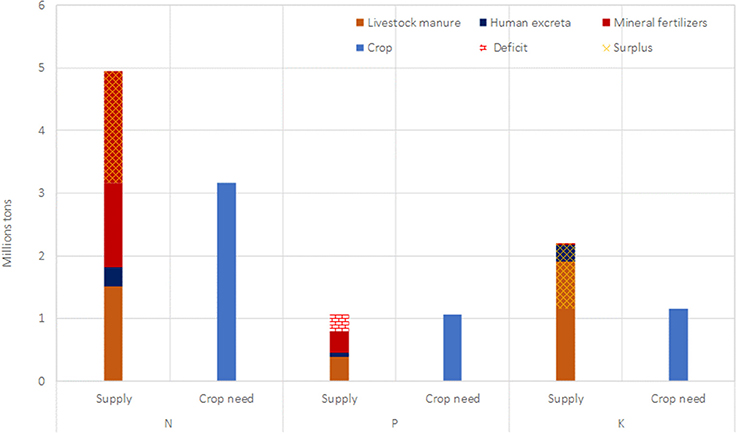
Figure 2. National scale crop nutrient need vs. nutrient supply in manure, human excreta, and mineral fertilizers in Pakistan. The supply is in a surplus of N and K crop need, while there is a P deficit.
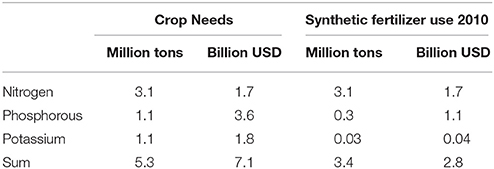
Table 2. National scale crop nutrient need and use of synthetic fertilizers in 2010 in Pakistan.
There were 4.4 million tons of available bio-supply as animal manure and human excreta, with a total NPK fertilizer value of 5.9 billion USD (Figure 2 and Table 3). Like with crop needs, bio-supply was dominated by a few species. Together, buffaloes, cows, and humans comprised 77% of N and P bio-supply, and 73% of K bio-supply (SI Table 4), where human excreta represented roughly half of the nutrients that buffalo manure contained nationally (i.e., human excreta contained 17% national N bio-supply, SI Table 4). Not all this potential value was used in 2010 however. There was a large amount, worth 4.4 billion USD, of non-utilized bio-supply across Pakistan which could have complemented or replaced synthetic fertilizer use (Table 3). The largest bio-supply monetary values were associated with P and K, which represented 4.97 billion USD together (Table 3).
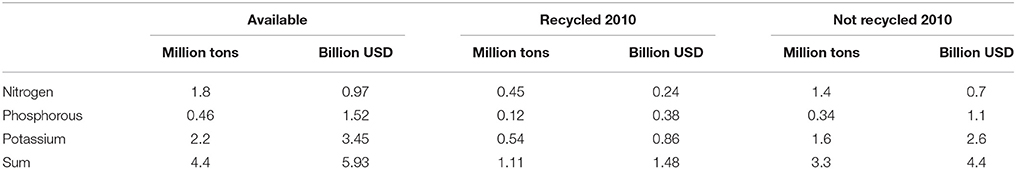
Table 3. 2010 national scale availability and current use of bio-supply.
Under 2010 practices, the largest nutrient gap was related to P, where 58% of crop needs likely remained unmet (Table 4). It would take an additional 2.07 billion USD to purchase synthetic P to fill this gap. If Pakistan were to recycle the 3.3 million tons of bio-supply that were not utilized in 2010 (Table 3), they could fully meet K crop needs and meet 57 % of N, and 43 % of P crop needs (Table 4, note that the table shows the gap to meet crop needs and not the total nutrient needs). This means that although most of 2010's fertilizer expenditures were on N, total recycling of bio-supply would require a shift toward more P fertilizer purchases to meet all three nutrient crop needs. However, this would not cost more than today's expenditures on synthetic fertilizers; this is because total bio-supply recycling would substantially reduce synthetic N fertilizer needs (Tables 2, 4).
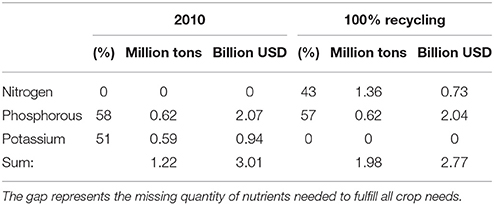
Table 4. Gap to meet crop needs at the national scale: (1) 2010 synthetic fertilizer use + 25% bio-supply recycling (2) 100% recycling of bio-supply and no synthetic fertilizers use.
Bio-supply and crop needs varied among districts, but a large proportion of crop needs could be met through within-district recycling (Figure 3 and Table 5). Indeed, most recycling could take place within districts: 94% of N, 97% of P and 53% of K (Table 5 and Figure 3). Still, when we compare district bio-supply with crop needs, we found that available K exceeded crop needs in almost all districts (only 7 districts have a deficit), N exceeded crop needs in 25% of districts, while only 18% of districts had a P surplus (SI Table 5). These excesses represented 6% of N, 3% of P, and 47% of K bio-supply (Table 5).
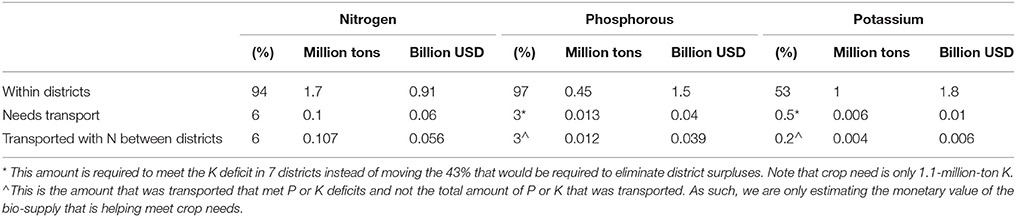
Table 5. The capacity of bio-supply to meet crop need of N, P, and K at the district level and the proportion of need that could be met by transporting surplus bio-supply between districts.
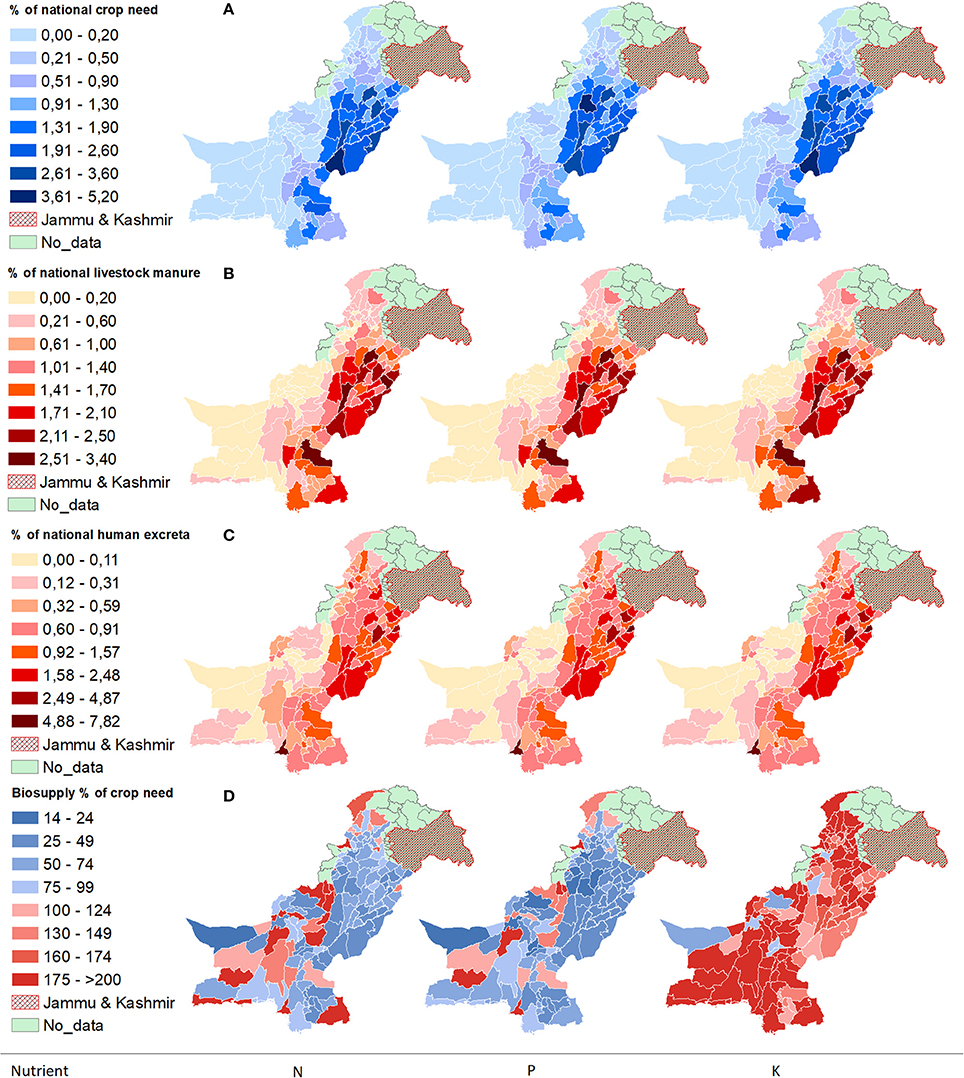
Figure 3. Spatial distribution of (A) crop nutrient need (B) nutrient supply in manure (C) nutrient supply in human excreta, and (D) nutrient balances as surplus and deficit of nutrients at the district scale in Pakistan all expressed as percentages of total supply and need.
Some of these surplus and deficit patterns overlay with differences in land use, although required transportation distances to remedy these imbalances may not be very long. As would be expected, crop needs are concentrated in the central-eastern part of the country where the majority of farmland is located (Figure 1). We observed a similar pattern for manure supply, although there is particularly high supply in a few districts (SI Table 5). More specifically, 10% of total N, P and K bio-supply as manure are located just three districts: Muzaffargarh, Sargodha, and Khairpur. Nutrients in human excreta are slightly more concentrated in the more heavily urbanized districts of Karachi, Lahore, and Faisalabad districts; which together account for 17% of bio-supply as human excreta. In some cases, utilizing the surplus of one district could fully correct the N deficit of multiple districts (SI Table 6). For example, Karachi had 21% of the national surplus of N. If transported, this surplus could eliminate 100% of N deficit in Hyderabad, Jamshoro, Tando, Muhammad Khan, and Thatta districts, which together represent 1.5% of the national deficit. The cost of transporting this N is 27% of the market value of N transported. Similarly, Lahore district had 12,000 tons of N surplus and transporting it could eliminate 80% of N deficiency in Sheikhupura district, representing 1% of the national deficit; the cost of transports is only 40% of the market value of N transported. Not all transports may be economically advantageous though. For example, although there was a 14,000-ton N-surplus in the Tharparker district, and transporting this surplus could eliminate 100% of the N deficit in Umerkot district, the cost of transportation would be roughly 1.7 times the market value of N transported.
The total transport distance for recycling bio-supply across districts was 6,795 km when optimized to meet N crop needs (SI Table 6), costing 56 million USD. This represents almost the same expenditure as for an equivalent amount of synthetic N (57 million USD). However, the transported bio-supply also contains P worth 39 million US$, and K worth 6 million US$. Including the value of all three nutrients, the cost of transports is only 56% of the corresponding synthetic fertilizer value. These values already consider that optimizing for N transport did result in some over- and under-transport of K and P. After transport, none of the districts that received excess bio-supply had K deficits, but 97% of the K transported had no fertilization value because it was in excess of district needs. In addition, two districts with K deficits remained deficient as they received no additional bio-supply with the transports optimized for N. After transport, one district retained a P surplus (of 885 tons), one new district became a surplus district (representing 2.5% of the P transported or 664 tons). Because P deficits were so common across the county, the transport of manure according to the N optimization models still could not fulfill all P needs.
Discussion
Yield Gaps
Our results are in line with other studies showing that part of Pakistan's yield gap is related to nutrient availability. 2010 synthetic N fertilizer purchases alone meet all N crop needs, which implies that bio-supply recycling would constitute over-fertilizing crops for N in some areas. However, 2010 fertilizer application and bio-supply recycling rates result in under-fertilizing for P and K (58% P-gap and 51% K-gap). This high N fertilizer use and low P and K use is confirmed by previous work (Solaiman and Ahmed, 2006). Similarly, our results support the idea that low P and K availability are contributing to the almost 50% yield gap identified for major crops in Pakistan (Prikhodko and Zrilyi, 2013; Aslam, 2016) as we find that wheat, cotton, and rice together account for over 50% of crop nutrient needs and consequently not all their needs are met under 2010 fertilization practices (SI Table 3). Nutrient related yield gaps could continue in Pakistan even with increased recycling; we found that in 2010, total potential nutrient availability exceeded N and K crop needs but there was a 26% deficiency for P even when synthetic fertilizer and all bio-supply resources were considered.
Local Recycling of Bio-Supply
Pakistan is still relatively rural, with 61% of its population living in rural areas (FAO, 2017) and still uses integrated crop and animal production systems (Afzal and Naqvi, 2004). We confirm this land use pattern in our results through the visibly low spatial separation of nutrient needs and bio-supply at the district level (i.e., recycling within a district can meet the majority of crop needs). This is quite different from many global regions where land use specialization has separated crop production from bio-supply, which continues to contribute to both yield gaps and water pollution (Bouwman et al., 2013; Jones et al., 2013). In Pakistan, the majority of bio-supply recycling could happen within districts, but there are areas of surplus and deficit (Figure 3, and Table 5) across districts that require transportation to be balanced. Only a few districts account for the majority of N surpluses, and this surplus bio-supply does not need to be transported very far. This is especially true for urban districts such as Karachi and Lahore; although human excreta contain less than a quarter of the available bio-supply nationally, they do not account for the bulk of long-distance transports required to balance nutrient bio-supply and crop needs. This speaks to the importance of rural populations in the national nutrient balance, and this must be taken into consideration when thinking about appropriate infrastructure and knowledge transfer to facilitate recycling. However, rapid urbanization in Pakistan will also be an important consideration for future scenarios.
Fertilizer Subsidies and the Cost of Recycling
We found that recycling all bio-supply could meet the majority of crop needs, but that synthetic N and P fertilizers would still be required to meet all crop needs and close nutrient related yield gaps (Table 4). It is important to put the monetary value of bio-supply, as well as potential recycling costs, into a larger perspective. Because access to nutrients is key to increasing yields in Pakistan, the government has put in place several subsidy programs that affect the use of synthetic fertilizers. N fertilizer subsidies have been in place for the last 40 years (Ali et al., 2015) which helps explain why synthetic N application rates matched crop needs in 2010. As pointed out by Solaiman and Ahmed (2006), and as our results clearly show, P and K availability on farms have lagged behind. In 2015, the government decided to remedy the lag in P fertilizer use by providing a subsidy of 190 million USD on P fertilizers (FAO, 2016). Our estimates show that under 2010 price conditions it would cost an additional 2.07 billion USD to meet P crop needs without increasing recycling. And this cost is in addition to the 1.1 billion USD farmers already spent on P fertilizers 2010. In other words, the government subsidy only helps cover 9% of the cost required to close the P crop need gap. If all bio-supply were recycled there would still be a need to purchase 2.04 billion USD worth of synthetic P fertilizers. However, recycling would substantially decrease the need for synthetic N and K fertilizers; N related expenditures could decrease from 1.7 billion to 0.73 billion USD and K from 40 million USD to zero. These savings, plus the money already spent on P fertilizer in 2010, would match the cost of required synthetic P fertilizers to meet crop needs. In other words, full bio-supply recycling and today's fertilizer subsidies would be sufficient to meet nutrient requirements. However, subsidies and expenditures on synthetic fertilizers would be better spent on P rather than on N. Of course, recycling is not free, but our estimates on the between-districts transports show that those costs are only 56% of the corresponding synthetic fertilizer value. Although these are rough estimates, they indicate that recycling could be a cheaper option than additional synthetic fertilizers purchases to reduce the gap.
In fact, increasing bio-supply recycling, even if more logistically complex than buying more synthetic fertilizers, could be part of a holistic food, energy, and water sustainability plan for Pakistan.
Food Security
Recycling organic waste has been shown to increase yields and is compatible with other sustainable nutrient management practices. For example, increased recycling through N enriched composting can be an effective way to increase wheat yields and decrease dependence on synthetic N fertilizer (Ahmad et al., 2008). Increasing crop rotations with legumes to increase N fixation, which would be compatible with organic agriculture practices and recycling, would also be a way to decrease synthetic N use (Badgley et al., 2007). Similarly, for P, recycling of waste compared to synthetic fertilizer use has less environmental costs and is in general considered more sustainable from a life cycle assessment perspective (Hörtenhuber et al., 2017). Decreasing dependence on imported synthetic fertilizers will also be important considering potential price volatility and physical availability of N, P, and K (Dawson and Hilton, 2011; Cordell and White, 2014). By increasing yields in a sustainable way, recycling could potentially contribute to higher incomes for farming communities; closing the yield gap for wheat alone for example would increase the harvest value by 7.9 billion USD (6 ton/ha as yield and the wheat price of 23,750 PKR/ton in 2010, Prikhodko and Zrilyi, 2013). Furthermore, investments in better road networks would not only facilitate recycling but also farmer access to markets.
Energy Security
Collecting organic waste for nutrient recycling can also include energy extraction (e.g., biogas production) before they are sent to meet crop needs. This is particularly relevant for Pakistan as 40% of people are still not connected to a central electricity grid, which ideally should be met by diversifying non-fossil energy sources (Khan et al., 2010). 280 MWh of electricity could be generated per day in Pakistan just by fully exploiting the biogas potential of poultry farms (Arshad et al., 2018). Extracting energy from recycled manure for fertilization purposes is also important considering that 25% of already collected manure is used as fuel for cooking (FAO, 2004). Without giving these users an energy alternative, it may be difficult to convince them to use the manure as a fertilizer. Right now, post-burning manure has lost most of their nutrient value (Negash et al., 2017) but biogas extraction instead of direct burning before recycling could help meet both energy and nutrient needs (Plugge, 2017).
Water Pollution and Other Considerations
Recycling could potentially decrease water pollution risks associated with losses from high nutrient supply areas. Although there are nutrient deficits at the national level, there is likely over-application of N synthetic fertilizers and bio-supply in some areas of the Pakistan. Concentrated areas of supply (if untreated and moved) contribute to water quality degradation, notably eutrophication and associated algal bloom and hypoxia problems (Van Drecht et al., 2009; Bouwman et al., 2013). The Indus river, which drains most of the southern half of Pakistan, had already surpassed its capacity to assimilate N and P from anthropogenic sources by 2000, where dissolved inorganic N and particulate P contribute most to loading (Liu et al., 2012), and coastal pollution related to poor wastewater treatment can be acutely seen around the coastal city of Karachi (SACEP et al., 2015). In addition, arabian Sea coastal waters, in to which the Indus drains, will be very sensitive to future nutrient loading. The size of the already existing hypoxic zone will likely increase along the coast if loading is not significantly controlled, especially with rising temperatures associated with climate change (Reed and Harrison, 2016). If investments in increased bio-supply recycling result in (1) better collection and treatment of organic waste (including wastewater treatment plants) and (2) in reduced over-application of nutrients, then these investments will contribute to higher water quality in the Indus river and the Arabian Sea. Better and more wastewater treatment plants could also help lower Pakistan's high infant mortality from diarrhea and dysentery, which are both linked to contaminated water sources (UNICEF and WHO, 2009). Because of these potent benefits across sectors, it may make sense to draw on a diversity of national department funds and international aid money to fund infrastructure investments to achieve higher bio-supply recycling. In summary, investing in recycling could facilitate routes to overcome major parts of poverty traps (Tittonell and Giller, 2013), as well as other important aspects to meet UN Sustainable Development Goals.
Limitations
Although our national analysis points to the potential benefits of increasing bio-supply recycling, more detailed analyses would be required to operationalize such potential. Here we only estimated transport costs between district movements, but we know that most recycling (and thus transport costs) will be associated with within district transport. Estimating such distances, as well as optimal routes and costs, requires a higher spatial, and system resolution analysis of bio-supply and crop needs. Similarly, although in this study we took some biophysical characteristics into consideration by looking at nationally specific fertilization rates, there are more detailed variations we have not considered. For example, variations in soil properties are particularly important as they affect the capacity of crops to access applied nutrients [e.g., Magnone et al. (2017) looking at P in Sub-Saharan Africa]. Although there are often N and P soil deficits across Pakistan soils, K is highly variable depending on bedrock material (Wakeel, 2014). Finally, recycling all bio-supply is not realistic, but more detailed spatial analyses may point out where investments would be the most cost-efficient and easy to operationalize.
Conclusion
Increasing access to food for the 22% of Pakistan's population that is undernourished (EIU, 2014) will be no small feat and thus requires a multi-pronged approach. Increasing bio-supply recycling could be beneficial in meeting such a food security goal. With full bio-supply recycling, we found that it would cost 2.8 billion USD to purchase the required N and P fertilizers to meet the missing 43 and 57 % of N and P crop needs. This is the same amount of money already spent on synthetic fertilizers but would actually meet all crop nutrient needs. As such, recycling more bio-supply could substantially decrease yield gaps while also meet other important sustainability goals related to water quality, human health, and energy availability across Pakistan.
Author Contributions
UA collected and analyzed data and contributed to the writing. GM reviewed method's design and lead the writing and framing of the study. N-HQ conducted optimization modeling and contributed to the writing. UW designed the initial study and contributed to the writing.
Conflict of Interest Statement
The authors declare that the research was conducted in the absence of any commercial or financial relationships that could be construed as a potential conflict of interest.
Acknowledgments
We are grateful to FORMAS, the Swedish research council for sustainable development, for funding this work. Grant: 992023 Wennergren. FORMAS 942-2016-69.
Supplementary Material
The Supplementary Material for this article can be found online at: https://www.frontiersin.org/articles/10.3389/fsufs.2018.00024/full#supplementary-material
Footnotes
References
Afzal, M., and Naqvi, A. N. (2004). Livestock resources of Pakistan : Present status and future trends. Q. Sci. Vis. 9, 1–14. Available online at: http://www.sciencevision.org.pk/BackIssues/Vol9/22.livestock.pdf
Ahmad, R., Naveed, M., Aslam, M., Zahir, Z. A., Arshad, M., and Jilani, G. (2008). Economizing the use of nitrogen fertilizer in wheat production through enriched compost. Renew. Agric. Food Syst. 23, 243–249. doi: 10.1017/S1742170508002299
Ali, M., Ahmad, F., Channa, H., and Davies, S. (2015). “Equilibrium Displacement Model for Fertilizer Sector of Pakistan Equilibrium Displacement Model for Fertilizer Sector of Pakistan,” in 29th International Conference of Agricultural Economists, Milan.
Arshad, M., Bano, I., Khan, N., Shahzad, M. I., Younus, M., Abbas, M., et al. (2018). Electricity generation from biogas of poultry waste: an assessment of potential and feasibility in Pakistan. Renew. Sustain. Energy Rev. 81, 1241–1246. doi: 10.1016/j.rser.2017.09.007
Ashiq, M. (2010). Punjab Main 75 Faslon Key Munafah Bakhash Kashat Kari (Profitable Cultivation of 75 Crops in Punjab). Nizamat Amoor-e-kashat kari (Agronomy), Ayub Agriculture Research Institute, Faisalabad.
Aslam, M. (2016). Agricultural productivity current scenario, constraints and future prospects in Pakistan. Sarhad J. Agric. 32, 289–303. doi: 10.17582/journal.sja/2016.32.4.289.303
Badgley, C., Moghtader, J., Quintero, E., Zakem, E., Chappell, M. J., Avilés-Vázquez, K., et al. (2007). Organic agriculture and the global food supply. Renew. Agric. Food Syst. 22, 86–108. doi: 10.1017/S1742170507001640
Barrett, C. B. (2010). Measuring food insecurity. Science 327, 825–828. doi: 10.1126/science.1182768
Bindraban, P. S., Stoorvogel, J. J., Jansen, D. M., Vlaming, J., and Groot, J. J. R. (2000). Land quality indicators for sustainable land management: proposed method for yield gap and soil nutrient balance. Agric. Ecosyst. Environ. 81, 103–112. doi: 10.1016/S0167-8809(00)00184-5
BIS (1993). Code Of Practice For Installation Of Septic Tanks. Manak bhavan. 9 bahadur shah zafar marg new delhi 110002. Available online at: https://ia801600.us.archive.org/3/items/gov.law.is.2470.1.1985/is.2470.1.1985.pdf
BOS (2010). Punjab development statistics 2010. Bureau of Statistics Punjab, 65-Trade Centre Block, MA Johar Town. Available online at: http://www.bos.gop.pk/system/files/Development-Statistics-2010.pdf
BOS (2011). Development Statistics of Balochistan 2011-12. Area & Population Table 6. Bureau of Statistics Balochistan, Planning & Development Department, Quetta. Available online at: http://balochistan.gov.pk/index.php?option=com_docman&task=cat_view&gid=1277&Itemid=677&limitstart=15
BOS (2013). Development Statistics of Khyber Pakhtunkhwa 2011-12. Bureau of Statistics Khyber Pakhtunkhwa, Khyber Pakhtunkhwa. Available online at: http://kpbos.gov.pk/files/1385537977.pdf
BOS (2014). Development Statistics of Sindh 2014. Sindh Bureau of Statistics, Karachi. Available online at: http://sindhbos.gov.pk/wp-content/uploads/2014/09/DS-2014.pdf
Bouwman, A. F., Beusen, A. H. W., Lassaletta, L., Van Apeldoorn, D. F., Van Grinsven, H. J. M., Zhang, J., et al. (2017). Lessons from temporal and spatial patterns in global use of N and P fertilizer on cropland. Sci. Rep. 7, 1–11. doi: 10.1038/srep40366
Bouwman, A. F., Lee, D. S., Asman, W. A. H., Dentener, F. J., Hoek, K. W., Van, D.er, Olivier, J. G. J., et al. (1997). A global high-resolution emission inventory for ammonia. Global Biogeochem. Cycles 11, 561–587. doi: 10.1029/97GB02266
Bouwman, L., Goldewijk, K. K., Van Der Hoek, K. W., Beusen, A. H. W., Van Vuuren, D. P., Willems, J., et al. (2013). Exploring global changes in nitrogen and phosphorus cycles in agriculture induced by livestock production over the 1900-2050 period. Proc. Natl. Acad. Sci. U.S.A. 110, 20882–20887. doi: 10.1073/pnas.1012878108
Byerlee, D., and Husain, T. (1993). Agricultural research strategies for favoured and marginal areas: the experience of farming systems research in Pakistan. Exp. Agric. 29, 155–171. doi: 10.1017/S0014479700020603
Commonwealth Local Government Forum, CLGF. (2015). Commonwealth Local Government Handbook and Individual Country Profiles. London: Publications UK. Available online at: http://www.clgf.org.uk/default/assets/File/Country_profiles/Pakistan.pdf
Cordell, D., Turner, A., and Chong, J. (2015). The hidden cost of phosphate fertilizers: mapping multi-stakeholder supply chain risks and impacts from mine to fork. Glob. Chang. Peace Secur. 27, 1–21. doi: 10.1080/14781158.2015.1083540
Cordell, D., and White, S. (2014). Life's bottleneck: implications of global phosphorus scarcity and pathways for a sustainable food system. Annu. Rev. Environ. Resour. 39, 161–188. doi: 10.1146/annurev-environ-010213-113300
Dawson, C. J., and Hilton, J. (2011). Fertiliser availability in a resource-limited world: Production and recycling of nitrogen and phosphorus. Food Policy 36, S14–S22. doi: 10.1016/j.foodpol.2010.11.012
Ensink, J. H. J., Mahmood, T., Van Der Hoek, W., Raschid-Sally, L., and Amerasinghe, F. P. (2004). A nationwide assessment of wastewater use in Pakistan: an obscure activity or a vitally important one? Water Policy 6, 197–206. doi: 10.2166/wp.2004.0013
FAO (2004). Fertilizer use by Crop in Pakistan. Rome. Available online at: http://www.fao.org/tempref/docrep/fao/007/y5460e/y5460e00.pdf
FAO (2012). Aquamaps website. Available online at: http://www.fao.org/nr/water/aquamaps/ (Accessed December 13, 2017).
FAO (2013). FAOSTAT. Available online at: http://www.fao.org/faostat/en/#data/RL
FAO (2015). The State of Food Insecurity in the World 2015. Strengthening the enabling environment for food security and nutrition.
FAO (2016). Country Fact Sheet on Food and Agriculture Policy Trends. Pakistan. Available online at: http://www.fao.org/3/a-i6054e.pdf
FAO (2017). FAOSTAT. Available online at: http://www.fao.org/faostat/en/#data/OA
Foley, J. A., Ramankutty, N., Brauman, K. A., Cassidy, E. S., Gerber, J. S., Johnston, M., et al. (2011). Solutions for a cultivated planet. Nature 478, 337–342. doi: 10.1038/nature10452
Fourer, R., Gay, D., and Kernighan, B. (2003). AMPL - A Modeling Language for Mathematical Programming. Duxbury/Thomson. Available online at: https://orfe.princeton.edu/~rvdb/307/textbook/AMPLbook.pdf
Gerber, P., Chilonda, P., Franceschini, G., and Menzi, H. (2005). Geographical determinants and environmental implications of livestock production intensification in Asia. Bioresour. Technol. 96, 263–276. doi: 10.1016/j.biortech.2004.05.016
Godfray, H. C. J., Beddington, J. R., Crute, I. R., Haddad, L., Lawrence, D., Muir, J. F., et al. (2010). Food security: the challenge of feeding 9 billion people. Science 327:812. doi: 10.1126/science.1185383
Gonçalves, D. N. S., Gonçalves, C., de, M., Assis, T. F., and de, Silva, M. A. da (2014). Analysis of the difference between the euclidean distance and the actual road distance in Brazil. Transp. Res. Procedia 3, 876–885. doi: 10.1016/j.trpro.2014.10.066
Granstedt, A., Pentti, S., and Thomsson, O. (2004). Effective Recycling Agriculture Around the Baltic Sea. Available online at: http://www.jdb.se/beras/files/beras2.pdf
Himmeblau, D. M. (1967). Basic Principles and Calculations in Chemical Engineering. Prentice-Hall. Available online at: https://books.google.se/books?id=AhszAAAAMAAJ
Hitchcock, F. L. (1941). Distribution of a product from several sources to numerous localities. J. Math. Phys. 20, 224–230. doi: 10.1002/sapm1941201224
Hörtenhuber, S. J., Theurl, M. C., and Möller, K. (2017). Comparison of the environmental performance of different treatment scenarios for the main phosphorus recycling sources. Renew. Agric. Food Syst. 1–14. doi: 10.1017/S1742170517000515
ILOG Inc. ILOG CPLEX (2012). High-Performance Software for Mathematical Programming and Optimization.
Jones, D. L., Cross, P., Withers, P. J. A., Deluca, T. H., Robinson, D. A., Quilliam, R. S., et al. (2013). Nutrient stripping: the global disparity between food security and soil nutrient stocks. J. Appl. Ecol. 50, 851–862. doi: 10.1111/1365-2664.12089
Jönsson, H., and Vinnerås, B. (2004). “Adapting the nutrient content of urine and faeces in different countries using FAO and Swedish data,” in Ecosan-Closing the Loop. Proceedings of the 2nd International Symposium on Ecological Sanitation, Incorporating the 1st IWA Specialist Group Conference on Sustainable Sanitation (Lübeck), 623–626. Available online at: http://www.waterfund.go.ke/watersource/Downloads/020.%20ecosan-Symposium-Luebeck-session-f.pdf
Khan, A. N., Begum, T., and Sher, M. (2010). Energy Crisis in Pakistan : Causes and Consequences. Abasyn J. Soc. Sci. 4, 341–363. Available online at: http://64.17.184.140/wp-content/uploads/2012/12/V4I2-5.pdf
Liu, C., Kroeze, C., Hoekstra, A. Y., and Gerbens-Leenes, W. (2012). Past and future trends in grey water footprints of anthropogenic nitrogen and phosphorus inputs to major world rivers. Ecol. Indic. 18, 42–49. doi: 10.1016/j.ecolind.2011.10.005
MacDonald, G. K., Bennett, E. M., and Carpenter, S. R. (2012). Embodied phosphorus and the global connections of United States agriculture. Environ. Res. Lett. 7:044024. doi: 10.1088/1748-9326/7/4/044024
Magnone, D., Bouwman, A. F., Van Der Zee, S. E. A. T. M., Sattari, S. Z., Beusen, A. H. W., and Niasar, V. J. (2017). Efficiency of phosphorus resource use in Africa as defined by soil chemistry and the impact on crop production. Energy Procedia 123, 97–104. doi: 10.1016/j.egypro.2017.07.264
Metson, G. S., MacDonald, G. K., Haberman, D., Nesme, T., and Bennett, E. M. (2016). Feeding the Corn Belt: Opportunities for phosphorus recycling in U.S. agriculture. Sci. Total Environ. 542, 1117–1126. doi: 10.1016/j.scitotenv.2015.08.047
Mueller, N. D., Gerber, J. S., Johnston, M., Ray, D. K., Ramankutty, N., and Foley, J. A. (2013). Corrigendum: closing yield gaps through nutrient and water management. Nature 494, 390–390. doi: 10.1038/nature11907
Negash, D., Abegaz, A., Smith, J. U., Araya, H., and Gelana, B. (2017). Household energy and recycling of nutrients and carbon to the soil in integrated crop-livestock farming systems: a case study in Kumbursa village, Central Highlands of Ethiopia. GCB Bioenergy 9, 1588–1601. doi: 10.1111/gcbb.12459
NFDC (2010). Statistics. National Fertilizer Development Centre, Islamabad, Pakistan. Available online at: http://www.nfdc.gov.pk/stat.html (Accessed December 13, 2017).
NPCS (2008). The Complete Book on Organic Farming and Production of Organic Compost. Asia Pacific Business Press Inc.
Pakistan Bureau of Statistics, PBS. (2012). Agricultural Census 2010 - Pakistan Report. Pakistan Bureau of Statistics, Islamabad, Pakistan. Available online at: http://www.pbs.gov.pk/content/agricultural-census-2010-pakistan-report
PBS (2006). Pakistan Livestock Census 2006. Pakistan Bureau of Statistics, Islamabad, Pakistan. Available online at: http://www.pbs.gov.pk/content/pakistan-livestock-census-2006
PBS (2017a). Administrative district 1951-2017. Pakistan Bureau of Statistics, Islamabad, Pakistan. Available online at: http://www.pbscensus.gov.pk/sites/default/files/gis_maps/historical_1951-2017.jpg (Accessed December 13, 2017).
PBS (2017b). Population Census 2017. Pakistan Bureau of Statistics, Islamabad, Pakistan. Available online at: http://www.pbs.gov.pk/sites/default/files/PAKISTAN%20TEHSIL%20WISE%20FOR%20WEB%20CENSUS_2017.pdf
Pradhan, P., Fischer, G., Van Velthuizen, H., Reusser, D. E., and Kropp, J. P. (2015). Closing yield gaps: how sustainable can we be? PLoS ONE 10:e0129487. doi: 10.1371/journal.pone.0129487
Prikhodko, D., and Zrilyi, O. (2013). Review of the Wheat Sector and Grain Storage Issues. Rome: Food and Agriculture Organization of the United Nations (FAO).
Reed, D. C., and Harrison, J. A. (2016). Linking nutrient loading and oxygen in the coastal ocean: a new global scale model. Global Biogeochem. Cycles 30, 447–459. doi: 10.1002/2015GB005303
SACEP BOBLME, FAO, and UNDP (2015). Nutrient Loading and Eutrophication of Coastal Waters of the South Asian Seas- A Scoping Study.
Solaiman, S., and Ahmed, N. (2006). Improving Plant Nutrient Management for Better Farmer Livelihoods. Food Security and Environmental Sustainability.
Tittonell, P., and Giller, K. E. (2013). When yield gaps are poverty traps: the paradigm of ecological intensification in African smallholder agriculture. F. Crop. Res. 143, 76–90. doi: 10.1016/j.fcr.2012.10.007
University of California (2015). Global Administrative Areas. Digital Geospatial Data (Version 2.8). Available online at: http://www.gadm.org (Accessed December 13, 2017).
Van Drecht, G., Bouwman, A. F., Harrison, J., and Knoop, J. M. (2009). Global nitrogen and phosphate in urban wastewater for the period 1970 to 2050. Global Biogeochem. Cycles 23, 1–19. doi: 10.1029/2009GB003458
van Noordwijk, M., and Brussaard, L. (2014). Minimizing the ecological footprint of food: closing yield and efficiency gaps simultaneously? Curr. Opin. Environ. Sustain. 8, 62–70. doi: 10.1016/j.cosust.2014.08.008
Keywords: food security, yield gap, crop fertilizer need, manure & sludge recycling, Asia, Pakistan
Citation: Akram U, Metson GS, Quttineh N-H and Wennergren U (2018) Closing Pakistan's Yield Gaps Through Nutrient Recycling. Front. Sustain. Food Syst. 2:24. doi: 10.3389/fsufs.2018.00024
Received: 31 March 2018; Accepted: 29 May 2018;
Published: 19 June 2018.
Edited by:
José Martinez, Institut National de Recherche en Sciences et Technologies Pour L'environnement et L'agriculture (IRSTEA), FranceReviewed by:
Ariel A. Szogi, Agricultural Research Service (USDA), United StatesPaolo Mantovi, Centro Ricerche Produzioni Animali, Italy
Copyright © 2018 Akram, Metson, Quttineh and Wennergren. This is an open-access article distributed under the terms of the Creative Commons Attribution License (CC BY). The use, distribution or reproduction in other forums is permitted, provided the original author(s) and the copyright owner are credited and that the original publication in this journal is cited, in accordance with accepted academic practice. No use, distribution or reproduction is permitted which does not comply with these terms.
*Correspondence: Uno Wennergren, dW5vLndlbm5lcmdyZW5AbGl1LnNl