- 1Coastal Plains Soil, Water and Plant Research Center (USDA-ARS), Florence, SC, United States
- 2Food Animal Environmental Systems Research Unit (USDA-ARS), Bowling Green, KY, United States
- 3Sustainable Agricultural Systems Laboratory and Food Safety Laboratory (USDA-ARS), Beltsville, MD, United States
This study determined the water quality improvements in swine lagoons by an innovative swine manure treatment system operating at full-scale during five pig production cycles. The system performed high-rate solid-liquid separation, biological ammonia treatment and phosphorus treatment. The treatment system met the environmental performance standards for swine waste management systems in new or expanding operations in North Carolina. The system substantially reduced odor by 99.9%; pathogens by 99.99%, nutrients (phosphorus and nitrogen) by > 90%, and heavy metals by 99%. As the treated effluent and/or rainwater renovated the liquid in the anaerobic lagoons, they became aerobic (Eh > 300 millivolts). By the end of the second year, the NH4-N concentration in the lagoons liquid declined from the initial 370–485 mg L−1 to lower than 15. After conversion, the sludge accumulation in the former lagoons was halted. This was a significant outcome because one converted lagoon served twice the number of animals than before implementation of the innovative manure treatment system, which is similar to a situation of herd expansion. These findings showed that environmentally superior waste management technologies can have substantial positive impacts on water quality in intensive swine production.
Introduction
Typically, waste from confined swine production operations in the southeastern U.S. is stored and treated in large, open anaerobic lagoons prior to application on cropland (Barker, 1996a; Westerman et al., 2010). After year 2000, there was great public interest in developing new swine manure treatment systems in the region to address multiple environmental and health concerns associated with the anaerobic lagoon system. These concerns included emissions of ammonia (Aneja et al., 2008), pathogens (Sobsey et al., 2001; Vanotti et al., 2005), odors (Schiffman and Williams, 2005; Loughrin et al., 2006), and deterioration of water quality (Mallin, 2000). Consequently, demonstrations of new treatment systems were conducted on-farm to demonstrate feasibility of environmental superior waste management technologies (EST) that could address five environmental standards: “1. Eliminate the discharge of animal waste to surface waters and groundwater through direct discharge, seepage or runoff; 2. Substantially eliminate atmospheric emissions of ammonia; 3. Substantially eliminate the emission of odor that is detectable beyond the boundaries of the parcel or tract of land on which the swine farm is located; 4. Substantially eliminates the release of disease-transmitting vectors and airborne pathogens; and 5. Substantially eliminates nutrient and heavy metal contamination of soil and groundwater” (Williams, 2009). Nutrients of concern were nitrogen (N) and phosphorus (P), and heavy metals of concern were copper (Cu) and zinc (Zn). As a result of this process, new legislation in North Carolina was enacted enforcing the environmental performance standards of EST for the construction of new swine farms or expansion of existing swine farms (NC Legislature, 2007; 15A NCAC 02T, 2010; Sommer et al., 2013).
Typically, the separation efficiencies of mechanical solid–liquid separators are less than 68% (Chastain et al., 2001) and typically less than 34% (Riaño and García-González, 2014). Organic nutrients (N and P) are contained mostly in fine manure particles < pore size 0.3 mm (Vanotti et al., 2002) that are not separated with normal screening (Riaño and García-González, 2014). However, new advances in both equipment and flocculant polymer applications developed for high-rate separation treatment have improved removal efficiency of solids and plant nutrients (N and P) (Vanotti and Hunt, 1999; Hjorth et al., 2010; Chastain, 2013). More and more often, new treatment systems for manure encompass three or four process units in tandem to meet various environmental standards and nutrient recovery targets. The swine waste management system described in this work is a manure treatment system developed to meet the EST environmental standards referenced above (Vanotti et al., 2010). The system consisted of high-rate solid-liquid separation followed by ammonia treatment and phosphorus recovery. A detailed description of this system as well as system drawing, first year performance of the treatment plant, and economic considerations, are found in Vanotti et al. (2009). While treatment performance of the system per se can be correctly assessed at steady state over relatively short periods during cold and warm weather conditions, its effect on water quality needs longer periods of monitoring due the large volume and slow hydraulic retention time of existing lagoons. In a previous study, we were able to evaluate side by side the water quality of a swine lagoon (total volume 24,145 m3) being cleaned with the treated effluent from a multiple-stage treatment system (4,360-head swine unit) compared with an identical control anaerobic swine lagoon receiving raw effluent from another 4,360-head swine unit (Vanotti and Szogi, 2008). Results of that evaluation showed the converted lagoon was transformed into an aerobic reservoir (dissolved oxygen, DO, 6.95 mg L−1) within a year, and by the second year, the following concentration reductions in the lagoon liquid were realized: 73% of total suspended solids (TSS), 77% of biochemical oxygen demand (BOD), and 92% of ammonium (NH4-N) (Vanotti and Szogi, 2008). In the present study, the multi-stage treatment system (performing the same environmental functions as before) was retrofitted into a 5,145-swine farm that for the previous 11–12 years used two anaerobic lagoons (16,552 and 13,120 m3) to treat the manure (Figure 1). With the implementation of the new system, one lagoon was discontinued, and the other lagoon was used as effluent storage and received the effluent from all the barns after treatment in the new plant (Figure 2). This lagoon served twice the animals as before, similar to a situation of herd expansion. Thus, it presented unique conditions that have not been experimented before or could be predicted without experimental data on water quality.
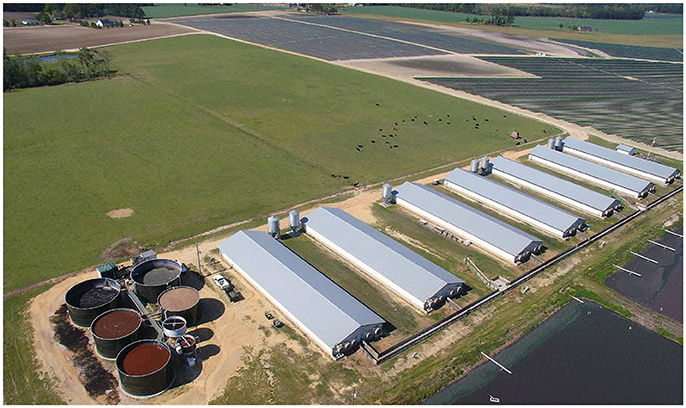
Figure 1. Aerial picture of waste treatment system and barns. It treated all the manure flushed from seven barns with 735 pigs each. Existing lagoons are shown in the foreground.
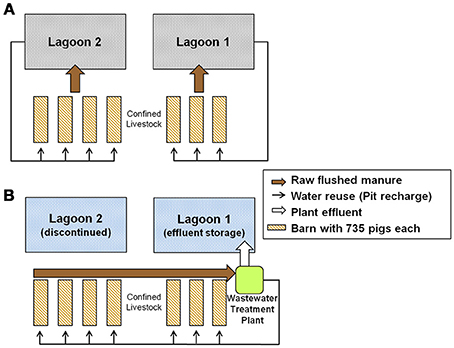
Figure 2. Wastewater treatment system retrofitted into a 5,145-head swine finishing farm. (A) The previous system that used two anaerobic lagoons (0.6 ha each) for manure treatment and storage. (B) After installation of the new system, all the flushed manure was treated in the new plant and the treated effluent was stored in lagoon 1 while lagoon 2 was discontinued.
The objectives of this study were to: (1) Report the overall treatment efficiency consisting of high-rate solid-liquid separation followed by ammonia and phosphorus treatment evaluated intensively at steady state over a 2 years period and five swine production cycles. (2) Report the corresponding water quality improvements in the converted lagoons. (3) Report the changes in the sludge depth of the lagoons during a 6 years period of the new system operating at full-scale.
Materials and Methods
Farm Description
The full-scale manure treatment system was installed on a swine farm near Clinton, Sampson Co., North Carolina and evaluated intensively with regards to water quality during 2 years under steady-state conditions that included five complete swine production cycles. The evaluation monitored the treatment plant and lagoons. Changes in the sludge depth in the lagoons were not clear in the first 2 years. For this reason, measurements of sludge depth were collected and reported for an additional 4 years of operation of the new treatment system.
The farm had 12.9 ha (32 acres) with a permitted capacity of 5,145-head feeder-to-finish swine placed in seven barns (735 heads/barn). The traditional anaerobic lagoon system (Barker, 1996a; NRCS, 2004), which is typical in North Carolina, was used for about 11 years before the new treatment system started operation in Dec. 2006. Production records during the three growing cycles before the start of the new plant showed the farm produced an average of 584,000 kg total live weight (487,000 kg net gain production) per growing cycle (5,296 pigs/cycle). The manure was collected under the barns using slatted floors and a pit-recharge system (Barker, 1996b). The liquid manure contained in the pits was emptied weekly by gravity into the anaerobic lagoons. There were two anaerobic lagoons for treatment and storage of the manure flushed from the barns (Figure 2A). Lagoon 2 received the flushes from four barns (1–4); it had a surface of 0.62 ha, a depth of 3.66 m and a design volume of 16,552 m3. This volume included (1) a minimum treatment volume of 11,240 m3 based on Steady State Live Weight (SSLW) (2,940 head × 61.24 kg/head = 180,045 kg) and anaerobic treatment volume guidelines of 6.243 m3/100 kg SSLW (1 ft3/lb SSLW), and (2) a temporary storage volume of 5,016 m3 based on waste volume generated stored for 180 days (0.00849 m3/100 kg SSLW/d or 0.00136 ft3/lb SSLW/d), a positive balance of rain – evaporation (17.78 cm) and an additional 17.78 cm storage for a “25-year, 24 h” storm event. Lagoon 1 received the flushed raw manure from three barns (5–7); it had a surface of 0.60 ha, a depth of 2.74 m and a design volume of 13,120 m3. This volume included (1) a minimum treatment volume of 8,433 m3 based on SSLW (2,205 heads × 61.24 kg/head = 135,034 kg) and same anaerobic treatment volume guidelines, and (2) a temporary storage volume of 4,312 m3 also based on waste volume generated stored for 180 days, rain – evaporation of 17.78 cm, and a “25-year, 24-h” storm storage of 17.78 cm. After treatment in the lagoons, the liquid was sprayed onto the farms's fields growing small grains and forages with a permitted capacity to utilize a total 5,390 kg of plant available N per year (average N application rate of 417.8 kg N/(ha.year). The lagoon supernatant liquid was recycled into the subfloor pits to facilitate waste flushing (Figure 2A).
With the new treatment system, the flow of raw wastewater into the lagoons was discontinued; instead, all the raw wastewater was sent to the treatment plant (Figure 2B). The barn pits were flushed once a week as before, but the flushed manure (barns 1–7) was diverted into a homogenization tank that mixed the manure before the solid-liquid separation step. A portion of the water after ammonia treatment was used to recharge the barn pits for the flushing (Figure 3). Water in excess of that needed for barn pit recharge was treated in the phosphorus treatment + disinfection module and stored in lagoon 1 for use in crop irrigation. As mentioned before, the new treatment system was evaluated intensively during five growing cycles of pigs (Figure 4). Within production cycles, the total pig weight in the seven barns varied greatly, from a low monthly average of 71.8 Mg to a high of 519.3 Mg (Figure 4). The average live animal weight (LAW) in the seven barns during the 5-cycle evaluation period was 335.8 Mg. This value is also referred to as steady-state live weight (SSLW, dotted line Figure 4). During the 5-cycle evaluation period, the farm sold an average of 624,345 ± 21,867 kg total live weight (516,239 ± 13,791 kg net gain produced) in each of the five growing cycles (5,265 ± 132 pigs/cycle).
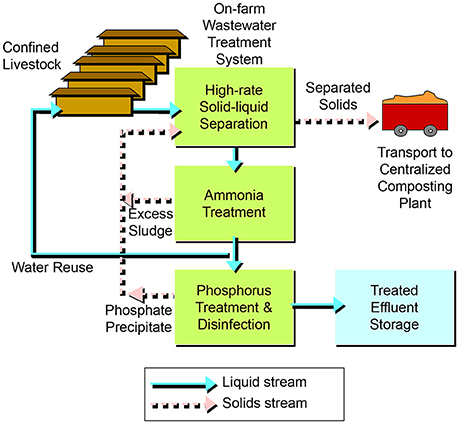
Figure 3. Schematic diagram of wastewater treatment system using high-rate solid-liquid separation, ammonia treatment and phosphorus treatment.
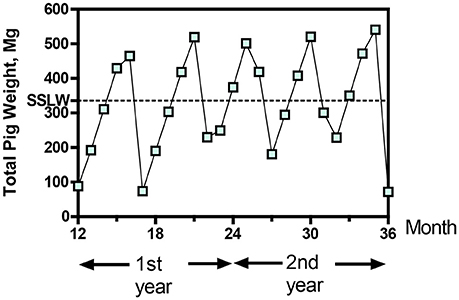
Figure 4. Average monthly total live weight of the pigs during five production cycles in seven barns during demonstration of new wastewater treatment process. Dotted line is the steady state live weight (SSLW).
The water quality of the two lagoons was monitored intensively during a 3 years period: the year before the project started when both lagoons performed anaerobic treatment, and the following 2 years when lagoon 1 received effluent from the alternative treatment system and lagoon 2 received only rain water. To help comparison of results of water quality monitoring, the same 36 months scale was used in the figures in this paper. After the intensive 3 years evaluation by the ARS team (2006–2008), the treatment system kept operating full-scale without changes in swine inventory for an additional 4 years. As part of the permit No AWI820164 for using the innovative animal waste management system, the operator had to report to the State Permitting Authority the following parameters: daily volume of separated solids, the quarterly total volumes of the system wastewater influent and effluent, and quarterly chemical analyses of Total N, NH4-N, NO3+NO2-N, BOD5, Total P, TS, Cu, Zn, pH, and fecal coliforms in the separated solids (except BOD5), the influent into the homogenization tank and the plant effluent from the phosphorus settling tank. After 3 years of successful compliance, the frequency of sampling and chemical analyses was reduced to two times per year to demonstrate compliance in both summer and winter seasons. During this extended period, the analyses were also done at ARS laboratory.
Wastewater Treatment System Description
The multistage system (Vanotti et al., 2010) consisted of three steps or process units in tandem: high-rate solid-liquid separation, biological ammonia treatment, and phosphorus treatment/disinfection (Figure 3). For a completed description and the schematic drawing of this system, see Vanotti et al. (2009). Before the first step, subfloor wastewater was emptied weekly by gravity into a receiving pit and pumped by a 946 L min−1 pump into a 379 m3 capacity homogenization tank. The manure was kept well mixed using a 3.5 kW, 12.1 m3 min−1 submersible mixer. The homogenized liquid manure was conveyed into the first step in the system—the liquid/solid separation process—at a process flow of 9.1 m3 h−1. The process used polymer flocculation to enhance the separation of fine suspended particles (Vanotti and Hunt, 1999; Garcia et al., 2007). Solids were separated by a rotary press separator (Fournier Industries Inc., Quebec, Canada) with a dual 1.2 m rotary press, two polymer preparation tanks, a polymer metering pump, manure feed pump and in-line flocculator. The polymer was dry cationic, linear polyacrylamide (PAM) with 35% mole charge (SNF Floerger, Riceboro, GA). The prepared polymer solution contained 2.14 g PAM L−1 (0.2%) and was mixed with the liquid manure at a rate of 6%. This resulted in a final polymer dosage of 128 mg L−1. Separated manure solids were transported offsite to a solids processing facility and composed with cotton gin waste to produce value-added organic fertilizers, soil amendments and plant growth media (Vanotti et al., 2006). The separated wastewater was stored in another 379 m3 tank and then pumped continuously into the second step of the system – the biological ammonia treatment process. This process used nitrification-denitrification (NDN) with a Modified Ludzack-Ettinger (MLE) configuration (Tchobanoglous et al., 2003). There were three tanks in the second step: the first tank was an anoxic tank (277 m3) for denitrification (DN), the second tank was an aeration tank (227 m3) for nitrification, and the third tank was a settling tank for clarification. Nitrification converted NH4-N into NO2-N and NO3-N. The nitrified wastewater was continually recycled into the DN tank using the pre-denitrification configuration (MLE). In the DN tank, suspended denitrifying bacteria used soluble manure carbon in the separated manure to transform NO2 and NO3 into N2 gas. The nitrification process used high-performance nitrifying bacterial sludge (HPNS), which was developed for high-ammonia wastewater and cold temperatures (Vanotti et al., 2013). To start the nitrification process, the aeration tank was inoculated with one liter of HPNS. Then a multiplication step was conducted in the same tank during 40 days to achieve full-scale nitrification activity prior to starting the complete system (Vanotti et al., 2009). Air was supplied continuously with a 10 HP rotary lobe blower and 98 fine-air diffusers. The DN tank contained a 1.7 kW, 9.8 m3 min−1 submersible mixer. A settling tank (14.3 m3) with conical bottom clarified the effluent after nitrification. The settled sludge was returned into the DN tank. The rates of sludge and nitrified liquid recycling into the DN tank were 0.5 and 3.5 times the inflow rate, respectively. The clarified effluent was stored in a 277 m3 tank and used to refill the barn pits (Figure 2B). The average mixed liquor suspended solids (MLSS) and mixed liquor volatile suspended solids (MLVSS) in the nitrification tank during evaluation were 2,450 ± 1,680 mg L−1 and 1,980 ± 1,440 mg L−1, respectively. Target MLSS concentrations were > 2,000 and < 4,000 mg L−1. Once a week, the operator used a settling test (15 min, 1 L graduated cylinder) to estimate the MLSS in both denitrification and nitrification tanks based on an empirical relationship obtained at the site: [settled solids vol. (mL L−1) = −66.7 + 0.1132 MLSS (mg L−1); r2 = 0.759] so that the settled solids volume in the 15 min test stayed between 160 and 390 mL L−1 (corresponding to the 2,000–4,000 mg MLSS L−1 target). This information was used by the operator to divert more or less sludge from the settling tank into the solids separator up-front to meet the MLSS target range. Considering a specific nitrification activity of 20.76 mg N/g MLVSS/ h and a nitrification tank volume of 227 m3, the nitrification capacity of the unit was 223 kg N/day. In the third step of the system—the phosphorus treatment/disinfection process - the soluble P was recovered as a calcium phosphate solid (Vanotti et al., 2003), and pathogens were substantially reduced by the alkaline environment (Vanotti et al., 2005). The effluent was treated with hydrated lime slurry [12% Ca(OH)2] in a 0.3 m3 reaction chamber. The pH of the process was maintained at 9.5 by a pH probe and pH controller linked to the lime injection pump. The average lime consumption rate was 1.18 kg m−3. The P precipitate (calcium phosphate) was separated in a settling tank with conical bottom (8.8 m3) and further dewatered using the solid/liquid separation unit in the first unit of the system (Garcia et al., 2007). Phosphorus and manure solids as well as excess NDN sludge were combined in one solids stream for off-farm transport (Figure 3).
The average wastewater flows though the new treatment system (2 years averages) were the following: 36.3 m3 d−1 of raw manure were flushed from the barns and treated (plant influent); 6.2 m3 d−1 after N treatment were recycled to refill the barn's pit recharge system; 31.6 m3 d−1 after P treatment (plant effluent) were stored in lagoon 1 for use in crop irrigation. On average, the flushed manure volume from the barns contained 17.1% recycled effluent from the treatment system and 82.9% of newly generated manure, urine, and water wasted by pigs. The newly generated wastewater stream (flushed manure—water reuse) averaged 30.1 m3 day−1 or 40.8 L per 455 kg live animal weight (LAW) per day. For comparison, the industry average in feeder to finish operations using pit-recharge systems is 45.8 L per 455 kg LAW per day (1.62 ft3 per 1,000 lbs. LAW per day) (Chastain et al., 1999).
Water Sampling and Monitoring
For the treatment system, composite liquid samples were collected twice per week during a 2 years period from four locations: (i) the homogenization tank containing raw flushed manure (plant influent), (ii) after solid-liquid separation treatment, (iii) after N treatment, and (iv) after P treatment (plant effluent). Samples were composited of four sub-samples taken over 3.5 days periods using refrigerated automated samplers (Sigma 900max, American Sigma, Inc., Medina, NY). Wastewater flows throughout the system were measured with five liquid-level ultrasonic probes and data logger (SR50 Sonic Ranging Sensor and CR800 data logger, Campbell Scientific Inc., Logan, UT). The ultrasonic probes measured liquid levels in the homogenization tank, separated water tank, clean water tank, and settling tank. The measurements of liquid height and area of the tanks were used to calculate actual volume dynamics and flows. The data logger also monitored air and water temperatures, precipitation, DO, ORP, and process pH. Average monthly maximum, average and minimum air temperatures and total monthly rain are shown in Figure 5. Average monthly minimum and maximum of daily air temperatures ranged from −8.4 to 38.8°C, average monthly air temperature was 16.5°C, and it ranged from 5.5 to 27.2°C, and precipitation averaged 1,048 mm per year.
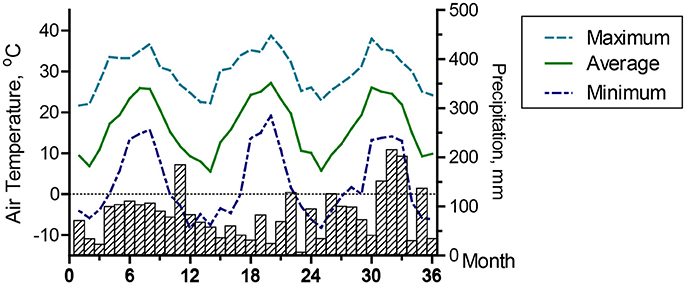
Figure 5. Air temperature and precipitation during the 3-yr water quality monitoring period. Data are monthly maximum, average, and minimum of daily air temperatures, and monthly precipitation.
Lagoon liquid samples were collected monthly during a 3 years period to monitor water quality characteristics at least 1 year before and 2 years after the treatment system was implemented. Sub-samples were collected from the lagoon supernatant within a 0.30 m depth using a 500 mL polyethylene dipper with a 3.6 m handle. From each lagoon, two composite samples were obtained by mixing in a bucket eight sub-samples collected around the lagoon.
Collected samples were: (1) transported on ice to the ARS Coastal Plains Research Center in Florence, SC, for water quality analyses, or (2) overnight shipped with cold packs to the ARS Sustainable Agricultural Systems Laboratory and Environmental Microbial Safety Laboratory in Beltsville, MD, for microbiological analyses, and to the ARS Animal Waste Management Research Unit in Bowling Green, KY, for odor analyses.
The sludge depth in the lagoons was monitored yearly during 9 years: 3 years before and 6 years after the new system was implemented. The distance from the liquid surface level to the top of the sludge layer was measured with a sonar and the distance from the liquid surface to the lagoon bottom (soil) was measured with a pole. From 2004 to 2006, the sonar measurements were made from a boat at 8 or 10 sampling points per lagoon. Afterwards, the sonar measurements were done with a remote control boat that collected 1,150 ± 170 points per lagoon. Sludges were sampled five times to measure chemical characteristics using Sludge Judge probes 4.5 m long × 3.2 cm outside diameter (OD). Volume of sludge was calculated based on height using the formula volume of a trapezoid and design dimensions of the lagoons.
Analytical Methods
Water quality analyses were performed according to Standard Methods for the Examination of Water and Wastewater (APHA, 1998). Total solids (TS), total suspended solids (TSS), and volatile suspended solids (VSS) used Standard Method 2540 B, D, and E, respectively. Chemical analyses consisted of chemical oxygen demand (COD) using Method 5220 D, 5 days biochemical oxygen demand (BOD5) using Method 5210 B, ammonia (NH4-N) using Method 4500-NH3 G, nitrate plus nitrite (NO3 + NO2 -N) using Method 4500- F, pH using Method 4500-H+ B, electrical conductivity (EC) using Method 2510 B, alkalinity using Method 2320 B and endpoint pH of 4.5, soluble P (SP or PO4) using Method 4500-P F after filtration through a 0.45-μm membrane filter. Total P (TP) and total Kjeldahl N (TKN) were determined using acid digestion (Gallaher et al., 1976) and colorimetric phosphorus and nitrogen methods adapted to acid digests (Technicon Instruments Corp, 1977). Organic P was the difference between total P and PO4 analyses. Organic N was the difference between Kjeldahl N and NH4-N analyses, and Total N was the sum of TKN and nitrate + nitrite. The potassium (K), calcium (Ca), magnesium (Mg), sodium (Na), copper (Cu), and zinc (Zn), were determined using nitric acid/peroxide block digestion (Peters, 2003) and inductively coupled plasma (ICP) analysis (Method 3125 A). Oxidation-reduction potentials (ORP) were measured at the time of sampling using a Ag/AgCl reference electrode and corrected to standard hydrogen electrode (Eh) values (Standard Method 2580 B). Reduction in odor was characterized as described by Loughrin et al. (2009) that measured in the liquid the concentration of five odor compounds characteristic of swine manure (phenol, p-cresol, p-ethylphenol, indole, and skatole) using extraction with Twister stir bars (Gerstel, Baltimore, MD) coated with polydimethylsiloxane followed by thermal desorption and gas chromatography-mass spectrometry. Total aromatic malodors were the sum of the five odor compounds. Microbiological analyses of liquid samples were done using standard protocols for pathogens and indicator microbes for the examination of wastewater (Vanotti et al., 2005).
Statistical Analysis
Data management, descriptive statistics (PROC MEANS), regression (PROC REG), and mean comparison for repeated measurements (PROC MIXED) analyses were performed with SAS (SAS Institute, 2008).
Results and Discussion
Water Quality Improvements by Treatment System
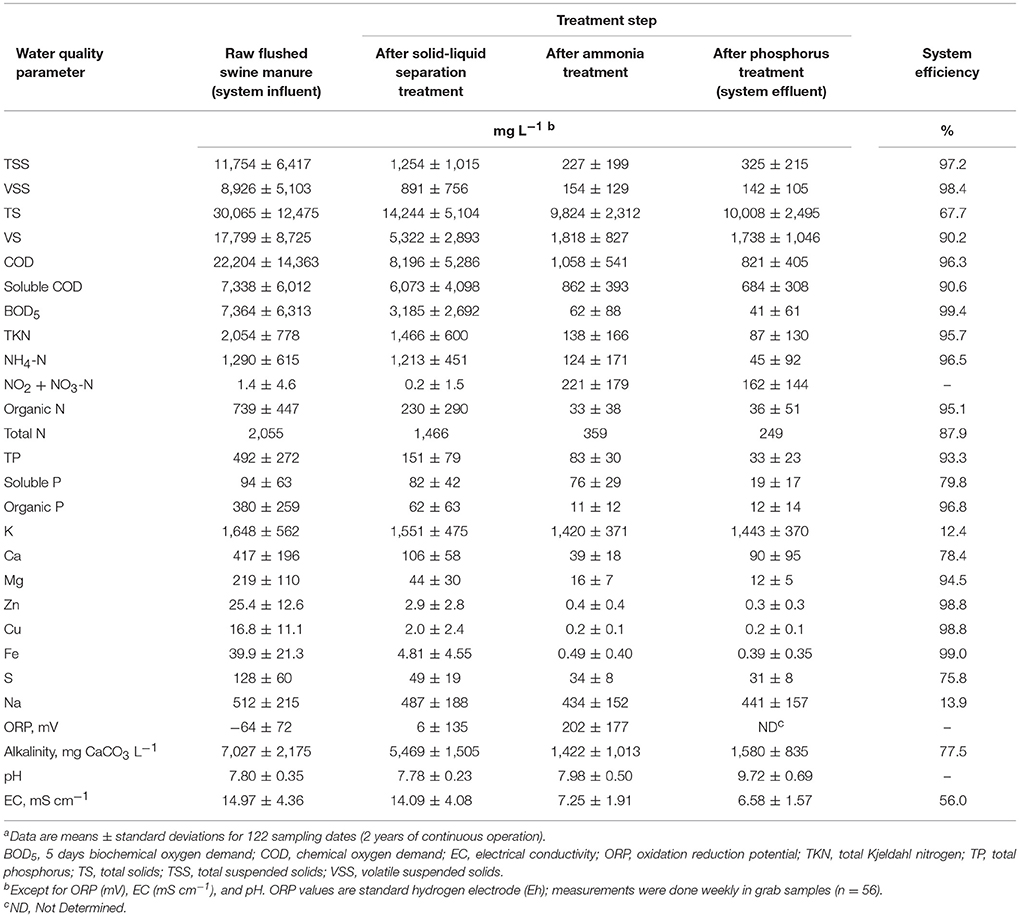
The wastewater treatment performance of the plant are presented in Table 1; the various columns show changes in water quality indicators as the liquid manure passed through the three treatment steps as well as the overall system efficiency. The intensive evaluation period encompassed five cycles of pig production; this allowed assessment of the performance of the system through varying environmental conditions and waste loadings. High treatment efficiencies were obtained consistently despite air temperatures varying from −8.4 to 38.8°C (Figure 5) and large fluctuations in the strength of the manure. Taken on average through the evaluation period, flushed manure had high strength (TS 3.0 ± 1.2%) according to the manure strength scale of Garcia-González and Vanotti (2015). The variation in concentrations because of changes in pig weight during production cycles was big: volatile solids, for example, averaged 17,800 mg L−1, but ranged from 2,850 mg L−1 up to about 41,800 mg L−1 while BOD5 averaged 7,360 mg L−1 and ranged from to 730 to over 25,000 mg L−1 (Table 1). Other quality parameters such as TKN (average 2,050 mg L−1, range 810–4,220 mg L−1) and NH4-N (average 1,290 mg L−1, range 310–3,445 mg L−1) were also distinctive of a high-strength swine wastewater. The variations in wastewater volumes were also big because of the pig production cycles: average monthly volume of flushed wastewater was 1,095 m3, but ranged from 396 up to 2,233 m3. Similarly, the clean treated effluent volumes averaged 963 m3 per month, and ranged from 290 to 1,666 m3. In terms of mass loadings, the total nitrogen load into the treatment system (flushed manure) during the five pig cycles averaged 80.6 kg N d−1 (29,510 kg N yr−1) and the monthly averages ranged from 20.9 to 211.5 kg N d−1. The average NH4-N load was 51.9 kg d−1 (range 13–150 kg d−1), and the average TP load was 21.4 kg d−1. The on-farm system removed 67.75% of TS, 90.2% of VS, 97.2% of TSS, 98.4% of VSS, 96.3% of COD, 99.4% of BOD5, 95.7% of TKN, 96.5% of NH4-N, 93.3% of TP, 98.8% of Zn, 98.8% of Cu, 56.0% of EC, and 77.5% of alkalinity (Table 1).
High-Rate Solid-Liquid Separation
The first step of the system was a high-rate solid-liquid separation via polymer flocculants (Chastain, 2013). The separation up-front allowed recovery of the organic materials in the manure, which can be utilized for the manufacture of composts, biochars, and other value-added products. It also allowed treatment of the liquid through biological nitrogen steps and phosphorus recovery/disinfection in an economical way to meet specific environmental standards. Compared to the flushed manure, the separation process concentrated the suspended solids > 25 times. It produced a relatively dry manure cake with 24.9% solids. The capture of the fine suspended solids through flocculation resulted in large decreases in TSS (90%) and COD (63%) concentrations (Table 1). TKN and total P were reduced by approximately 30% and 70%, respectively. Organic N and P were reduced 69 and 84%, respectively. In contrast, the soluble ammoniacal nitrogen (NH4-N) and soluble P were unaffected by the solids separation process. The high-rate solid-liquid separation was also effective reducing heavy metals Cu and Zn concentrations; this was one of the five environmental treatment objective of EST. Initial Cu and Zn concentrations (16.8 and 25.4 mg L−1) were both reduced > 88% just with the high-rate solid-liquid separation.
Biological Ammonia Treatment
The NDN step using the MLE process configuration treated NH4-N effectively. Nitrification was accomplished using high performance nitrifying sludge (HPNS) adapted to high-ammonia and low temperatures (Vanotti et al., 2013). The pre-denitrification configuration of the MLE process allowed suspended denitrifying bacteria to consume most of the COD and BOD5 remaining in the wastewater after solid-liquid separation. The average ratio COD/TN of the manure liquid after solid-liquid separation was 5.6 and appeared a good balance for N removal in this system without external carbon addition. On average, the NDN step reduced COD by 87% and BOD5 by 98% relative to their concentration after solid-liquid separation (Table 1). The average ammonia (NH4-N) removal efficiency was high (average = 90%) in spite of large variations of influent NH4-N concentrations (310–3,445 mg L−1) and monthly NH4-N loading rates (14.7–117.3 kg NH4-N d−1; average load = 47.7 kg d−1). Average TKN removal efficiency was 91%. Influent TKN concentration varied from 810 to 4,220 mg L−1, and the N mass loading rates varied monthly from 16.8 to 166.1 kg TKN d−1 (average TKN load = 58.7 kg d−1). The process responded well to cold temperatures experienced during evaluation. Monthly average water temperatures during cold weather (Dec–Feb) were 9.1–11.3°C, and corresponding daily minimum average water temperatures were 8.0–9.1°C. The N removal performance in this study was consistent with the performance obtained by Riaño and García-González in a full-scale, on-farm treatment plant in Castilla y Leon region, Spain, that also used a combination of high-rate solid-liquid separation with flocculants and nitrification-denitrification to treat raw swine manure: nitrification-denitrification step alone removed 84.5% of COD, 95.9% of TKN and 98.0% of NH4-N, while the combined system removed 97% of COD, 97% of TKN and 89% of TP. In France, a combination of solid-liquid separation using centrifuges and biological NDN treatment have been successfully established at large scale in approximately 300 units treating about 15% of the swine effluents produced in Brittany region to remove N surplus and also the P excess (Bernet and Béline, 2009).
The N removal unit produced a cleaner and oxidized effluent with 124 mg L−1 of NH4-N, 221 mg L−1 of NO3-N + NO2-N, 227 mg L−1 of TSS, 62 mg L−1 of BOD5, and ORP 202 mV (Table 1). Part of the N treated effluent was recycled on the farm to refill the pits under the barns and facilitate flushing (under the previous anaerobic lagoon system, the anaerobic lagoon liquid supernatant was used for the flushing). This recycling of clean water with low ammonia into the barns improved the environment in the barns that benefited health and productivity of the animals. Production records for the five growth cycles before and the five cycles after conversion of waste management technology showed improvements in several animal productivity and health indicators. With the new manure treatment system, the animal mortality was decreased 47%, daily weight gain was increased 6.1%, and feed conversion was improved 5.1%. As a result, the farmer sold 28,100 kg more hogs (a 5.8% increase) per growth cycle using the new system compared to the previous anaerobic lagoon management.
Phosphorus Recovery Treatment
The clarified effluent from the biological N removal step was treated with hydrated lime that precipitated the phosphorus at process pH of 9.5. Removal efficiencies of the soluble phosphate with the treatment system averaged 80% for wastewater containing an average of 94 ± 63 mg PO4-P L−1 (Table 1). The overall treatment system (three steps) recovered 93.3% of the TP, with two steps contributing significantly: the high-rate solid-liquid separation (first step) removed the organic P efficiently (from 380 to 62 mg P L−1), and phosphorus module (third step) removed the soluble P efficiently (from 76 to 19 mg PO4-P L−1).
Odor and Pathogen Reductions
The substantial elimination of malodorous compounds was an important environmental standard to meet. A complete odor evaluation in this system have been reported by Loughrin et al. (2009). Five characteristic aromatic malodor compounds (phenol, p-cresol, p-ethylphenol, p-propylenphenol, indole, and skatole) were measured in the liquid at the successive stages of the treatment system (Table 2). Results obtained showed a 99.9% reduction of total odors (the sum of concentration of the five malodor compounds) in the treated effluent compared to the untreated swine manure. The solid-liquid separation step was not efficient to separate the malodorous compounds in the flushed manure and 89% of these compounds remained in the liquid fraction. However, they were effectively destroyed during the subsequent biological ammonia treatment step. One important finding was that the concentration of total odor compounds in the liquid was related to BOD5 concentration (Figure 6). This relationship was used later by the State Permitting Authority to determine the level of odor acceptable using this innovative animal waste management system, as a replacement of measuring odor intensity levels at the property level, which was more complicated to measure. It was stablished that, to demonstrate odor compliance, the BOD5 concentration in the effluent samples shall not exceed 150 mg L−1.
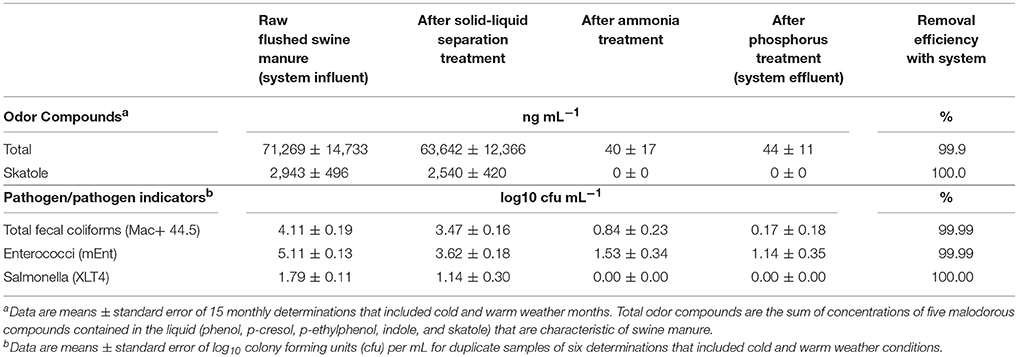
Table 2. Removal of odor compounds and pathogen indicator microorganisms by on-farm wastewater treatment system using high-rate solids separation coupled with ammonia and phosphorus treatment.
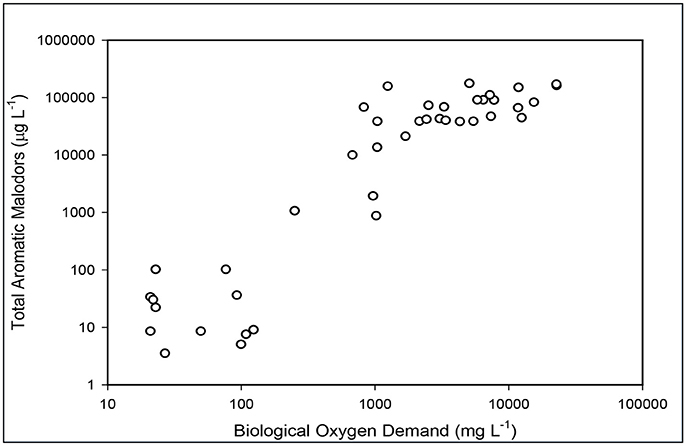
Figure 6. Relationship between total odor compounds in the liquid and BOD5 concentration as the liquid is being treated in the new plant.
The substantial elimination of pathogens was another important environmental standard to meet. The multistep treatment system was efficient reducing pathogens in the liquid swine manure (Table 2). Results showed a steady reduction of microbial indicators and pathogens by each step in the treatment system. The largest reduction was obtained in the biological ammonia removal step (2.63 and 2.09 log10 reductions for total fecal coliforms and enterococci, respectively). The phosphorus treatment with its high pH provided a level of disinfection needed to meet the EST criteria of 4-log pathogen indicator reduction (99.99%). Salmonella, which was present in the raw manure at 1.79 log 10 cfu/mL, was eliminated by the second step in treatment system.
Water Quality Improvements in Lagoons
Initial Lagoon Conditions
Table 3 and Figure 7 show the water quality changes in the two study lagoons during the 36 months monitoring period. Table 3 show yearly changes of all the water quality parameters measured, and Figure 7 show monthly changes of selected parameters. This monitoring period includes a common year before the project started (0–12 months) when both lagoons received raw manure directly from the barns (anaerobic lagoon management, Figure 3A) and the subsequent 2 years (12–36 months) when lagoon 1 received all the effluent from the new treatment plant, while lagoon 2 stopped receiving wastewater (raw or treated) (new manure management, Figure 3B). During initial conditions (0–12 months), the liquid characteristics in the two lagoons were similar as determined by water quality indicators shown in Table 3. The average TKN and NH4-N concentrations (539–671 mg L−1 and 371–485 mg L−1, respectively) were consistent with range values of 340–650 mg TKN L−1 and 280–570 mg NH4-N L−1 reported for liquid in 10 swine lagoons in North Carolina (Bicudo et al., 1999). Under traditional management, the monthly average TKN concentrations varied significantly within a year, from a low of about 325 to a high 829 mg L−1 in lagoon 1 and 487–819 in lagoon 2 (Figure 7). The NH4-N, which comprised 71% of the TKN, followed the same cyclic variation within a year. These N concentration cycles in the traditional lagoon followed seasonal temperature variations (Figure 5) with the lowest NH4-N concentrations at the end of summer and highest at the end of winter. This is consistent with the previous study that monitored NH4-N in traditional lagoon during 3 years (Vanotti and Szogi, 2008).
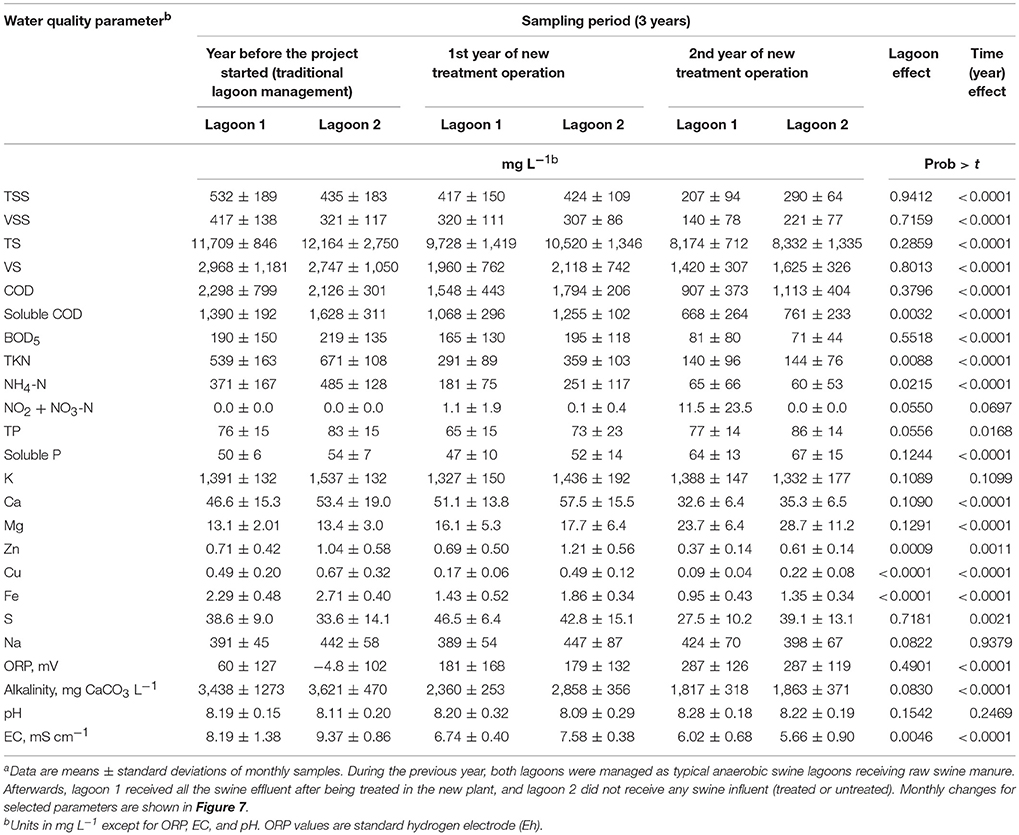
Table 3. Lagoon liquid analyses of two swine lagoons before and after implementation of new treatment system using high-rate solids separation coupled with ammonia and phosphorus treatmenta.
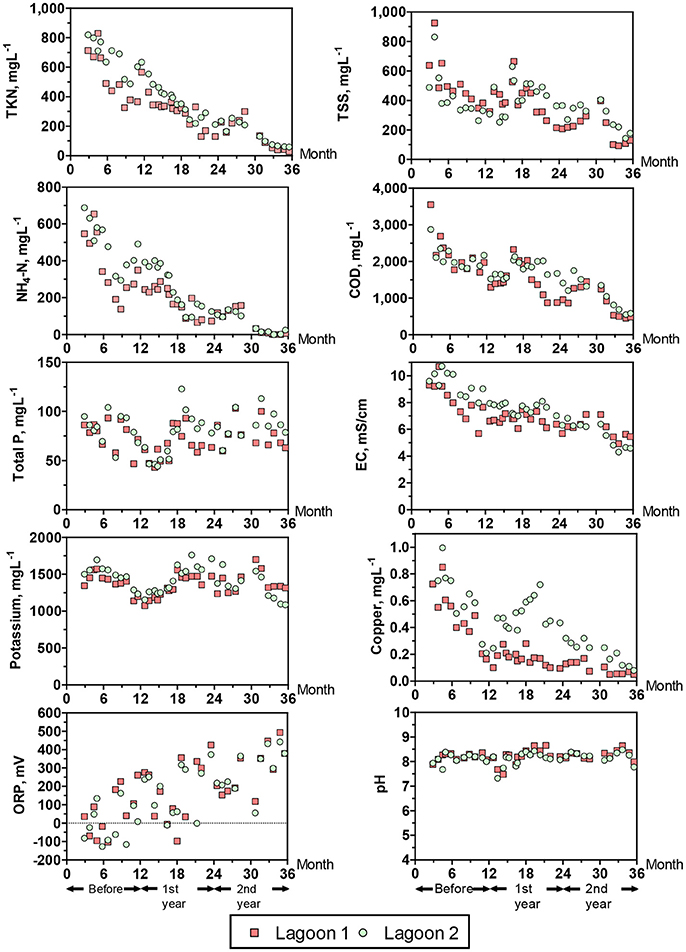
Figure 7. Water quality changes in the two study lagoons during a 36 months period. 0–12 months = lagoons being managed as typical anaerobic swine lagoons receiving raw swine manure. Thereafter, lagoon 1 received all the swine effluent after treatment in the new plant, and lagoon 2 did not receive any swine influent (treated or untreated). Yearly averages are shown in Table 3.
Lagoon Liquid Cleanup
In month 12 of the 3 years water quality monitoring period, manure flushes to both lagoons were halted and the conventional anaerobic lagoon treatment was discontinued. At that point, lagoon 1 received all the treated effluent generated by the new wastewater treatment plant. It went from receiving raw waste from 3 barns (permitted for 2,205-head feeder-to-finish swine) to receiving treated waste from 7 barns (5,145-heads). Lagoon 2 did not receive any effluent (treated or untreated), only rainwater, and its situation resembles that of an inactive lagoon after depopulation of pigs (Sheffield, 2000). Excess water over storage capacity of the lagoons was applied onto crops and forages on the farm. Rainfall averaged 1,026 mm per year and contributed 7,500 m3 of rain water annually to each lagoon (drainage area of each lagoon was 0.634 ha) or 13,000 m3 of rainwater per lagoon in the 2 years period. Actual lagoon volumes were 9,565 ± 750 m3 (lagoon 1) and 13,057 ± 1,180 m3 (lagoon 2). Thus, rain alone renovated 70 and 50% of the total lagoon volumes per year (lagoon 1 and 2, respectively). Lagoon 1 received also the clean plant effluent, 11,552 m3 per year (31.6 m3 d−1) with a renovation capacity of 1.2 lagoon volumes per year (HRT = 0.8 years).
Statistical tests showed significant reduction with time on most water quality parameters measured in the lagoons (P < 001), an effect that was consistent across lagoons (Table 3). The exceptions were K, Na, TP, and pH, which were not significantly changed with time. In three instances when statistical differences (P < 0.01) in water quality parameters between lagoons occurred (Cu, Zn, and Fe, Table 3), the concentration decrease was quicker in lagoon 1 that received the treated water (Table 3 and Figure 7). By the second year of new treatment operation, the following average reductions in water constituents were realized in lagoon 1 (Table 3): 61% of TSS, 66% of VSS, 57% of BOD5, 74% of TKN, 82% of NH4-N, 48% of Zn, 82% of Cu, 47% alkalinity, and 26% of EC. Corresponding reductions in lagoon 2 (inactive) were: 33% of TSS, 31% of VSS, 68% of BOD5, 79% of TKN, 88% of NH4-N, 41% of Zn, 67% of Cu, 49% alkalinity, and 40% of EC. Therefore, when multistep EST treatment technology is implemented in a swine operation with anaerobic lagoons, an additional environmental benefit is obtained: the progressive cleanup of the lagoon liquid without having to stop production. Even though lagoon 1 served the production of more than twice the number of animals than it did before with the traditional lagoon system (average LAW increased from 144 to 336 Mg), remarkably, the overall cleaning performance of the new plant effluent on lagoon 1 liquid was similar to the cleaning performance by rainwater alone under lagoon inactivation and abandonment of production (lagoon 2). Indeed, the results of this study were used by the State Permitting Authority to issue Permit No AWI820164 using the innovative animal waste management system that would allow the expansion of total swine animal capacity in this farm from 5,145 to 11,015 feeder-to-finish using the same acreage (12.9 ha).
The NH4-N concentration in the lagoons before the project started were 371 ± 167 mg L−1 in lagoon 1 and 485 ± 128 mg L−1 in lagoon 2 (Table 3). During the last 6 months the NH4-N concentrations were very low: 10.0 ± 11.9 mg L−1 in lagoon 1 and 14.9 ± 12.5 mg L−1 in lagoon 2 (months 30–36, Figure 7); they approached average concentration of 4 mg NH4-N L−1 reported for 30 lagoons in swine operations in North Carolina that were depopulated and inactive for 6 ± 4 years (Sheffield, 2000). In a companion paper, Ro et al. (2018) measured the ammonia emissions from this project including lagoons using open-path tunable diode laser and found that the ammonia emissions were reduced to below detectable levels. Another important parameter is the effect on EC (water salinity) that is an important water quality guideline on crop productivity, for example FAO (1994) guidelines indicate that the yield potential of irrigated cotton is reduced from 100 to 90% to 75 and 50% with irrigation water EC of 5.1, 6.4, 8.4 and 12 mS cm−1, respectively. In the study, the average EC of the lagoon liquid before the project started was 8.19–9.37 mS cm−1 in lagoon 1 and 2, respectively. The EC was lowered to 5.33 ± 0.37 and 4.51 ± 0.19 mS cm−1 during the last quarter (Figure 7), which is optimal for cotton irrigation. As clean plant effluent and/or rain water replaced the liquid in the two lagoons, they become aerobic. From the point of view of microbial metabolism, a redox potential (ORP) > 300 millivolts is associated with aerobic, oxidized conditions (Reddy et al., 2000). The transition from anaerobic to aerobic, oxidized conditions took about 1.5 years. Average ORP were −4.8 to 60 millivolts during traditional management before the project started (Table 3); they increased steadily with time to reach consistent levels > 300 millivolts in the second half of second year (months 30–36, Figure 7). In addition to these chemical indicators of aerobic conditions, in 10 months of the new manure management the lagoon 1 changed color from brown to blue (Figure 8).

Figure 8. Swine lagoon conversion into aerobic pond. Picture on the left shows Lagoon 1 under traditional management before start of the project, and picture on the right shows the same lagoon after the wastewater treatment plant (background) was in operation for about 10 months.
Changes in Sludge Accumulation in the Lagoons
Before the conversion and under traditional anaerobic lagoon management, the sludge in lagoon 1 accumulated to a depth 0.67 m (or 2,620 m3) in 11 years of continuous swine production (serving 2,205-head feeder-to-finish) and sludge in lagoon 2 accumulated to a depth of 1.25 m (volume 4,440 m3) in 12 years of continuous swine production (serving 2,940-head feeder-to-finish) (Figure 9). Therefore, the average rate of sludge accumulation in the two lagoons was 0.1170 ± 0.0127 m3 sludge/feeder-to-finish head/year. It was consistent with the sludge generation standard for NC anaerobic swine lagoons of 0.1249 m3 sludge/feeder-to-finish head/year (33 gal/animal of 135 lb/year) (AG-604, 2000).
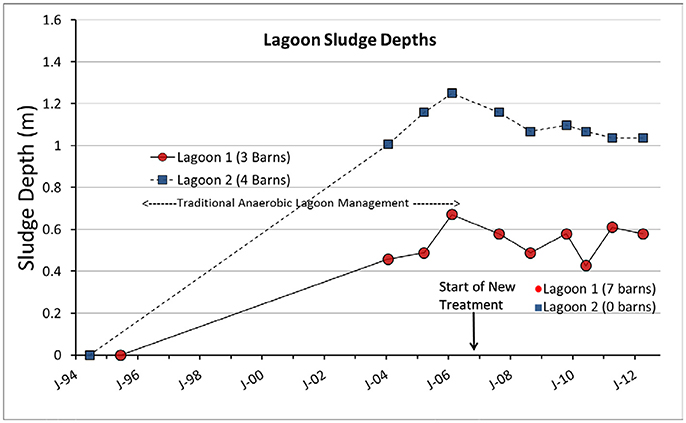
Figure 9. Sludge depth dynamics of the two swine lagoons. The new treatment plant was installed after 11–12 years of conventional anaerobic lagoon treatment.
After conversion, the sludge accumulation on both lagoons was halted (Figure 9). During the 6 years of new treatment, the sludge depth in lagoon 1 (that received all the plant effluent) did not increase; it was stabilized at a depth of about 0.55 ±0.07 m (volume = 2,100 ± 290 m3). Similarly, lagoon 2 (discontinued lagoon) did not accumulate more sludge after discontinuation; the sludge depth remained about constant at 1.08 ±0.05 m (volume = 3,750±180 m3).
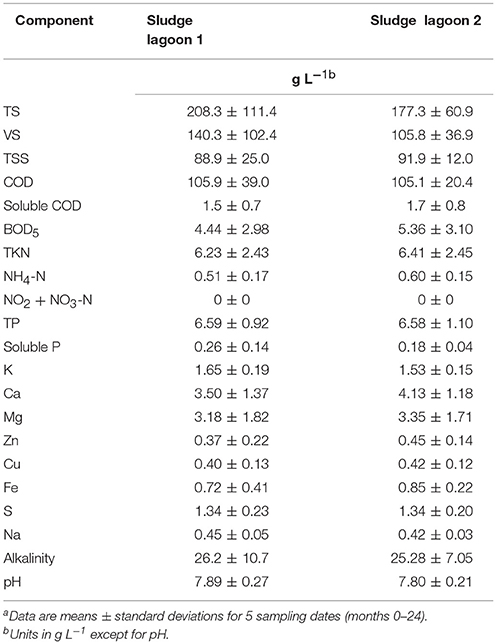
Table 4 shows the composition of the sludges in the two lagoons determined five times at the beginning of the study (months 0–24). The sludges were of mineral nature, thick, black, with tar like smell, with similar chemical composition in the two lagoons (Table 4). A salient characteristic is the large amount of P contained in the lagoon sludges. Considering sludge volume and P concentration, there were 17.2 and 29.2 metric tons of P (39.5 and 66.9 metric tons P2O5) in lagoon 1 and 2, respectively. Therefore, new technologies that could harvest the P contained in lagoon sludges could have a great impact on global P cycling. One such technology is the Quick Wash process presented in this special issue (Szogi et al., 2018). It recovered 80% of the P from swine lagoon sludges.
Conclusion
More and more often, new treatment systems for manure combine three or four process units to meet various environmental standards and recovery targets. In North Carolina, USA, construction of new swine farms or expansion of existing swine farms are required new waste management systems that can replace anaerobic lagoon treatment for the waste and meet new environmental standards of ammonia and odor emissions, pathogens release, and the substantial elimination of soil and groundwater contamination by nutrients (phosphorus and nitrogen) and heavy metals. A treatment system that met these multiple standards was implemented at full-scale in a swine farm and operated for 6 years. It combined high-rate solid-liquid separation with N and P removal processes. The treatment plant removed from the manure: 97% of TSS, 90% of VS, 99% of BOD5, 96% of TKN and NH4-N, 93% TP, 99% of Zn and Cu, 99.9% odors and 99.99% pathogens. This study determined the water quality improvements in lagoons by an innovative swine manure treatment system operating at full-scale during five pig production cycles. After conversion, the sludge accumulation in the lagoons was halted. As plant effluent or rainwater replaced the liquid in the old lagoons, they became aerobic (Eh > 300 millivolts). In 2 years, the NH4-N concentration in the lagoons liquid was reduced from the 370 to 485 to lower than 15 mg L−1. While clean water is more valuable for both environmental quality and crop production, it is significant that the treatment process transformed the lagoon's water from a constituent-laden legacy condition to relatively cleaner water. Moreover, the transformation was accomplished while doubling the number of animals.
Author Contributions
The author MV has designed and conducted the full-scale project, performed data summarization, and written the manuscript. KR measured ammonia emissions. AS assisted with water quality work. JL did odor quantification. PM did the pathogen assessment.
Funding
This research was part of USDA-ARS National Program 212: Soil and Air; ARS Project 6082-12630-001-00D Improvement of Soil Management Practices and Manure Treatment/Handling Systems of the Southern Coastal Plain. The research was partially funded by the North Carolina Department of Justice, Office of the Attorney General through the Smithfield Foods Environmental Enhancement Fund Grant Agreement, USDA-ARS Project 6657-13630-003-04/NCSU Subcontract #2005-0978-03.
Conflict of Interest Statement
The authors declare that the research was conducted in the absence of any commercial or financial relationships that could be construed as a potential conflict of interest.
Acknowledgments
The treatment system was constructed and operated by Terra Blue Inc. of Clinton, NC. We acknowledge the field and laboratory assistance of Aprel Ellison and William Brigman, USDA-ARS, Florence, SC, and the lagoon sludge sampling assistance of Diana Rashash, North Carolina Extension Service/North Carolina State University. Mention of trade names or commercial products in this article is solely for the purpose of providing specific information and does not imply recommendation or endorsement by the U.S. Department of Agriculture.
References
15A NCAC 02T (2010). Swine Waste Management System Performance Standards. Available online at: http://reports.oah.state.nc.us/ncac/title%2015a%20-%20environmental%20quality/chapter%2002%20-%20environmental%20management/subchapter%20t/15a%20ncac%2002t%20.1307.pdf (Accessed July 17, 2018).
AG-604 (2000). Sludge Management and Closure Procedures for Anaerobic Lagoons, eds R. E. Sheffield, J. C. Barker, and Shaffer, Raleigh, NC: Publication NCCES AG-604, NC State University and A&T State University Cooperative Extension.
Aneja, V. P., Pal Arya, S. S., Kim, D., Rumsey, I. C., Arkinson, H. L., Semunegus, H., et al. (2008). Characterizing ammonia emissions from swine farms in Eastern North Carolina: Part 1-conventional lagoon and spray technology for waste treatment. J. Air Waste Manage. Assoc. 58, 1145–1157. doi: 10.3155/1047-3289.58.9.1145
APHA (1998). Standard Methods for the Examination of Water and Wastewater. Washington, DC: American Public Health Association
Barker, J. C. (1996a). Lagoon Design and Management for Livestock Waste Treatment and Storage. Pub. No. EBAE 103-83. Raleigh, NC: North Carolina Cooperative Extension Service.
Barker, J. C. (1996b). Swine Production Facility Manure Management: Pit Recharge- Lagoon Treatment. Pub. No. EBAE 128.88. Raleigh, NC: North Carolina Cooperative Extension Service.
Bernet, N., and Béline, F. (2009). Challenges and innovations on biological treatment of livestock effluents. Bioresour. Technol. 100, 5431–5436. doi: 10.1016/j.biortech.2009.02.003
Bicudo, J. R., Safley, L. M., and Westerman, P. W. (1999). Nutrient content and sludge volumes in single-cell recycle anaerobic swine lagoons in North Carolina. Trans. ASAE 42, 1087–1093.
Chastain, J. P. (2013). Solid-liquid Separation Alternatives for Manure Handling and Treatment. USDA-NRCS Publication. Available online at: http://www.extension.org/pages/67673/overview-of-solid-liquid-separxation-alternatives-for-manure-handling-and-treatment-document#.UhvZzl_D9D8
Chastain, J. P., Camberato, J. J., Albrecht, J. E., and Adams, J. (1999). “Swine manure production and nutrient content,” in South Carolina Confined Animal Manure Managers Certification Program, eds J. E. Albrecht, J. J. Camberato, J. P. Chastain, J. Adams, B. Smith, S. Henry, W. R. English, and C. J. Sherman (Clemson University), Chapter 3, 1–17.
Chastain, J. P., Vanotti, M. B., and Wingfield, M. M. (2001). Effectiveness of liquid-solid separation for treatment of flushed dairy manure: a case study. Appl. Engr. Agric. 17, 343–354. doi: 10.13031/2013.6210
FAO (1994). Water Quality for Agriculture. 2. Salinity Problems. Available Online at: http://www.fao.org/docrep/003/t0234e/T0234E03.htm (Accessed 27 April 2018).
Gallaher, R. N., Weldon, C. O., and Boswell, F. C. (1976). A semiautomated procedure for total nitrogen in plant and soil samples. Soil Sci. Soc. Am. J. 40, 887–889. doi: 10.2136/sssaj1976.03615995004000060026x
Garcia, M. C., Vanotti, M. B., and Szogi, A. A. (2007). Simultaneous separation of phosphorus sludge and manure solids with polymers. Trans. ASABE 50, 2205–2215. doi: 10.13031/2013.24096
Garcia-González, M. C., and Vanotti, M. B. (2015). Recovery of ammonia from swine manure using gas-permeable membranes: effect of waste strength and pH. Waste Manag. 38, 455–461. doi: 10.1016/j.wasman.2015.01.021
Hjorth, M., Christensen, K. V., Christensen, M. L., and Sommer, S. G. (2010). Solid-liquid separation of animal slurry in theory and practice. Rev. Agron Sustain. Dev. 30, 153–180. doi: 10.1051/agro/2009010
Loughrin, J. H., Szogi, A. A., and Vanotti, M. B. (2006). Reduction of malodorous compounds from a treated swine anaerobic lagoon. J. Environ. Qual. 35, 194–199. doi: 10.2134/jeq2005.0035
Loughrin, J. H., Vanotti, M. B., Szogi, A. A., and Lovanh, N. (2009). Evaluation of second-generation multistage wastewater treatment system for the removal of malodors from liquid swine waste. J. Environ. Qual. 38:1739–1748. doi: 10.2134/jeq2008.0430
Mallin, M. A. (2000). Impacts of industrial animal production on rivers and estuaries. Am. Scientist 88, 26–37. doi: 10.1511/2000.1.26
NC Legislature (2007). Performance Standards for Animal Waste Management Systems That Serve Swine Farms; Lagoon and Sprayfield Systems Prohibited. NC Legislature, Enacted Legislation 143-215.10I. Available online at: https://www.ncleg.net/EnactedLegislation/Statutes/pdf/BySection/Chapter_143/GS_143-215.10I.pdf(verified 27 April 2018).
NRCS (2004). Waste Treatment Lagoon. USDA-NRCS Conservation Practice Standard Code 359. NRCS Colorado. Available online at: https://efotg.sc.egov.usda.gov/references/public/CO/CO359std8-04.pdf
Peters, J. (2003). “Unit III 5.5: digestion and dissolution methods for P, K, Ca, Mg and trace elements,” in Recommended Methods of Manure Analysis (A3769), ed J. Peters (Wisconsin: University of Wisconsin –Madison).
Reddy, K. R., D'Angelo, E. M., and Harris, W. G. (2000). “Biogeochemistry of wetlands,” in Handbook of Soil Science, ed M. E. Sumner (Boca Raton, FL: CRC Press), G89–G119.
Riaño, B., and García-González, M. C. (2014). On-farm treatment of swine manure based on solid-liquid separation and biological nitrification-denitrification of the liquid fraction. J. Environ. Manage. 132, 87–93. doi: 10.1016/j.jenvman.2013.10.014
Ro, K. S., Vanotti, M. B., Szogi, A. A., Loughrin, J. H., and Millner, P. D. (2018). High-Rate solid-liquid separation coupled with nitrogen and phosphorus treatment of swine manure: effect on ammonia emissions. Front. Sustain. Food Syst. 2. doi: 10.3389/fsufs.2018.00049
Schiffman, S. S., and Williams, C. M. (2005). Science of odor as a potential health issue. J. Environ. Qual. 34, 124–138. doi: 10.2134/jeq2005.0129
Sheffield, R. E. (2000). Sludge and Nutrient Assessment of Inactive Lagoons in North Carolina. ASAE Paper No. 00-4121. St. Joseph, MI: American Society of Agricultural Engineers.
Sobsey, M. D., Khatib, L. A., Hill, V. R., Alocilja, E., and Pillai, S. (2001). “Pathogens in animal wastes and the impacts of waste management practices on their survival, transport and fate,” in White Papers on Animal Agriculture and the Environment, eds J. M. Rice, D. F. Caldwell, and F. J. Humenik (Ames, IA: MidWest Plan Service (MWPS), Iowa State University), 609–666. doi: 10.13031/2013.20268
Sommer, S. G., Oenema, O., Matsunaka, T., and Stoumann Jensen, L. (2013). “Regulations on animal manure management,” in Animal Manure Recycling, 1st Edn., eds S. G. Sommer, M. L. Christensen, T. Schmidt, and L. Stoumann Jensen (West Sussex: John Wiley & Sons, Ltd.), 25–40.
Szogi, A. A., Vanotti, M. B., and Shumaker, P. D. (2018). Economic recovery of calcium phosphates from swine lagoon sludge using Quick Wash process and geotextile filtration. Front. Sustain. Food Syst. 2:37. doi: 10.3389/fsufs.2018.00037
Tchobanoglous, G., Burton, F. L., and Stensen, H. D. (2003). Wastewater Engineering Treatment and Reuse, 4th Edn. New York, NY: McGraw-Hill: Metcalf and Eddy, Inc.
Technicon Instruments Corp (1977). Individual/Simultaneous Determination of Nitrogen and/or Phosphorus in BD ACID DIGESTS (DIALIZER). Industrial Method 337-74W/B. Tarrytown, NY: Technicon Instruments Corp.
Vanotti, M. B., and Hunt, P. G. (1999). Solids and nutrient removal from flushed swine manure using polyacrylamides. Trans. ASAE 42, 1833–1840. doi: 10.13031/2013.13347
Vanotti, M. B., Millner, P. D., Hunt, P. G., and Ellison, A. Q. (2005). Removal of pathogen and indicator microorganisms from liquid swine manure in multi-step biological and chemical treatment. Bioresour. Technol. 96, 209–214. doi: 10.1016/j.biortech.2004.05.010
Vanotti, M. B., Millner, P. D., Szogi, A. A., Campbell, C. R., and Fetterman, L. M. (2006). Aerobic Composting of Swine Manure Solids Mixed With Cotton Gin Waste. ASABE Paper No. 064061. St. Joseph, MI: American Society of Agricultural and Biological Engineers.
Vanotti, M. B., Rashash, D. M. C., and Hunt, P. G. (2002). Solid-liquid separation of flushed swine manure with PAM: effect of wastewater strength. Trans. ASAE 45, 1959–1969. doi: 10.13031/2013.11422
Vanotti, M. B., and Szogi, A. A. (2008). Water quality improvements of wastewater from confined animal feeding operations after advanced treatment. J. Environ. Qual. 37, S86–S96. doi: 10.2134/jeq2007.0384
Vanotti, M. B., Szogi, A. A., and Ducey, T. F. (2013). High Performance Nitrifying Sludge (HPNS) for High Ammonium Concentration and Low Temperature Wastewater Treatment. U.S. Patent No. 8,445,253. Washington, DC: Patent and Trademark Office.
Vanotti, M. B., Szogi, A. A., and Fetterman, L. (2010). Wastewater Treatment System With Simultaneous Separation of Phosphorus Sludge and Manure Solids. U.S. Patent No. 7,674,379. Washington, DC: Patent and Trademark Office.
Vanotti, M. B., Szogi, A. A., and Hunt, P. G. (2003). Extraction of soluble phosphorus from swine wastewater. Trans. ASAE 46, 1665–1674. doi: 10.13031/2013.15637
Vanotti, M. B., Szogi, A. A., Millner, P. D., and Loughrin, J. H. (2009). Development of a second-generation environmentally superior technology for treatment of swine manure in the USA. Biores. Technol. 100, 5406–5416. doi: 10.1016/j.biortech.2009.02.019
Westerman, P. W., Arogo Ogejo, J., and Grabow, G. L. (2010). Swine anaerobic lagoon nutrient concentration variation with season, lagoon level, and rainfall. Appl. Eng. Agric. 26, 147–152. doi: 10.13031/2013.29472
Keywords: water quality, solid-liquid separation, flocculants, nutrient recovery, swine lagoons, pig manure, nitrification, recovered calcium phosphate
Citation: Vanotti MB, Ro KS, Szogi AA, Loughrin JH and Millner PD (2018) High-Rate Solid-Liquid Separation Coupled With Nitrogen and Phosphorus Treatment of Swine Manure: Effect on Water Quality. Front. Sustain. Food Syst. 2:49. doi: 10.3389/fsufs.2018.00049
Received: 09 May 2018; Accepted: 25 July 2018;
Published: 16 August 2018.
Edited by:
Raul Moral, Universidad Miguel Hernández de Elche, SpainReviewed by:
Albert Magrí, Universitat Politecnica de Catalunya, SpainMarie-Line Daumer, Institut National de Recherche en Sciences et Technologies pour l'Environnement et l'Agriculture (IRSTEA), France
Copyright © 2018 Vanotti, Ro, Szogi, Loughrin and Millner. This is an open-access article distributed under the terms of the Creative Commons Attribution License (CC BY). The use, distribution or reproduction in other forums is permitted, provided the original author(s) and the copyright owner(s) are credited and that the original publication in this journal is cited, in accordance with accepted academic practice. No use, distribution or reproduction is permitted which does not comply with these terms.
*Correspondence: Matias B. Vanotti, bWF0aWFzLnZhbm90dGlAYXJzLnVzZGEuZ292
 Matias B. Vanotti
 Kyoung S. Ro
 Ariel A. Szogi
 John H. Loughrin
 Patricia D. Millner