 Kyoung S. Ro
 Matias B. Vanotti
 Ariel A. Szogi
 John H. Loughrin
 Patricia D. Millner3
- 1Coastal Plains Soil, Water and Plant Research Center (USDA-ARS), Florence, SC, United States
- 2Food Animal Environmental Systems Research (USDA-ARS), Bowling Green, KY, United States
- 3Environmental Microbial & Food Safety Lab (USDA-ARS), Beltsville, MD, United States
A new treatment system was developed to meet multiple environmental performance standards including to substantially reduce ammonia emissions. It was tested full-scale for 2-years in a 5,145-head finishing swine farm with two anaerobic lagoons. The system combined high-rate solid-liquid separation with nitrogen and phosphorus removal processes. Both vertical radial plum mapping (VRPM) and floating static chamber techniques were used to measure NH3 emission fluxes from anaerobic storage lagoons and the total farm-level NH3 emission rates. The VRPM used an open-path tunable diode laser absorption spectroscopy (TDL) and the flux chamber used a photoacoustic gas analyzer to accurately measure NH3 concentration. After the treatment system started, one of the two lagoons became inactive without receiving anymore flushed manure. The ammonia emission flux from the other lagoon with the treated effluent decreased from 43.9 to 6.8 kg-N ha−1 d−1 1.5 years after implementation of the new treatment system. The NH3 emission flux from the inactive lagoon also decreased similarly because the already stored old manure of the lagoon prior to inactivation was diluted with rainfalls and lost some NH3 via volatilization. The total farm-level NH3 emission rates decreased from 1.72 g s−1 to below detection level of the VRPM technique. Using the minimum detection level of the TDL with R2 > 90% (i.e., 8.1 8.1 μL L−1-m), the total farm-level NH3 emission rates in the second year were less than 0.04–0.15 g s−1. These results suggested that the impact of the new treatment system on NH3 emission reduction was equivalent to closing conventional swine lagoons while actively growing 5,145 pigs with minimal ammonia emissions from the farm.
Introduction
Ammonia (NH3) is an important fugitive gas mostly emitted from livestock operations in the United States (Doorn et al., 2002; Ro et al., 2017). Ammonia, a precursor of nitrate due to microbial nitrification/denitrification, causes acidification of both soil and surface water, and eutrophication in water bodies. It is also a principal source of atmospheric aerosols. Anaerobic lagoons are being widely utilized in the southeastern U.S. for storage and treatment of manure from confined swine production operations. The anaerobic treatment reduces the organic load of liquid manures but releases inorganic nitrogen as ammonia. Thus, ammonia emission from the lagoons is of environmental and health concerns in geographic areas with very intense confined swine production (Barker, 1996; Aneja et al., 2000; McCubbin et al., 2002; Szogi et al., 2006; Blunden and Aneja, 2008; Westerman et al., 2010). Addressing the environmental and health issues caused by ammonia emissions and potential contamination of water bodies with swine manure effluents Vanotti et al. (2010), developed an on-farm wastewater treatment system and demonstrated its high efficacy to meet multiple environmental performance standards (Vanotti et al., 2009) on a 5,145-head swine finishing farm. The multi-stage treatment system used solid separation, nitrification-denitrification, and phosphorous removal/disinfection processes. The new treatment system replaced the conventional anaerobic treatment lagoons of a swine farm and improved lagoon water quality dramatically. The treatment system removed 97% of total suspended solids (TSS), 99% of biochemical oxygen demand (BOD), 93% of total phosphorous (TP), 96% of total Kjeldahl nitrogen (TKN), and ammoniacal nitrogen (NH4-N) from the manure (Vanotti et al., 2018).
Although the new treatment system significantly improved the lagoon water quality (Vanotti et al., 2018) and reduced odors (Loughrin et al., 2009), its impact on ammonia (NH3) emission had not been reported. The improved lagoon water quality would directly impact the NH3 emissions from the lagoon and the animal houses using the cleaner plant-treated water for flushing manure (Szogi et al., 2006; Ro et al., 2008). Therefore, it is of great interest to assess the NH3 emission reduction from the whole swine farm utilizing the new second-generation manure treatment system.
Micrometeorological techniques such as the integrated horizontal flux (IHF) and the backward Lagrangian stochastic (bLS) dispersion techniques can be used to measure the total ammonia emission from a swine farm. Although the bLS technique has shown its high accuracy in measuring gas emissions from point and distributed emission sources (Ro et al., 2009, 2011, 2013, 2014), one of the concerns for the use of the bLS technique in measuring emissions from a real farm with a variety of structures (buildings, stand pipes, etc.) is its underlying assumption of idealized wind flow over flat and homogenous terrain. The wind disturbance caused by farm building structures can be minimized by measuring downwind concentrations further downwind distance from the farm such as 10 times the height of the buildings (Flesch et al., 2005). However, measuring downwind concentration at longer distances from an emission source may not be feasible for certain conditions due to limited open space or dilution of emitted gas concentration below the detection limit of an analytical technique.
In contrast, the IHF technique, a mass-balance based method, is not very sensitive to changes in wind turbulence, which can used to measure an average gas emission rate of a large area (Wilson et al., 1983). The U.S. Environmental Protection Agency published the vertical radial plum mapping (VRPM) technique based on the IHF principles as Other Test Method 10 (OTM−10) in measuring fugitive gas emission rates from closed landfills (EPA, 2005). The VRPM technique estimates the horizontal flux of gas passing downwind of the emission source based on measured wind speed profiles and path integrated concentrations (PICs) (Ro et al., 2009, 2011; Viguria et al., 2015). The VRPM utilizes a bivariate Gaussian smooth basis function minimization (SBFM) to reconstruct a crosswind-smoothed mass-equivalent concentration map in a vertical plane from the downwind PIC data. Once all parameters for the bivariate Gaussian function are measured for a specific run, the VRPM procedure calculates the mass-equivalent concentration values for every square elementary unit (4 × 4 m) in a vertical plane. Then, the VRPM procedure computes and integrates the elementary unit flux over the entire vertical plane with corresponding wind speed data. Arcadis Inc. (Research Triangle Park, NC) developed the computer-based VRPM software which automatically calculates the emission rates based on the downwind PIC data, wind speed and direction information using the VRPM algorithm.
The objective of this study was to measure the ammonia emissions from the 5,145-head swine finishing farm with the new on-farm manure treatment system during a 2-year evaluation using the VRPM technique.
Materials and Methods
Farm Description
The total NH3 emissions from a finishing swine farm in North Carolina with a full-scale manure treatment system were measured from December 2006 to September 2008. The farm had seven swine houses with a permitted capacity of 5,145 head feeder to finish (735 head/barn). Two traditional anaerobic lagoons were used for about 11 years before the new manure treatment plant started operation in December 2006. With the new treatment system, the flushing of raw wastewater into the lagoons was discontinued. The treatment system consisted of three process units in series: polymer-enhanced solid-liquid separation, biological N removal, and alkaline phosphorus extraction and disinfection. More detailed description of the new manure treatment system and the farm operation can be found elsewhere (Vanotti et al., 2018).
Open-Path Tunable Diode Laser Absorption Spectroscopy
An open-path tunable diode laser absorption spectrometer (TDL; GasFinder2.0 for NH3, Boreal Laser Inc., Edmonton, AB, Canada) was used to measure path-integrated concentrations (PICs) of NH3. The TDL mounted on an automatic positioning device (APD; Model 20 Servo, Sagebrush Technology, Inc., Albuquerque, NM) emits a collimated beam (1,512 nm) aimed at distant three mirrors (retroreflectors) from which it is reflected to the TDL's detector. The TDL was designed for a sampling rate of about 1 Hz and had continuous internal calibration updates every 40 samples using an internal reference cell. The signal from the measurement path is compared with the signal from the internal reference cell and calculate the average gas concentration in the path as μL L−1-m (i.e., μL L−1 multiplied by path length in m). The TDL also calculates the coefficient of determination (R2) for each measurement to indicate the similarity between the waveform of the sample gas to that of the reference cell gas. A perfect match of the two waveforms would give R2 of 1.0, and total mismatch would give R2 of 0.0. Although the company recommends 5 μL L−1-m as the minimum detection limit (MDL) for NH3, we decided to determine the MDL for our TDL that would yield R2 > 90%. Determining the reliable value of MDL was important because the new manure treatment system dramatically improved the lagoon water quality and the NH3 emission was so low that the path-integrated NH3 concentrations measured with our TDL became at or below the MDL during the second year of the manure treatment operation in 2008.
The MDL of our TDL was determined by measuring PICs through a 4.5-m PVC pipe (5.1 cm diameter) in which 3 L min−1 of a mixture of pure N2 and calibrated NH3 gas (5.0 ppm, National Welders Supply Co., Inc., NC) flew through the PVC pipe. The two ends of the PVC pipe were sealed with transparent plastic film. Initially the PVC was filled with ultra-pure nitrogen gas (National Welders Supply Co., Inc.). Using a gas divider (SGD-710C, Horiba STEC, Sunnyvale, CA), gas mixtures of 10% NH3 + 90% N2 (0.5 μL L−1-m NH3), 30% NH3 + 70% N2 (1.5 μL L−1-m NH3), 50% NH3 + 50% N2 (2.5 μL L−1-m NH3), 70% NH3 + 30% N2 (3.5 μL L−1-m), and 100% NH3 (5.0 μL L−1-m) were introduced into the PVC pipe. The measured PICs and the corresponding R2-values were plotted as shown in Figure 1. We also plotted the average NH3 PICs at different R2-values (Figure 2). The average PIC was 5.3 μL L−1-m at R2 of 80% (Figure 2), which was similar to the NH3 MDL (5.32 μL L−1-m) reported by the U.S. Environmental Protection Agency's (EPA's) Environmental Technology Verification (ETV) statement (Myers et al., 2000). The MDL with R2 of 90% was 8.1 μL L−1-m. We used the MDL of 8.1 μL L−1-m, when we observed the NH3 PICs were below MDL during the second year of the new manure treatment system in 2008, to calculate the MDL for the VRPM NH3 emission rate determination.
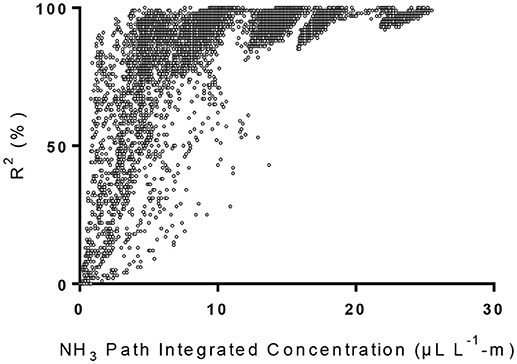
Figure 1. Individual NH3 path integrated concentrations (PICs) with associated R2.
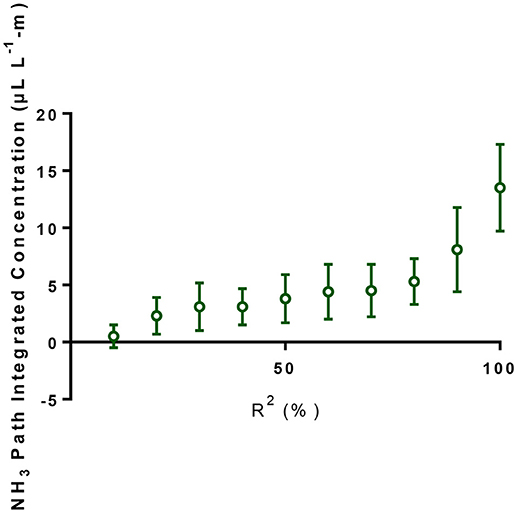
Figure 2. Average NH3 path integrated concentrations at desired R2.
Total NH3 Emission Rate Measurements Using the VRPM Technique
Total NH3 emission rates from the swine farm (animal houses, lagoons, and the wastewater treatment system) were measured using the VRPM technique. The VRPM technique utilized the TDL mounted on the APD to measure downwind NH3 PICs with 3 distant retroreflectors, one positioned at ground-level and the other two mounted on a weather station mast (10 or 20 m height). The upwind NH3 concentrations were measured with a photoacoustic gas analyzer (INOVA, California Analytical, Orange, CA). The ranges of path lengths and the heights of the three retroreflectors are shown in Table 1. The path length between the TDL and the retroreflectors ranged from 129 to 266 m. The VRPM system was positioned downwind from the farm on a vertical plane, approximately perpendicular to the mean wind direction. The wind directions were mostly NNW or NNE. Figure 3 shows the VRPM setup with the vertical plane approximately perpendicular to the NNE wind. The APD sequentially directed the infrared collimated beam of the TDL to each retroreflector. At each retroreflector, the TDL collected about 12–15 downwind PIC datasets before moving to the next position. Two cup anemometers (CS800-L Climatronics Wind Speed and Direction Sensor, Campbell Scientific, Logan, UT) mounted on the weather station mast at 2 and 10 m heights continuously measured wind speed and direction information during the emission monitoring campaigns.
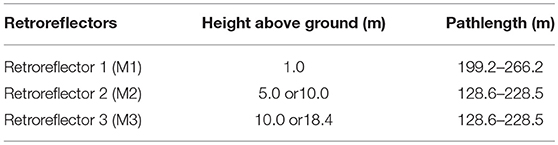
Table 1. Retroflector positions.
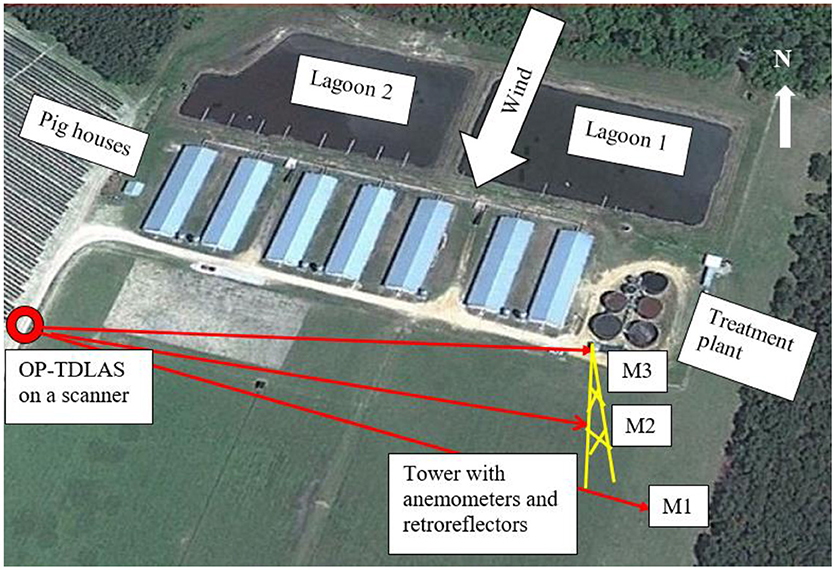
Figure 3. VRPM beam geometry for NNE wind (M1, retroreflector 1 m above ground; M2, retroreflector at 5–10 m above ground; M3, retroreflector at 10–18.4 m above ground).
The post-data filtering criteria recommended by the USEPA OTM−10 were used to remove error-prone data: concordance factor (CCF) > 0.8 (except when estimating the below minimum detection level emission rates with all PICs assuming to have the MDL of 8.1 μL L−1-m) and the mean wind direction between −10o and +25o from perpendicular to the vertical optical plane. After filtering data with the above criteria, the relative accuracies (calculated emission rate/actual emission rate) of the VRPM technique were 1.23 ± 0.17 (i.e., 23% over the actual emission rate) and 0.97 ± 0.44 (i.e., 3% less than the actual emission rate) for multi land emission sources and lagoon emission, respectively (Ro et al., 2011; Viguria et al., 2015).
Lagoon Emission
In addition to the VRPM technique for measuring whole farm NH3 emission rates, the lagoon emissions were further verified using floating chamber techniques to compare the emission fluxes before and after the new treatment system reaching its steady state condition. The lagoon NH3 emission fluxed were measured on June 18, 2007 while the treatment system was still under a startup period and on July 24, 2008 when the new treatment system was operating steady state.
Floating Static Chamber System
The static flux chamber was made of polyvinyl chloride (PVC) pipe (15.2 cm diameter and 29.8 cm length) one end sealed with an endcap. It was placed at the center of a 50.8 cm square foam sheet (thickness of 5.1 cm) to float on the lagoon water surface. The system was designed to submerge 11 cm of the PVC pipe under water to achieve a complete seal of the chamber headspace. The headspace gas was pulled from the chamber through Teflon tubing to the photoacoustic gas analyzer positioned at the bank of the lagoon and the analyzed gas was recirculated back to the chamber, thereby achieving well mixed condition inside the chamber. The floating flux chamber was launched into the lagoon at about 10 m away from the bank. The lagoon NH3 emission was measured from 6 (3 points in each lagoon in 2007) to 10 (4 points in Lagoon 1 and 6 points in Lagoon 2 in 2008) different locations of the lagoons. After the treatment system started, Lagoon 2 became inactive without receiving anymore flushed manure from the pig houses. Instead, all manure flushed from the houses was treated first by the new treatment system and the treated effluent was stored in Lagoon 1 before use in crop irrigation. The increase in headspace NH3 concentration was measured every 0.5–1 min with the photoacoustic gas analyzer for 10 min. The time-series headspace NH3 concentration data were then used to calculate emission fluxes.
The NH3 emission flux was calculated by fitting the time-series headspace NH3 concentration data to a theoretical equation derived from performing a mass balance around the chamber. Assuming that the chamber is completely mixed and sealed, NH3 mass balance around the chamber gives
Where
C = bulk headspace NH3 concentration (mg m−3),
CS = NH3 concentration at the water surface (mg m−3),
d = mixing height of the flux chamber (m2)
= Ad/V
Ad = water surface area (m2),
V = headspace volume (m3),
k = mass transfer coefficient (m min−1),
t = time (min),
Integrating Equation (1) gives
Where CO = initial headspace concentration (mg m−3).
Instead of assuming initial concentration of ambient concentration, all three parameters (i.e., CS, CO, and k) were estimated simultaneously via non-linear regression analysis of the time-series headspace NH3 concentration data using GraphPad Prism 7.03 (GraphPad Software, Inc., La Jolla, CA). This simultaneous regression of multi-parameters were recommended by the American Society of Civil Engineers (ASCE) in estimating oxygen transfer efficiency with the similar equation (ASCE, 1992). These three parameters estimated from fitting the time-series NH3 concentration data to Equation (2). were then used to calculate the instantaneous flux (J) as time approached zero:
Statistical Analysis
The central tendency and precision of measurements were presented with arithmetic averages and standard deviations (given as ± values). All statistical parameters, analyses of variance (ANOVA) tests, and multi-regression analyses were obtained/performed using GraphPad Prism 7.03.
Results and Discussion
Ammonia Emission Flux From Lagoons Using Floating Static Flux Chamber Technique
The increases in static flux chamber headspace NH3 concentration with time at 6 (6/18/2007) and 10 (7/24/2008) different locations of the two lagoons and average NH3 fluxes from each lagoon are shown in Figure 4 and Table 2. Ammonia fluxes from the two lagoons ranged from 14.4 to 78.8 kg-N ha−1 d−1 with an average flux of 32.8 ± 24.2 kg-N ha−1 d−1 in 2007 (Table 2). These NH3 emission fluxes were comparable to that from conventional swine lagoons without any manure treatment during summer months as reported in the literature (Arogo et al., 2003). It also indicated that the new treatment system had not yet been effective in reducing NH3 emission from the lagoon 1 receiving treated effluent. Therefore, we decided to discontinue the VRPM monitoring of whole farm NH3 emission rates until the new treatment system reached steady state and impacted NH3 emission from the farm.
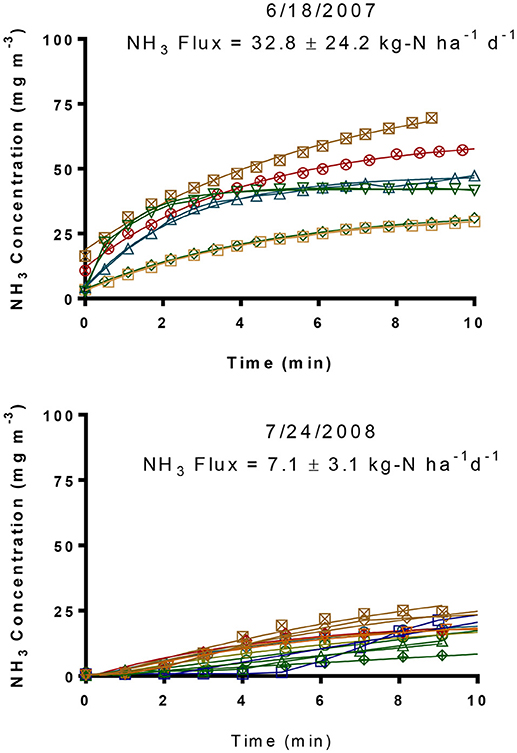
Figure 4. Floating flux chamber headspace NH3 concentrations from two treatment lagoons in summer 2007 and 2008.
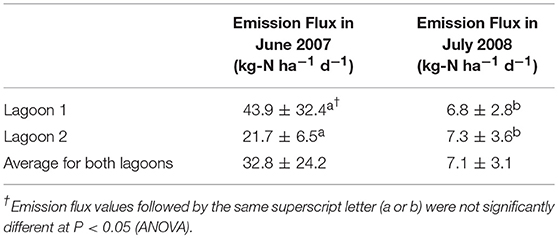
Table 2. NH3 emission fluxes from the two lagoons.
Figure 4 (bottom) shows that the flux-chamber time-series headspace ammonia concentrations increased to less than 25 mg L−1 after the chamber was deployed. In contrast, the NH3 concentrations increased to 75 mg L−1 10 min after deployment, indicating much higher emission fluxes in 2007 than in 2008. The NH3 emission fluxes from the two lagoons ranged from 1.9 to 11.0 kg-N ha−1 d−1 with an average flux of 7.1 kg-N ± 3.1 kg-N ha−1 d−1. The average NH3 emission fluxes were 6.8 ± 2.8 kg-N ha−1 d−1 from Lagoon 1 and 7.3 ± 3.6 kg-N ha−1 d−1 from the inactive Lagoon 2. The significant decrease in NH3 emission fluxes resulted from improving lagoon water quality by the new treatment system for Lagoon 1. The NH3 emission flux from Lagoon 2 also decreased because the already stored old manure of the Lagoon 2 prior to inactivation was diluted with rainfalls and lost some NH3 via volatilization. The decrease in NH3 emission flux was further validated by the fact that the total ammoniacal N (TAN) of the lagoon liquid in June 2007 was 197 mg L−1 [or 20.0 mg L−1 NH3(aq)-N] while that in July 2008 was only 32.7 mg L−1 {32.5 and 33.0 mg L−1 TAN [or 5.1 and 2.8 mg L−1 NH3(aq)-N] for Lagoons 1 and 2, respectively} (Vanotti et al., 2018). These results suggested that the impact of the new treatment system on NH3 emission reduction was equivalent to closing conventional swine lagoons while actively growing 5,145 pigs.
Whole Farm Ammonia Emission Reduction With the VRPM Technique
The NH3 emission rates, measured with the VRPM technique, were the whole-farm emission rate that included three main NH3 sources: (1) the NH3 emissions from seven animal houses, (2) the new wastewater treatment system, and (3) the two lagoons (Figure 3). These NH3 emissions rates were measured from 12/7/2006 to 9/17/2008 (Table 3 and Figure 5). The start date (12/7/2006) was a day before the start date of the new wastewater treatment system. The NH3 emission rate on 12/7/2006 was 0.80 g/s. However, 3 months after starting the new treatment system, the NH3 emission rate increased to 2.64 g/s, because the air temperature along with the wind speed were much higher. In addition, it was too short period of time to observe the impact of the new treatment system on lagoon water quality (the lagoon renovation capacity with treated effluent was 1.2 lagoon volumes per year or hydraulic residence time, HRT = 0.8 years). After observing the NH3 emission flux from the lagoons was comparable to that from conventional swine lagoons without any treatment (Figure 4 top), NH3 emission rate was not measured for the rest of 2007 to give more time for the new manure treatment system fully impacting the total farm emission. In 2008, NH3 emission rates were monitored in relatively cold (4/4/2008), mild (9/16–9/17/2008), and hot days (7/24/2008 and 8/20/2008). Regardless the the wide variation of air temperatures and wind speeds, in the second year, downwind NH3 PICs were all below the MDL (i.e., 8.1 μL L−1-m) of TDL. Below-detection-limit emission rates of these days were estimated by assuming all PICs had the MDL concentration of 8.1 μL L−1-m (Table 3). These below-detection emission rate ranges from 0.04 to 0.15 g/s, more than an order of magnitude lower the initial emission rates. These data clearly demonstrated that the new treatment system substantially reduced the NH3 emission from the swine farm.
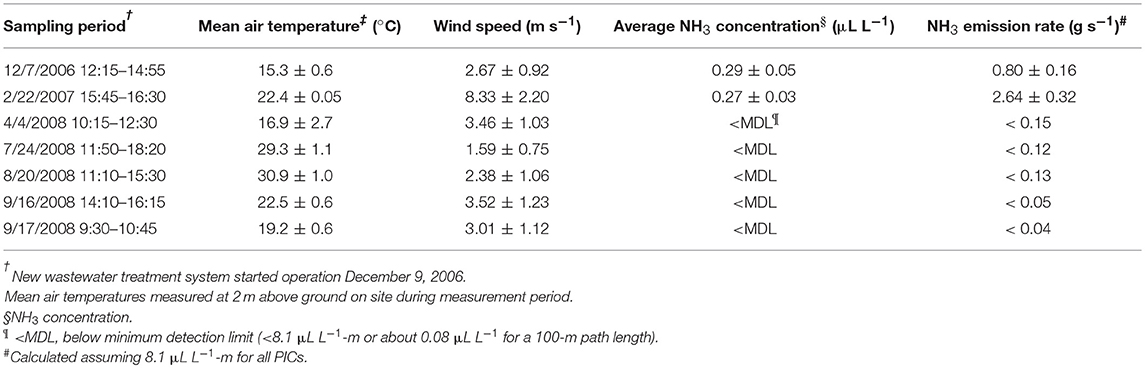
Table 3. Summary of temperatures, wind speed, and NH3emission rates from the swine farm.
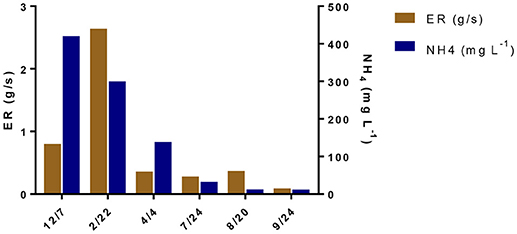
Figure 5. Ammonia emission rates and corresponding total ammoniacal concentrations of the lagoons.
The NH3 emissions rates obtained prior and during initial operation of the new wastewater treatment in this full-scale study were compared to emissions rates from other full-scale studies with conventional and converted lagoons in North Carolina. Initially with lower air and lagoon water temperatures (December 2006), the estimated live weight (LW) based emission rate of 0.80 g s−1 [1.19 kg N wk−1 (1,000 kg LW)−1] was similar to the winter combined house-lagoon NH3 emission rate of 1.06 kg N wk−1 (1,000 kg LW)−1 from a conventional swine farm with similar number of pigs for a 5,784-head finisher farm using anaerobic lagoon technology (Aneja et al., 2008a). The emission rate obtained immediately after beginning the new treatment system in February 2007 was 2.64 g s−1 [3.92 kg N wk−1 (1,000 kg LW)−1], due to very high wind speed at that day (8.33 m/s compared to 2.67 m/s in 12/7/2006) while the water temperatures were similar. The emission rate was almost linearly increased with wind speed. Note that during this initial startup period, the effects of the new treatment system on lagoon water quality were minimal.
After 1.5 years of operation the total emissions (combining animal houses, treatment plant, and lagoons) of the treatment plant were < 0.15 g s−1 [0.22 kg N wk−1 (1,000 kg LW)−1] for April 2008 (Table 3). Astonishingly, even for hot days in July and August 2008, the downwind NH3 concentrations were below its detection limit. Comparing to swine lagoon NH3 emission rates with similar water temperature of 30.2oC [2.4 kg N wk−1 (1,000 kg LW)−1, (Szogi et al., 2006)], this reduction in total NH3 emission was indeed remarkable.
Compared to the average of the first two emissions for the periods of December 2006 and February 2007 (1.72 g s−1), total NH3 emissions from the April 2008 to September 2008 periods were reduced by 94%. In comparison, the new treatment plant removed an average of 96.5% of the soluble NH4-N contained in the raw flushed manure with most of the removal (84%) occurring at the biological N treatment step (Vanotti et al., 2018). Concentrations of NH4-N in the lagoons were also reduced significantly during the emission evaluation period from 371 to 485 mg L−1 in 2006 to lower than 65 mg L−1 in 2008 (Vanotti et al., 2018).
Low NH3 emission rates similar to those recorded in 2008 were also found in earlier studies (Aneja et al., 2008b) of a first generation version of the same wastewater treatment system (Vanotti et al., 2007) that was retrofitted in a 4,360-finishers production unit and removed 98.7% of the soluble NH4 from liquid waste. According to Aneja et al. (2008b), the NH3 emissions for this first-generation wastewater treatment plant were 0.02 kg N wk−1 (1,000 kg LW)−1 in the warm season and 0.0004 kg N wk−1 (1,000 kg LW)−1 in the cold season. These low NH3 emissions represented reductions of 94.4% for the warm season and 99.0% for the cool season with respected to a conventional lagoon system (Aneja et al., 2008a). On a separate study of the same first-generation wastewater treatment system, Szogi et al. (2006) found that total annual NH3 emission from the converted lagoon was 1,210 kg N y−1 and equivalent to 0.10 kg N wk−1 (1,000 kg LW)−1. In contrast the NH3 emissions from the conventional lagoon totaled 12,540 kg N y−1 [1.22 kg N wk−1 (1,000 kg LW)−1]. Compared with the conventional lagoon, annual NH3 emissions from the converted lagoon were reduced 90% (Szogi et al., 2006).
The NH3 concentration in the air inside the houses was also reduced as a result of recycling cleaner water for pit recharge under the animal houses (Szogi and Vanotti, 2008). Compared with the previous conventional lagoon management, the new treatment system lowered NH3 concentrations in the house exhaust air by an average of 75.1%. Even though the wastewater treatment had instant effect on reducing NH3 in the manure, and the NH3 in the recycled water used for flushing the barns, the beneficial effects on emissions at the farm level were not seen immediately; the dirty liquid in the former lagoons needed time to be cleaned up. Actual lagoon 1 volume was 9,565 ± 750 m3 and received 11,552 m3 per year of the clean plant effluent (Vanotti et al., 2018). In this study, one year of continuous operation of the wastewater treatment plant was necessary to observe marked differences in NH3 emissions at the farm level.
Summary
The NH3 emissions from a 5,145-head finishing swine farm before and after the new manure treatment system implementation were measured using both micrometeorological VRPM and static chamber techniques. The NH3 emission flux from the lagoons decreased from 32.8 to 7.1 kg-N ha−1 d−1. The reduction in the total farm NH3 emission was even more dramatic: All downwind NH3 concentrations 1.5 year after starting up of the new treatment system were all below MDL. The dramatic decrease in total ammoniacal nitrogen in the lagoon validated this exceedingly low NH3 emission from the farm.
Author Contributions
KR designed and conducted the emission experiments, collected and post-processed data, and wrote the draft. MV, AS, JL, and PM conducted water quality work, data summarization and processing. All authors participated in writing of the manuscript.
Conflict of Interest Statement
The authors declare that the research was conducted in the absence of any commercial or financial relationships that could be construed as a potential conflict of interest.
Acknowledgments
This research was part of USDA-ARS National Program 212: Soil and Air; ARS Project 6082–12630-001-00D Improvement of Soil Management Practices and Manure Treatment/Handling Systems of the Southern Coastal Plain. It was partially funded by the North Carolina Department of Justice, Office of the Attorney General through the Smithfield Foods Environmental Enhancement Fund Grant Agreement, USDA-ARS Project 6657-13630-003-04/NCSU Subcontract #2005-0978-03. The authors acknowledge Mel Johnson and William Brigman, USDA-ARS Florence, SC, for assistance with field monitoring and ammonia emission measurements. Mention of trade names or commercial products in this article is solely for the purpose of providing specific information and does not imply recommendation or endorsement by the U.S. Department of Agriculture.
References
Aneja, V. P., Arya, S. P., Kim, D. S., Rumsey, I. C., Arkinson, H. L., Semunegus, H., et al. (2008a). Characterizing ammonia emissions from swine farms in Eastern North Carolina: Part 1 - conventional lagoon and spray technology for waste treatment. J. Air Wastes Manag. Assoc. 58, 1130–1144. doi: 10.3155/1047-3289.58.9.1130
Aneja, V. P., Arya, S. P., Rumsey, I. C., Kim, D.-S., Bajwa, K. S., and Williams, C. M. (2008b). Charactering ammonia emissions from swine farms in eastern North Carolina: reduction of emissions from water-holding structures at two candidate superior technologies for waste treatment. Atmos. Environ. 42, 3291–3300. doi: 10.1016/j.atmosenv.2007.08.037
Aneja, V. P., Chauhan, J. P., and Walker, J. T. (2000). Characterization of atmospheric ammonia emissions from swine waste storage and treatment lagoons. J. Geophys. Res. 105, 11535–11545. doi: 10.1029/2000JD900066
Arogo, J., Westerman, P. W., and Heber, A. J. (2003). A review of ammonia emissions from confined swine feeding operations. Trans. ASABE 46, 805–817. doi: 10.13031/2013.13597
ASCE (1992). Measurement of Oxygen Transfer in Clean Water. New York, NY: American Society of Civil Engineers.
Barker, J. C. (1996). Lagoon Design and Management for Livestock Waste Treatment and Storage. North Carolina Cooperative Extension Service.
Blunden, J., and Aneja, V. P. (2008). Characterizing ammonia and hydrogen sulfide emissions from a swine waste treatment lagoon in North Carolina. Atmos. Environ. 42, 3227–3290. doi: 10.1016/j.atmosenv.2007.02.026
Doorn, M. R. J., Natschke, D. F., Thornloes, S. A., and Southerland, J. (2002). Development of an emission factor for ammonia emissions from US swine farms based on field tests and application of a mass balance method. Atmos. Environ. 36, 5619–5625. doi: 10.1016/S1352-2310(02)00689–1
EPA (2005). OTM−10 Optical Remote Sensing for Emission Characterization from Non-Point Sources. Washington, DC: U.S. EPA.
Flesch, T. K., Wilson, J. D., and Harper, L. A. (2005). Deducing ground-to-air emissions from observed trace gas concentrtions: a field trial with wind disturbance. J. Appl. Meteorol. 44, 475–484. doi: 10.1175/JAM2214.1
Loughrin, J. H., Vanotti, M. B., Szogi, A. A., and Lovanh, N. (2009). Evaluation of second-generation multistage wastewater treatment system for the removal of malodors from liquid swine waste. J. Envion. Qual. 38, 1739–1748. doi: 10.2134/jeq2008.0430
McCubbin, D. R., Apelberg, B. J., Roe, S., and Divita, F. Jr. (2002). Livestock ammonia management and particulate-related health benefits. Environ. Sci. Technol. 36, 1141–1146. doi: 10.1021/es010705g
Myers, J., Kelly, T., Lawrie, C., and Riggs, K. (2000). Environmental Technology Verification Report. Boreal Laser Inc. GasFinder 2.0 Tunable Diode Laser Open-Path Monitor. Columbus, OH: Battelle.
Ro, K. S., Johnson, M. H., Hunt, P. G., and Flesch, T. K. (2011). Measuring trace gas emission from multi-distributed sources using vertical radial plume mapping (VRPM) and backward Lagrangian stochastic (bLS) techniques. Atmosphere 2, 553–566. doi: 10.3390/atmos2030553
Ro, K. S., Johnson, M. H., Stone, K. C., Hunt, P. G., Flesch, T. K., and Todd, R. W. (2013). Measuring gas emissions from animal waste lagoons with an inverse-dispersion technique. Atmos. Environ. 66, 101–106. doi: 10.1016/j.atmosenv.2012.02.059
Ro, K. S., Johnson, M. H., Varma, R. M., Hashmonay, R. A., and Hunt, P. G. (2009). Measurement of greenhouse gas emissions from agricultural sites using open-path optical remote sensing method. J. Environ. Sci. Health Part A 44, 1011–1018. doi: 10.1080/10934520902996963
Ro, K. S., Moore, P. A., Szogi, A. A., and Millner, P.D. (2017). Ammonia and nitrous oxide emissions from broiler houses with downtime windrowed litter. J. Environ. Qual. 46, 498–504. doi: 10.2134/jeq2016.09.0368
Ro, K. S., Sozgi, A. A., Vanotti, M. B., and Stone, K. C. (2008). Process model for ammonia volatilization from anaerobic swine lagoons incorporating varying wind speeds and gas bubbling. Trans. ASABE 51, 259–270. doi: 10.13031/2013.24219
Ro, K. S., Stone, K. C., Johnson, M. H., Hunt, P. G., Flesch, T. K., and Todd, R. W. (2014). Optimal sensor locations for the backward lagrangian stochastic technique in measuring lagoon gas emission. J. Environ. Qual. 43, 1111–1118. doi: 10.2134/jeq2013.05.0163
Szogi, A. A., and Vanotti, M. B. (2008). “Enhanced animal productivity and health with improved manure management in 2nd generation environmentally superior technology in North Carolina: II Air quality,” in VIII International Livestock Environment Symposium (Iguassu Falls), 523–527.
Szogi, A. A., Vanotti, M. B., and Stansbery, A. E. (2006). Reduction of ammonia emissions from treated anaerobic swine lagoons. Transac. ASAE 49, 217–225. doi: 10.13031/2013.20241
Vanotti, M. B., Ro, K. S., Szogi, A. A., Loughrin, J. H., and Millner, P. D. (2018). High-rate soild-liquid separation coupled with nitrogen and phosphorous treatment of swine manure: effect on water quality. Front. Sustain. Food Sys. 2:49. doi: 10.3389/fsufs.2018.00049
Vanotti, M. B., Szogi, A. A., and Fetterman, L. (2010). Wastewater Treatment Systems With Simultaneous Separation of Phosphrous Sludge and Manure Solids. U.S.A. patent application.
Vanotti, M. B., Szogi, A. A., Hunt, P. G., Millner, P. D., and Humenik, F. J. (2007). Development of environmentally superior treatment system to replace anaerobic swine lagoons in the USA. Biores. Technol. 98, 3184–3194. doi: 10.1016/j.biortech.2006.07.009
Vanotti, M. B., Szogi, A. A., Millner, P. D., and Loughrin, J. H. (2009). Development of a second-generation environmentally superior technology for treatment of swine manure in the USA. Bioresour. Technol. 100, 5406–5416. doi: 10.1016/j.biortech.2009.02.019
Viguria, M., Ro, K. S., Stone, K. C., and Johnson, M. H. (2015). Accuracy of vertical radial plume mapping technique in measuring lagoon gas emissions. J. Air Wastes Manage. Assoc. 65, 395–403. doi: 10.1080/10962247.2014.996267
Westerman, P. W., Arogo Ogejo, J., and Grabow, G. L. (2010). Swine anaerobic lagoon nutrient concentration variation with season, lagoon level, and rainfall. Appl. Eng. Agric. 26, 147–152. doi: 10.13031/2013.29472
Keywords: total farm ammonia emission rate, swine lagoon, manure treatment, vertical radial plume mapping method, lagoon emission flux
Citation: Ro KS, Vanotti MB, Szogi AA, Loughrin JH and Millner PD (2018) High-Rate Solid-Liquid Separation Coupled With Nitrogen and Phosphorous Treatment of Swine Manure: Effect on Ammonia Emission. Front. Sustain. Food Syst. 2:62. doi: 10.3389/fsufs.2018.00062
Received: 24 May 2018; Accepted: 30 August 2018;
Published: 28 September 2018.
Edited by:
Barbara Amon, Leibniz-Institut für Agrartechnik und Bioökonomie (ATB), GermanyReviewed by:
José Luis Campos Gómez, Adolfo Ibáñez University, ChileFrutos Carlos Marhuenda-Egea, University of Alicante, Spain
Copyright © 2018 Ro, Vanotti, Szogi, Loughrin and Millner. This is an open-access article distributed under the terms of the Creative Commons Attribution License (CC BY). The use, distribution or reproduction in other forums is permitted, provided the original author(s) and the copyright owner(s) are credited and that the original publication in this journal is cited, in accordance with accepted academic practice. No use, distribution or reproduction is permitted which does not comply with these terms.
*Correspondence: Kyoung S. Ro, a3lvdW5nLnJvQGFycy51c2RhLmdvdg==