 André Bannink
 Wouter J. Spek1
 Jan Dijkstra
- 1Wageningen Livestock Research, Wageningen University and Research, Wageningen, Netherlands
- 2Animal Nutrition Group, Wageningen University and Research, Wageningen, Netherlands
The current inventory of N emission from cow excreta relies on fecal N digestibility data in Dutch feeding tables, assuming additivity of dietary ingredients to obtain diet values (CVB model). Alternatively, fecal N digestibility can be estimated by a dynamic, mechanistic model of digestion in the gastrointestinal tract, currently used as Tier 3 for enteric methane prediction in the Netherlands (Tier 3 model). Estimates of in situ rumen degradation characteristics for starch, neutral detergent fiber (NDF) and crude protein used as an input for the Tier 3 model were based on Dutch feeding tables (the protein evaluation system). Both methods were evaluated on independent dataset on fecal N digestibility that was constructed from peer-reviewed papers on N balance data for dairy cows published since 1999 (54 trials, 242 treatment means). Results indicate that observed apparent fecal N digestibility (67.0 ± 6.77%) was systematically over-predicted in particular by the CVB model (73.8 ± 4.35%) compared to the Tier 3 model (69.8 ± 4.52%). For the dataset including only observations from Dutch trials the observed fecal N digestibility (70.4 ± 7.33%) was also systematically over-predicted by the CVB model (76.4 ± 5.27%) but not by the Tier 3 model (69.7 ± 5.81%). Mixed model analysis with study as random factor indicated the slope of the regression between observed and predicted fecal N digestibility to be smaller than 1, in particular for the CVB model (CVB model slope varied between 0.405 and 0.560 and Tier 3 model slope between 0.418 and 0.657). The over-prediction by the CVB model with 6–7%-units of digestibility will lead to an over-predicted ammoniacal N excretion (urinary N) in the ammonia inventory, and biased estimation of N mitigating potential of nutritional measures. The present study demonstrates the benefit of using the Tier 3 model to predict the average level of apparent fecal N digestibility compared to the CVB model. The general estimates of in situ rumen degradation characteristics for starch, NDF and crude protein used as input for the Tier 3 model seemed applicable for the Dutch trials but less so for the non-Dutch trials.
Introduction
Ammonia emitted from dairy production systems is a major water and air pollutant, leading to eutrophication, acidification and fine particulate matter formation. These emissions are reported annually to the European Commission, according to the Göteborg and Kyoto protocols (e.g., Nielsen et al., 2018; Wakeling et al., 2018). Most inventory efforts adopt the concept of ammonia emission factors specific for an animal category or type of agricultural activity (Paulot et al., 2014). This implies a specific emission factor has to be allocated a priori to every management practice or abatement measure accounted for in the model. Actual modeling of the cause of variation in ammonia emission requires representation of details of the emission process itself. An ammonia emission model has been developed for inventory purpose in the Netherlands (Velthof et al., 2012) including the ammonia emissions from animal excreta. A crucial element in this model is the prediction of the urinary excretion rate of potentially volatile nitrogen, often referred to as total ammoniacal nitrogen (TAN). The proportion of nitrogen (N)-containing components in urine that is susceptible to almost instant volatilization varies considerably (Dijkstra et al., 2013, 2018), and mineralization of organic manure N (fecal N) also contributes to TAN (Vonk et al., 2016). For reasons of simplicity we refer to TAN as being the total amount of N excreted with urine, irrespective of the form of N present in urine and excluding a further input to TAN from mineralization of fecal excreted N.
In ammonia inventory methodology, accurate estimates of apparent fecal N digestibility are required to allow calculation of TAN excretion rate. This rate is calculated as the amount of N ingested that is apparently digested at the level of feces (by taking N intake times apparent fecal N digestibility of ingested feed), minus the amount of N retained in milk, body tissues, and offspring. Data on N intake and N retained by the cow can be retrieved from the activity data available in the inventory in the Netherlands (Velthof et al., 2012). Apparent fecal N digestibility is obtained or calculated from values for the dietary components given in Dutch tables of feed values for ruminant nutrition, also indicated as the CVB Feed Table (CVB, 2011; referred to from hereon as CVB model). These values have typically been determined in experiments with wethers rather than with cattle. However, since the introduction of the systems of evaluation of net energy for lactation (Schiemann et al., 1971; Van Es, 1978) differences in apparent fecal N digestibility between wethers and cattle have been documented. The Dutch evaluation system of net energy of lactation (VEM; Van Es, 1978) is part of the CVB Feed Table (CVB, 2011). These values are not directly applied with the purpose of estimating apparent fecal N digestibility in dairy cattle, but they are used in calculations of the energy value of feeds. For these reason some doubts could be raised on the accuracy of the current TAN excretion calculation for dairy cattle in the Netherlands. A preliminary evaluation (unpublished) of apparent fecal N digestibility predicted with the CVB model confirmed these doubts. Evaluation against a dataset of 69 dietary treatments from 13 trials indicated a large systematic over-prediction of apparent fecal N digestibility with 7.5 (±5.4) percent units of digestion, corresponding with 11.4% higher predicted than observed values for apparent fecal N digestibility (Figure 1). Prediction error appeared negatively related to the level of apparent fecal N digestibility and to the fraction of roughage in the diet, and positively related to DM intake (R2 = 0.26, 0.15, and 0.11, respectively).
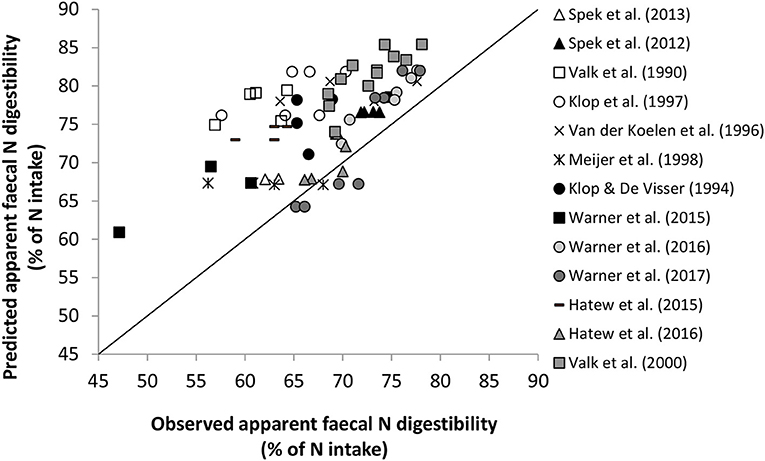
Figure 1. A preliminary evaluation of prediction of apparent fecal N digestibility (% of N intake) by the CVB model for 13 Dutch trials with lactating cows on 69 dietary treatments. Observational data were retrieved from 10 studies published in journals (Valk et al., 1990, 2000; Spek et al., 2012, 2013; Hatew et al., 2015, 2016; Warner et al., 2015, 2016, 2017), and from 3 studies on the modulating effect of starch supplementation at various sites in the gastrointestinal tract on apparent N digestibility, reported in 4 internal documents (Klop and de Visser, 1994; Van der Koelen et al., 1996; Klop et al., 1997; Meijer et al., 1998). Dry matter (DM) intake ranged from 14.5 to 22.5 kg/d, crude protein content in dietary DM from 8.4 to 24.4%, roughage fraction in dietary DM from 0.45 to 0.91, and observed apparent fecal N digestibility from 47.1 to 78.1%.
Hence, it appeared that estimates of apparent fecal N digestibility with the CVB model might be biased. The aim of the present study was to evaluate the CVB model, as well as an alternative, more detailed candidate model, against an independent dataset of rather recent observations on apparent fecal N digestibility in dairy cows documented in peer-reviewed literature. As the alternative candidate model, a Tier 3 approach (from here on referred to as Tier 3 model) was chosen which is already in use to estimate enteric methane in dairy cattle (Bannink et al., 2011) in the greenhouse gas inventory in the Netherlands (Vonk et al., 2016).
Materials and Methods
Data Collection Evaluation Databases
A literature search of the Scopus on-line database was conducted using the combination of words “dairy cattle OR dairy cows,” “digestibility OR digestion.” and “protein.” The period covered was 2000–2016 and the search resulted in 1,207 articles. In order to be included in the dataset, studies had to provide information with respect to the ingredient composition of the diet, dry matter intake (DMI), and apparent fecal protein digestibility. Furthermore, as the CVB Feed Table (CVB, 2011) was used for recalculation of the diets, only those studies were selected in which the ingredients used were also present in the CVB Feed Table (CVB, 2011). Studies were removed from the database if grass silage was inoculated, cow body weight (BW) was lower than 550 kg and breeds other than Holstein Friesian were involved. Some digestion trials carried out by our own research group in the Netherlands were added to this database. This selection process resulted in an evaluation dataset containing a total of 54 studies containing 58 experiments and 242 treatment observations, including 9 Dutch studies containing 13 experiments and 62 treatment observations. A summary of cow and dietary characteristics for the selected studies is given in Table 1 for the complete evaluation dataset, and in Table 2 for the dataset of Dutch studies only. The 54 studies included in this analysis are listed in the footnotes of Tables 1 and 2.
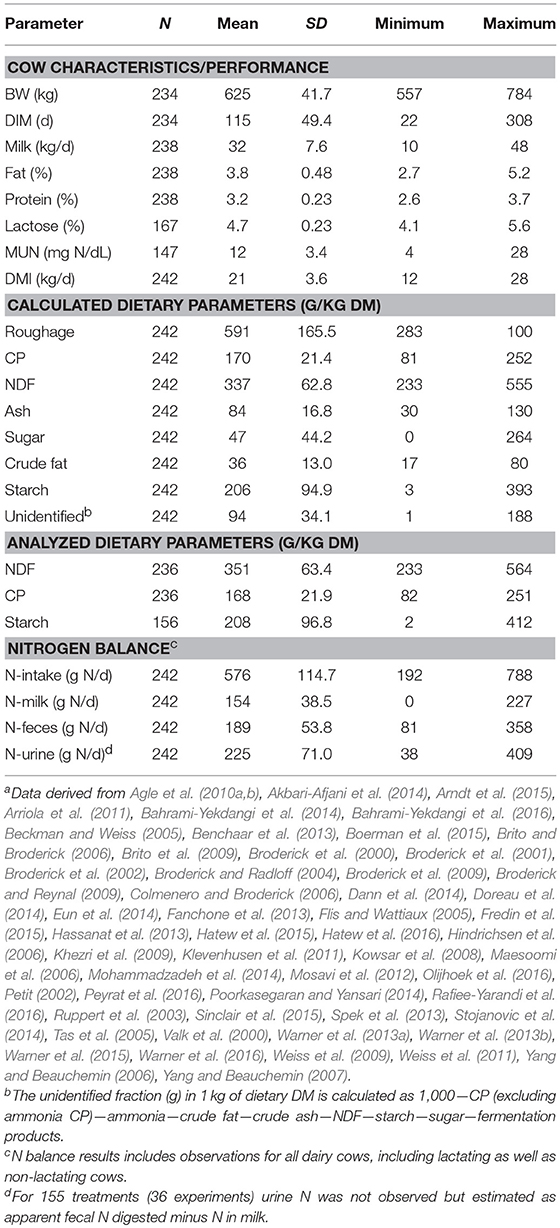
Table 1. Summary statistics of cows and diets in the complete evaluation dataseta.
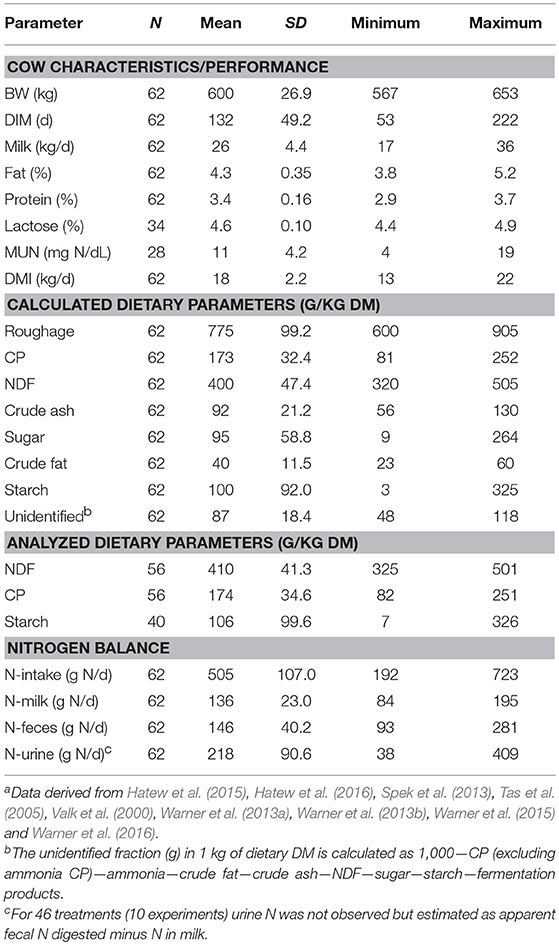
Table 2. Summary statistics of cows and diets in the evaluation dataset, containing Dutch experiments onlya.
Performance of the CVB model and the Tier 3 model was evaluated for the three different datasets: (1) the complete dataset including the diets containing rolled or cracked products, (2) the complete dataset excluding the diets containing rolled or cracked high moisture maize silage because for these products in particular representative data were lacking in the CVB Feed Table (CVB, 2011), and (3) a dataset containing the data from Dutch studies only.
Recalculation of Diets
Diets composition was recalculated using the CVB Feed Table (CVB, 2011) and, as far as available, analyzed nutrient composition of concentrates and roughages were used as inputs for the recalculation of diets. The unidentified fraction of the dietary DM (in g/kg DM) was calculated as 1,000—crude protein (CP; excluding ammonia CP)—ammonia—crude fat—crude ash—neutral detergent fiber (NDF)—starch—sugar—fermentation products. This unidentified fraction was equally allocated to NDF and starch in cases when dietary starch content was higher than sugar content but equally allocated NDF and sugars in cases when sugar content was higher than the starch content. This was a pragmatic solution to allocate 100% of DM including the unidentified part which also contributes to fermentation, microbial growth, digestion and excretion. In a number of cases, rolled high moisture maize silage was used (involving North American studies) and for this product the values in the CVB Feed Table (CVB, 2011) for corn cob mix silage were adopted.
Calculation of Model Input Parameters
The required model input parameters for the Tier 3 model (and required input parameters related to CP for the CVB model) are summarized in Table 3. Ruminal in situ fermentation characteristics are required for starch, NDF and CP of the individual feed ingredients. These rumen fermentation characteristics for the individual feedstuffs include the washout fraction, the (non-washout) degradable fraction and the (non-washout) undegradable fraction of starch, NDF, and CP, as well as the respective ruminal in situ fractional degradation rates of the degradable fraction of starch, NDF, and CP. Values were adopted from those applied in the DVE/OEB2010 system (Van Duinkerken et al., 2011) as part of the CVB Feed Table (CVB, 2011). This feed evaluation system estimates requirements and supply of intestinal digestible protein in dairy cattle.
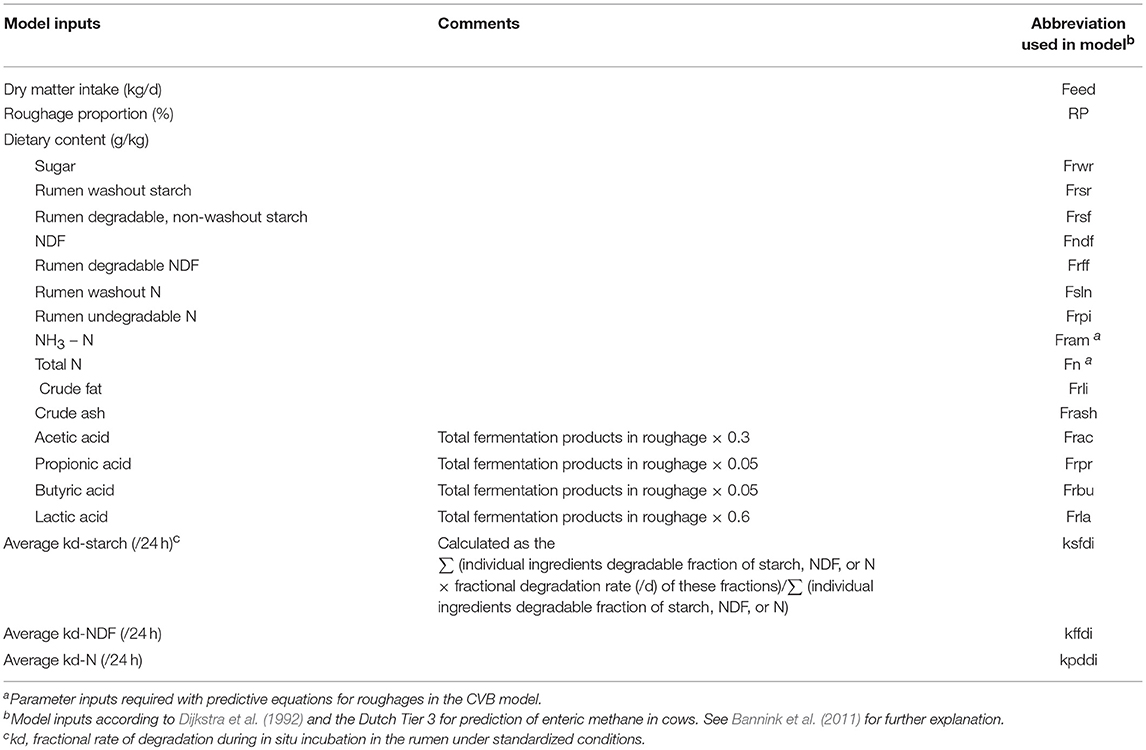
Table 3. Model inputs required for prediction of apparent fecal N digestibility with the Dutch Tier 3 model (and some for the CVB modela).
CVB Model
For all feedstuffs, the CVB Feed Table (CVB, 2011) contains estimates of the coefficient (%) of apparent fecal digestibility of CP (either as table values for concentrate ingredients, or as predictive equations for roughages; CVB, 2007). Digestibility data for the dietary components or ingredients were weighted according to their contribution to dietary DM.
Tier 3 Model
The Tier 3 model used in the present study to predict apparent fecal N digestibility, as an alternative to the CVB model, has been used in the greenhouse gas inventory in the Netherlands since 2005 to predict enteric methane emission in dairy cattle (Vonk et al., 2016). The Tier 3 model is a dynamic, mechanistic model describing the fermentative and digestive processes in the gastrointestinal tract of dairy cattle. The model is strongly based on the rumen and fermentation model of Dijkstra et al. (1992). This model was adapted by Mills et al. (2001) on post-ruminal digestion of nutrients and fermentation in the hindgut. Subsequently, it was adapted by Bannink et al. (2008) on the representation of the stoichiometry of production of volatile fatty acids from fermented substrate (soluble carbohydrates, starch, hemi-cellulose, cellulose and CP). Kebreab et al. (2004) used an extended version of this model, including prediction of nutrient utilization for milk yield according to Dijkstra et al. (1996), for the US greenhouse gas inventory purposes. The Tier 3 model represents fermentation and microbial metabolism processes in the rumen, including variation in microbial protein synthesis related to the type of carbohydrate and N-source available, retention time of substrate, acidity of rumen contents, intra-ruminal microbial N recycling, recycling of N to the rumen via saliva and through the rumen wall. The model distinguishes bacteria and protozoal metabolism and predicts variation in rumen (and large intestinal) metabolism instead of adopting fixed values (reviewed by Bannink et al., 2016). Representation of such aspects is relevant to prediction of variation in outflow of microbial and non-microbial protein from the rumen and its subsequent digestion in the intestines.
For the present study, rather limited adaptations were made to the model. These adaptations did not affect predicted enteric methane emission (Vonk et al., 2016), but they were required for accurate prediction of apparent fecal N digestibility. A representation of endogenous protein in the small intestine was included, similar to that in the DVE/OEB 2010 system (Van Duinkerken et al., 2011). The following equation was used to calculate the production rate of endogenous protein (CPEnd; g/d) from the flow of undigested feed (Van Duinkerken et al., 2011): CPEnd = 50 × Feed ((1-DCOM/100) + FrAsh/1000 × 0.5), with Feed as DM intake (kg/d), DCOM as fecal digestibility of organic matter (% of organic matter intake), FrAsh as the fraction of crude ash in feed (g/kg DM), and assuming 50% fecal digestibility of crude ash. It was assumed that 60% of the ileal outflow of endogenous protein and microbial crude protein to the large intestine is potentially degradable in the large intestine.
Apparent Fecal N Digestibility in Inventory Methodology
Activity data for the diet and performance of the average dairy cow in the Netherlands allowed to generate model inputs for the Tier 3 model to predict apparent fecal N digestibility (% of N intake). The activity data include statistics on the number of dairy cows in the Netherlands, delivered and recorded amounts and composition of tank milk in two identified regions (i.e., the North and West, and the East and South). The data include for each region an estimate of DM intake by cows based on milk yield and milk composition, components in the cow ration and the feeding of these components. The specific task to collect the statistics for these data is allocated to the WUM working group who interpret statistics of the aforementioned data according to a standardized methodology (CBS, 2010). A yearly estimate is delivered of the proportion of each component in dietary DM (grass herbage, grass silage, maize silage, standard concentrates, protein-rich concentrates, and wet by-products), DM intake, and milk yield and composition. Statistics (across season and across postal code reflecting soil and farm type) on the chemical composition, digestibility and feeding value of roughages are obtained from a commercial laboratory (https://www.eurofins.com/agro) that analyses the majority of silage samples offered for analysis by Dutch dairy farmers as almost all Dutch dairy farmers offer samples their silos for analysis. Furthermore, estimates are made for which part of prepared silages are fed within the year of preparation or are fed in subsequent years. The approach was consistent with that followed in the inventory of enteric methane in dairy cattle in the Netherlands from 1990 till 2016 (Vonk et al., 2016). Required model inputs have been described by Bannink et al. (2011) and are listed in Table 3. Values achieved with the CVB model have been drawn from the inventory reports in the Netherlands and were available from 1990 till 2014.
Statistical Analysis
Data were analyzed based on the three different datasets; (1) the complete dataset of observations without any exclusions, (2) the complete dataset excluding diets containing rolled or cracked products, and (3) the dataset containing observations from Dutch studies only. A separate analysis was carried out for the complete excluding rolled or cracked products because no similar products have been listed in the Dutch Feed Table (CVB, 2011) and assumptions on inputs were hence expected to be rather inaccurate. A separate analysis was carried out for the Dutch dataset because the values adopted in the DVE/OEB 2010 system (Van Duinkerken et al., 2011) on rumen degradation characteristics of feedstuffs and diet components are thought to be most reliable for trials performed in the Netherlands. These values have typically been established in in situ degradation studies conducted under Dutch feeding conditions. These values are likely less applicable to the same type of feedstuffs or dietary components (especially for roughages) tested in other countries due to differences in climate, harvest management, varieties of maize and grass, and post-harvest treatment and conservation.
Data were analyzed using the PROC MIXED procedure of SAS (version 9.3). Model predicted apparent fecal N digestibility (%) based on the Tier 3 model and the CVB model were tested against observed apparent fecal N digestibility. Study effect was included as a random effect in the model. Model predictions of apparent fecal N digestibility were evaluated using two methods as described in Ellis et al. (2010). The square root (RMSPE) of the mean square prediction error (MSPE) was calculated and expressed as percentage of the observed mean. The RMSPE was decomposed into error due to overall bias (ECT), error due to deviation of the regression slope from unity (ER), and error due to the disturbance (random error) (ED) (Bibby and Toutenburg, 1977).
Furthermore, concordance correlation coefficient analysis (CCC) was performed (Lin, 1989) where CCC is calculated as:
where Cb is a bias correction factor and is a measure of accuracy, and the R variable (the Pearson correlation coefficient) gives a measure of precision. A higher CCC value indicates a better prediction of observed values. The Cb is calculated from SDO and SDP as the standard deviation of observed and predicted values, respectively, and MO and MP as the mean of observed and predicted values respectively, where υ provides a measure of scale shift (i.e., the change in standard deviation between predicted and observed values), and μ provides a measure of location shift (i.e., under-prediction with a positive value and over-prediction with a negative value):
υ = SDO / SDP,
μ = [MO – MP] / [SDO × SDP] 1/2,
Cb = 2/[υ + 1/υ + μ2].
Results
Model Evaluation Results
Table 4 shows summarizing statistics of observed and predicted values of apparent fecal N digestibility (as % of N intake) for the three datasets. For the complete dataset, observed variation in apparent fecal N digestibility (referring to the SD values reported in Table 4) was 50 and 56% greater than predicted by the Tier 3 model and CVB model, respectively. For the complete dataset excluding rolled or cracked products it was 32 and 43% greater, and for the Dutch dataset 26 and 39% greater, respectively. The CVB model over-predicted apparent fecal N digestibility by 6.8% units of digestibility for the complete dataset, by 6.0% units for the complete dataset excluding rolled and cracked products, and by 6.0% units of digestibility for the Dutch dataset (Table 4). The Tier 3 model over-predicted by 2.8 and 1.7% units and under-predicted by 0.7% units for these datasets, respectively. Results have been represented graphically in Figure 2 for the complete dataset and Figure 3 for the Dutch dataset.
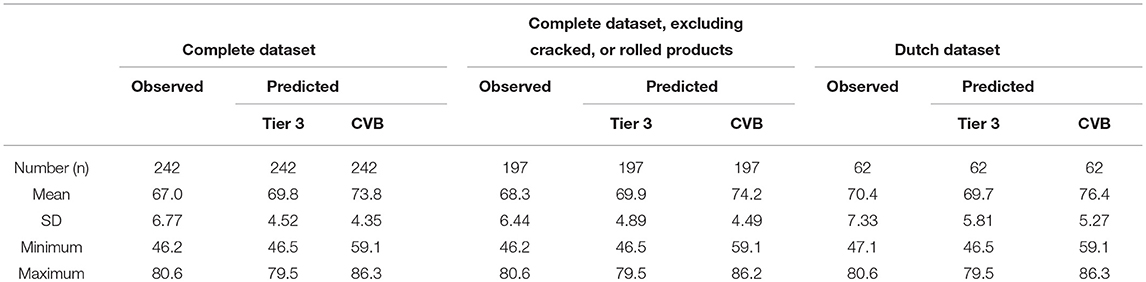
Table 4. Summary of observed and predicted apparent fecal N digestibility (as % of N intake) for the complete dataset, the complete dataset excluding rolled or cracked high moisture maize silage, and the Dutch dataset.
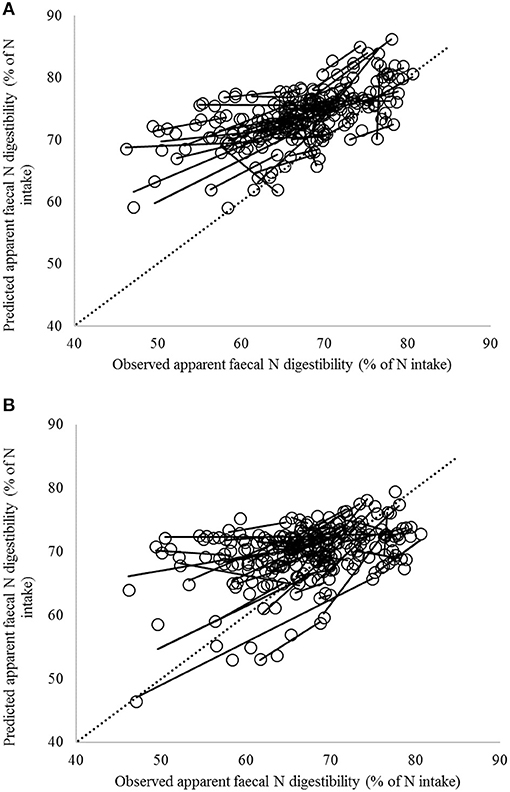
Figure 2. Comparison of observed and predicted apparent fecal N digestibility values according to (A) the CVB model (the current Dutch feed evaluation system of net energy of lactation; Van Es, 1978) and (B) the enteric methane emission Tier 3 model (Bannink et al., 2011) for the complete dataset with observations for lactating cows from 58 trials including 242 dietary treatments. Solid lines indicate regression of predicted against observed values within trial; the dashed line indicates the line of unity.
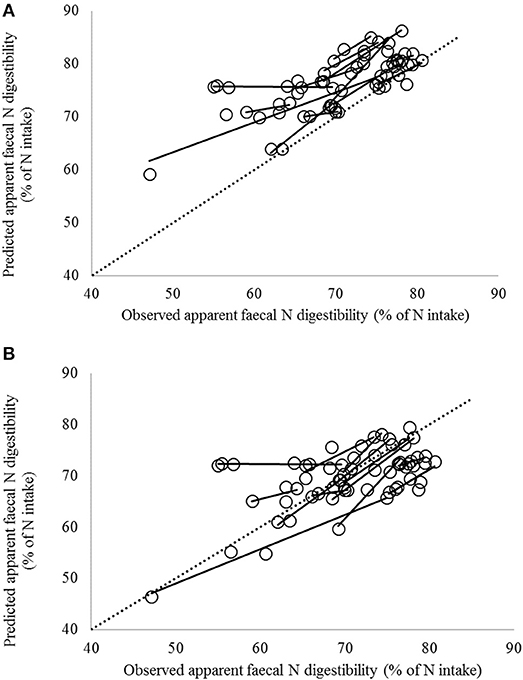
Figure 3. Comparison of observed and predicted apparent fecal N digestibility values according to (A) the CVB model (the current Dutch feed evaluation system of net energy of lactation; Van Es, 1978) and (B) the Tier 3 model currently used for enteric methane emission (Bannink et al., 2011) for the dataset with observations for lactating cows in 13 Dutch trials including 62 dietary treatments. Solid lines indicate regression of predicted against observed values within trial; the dashed line indicates the line of unity.
More qualifying statistics on model prediction performance are given in Table 5. The relationship between observed and predicted apparent fecal N digestibility, taking into account the study effect, indicated a better prediction by the Tier 3 model. Slope estimates (between 0.418 and 0.657) were greater and intercept estimates smaller (between 23.4 and 41.6) with the Tier 3 model compared to slope estimates obtained for the CVB model (slope estimates between 0.405 and 0.560; intercept estimates between 37.2 and 46.4; Table 5).
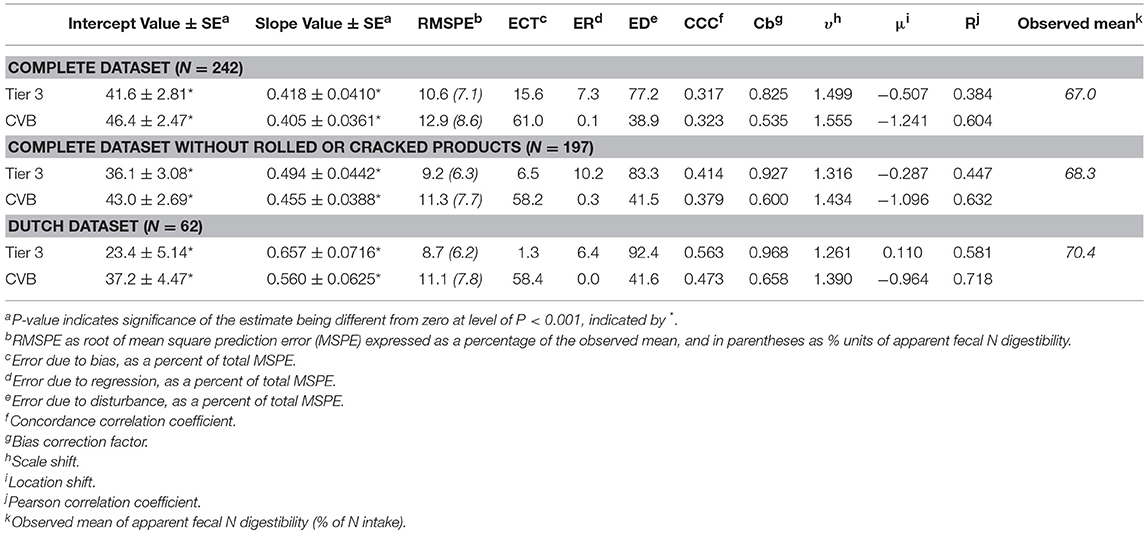
Table 5. Relationship between observed apparent fecal N digestibility (%) and predicted apparent fecal N digestibility (%) with the Tier 3 model and the CVB model (values and calculations based on studies with wethers fed on maintenance level) for the complete dataset, the complete dataset excluding rolled or cracked high moisture maize silage, and the Dutch dataset.
Consistent results were obtained with RMSPE and CCC analysis of overall performance for these three datasets. A consistently smaller RMSPE was established with the Tier 3 model compared to the CVB model for the complete dataset, the complete dataset excluding rolled or cracked products and the Dutch dataset (a 1.5, 1.4, and 16% units of digestibility smaller prediction error with the Tier 3 model, respectively, based on RMSPE and observed means in Table 5). Predictive performance in terms of RMSPE value was highest with the Dutch dataset and lowest with the complete dataset. The RMSPE for the Tier 3 model was almost totally attributed to error due to disturbance (ED) with % of RMSPE attributed to bias (ECT) and regression (ER) not exceeding 16% (Table 5). In contrast, with the CVB model most error was due to the bias (more than 58%; ECT) and the contribution of disturbance error (DE) to total error was about half that of the Tier 3 model.
In line with RMSPE results, the results from CCC analysis indicate that predictive performance of both the Tier 3 model and the CVB model improved in the order of the complete dataset, the complete dataset excluding rolled or cracked products and the Dutch dataset. The CCC value increased, the Pearson correlation coefficient R changed in the direction of 1, as well the bias correction factor Cb and the υ parameter indicating scale shift, whereas the μ parameter indicating location shift became smaller (results for both models in Table 5). Simultaneously, the CCC value (a high value indicating better prediction) increased by 0.25 for the Tier 3 model and by 0.15 for the CVB model. With the complete dataset, performance by the CVB model was similar comparable to that of the Tier 3 model with a CCC value of 0.32 (Table 5). This changed into a slightly better performance by the Tier 3 model for the complete dataset excluding rolled or cracked products (0.04 higher CCC value), and a better performance with the Dutch dataset (0.09 higher CCC value). For all three datasets tested, precision (R; Table 5) was higher for the CVB model, whereas accuracy (Cb; Table 5) was higher for the Tier 3 model. Higher accuracy (Cb) of the Tier 3 model remained with differences in Cb value of 0.29, 0.33 and 0.31 for the complete dataset, the complete dataset excluding rolled or cracked products and the Dutch dataset, respectively. Precision remained lower for the Tier 3 model but the difference in R-value with the CVB model declined from 0.22 to 0.19 to 0.14, respectively. The standard deviation of predicted values was smaller than that of observed values leading to υ values (scale shift) higher than 1, more so for the CVB model than for the Tier 3 model however (Table 5). Both the CVB model and the Tier 3 model over-predicted apparent fecal N digestibility as indicated by the negative μ values (Table 5). Absolute values of μ were 2.4, 3.8, and 8.8 times as large for the CVB model compared to the Tier 3 model with the complete dataset, the complete dataset excluding rolled or cracked products, and the Dutch dataset, respectively. There was essentially (only) a small under-prediction of apparent fecal N digestibility with the Tier 3 model (Tables 4, 5).
Prediction of Apparent Fecal N Digestibility in Inventory
Figure 4 demonstrates the consequences on predicted apparent fecal N digestibility in the ammonia inventory methodology with the CVB model or the alternative the Tier 3 model (Vonk et al., 2016). The average of predictions by the CVB model for the period of 1990 till 2014 was 5.9% units of digestibility higher than the average of predictions by the Tier 3 model from 1990 till 2016. The annual predictions by the CVB model were 5.6 (±0.93) % units of digestibility higher compared to the Tier 3 model. The results further demonstrate a continuous decline in predicted N digestibility since 1990 following the trend in the activity data of a declining dietary N content (data not shown here; Vonk et al., 2016). The predicted decline in the apparent fecal N digestibility from 1990 till 2010 was about 6.5% units of digestibility. Since 2010 the decline leveled off (despite some remaining variation predicted by the Tier 3 model) together with activity data indicating a rather constant dietary N content (data not shown here; Vonk et al., 2016).
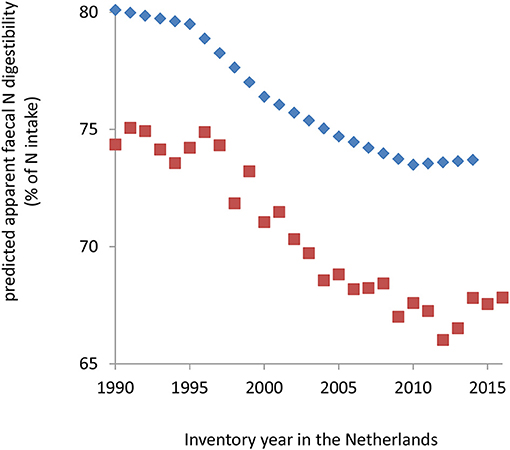
Figure 4. Apparent fecal N digestibility (%) in dairy cows predicted with the CVB model (diamonds; reported values available till 2014), or predicted with the Tier 3 model (squares; activity data for calculations available till 2016), according to available activity data in the ammonia and greenhouse gas emissions inventory in the Netherlands (Velthof et al., 2012; Vonk et al., 2016).
Discussion
In cattle, utilization of dietary N is relatively inefficient with some 50–85% of consumed N excreted in feces and urine (Moore et al., 2014). The amount of N excreted is related to several factors, with dietary protein content and its apparent digestibility being major determinants. Decreasing dietary protein content is among the most effective strategies to reduce ammonia emissions from dairy manure (Agle et al., 2010b). In a meta-analysis, Bougouin et al. (2016) identified DM intake, milk production, and dietary protein content being key explanatory variables in predicting ammonia emission from dairy housing. The estimation of urine N, or TAN, excretion requires knowledge of dietary N consumption, apparent fecal N digestibility and the amount of N retained in animal products. Activity data in the inventory methodology in the Netherlands already deliver insight into N consumption and N retained by cows in milk, growth and offspring. However, these data do not indicate apparent digestibility of dietary N which hence needs to be predicted.
Comparison of Tier 3 Model and CVB Model
The average of predicted and observed values for apparent fecal N digestibility were closer for the Tier 3 model compared to the CVB model with the difference becoming <1% unit of digestibility (Table 4) for the Dutch dataset. Also the better correspondence between predicted and observed N digestibility values when accounting for study effect (Table 5) indicates an improved applicability of the Tier 3 model on account of representation of fermentative and digestive mechanisms. The statistical results consistently indicate a better prediction performance by the Tier 3 model although it may remain hard to distinguish the better capture by the model of the within trial treatment differences in Figures 2, 3. This was also demonstrated by a much smaller RMSPE value and more than 77% of error attributed to disturbance (ED) instead of bias (ECT) and regression (ER) (Table 5). Furthermore, CCC analysis indicated that the CVB model was less capable than the Tier 3 model to predict apparent fecal N digestibility for the Dutch dataset in particular. With a lower Cb value the CVB model appeared always less accurate (Table 5), although demonstrating a higher R-value indicating a better correlation between predicted and observed values (measure for precision).
The complete dataset was restricted, first by exclusion of rolled or cracked products because estimates of in situ degradation characteristics were highly uncertain and not available in the Dutch Feed Table (CVB, 2011), and second by selecting the Dutch dataset with studies conducted in the Netherlands only. Accuracy of the Tier 3 model was high for the Dutch dataset with a Cb value of 0.97 (Table 5), and the majority of observations well predicted. Three observations of exceptionally small values of apparent fecal N digestibility by Warner et al. (2013b) could not be reproduced accurately by the Tier 3 model (observations below 60% and prediction above 70%; Figure 3). These observation were obtained for three out of six maize silage treatments used in that particular experiment, with a CP content in dietary DM of 18% and maize silage a third of dietary DM with all 6 treatments. Due to the fact that the Tier 3 model received the same in situ degradation characteristics from the Dutch Feed Table (CVB, 2011) as an input for these six maize silages, it is no surprise that the model could not separate out the two groups of observations.
Both the CVB model and the Tier 3 model predicted less variation than observed which is clearly demonstrated by υ values >1, in particular for the CVB model, and more so for the complete dataset than for the Dutch dataset (Table 5). Ellis et al. (2010) compared the RMSPE and CCC statistics in an evaluation study of enteric methane prediction equations that are adopted in farm systems modeling. They demonstrated and discussed that when models are unable to describe adequate amounts of the observed variation, CCC analysis is likely the preferred evaluation tool to be used. When mainly focussing on the results of CCC statistics in the present study, the conclusion remain however that the Tier 3 model outperforms the CVB model based on the results obtained for the Dutch dataset to which the model inputs derived from Dutch Feed Table (CVB, 2011) will comply most.
The results depicted in Figures 2, 3 show a large positive bias in predicted apparent fecal N digestibility for the CVB model. This is demonstrated by the stronger negative value of the μ parameter from CCC analysis which indicates a stronger over-prediction by the CVB model. Over-prediction is clearly far less with the Tier 3 model and almost absent with the Dutch dataset (Table 5). The main reason for the over-prediction with the CVB model is likely that it bases its prediction on digestion data retrieved from wethers instead of dairy cattle. The latter are reported to have a lower apparent fecal N digestibility due to a different contribution of endogenous and microbial N sources to fecal N (Schiemann et al., 1971; Van Es, 1978). Results from Soto-Navarro et al. (2014) suggest that also digestibility data for steers might not be representative for dairy cattle. Apparent fecal N digestibility was reported to be equal or higher than in sheep (2.6, 8.6, and 51.5% units of digestibility for alfalfa, high-quality grass hay and low-quality grass hay, respectively). Therefore, any empirical database to be applied to dairy cows should best be obtained from observations on dairy cows under representative nutritional conditions. Furthermore, the relatively small bias (small ECT values and high Cb values; Table 5) with the Tier 3 model for all three datasets, suggests that the Tier 3 model performance in predicting the average level of apparent fecal N digestibility is satisfactory. Accurate prediction of such an average level is of particular importance for the Tier 3 model to be used for the national inventory purposes, as these are based on calculations with averaged and consolidated data at the regional or national level. It is noted that the consistent bias obtained with the CVB model (high ECT values and low Cb values; Table 5) could be removed by applying a fixed correction factor based on the present findings. It remains to be demonstrated that such a correction factor holds when evaluating the CVB model against another dataset which is independent from the results obtained in the present study. Moreover, the results from mixed model analysis (Table 5), in which bias for each study is accounted for by including a random effect of study, show that the CVB model suffers more from the regression slope differing from the optimal value of 1 than the Tier 3 model. This holds in particular again for the Dutch dataset to which the model inputs used comply most (Table 5).
Predictive Performance of the Tier 3 Model
Standard dietary characteristics were obtained from the Dutch Feed Table (CVB, 2011) and served to calculate model inputs for the Tier 3 model. However, these are likely inaccurate for the wide range of roughage types and feed qualities encountered under non-Dutch conditions. This probably contributed to the poorer prediction of apparent fecal N digestibility for the non-Dutch trials, whereas statistical analysis the Dutch dataset was more satisfactory. Even for these Dutch trials, however, the dietary ingredients and roughages must have differed strongly from the standard in situ degradation characteristics that are listed in the Dutch Feed Table (CVB, 2011; Van Duinkerken et al., 2011). Allowing for variation in these in situ degradation characteristics and adopting more realistic estimates reflecting the treatments reported would probably have increased the capacity of the model to capture observed variation in apparent fecal N digestibility. For example, the model cannot be expected to accurately predict the consequence of variation in differences in roughage quality when standardized in situ degradation characteristics of roughages are used as an input. In the present study we used such standardized input from the Dutch Feed Table (CVB, 2011).
Hence, assumptions on in situ degradation characteristics probably have been too generic to capture the variation in apparent fecal N digestibility that was observed in the various N balance trials selected from literature. Differences and inaccuracies in experimental set-ups and measuring techniques have contributed to this variation. In many studies N excreted with urine was calculated by difference method (Tables 1, 2), whereas in the others a full N balance was determined (including measurement of N excreted with urine). This difference between in studies in quantifying urine N excretion will have contributed strongly to the variation not captured by both models. Nevertheless, the most likely explanation of the lowest prediction capacity for the most complete dataset (Figure 2) remains the too narrow range or the bias in values retrieved from Dutch Feed Table (CVB, 2011), not being representative for the range of conditions met in international trials. Improving prediction performance of the Tier 3 model for non-Dutch conditions would require such model inputs to be derived from local, non-Dutch conditions as well. Such an approach was followed in studies that aimed to predict enteric methane emission in dairy cattle in various regions in the US (Kebreab et al., 2008) and digestibility (including apparent fecal N digestibility) of various diet types and production conditions (Hanigan et al., 2013). In these studies, similar dynamic, mechanistic models were used, requiring inputs similar to those of the Tier 3 model used the present study.
N Digestion Models in Ammonia Inventory
There is an urgent need to account for the effect of the ammonia mitigation measures taken in livestock operations. Both farm accounting tools and Life Cycle Analysis methodology would benefit from a more accurate and more case-specific quantification of sources of emissions (Cederberg et al., 2013), such as the amount of volatile N excreted as a source of ammonia. Both accuracy and precision is needed to identify the level and size of trade-offs between various sources and types of emissions. The highly volatile urine N as a source of ammonia is the ingested amount of digestible N by cattle which is not retained in animal product. This becomes apparent in various literature surveys (e.g., Kebreab et al., 2002). In a companion study, Dijkstra et al. (2018) explored how various dietary measures to mitigate N excretion affect the composition and characteristics of C and N containing fractions in urine and feces. The quantitative terms used to characterize manure correspond with the fermentation and digestibility concepts applied in ruminant feed evaluation. Despite the large impact of dietary N mitigation measures on the proportion of urine N in total N excreted, and on the C:N ratio of manure, inventory methodology seldom represents the variation in these proportions to calculate ammonia emissions (EEA, 2016; Nemecek and Ledgard, 2016). However, under various production conditions the proportion of urine N as well as the volume and frequency of urine excretion may impact immediate ammonia and nitrous oxide emissions from urine N (Ledgard et al., 2015; Selbie et al., 2015). Also with regard to ammonia emission from stored manure, complex mechanisms are responsible for variation in emission rates which includes the amount of urine N and the volume of urine excreted in housing (Sommer et al., 2006).
Despite the complexity of the mechanisms underlying the variation in these emissions, rather constant emission factors are often applied in inventory which in principle lack a relationship with nutritional measures and details on excreta composition, N excretion rate and excreted volumes. All models represent mass flows on a dairy farm. The more detailed ammonia emission models such as the dairy farming systems model developed by Rotz et al. (2014) represent details on the effect of type and fate of excreted N and of excreta volumes on ammonia emission. Excreted urine and fecal N are calculated by functions of animal size, feed intake and protein intake, and milk production, but not protein digestibility characteristics. More recently, Chai et al. (2016) added such detail in a model used for an ammonia inventory on Ontario dairy farms in four ecoregions. The Canadian ammonia emission inventory and survey model was refined by introducing a representation of the effect of dietary mitigation measures. They derived a linear equation to estimate the fraction of urine N, or TAN, in total N excretion from dietary CP content. The range of dietary CP content used (123, 153, and 164 g CP/kg DM with TAN proportion in manure N of 0.42, 0.50, and 0.56, respectively) covers the lower half of the range in the database used in the present study (Tables 1, 2). The relationship between dietary CP content and TAN excretion may be considered intrinsically non-linear however. This non-linear effect on TAN proportion may be covered by the approach of Velthof et al. (2012), who use a method adopting estimates of apparent fecal N digestibility retrieved from the Dutch Feed Table (CVB, 2011), evaluated in the present study as the CVB model. This method attributes all digested N not retained in animal products to TAN and, therefore, with further increase of dietary CP content, the estimated TAN proportion in total excreted N increases non-linearly. Notwithstanding the fact that current methodologies may capture the non-linear increase of proportion of TAN with total N excretion, it is of importance that variation in apparent fecal N digestibility on proportion of TAN is captured as well. The present study focussed on an independent evaluation and improvement of the CVB model as the method use by Velthof et al. (2012). The Tier 3 model was evaluated as well, as an alternative candidate model which takes details on fermentative and digestive aspects into account. Based on the promising findings in the present study, and the fact that this model is already in use in the greenhouse gas inventory for estimating enteric methane in dairy cattle, the Tier 3 model has replaced the CVB model in the ammonia inventory in the Netherlands since 2015 (Figure 4; Vonk et al., 2016). The studies of Dijkstra et al. (2013, 2018) demonstrate that further detailing of the composition of urine and feces (and manure) is possible if needed for the purpose of a more detailed inventory.
Conclusions
Upon using the CVB model to predict apparent fecal N digestibility in dairy cows in the ammonia emissions inventory in the Netherlands, a large systematic bias of 6–7% units of digestibility occurs. This bias can almost entirely be prevented by the use of the Tier 3 model which is extant methodology to estimate enteric methane in dairy cattle in the greenhouse inventory in the Netherlands. The more mechanistic representation of fermentation and digestion in the gastro-intestinal tract of dairy cows allows a more accurate and acceptable precision of predicted apparent fecal N digestibility under Dutch feeding conditions. Model performance was less satisfactory on the complete dataset, likely because of less valid standardized inputs to the model (in particular ruminal in situ degradation characteristics) when derived from distinct world regions. Satisfactory prediction of the overall average apparent fecal N digestibility demonstrates applicability of the Tier 3 model for the calculation of TAN excretion in the ammonia emissions inventory.
Author Contributions
AB, LŠ, and JD developed the concepts. AB developed the equations. WS and AB performed the simulations and analyzed the data. AB and WS wrote the original draft of the manuscript and LŠ and JD contributed to discussion and revision of this manuscript.
Conflict of Interest Statement
The authors declare that the research was conducted in the absence of any commercial or financial relationships that could be construed as a potential conflict of interest.
Acknowledgments
The funding of this research by the Ministry of Agriculture, Nature and Food Quality (project BO-20-004-111) is gratefully acknowledged.
References
Agle, M., Hristov, A. N., Zaman, S., Schneider, C., Ndegwa, P., and Vaddella, V. K. (2010b). The effects of ruminally degraded protein on rumen fermentation and ammonia losses from manure in dairy cows. J. Dairy Sci. 93, 1625–1637. doi: 10.3168/jds.2009-2579
Agle, M., Hristov, A. N., Zaman, S., Schneider, C., Ndegwa, P. M., and Vaddella, V. K. (2010a). Effect of dietary concentrate on rumen fermentation, digestibility, and nitrogen losses in dairy cows. J. Dairy Sci. 93, 4211–4222. doi: 10.3168/jds.2009-2977
Akbari-Afjani, A., Zali, A., Gangkhanlou, M., Dehghan-Banadaky, M., Nasrollahi, S. M., and Yang, W. Z. (2014). Dietary ratios of maize silage to lucerne hay affect feed intake, chewing activity and milk production of dairy cows. Anim. Product. Sci. 54, 263–269. doi: 10.1071/AN12214
Arndt, C., Powell, J. M., Aguerre, M. J., and Wattiaux, M. A. (2015). Performance, digestion, nitrogen balance, and emission of manure ammonia, enteric methane, and carbon dioxide in lactating cows fed diets with varying alfalfa silage-to-corn silage ratios. J. Dairy Sci. 98, 418–430. doi: 10.3168/jds.2014-8298
Arriola, K. G., Kim, S. C., Staples, C. R., and Adesogan, A. T. (2011). Effect of fibrolytic enzyme application to low- and high-concentrate diets on the performance of lactating dairy cattle. J. Dairy Sci. 94, 832–841. doi: 10.3168/jds.2010-3424
Bahrami-Yekdangi, H., Khorvash, M., Ghorbani, G. R., Alikhani, M., Jahanian, R., and Kamalian, E. (2014). Effects of decreasing metabolizable protein and rumen-undegradable protein on milk production and composition and blood metabolites of Holstein dairy cows in early lactation. J. Dairy Sci. 97, 3707–3714. doi: 10.3168/jds.2013-6725
Bahrami-Yekdangi, M., Ghorbani, G. R., Khorvash, M., Khan, M. A., and Ghaffari, M. H. (2016). Reducing crude protein and rumen degradable protein with a constant concentration of rumen undegradable protein in the diet of dairy cows: production performance, nutrient digestibility, nitrogen efficiency, and blood metabolites. J. Anim. Sci. 94, 718–725. doi: 10.2527/jas.2015-9947
Bannink, A., France, J., Lopez, S., Gerrits, W. J. J., Kebreab, E., Tamminga, S., et al. (2008). Modelling the implications of feeding strategy on rumen fermentation and functioning of the rumen wall. Anim. Feed Sci. Technol. 143, 3–26. doi: 10.1016/j.anifeedsci.2007.05.002
Bannink, A., van Lingen, H. J., Ellis, J. L., France, J., and Dijkstra, J. (2016). The contribution of mathematical modeling to understanding dynamic aspects of rumen metabolism. Front. Microbiol. 7:1820. doi: 10.3389/fmicb.2016.01820
Bannink, A., Van Schijndel, M. W., and Dijkstra, J. (2011). A model of enteric fermentation in dairy cows to estimate methane emission for the Dutch National Inventory Report using the IPCC Tier 3 approach. Anim. Feed Sci. Technol. 166, 603–618. doi: 10.1016/j.anifeedsci.2011.04.043
Beckman, J. L., and Weiss, W. P. (2005). Nutrient digestibility of diets with different fiber to starch ratios when fed to lactating dairy cows. J. Dairy Sci. 88, 1015–1023. doi: 10.3168/jds.S0022-0302(05)72769-7
Benchaar, C., Hassanat, F., Gervais, R., Chouinard, P. Y., Julien, C., Petit, H. V., et al. (2013). Effects of increasing amounts of corn dried distillers grains with solubles in dairy cow diets on methane production, ruminal fermentation, digestion, N balance, and milk production. J. Dairy Sci. 96, 2413–2427. doi: 10.3168/jds.2012-6037
Bibby, J., and Toutenburg, H. (1977). Prediction and Improved Estimation in Linear Models. Chichester: John Wiley & Sons.
Boerman, J. P., Potts, S. B., VandeHaar, M. J., and Lock, A. L. (2015). Effects of partly replacing dietary starch with fiber and fat on milk production and energy partitioning. J. Dairy Sci. 98, 7264–7276. doi: 10.3168/jds.2015-9467
Bougouin, A., Leytem, A., Dijkstra, J., Dungan, R. S., and Kebreab, E. (2016). Nutritional and environmental effects on ammonia emissions from dairy cattle housing: A meta -analysis. J. Environ. Qual. 45, 1123–1132. doi: 10.2134/jeq2015.07.0389
Brito, A. F., and Broderick, G. A. (2006). Effect of varying dietary ratios of alfalfa silage to corn silage on production and nitrogen utilization in lactating dairy cows. J. Dairy Sci. 89, 3924–3938. doi: 10.3168/jds.S0022-0302(06)72435-3
Brito, A. F., Tremblay, G. F., Lapierre, H., Bertrand, A., Castonguay, Y., Bélanger, G., et al. (2009). Alfalfa cut at sundown and harvested as baleage increases bacterial protein synthesis in late-lactation dairy cows. J. Dairy Sci. 92, 1092–1107. doi: 10.3168/jds.2008-1469
Broderick, G. A., Koegel, R. G., Walgenbach, R. P., and Kraus, T. J. (2002). Ryegrass or alfalfa silage as the dietary forage for lactating dairy cows. J. Dairy Sci. 85, 1894–1901. doi: 10.3168/jds.S0022-0302(02)74264-1
Broderick, G. A., and Radloff, W. J. (2004). Effect of molasses supplementation on the production of lactating dairy cows fed diets based on alfalfa and corn silage. J. Dairy Sci. 87, 2997–3009. doi: 10.3168/jds.S0022-0302(04)73431-1
Broderick, G. A., and Reynal, S. M. (2009). Effect of source of rumen-degraded protein on production and ruminal metabolism in lactating dairy cows. J. Dairy Sci. 92, 2822–2834. doi: 10.3168/jds.2008-1865
Broderick, G. A., Stevenson, M. J., and Patton, R. A. (2009). Effect of dietary protein concentration and degradability on response to rumen-protected methionine in lactating dairy cows. J. Dairy Sci. 92, 2719–2728. doi: 10.3168/jds.2008-1277
Broderick, G. A., Walgenbach, R. P., and Maignan, S. (2001). Production of lactating dairy cows fed alfalfa or red clover silage at equal dry matter or crude protein contents in the diet. J. Dairy Sci. 84, 1728–1737. doi: 10.3168/jds.S0022-0302(01)74608-5
Broderick, G. A., Walgenbach, R. P., and Sterrenburg, E. (2000). Performance of lactating dairy cows fed alfalfa or red clover silage as the sole forage. J. Dairy Sci. 83, 1543–1551. doi: 10.3168/jds.S0022-0302(00)75026-0
CBS (2010). “Gestandaardiseerde berekeningsmethode voor dierlijke mest en mineralen. Standaardcijfers 1990-2008 (in Dutch),” in Werkgroep Uniformering Berekening Mest- en Mineralencijfers (WUM), eds Van Bruggen, C., de Bode, M. J. C., Evers, A. G., van der Hoek, K. W., Luesink, H. H., van Schijndel (The Hague: Statistics Netherlands, Netherlands, Environmental Assessment Agency, Wageningen University and Research and the Ministry of Agriculture, Nature and Food Quality. Netherlands Statistics).
Cederberg, C., Henriksson, M., and Berglund, M. (2013). An LCA researcher's wish list - data and emission models needed to improve LCA studies on animal production. Animal 7, 212–219. doi: 10.1017/S1751731113000785
Chai, L., Kröbel, R., MacDonald, D., Bittman, S., Beauchemin, K. A., Janzen, H. H., et al. (2016). An ecoregion-specific ammonia emissions inventory of Ontario dairy farming: Mitigation potential of diet and manure management practices. Atmospher. Environ. 126, 1–14. doi: 10.1016/j.atmosenv.2015.11.030.
Colmenero, J. J., and Broderick, G. A. (2006). Effect of amount and ruminal degradability of soybean meal protein on performance of lactating dairy cows. J. Dairy Sci. 89, 1635–1643. doi: 10.3168/jds.S0022-0302(06)72230-5
CVB (2011). Table of Feedstuffs Information About Composition, Digestibility, and Feeding Values. The Hague: Centraal Veevoederbureau, Product board Animal Feed.
Dann, H. M., Tucker, H. A., Cotanch, K. W., Krawczel, P. D., Mooney, C. S., Grant, R. J., et al. (2014). Evaluation of lower-starch diets for lactating Holstein dairy cows. J. Dairy Sci. 97, 7151–7161. doi: 10.3168/jds.2014-8341
Dijkstra, J., Bannink, A., Bosma, P. M., Lantinga, E. A., and Reijs, J. W. (2018). Modelling the effect of nutritional strategies for dairy cows on the composition of excreta nitrogen. Front. Sustain. Food Syst. 2:63. doi: 10.3389/fsufs.2018.00063
Dijkstra, J., France, J., Neal HDSt, C., Assis, A. G., Aroeira, L. J. M., and Campos, O. F. (1996). Simulation of digestion in cattle fed sugarcane: prediction of nutrient supply for milk production with locally available supplements. J. Agric. Sci, Camb. 127, 247–260.
Dijkstra, J., Neal, H. D., Beever, D. E., and France, J. (1992). Simulation of nutrient digestion,absorption and outflow in the rumen: model description. J. Nutr. 122, 2239–2256. doi: 10.1093/jn/122.11.2239
Dijkstra, J., Oenema, O., van Groeningen, J. W., Spek, J. W., van Vuuren, A. M., and Bannink, A. (2013). Diet effects on urine composition of cattle and N2O emissions. Animal 7(Suppl. 2), 292–302. doi: 10.1017/S1751731113000578
Doreau, M., Ferlay, A., Rochette, Y., and Martin, C. (2014). Effects of dehydrated lucerne and soya bean meal on milk production and composition, nutrient digestion, and methane and nitrogen losses in dairy cows receiving two different forages. Animal 8, 420–430. doi: 10.1017/S1751731113002206
EEA (2016). “EMEP/EEA air pollutant emission inventory guidebook 2016,” in Technical Guidance to Prepare National Emission Inventories. 3.B Manure Management. eds B. Amon, N. Hutchings, U. Dämmgen and J. Webb. (Copenhagen: European Environment Agency), Technical report No 21/2016, 56.
Ellis, J. L., Bannink, A., France, J., Kebreab, E., and Dijkstra, J. (2010). Evaluation of enteric methane prediction equations for dairy cows used in whole farm models. Glob. Chang. Biol. 16, 3246–3256. doi: 10.1111/j.1365-2486.2010.02188.x
Eun, J. S., Kelley, A. W., Neal, K., Young, A. J., and Hall, J. O. (2014). Effects of altering alfalfa hay quality when feeding steam-flaked versus high-moisture corn grain on ruminal fermentation and lactational performance of dairy cows1. J. Dairy Sci. 97, 7833–7843. doi: 10.3168/jds.2014-8425
Fanchone, A., Nozière, P., Portelli, J., Duriot, B., Largeau, V., and Doreau, M. (2013). Effects of nitrogen underfeeding and energy source on nitrogen ruminal metabolism, digestion, and nitrogen partitioning in dairy cows. J. Anim. Sci. 91, 895–906. doi: 10.2527/jas.2012-5296
Flis, S. A., and Wattiaux, M. A. (2005). Effects of parity and supply of rumen-degraded and undegraded protein on production and nitrogen balance in Holsteins. J. Dairy Sci. 88, 2096–2106. doi: 10.3168/jds.S0022-0302(05)72886-1
Fredin, S. M., Ferraretto, L. F., Akins, M. S., Bertics, S. J., and Shaver, R. D. (2015). Effects of corn-based diet starch content and corn particle size on lactation performance, digestibility, and bacterial protein flow in dairy cows. J. Dairy Sci. 98, 541–553. doi: 10.3168/jds.2014-8502
Hanigan, M. D., Appuhamy, J. A., and Gregorini, P. (2013). Revised digestive parameter estimates for the Molly cow model. J. Dairy Sci. 96, 3867–3885. doi: 10.3168/jds.2012-6183
Hassanat, F., Gervais, R., Julien, C., Mass,é, D. I., Lettat, A., Chouinard, P. Y., et al. (2013). Replacing alfalfa silage with corn silage in dairy cow diets: effects on enteric methane production, ruminal fermentation, digestion, N balance, and milk production. J. Dairy Sci. 96, 4553–4567. doi: 10.3168/jds.2012-6480
Hatew, B., Bannink, A., van Laar, H., de Jonge, L. H., and Dijkstra, J. (2016). Increasing harvest maturity of whole-plant corn silage reduces methane emission of lactating dairy cows. J. Dairy Sci. 99 354–368. doi: 10.3168/jds.2015-10047
Hatew, B., Podesta, S. C., van Laar, H., Pellikaan, W. F., Ellis, J. L., Dijkstra, J., et al. (2015). Effects of dietary starch content and rate of fermentation on methane production in lactating dairy cows. J. Dairy Sci. 98, 486–499. doi: 10.3168/jds.2014-8427
Hindrichsen, I. K., Wettstein, H. R., Machmüller, A., and Kreuzer, M. (2006). Methane emission, nutrient degradation and nitrogen turnover in dairy cows and their slurry at different milk production scenarios with and without concentrate supplementation. Agric. Ecosyst. Environ. 113, 150–161. doi: 10.1016/j.agee.2005.09.004
Kebreab, E., France, J., Mills, J. A., Allison, R., and Dijkstra, J. (2002). A dynamic model of N metabolism in the lactating dairy cow and an assessment of impact of N excretion on the environment. J. Anim. Sci. 80, 248–259. doi: 10.2527/2002.801248x
Kebreab, E., Johnson, K. A., Archibeque, S. L., Pape, D., and Wirth, T. (2008). Model for estimating enteric methane emissions from United States dairy and feedlot cattle. J. Anim. Sci., 86, 2738–2748. doi: 10.2527/jas.2008-0960
Kebreab, E., Mills, J. A. N., Crompton, L. A., Bannink, A., Dijkstra, J., Gerrits, W. J. J., et al. (2004). An integrated mathematical model to evaluate nutrient partition in dairy cattle between the animal and its environment. Anim. Feed Sci. Technol. 112, 131–154. doi: 10.1016/j.anifeedsci.2003.10.009
Khezri, A., Rezayazdi, K., Mesgaran, M. D., and Moradi-Sharbabk, M. (2009). Effect of different rumen-degradable carbohydrates on rumen fermentation, nitrogen metabolism and lactation performance of Holstein dairy cows. Asian-australas. J. Anim. Sci. 22, 651–658. doi: 10.5713/ajas.2009.80426
Klevenhusen, F., Kreuzer, M., and Soliva, C. R. (2011). Enteric and manure-derived methane and nitrogen emissions as well as metabolic energy losses in cows fed balanced diets based on maize, barley or grass hay. Animal 5, 450–461. doi: 10.1017/S1751731110001795
Klop, A., and de Visser, H. (1994). Effect van Verschillende Verhoudingen Grassilage: Maissilage in Het Rantsoen op Voeropname, Melkproductie, Pensfermentatie, Penskinetiek En Mestverteerbaarheid. Report ID-DLO (IVVO) 279, Lelystad.
Klop, A., van Vuuren, A. M., and de Visser, H. (1997). Effect van Maaistadium van Grassilage en Natief Maiszetmeel in de Dunne Darm op de Beschikbaarheid van Nutrienten. 1. Verteerbaarheid, Afbraakbaarheid, Pens- en Darmkinetiek. Report ID-DLO 97.020, Lelystad.
Kowsar, R., Ghorbani, G. R., Alikhani, M., Khorvash, M., and Nikkhah, A. (2008). Corn silage partially replacing short alfalfa hay to optimize forage use in total mixed rations for lactating cows. J. Dairy Sci. 91, 4755–4764. doi: 10.3168/jds.2008-1302
Ledgard, S. F., Welten, B., and Betteridge, K. (2015). Salt as a mitigation option for decreasing nitrogen leaching losses from grazed pastures. J. Sci. Food Agric. 95, 3033–3040. doi: 10.1002/jsfa.7179
Lin, L. I. (1989). A concordance correlation coefficient to evaluate reproducibility. Biometrics 45, 255–268. doi: 10.2307/2532051
Maesoomi, S. M., Ghorbani, G. R., Alikhani, M., and Nikkhah, A. (2006). Short communication: Canola meal as a substitute for cottonseed meal in diet of midlactation holsteins. J. Dairy Sci. 89, 1673–1677. doi: 10.3168/jds.S0022-0302(06)72234-2
Meijer, G. A. L., Klop, A., van Vuuren, A. M., and de Visser, H. (1998). Het Effect van Chemische en Fysische Samenstelling van Grassilage en Zetmeel op de Nutrientenflux bij Melkkoeien: 3. Fermentatie van NDF en Zetmeel in de Dikke Darm. Report ID-DLO 98.046, Lelystad.
Mills, J. A., Dijkstra, J., Bannink, A., Cammell, S. B., Kebreab, E., and France, J. (2001). A mechanistic model of whole-tract digestion and methanogenesis in the lactating dairy cow: model development, evaluation, and application. J. Anim. Sci. 79, 1584–1597. doi: 10.2527/2001.7961584x
Mohammadzadeh, H., Rezayazdi, K., and Nikkhah, A. (2014). Effects of inclusion of graded amounts of soya bean hulls on feed intake, chewing activity and nutrient digestibility in dairy cows. J. Anim. Physiol. Anim. Nutr. 98, 476–482. doi: 10.1111/jpn.12094
Moore, K. D., Young, E., Gurell, C., Wojcik, M. D., Martin, R. S., Bingham, G. E., et al. (2014). Ammonia measurements and emissions from a California dairy using point and remote sensors. Transac. Am. Soc. Agric. Biol. Eng. 57, 181–198. doi: 10.13031/trans.57.10079
Mosavi, G. H. R., Fatahnia, F., Mirzaei Alamouti, H. R., Mehrabi, A. A., and Darmani Kohi, H. (2012). Effect of dietary starch source on milk production and composition of lactating Holstein cows. South Afr. J. Anim. Sci. 42, 201–209. doi: 10.4314/sajas.v42i3.1
Nemecek, T., and Ledgard, S. (2016). “Modelling farm and field emissions in LCA of farming systems: the case of dairy farming,” in Proceeding of the 10th International Conference on Life Cycle Assessment of Food, UCD (Dublin).
Nielsen, O.-K., Plejdrup, M. S., Winther, M., Mikkelsen, M. H., Nielsen, M., Gyldenkærne, S., et al. (2018). Annual Danish Informative Inventory Report to UNECE. Emission inventories from the base year of the protocols to year 2016. Scientific Report from DCE – Danish Centre for Environment and Energy No. 267, Denmark.
Olijhoek, D. W., Hellwing, A. L. F., Brask, M., Weisbjerg, M. R., Højberg, O., Larsen, M. K., et al. (2016). Effect of dietary nitrate level on enteric methane production, hydrogen emission, rumen fermentation, and nutrient digestibility in dairy cows. J. Dairy Sci. 99, 6191–6205. doi: 10.3168/jds.2015-10691
Paulot, F., Jacob, D. J., Pinder, R. W., Bash, J. O., Travis, K., and Henze, D. K. (2014). Ammonia emissions in the United States, European Union, and China derived by high-resolution inversion of ammonium wet deposition data: interpretation with a new agricultural emissions inventory (MASAGE_NH3). J. Geophys. Res. Atmosph. 119, 4343–4364. doi: 10.1002/2013JD021130
Petit, H. V. (2002). Digestion, milk production, milk composition, and blood composition of dairy cows fed whole flaxseed. J. Dairy Sci. 85, 1482–1490. doi: 10.3168/jds.S0022-0302(02)74217-3
Peyrat, J., Baumont, R., Le Morvan, A., and Nozière, P. (2016). Effect of maturity and hybrid on ruminal and intestinal digestion of corn silage in dry cows. J. Dairy Sci. 99, 258–268. doi: 10.3168/jds.2015-9466
Poorkasegaran, S., and Yansari, A. T. (2014). Effects of different sources of carbohydrates on intake, digestibility, chewing, and performance of Holstein dairy cows. J. Anim. Sci. Biotechnol. 5:6. doi: 10.1186/2049-1891-5-6
Rafiee-Yarandi, H., Ghorbani, G. R., Alikhani, M., Sadeghi-Sefidmazgi, A., and Drackley, J. K. (2016). A comparison of the effect of soybeans roasted at different temperatures versus calcium salts of fatty acids on performance and milk fatty acid composition of mid-lactation Holstein cows. J. Dairy Sci. 99, 5422–5435. doi: 10.3168/jds.2015-10546
Rotz, C. A., Montes, F., Hafner, S. D., Heber, A. J., and Grant, R. H. (2014). Ammonia emission model for whole farm evaluation of dairy production systems. Environ. Qual. 43, 1143–1158. doi: 10.2134/jeq2013.04.0121
Ruppert, L. D., Drackley, J. K., Bremmer, D. R., and Clark, J. H. (2003). Effects of tallow in diets based on corn silage or alfalfa silage on digestion and nutrient use by lactating dairy cows. J. Dairy Sci. 86, 593–609. doi: 10.3168/jds.S0022-0302(03)73638-8
Schiemann, R., Nehring, K., Hoffmann, L., Jentsch, W., and Chudy, A. (1971). Energetische Futterbewertung und Energienormen. Berlin: VEB Deutscher Landwirtschaftsverlag, 344.
Selbie, D. R., Buckthought, L. E., and Shepherd, M. A. (2015). The challenge of the urine patch for managing nitrogen in grazed pasture systems. Adv. Agron. 129, 229–292. doi: 10.1016/bs.agron.2014.09.004
Sinclair, L. A., Edwards, R., Errington, K. A., Holdcroft, A. M., and Wright, M. (2015). Replacement of grass and maize silages with lucerne silage: effects on performance, milk fatty acid profile and digestibility in Holstein-Friesian dairy cows. Animal 9, 1970–1978. doi: 10.1017/S1751731115001470
Sommer, S. G., Zhang, G. Q., Bannink, A., Chadwick, D., Misselbrook, T., Harrison, R., et al. (2006). Algorithms determining ammonia emission from buildings housing cattle and pigs and from manure stores. Adv. Agron. 89, 261–335. doi: 10.1016/S0065-2113(05)89006-6
Soto-Navarro, S. A., Lopez, R., Sankey, C., Capitan, B. M., Holland, B. P., Balstad, L. A., et al. (2014). Comparative digestibility by cattle versus sheep: effect of forage quality. J. Anim. Sci. 92, 1621–1629. doi: 10.2527/jas.2013-6740
Spek, J. W., Bannink, A., Gort, G., Hendriks, W. H., and Dijkstra, J. (2012). Effect of sodium chloride intake on urine volume, urinary urea excretion, and milk urea concentration in lactating dairy cattle. J. Dairy Sci. 95, 7288–7298. doi: 10.3168/jds.2012-5688
Spek, J. W., Bannink, A., Gort, G., Hendriks, W. H., and Dijkstra, J. (2013). Interaction between dietary content of protein and sodium chloride on milk urea concentration, urinary urea excretion, renal recycling of urea, and urea transfer to the gastrointestinal tract in dairy cows. J. Dairy Sci. 96, 5734–5745. doi: 10.3168/jds.2013-6842
Stojanovic, B., Grubic, G., Djordjevic, N., Bozickovic, A., Ivetic, A., and Davidovic, V. (2014). Effect of physical effectiveness on digestibility of ration for cows in early lactation. J. Anim. Physiol. Anim. Nutr. 98, 714–721. doi: 10.1111/jpn.12129
Tas, B. M., Taweel, H. Z., Smit, H. J., Elgersma, A., Dijkstra, J., and Tamminga, S. (2005). Effects of perennial ryegrass cultivars on intake, digestibility, and milk yield in dairy cows. J. Dairy Sci. 88, 3240–3248. doi: 10.3168/jds.S0022-0302(05)73007-1
Valk, H., Klein Poeelhuis, H. W., and Wentink, H. J. (1990). Effect of fibrous and starchy carbohydrates in concentrates as supplements in a herbage-based diet for high-yielding dairy cows. Netherland. J. Agric. Sci. 38, 475–486.
Valk, H., Leusink-Kappers, I. E., and van Vuuren, A. M. (2000). Effect of reducing nitrogen fertilizer on grassland on grass intake, digestibility and milk production of dairy cows. Livestock Product. Sci. 63, 27–38. doi: 10.1016/S0301-6226(99)00118-9
Van der Koelen, C. J., van Vuuren, A. M., de Visser, H., and Klop, A. (1996). Effect van Maaistadium van Grassilage en Ontsloten Maiszetmeel op de Beschikbaarheid van Nutrienten. 1. Verteerbaarheid, afbreekbaarheid, pens- en darmkinetiek. Report ID-DLO 96.004, Lelystad.
Van Duinkerken, G., Blok, M. C., Bannink, A., Cone, J. W., Dijkstra, J., Van Vuuren, A. M., et al. (2011). Update of the Dutch protein evaluation system for ruminants: the DVE/OEB2010 system. J. Agric. Sci. 149, 351–367. doi: 10.1017/S0021859610000912
Van Es, A. (1978). Feed evaluation for ruminants. I. The systems in use from May 1977 onwards in the Netherlands. Livestock Product. Sci. 5, 331–345. doi: 10.1016/0301-6226(78)90029-5
Velthof, G. L., Van Bruggen, C., Groenestein, C. M., de Haan, B. J., Hoogeveen, M. W., and Huijsmans, J. F. M. (2012). A model for inventory of ammonia emissions from agriculture in the Netherlands. Atmos. Environ. 46, 248–255. doi: 10.1016/j.atmosenv.2011.09.075
Vonk, J., Bannink, A., van Bruggen, C., Groenestein, C. M., Huijsmans, J. F. M., van der Kolk, J. W. H., et al. (2016). Methodology for Estimating Emissions from Agriculture in the Netherlands. Calculations of CH4, NH3, N2O, NOx, PM10, PM2.5 and CO2 with the National Emission Model for Agriculture (NEMA). The Statutory Research Tasks Unit for Nature and the Environment (WOT Natuur & Milieu). WOt-technical report 53, Wageningen.
Wakeling, D., Passant, N. R., Murrells, T. P., Misra, A., Pang, Y., Thistlethwaite, G., et al. (2018). National Atmpospheric Emissions Inventory. Report: UK Informative Inventory Report (1990 to 2016), Air Quality Library. Department for Environment Foood and Rural Affairs (DEFRA). Available online at: http://naei.beis.gov.uk/reports/reports?report_id=956.
Warner, D., Dijkstra, J., Hendriks, W. H., and Pellikaan, W. F. (2013a). Passage of stable isotope-labeled grass silage fiber and fiber-bound protein through the gastrointestinal tract of dairy cows. J. Dairy Sci. 96, 7904–7917. doi: 10.3168/jds.2013-7168
Warner, D., Dijkstra, J., Hendriks, W. H., and Pellikaan, W. F. (2013b). Passag kinetics of 13C-labeled corn silage components through the gastrointestinal tract of dairy cows. J. Dairy Sci. 96, 5844–5858. doi: 10.3168/jds.2013-6694
Warner, D., Hatew, B., Podesta, S. C., Klop, G., Van Gastelen, S., van Laar, H., et al. (2016). Effects of nitrogen fertilisation rate and maturity of grass silage on methane emission by lactating dairy cows. Animal 10, 34–43. doi: 10.1017/S1751731115001640
Warner, D., Klop, G., Hatew, B., van Laar, H., Bannink, A., and Dijkstra, J. (2017). Effect of grass silage quality and level of feed intake on enteric methane production in lactating dairy cows. J. Anim. Sci. 95, 3687–3700. doi: 10.2527/jas2017.1459
Warner, D., Podesta, S. C., Hatew, B., Klop, G., van Laar, H., Bannink, A., et al. (2015). Effect of nitrogen fertilization rate and regrowth interval of grass herbage on methane emission of zero-grazing lactating dairy cows. J. Dairy Sci. 98, 3383–3393. doi: 10.3168/jds.2014-9068
Weiss, W. P., Pinos-Rodríguez, J. M., and Wyatt, D. J. (2011). The value of different fat supplements as sources of digestible energy for lactating dairy cows1. J. Dairy Sci. 94, 931–939. doi: 10.3168/jds.2010-3745
Weiss, W. P., St-Pierre, N. R., and Willett, L. B. (2009). Varying type of forage, concentration of metabolizable protein, and source of carbohydrate affects nutrient digestibility and production by dairy cows. J. Dairy Sci. 92, 5595–5606. doi: 10.3168/jds.2009-2247
Yang, W. Z., and Beauchemin, K. A. (2006). Physically effective fiber: method of determination and effects on chewing, ruminal acidosis, and digestion by dairy cows. J. Dairy Sci. 89, 2618–2633. doi: 10.3168/jds.S0022-0302(06)72339-6
Keywords: models, Tier 3, dairy cows, nitrogen digestibility, nitrogen excretion
Citation: Bannink A, Spek WJ, Dijkstra J and Šebek LBJ (2018) A Tier 3 Method for Enteric Methane in Dairy Cows Applied for Fecal N Digestibility in the Ammonia Inventory. Front. Sustain. Food Syst. 2:66. doi: 10.3389/fsufs.2018.00066
Received: 09 April 2018; Accepted: 18 September 2018;
Published: 05 November 2018.
Edited by:
Tom Misselbrook, Rothamsted Research (BBSRC), United KingdomReviewed by:
Michel A. Wattiaux, University of Wisconsin-Madison, United StatesLaura Zavattaro, Università degli Studi di Torino, Italy
Copyright © 2018 Bannink, Spek, Dijkstra and Šebek. This is an open-access article distributed under the terms of the Creative Commons Attribution License (CC BY). The use, distribution or reproduction in other forums is permitted, provided the original author(s) and the copyright owner(s) are credited and that the original publication in this journal is cited, in accordance with accepted academic practice. No use, distribution or reproduction is permitted which does not comply with these terms.
*Correspondence: André Bannink, YW5kcmUuYmFubmlua0B3dXIubmw=