- School of Biosciences, University of Nottingham, Loughborough, United Kingdom
Dairy cows are known to mobilize body fat to achieve their genetic potential for milk production, which can have a detrimental impact on the health, fertility and survival of the cow. Better monitoring of cows with poor body condition (low or high body fat) will lead to improvements in production efficiencies and less wasted resources when producing milk from dairy cows. The aim of this study was to compare different methods for monitoring the body condition (body fat) of dairy cows. The methods used to measure body condition were: ultrasound scanner, manual observation, and a still digital image of the cow. For comparison, each measure was expressed as a body condition score (BCS) on a scale of extremely thin (1) to very fat (5) in quarter intervals. A total of 209 cows at various stages of lactation were assessed. Lin's concordance correlation coefficient (CCC) and the root mean square prediction error (RMSPE) were used to compare the accuracy of methods. The average BCS across cows was 2.10 for ultrasound, 2.76 for manual and 2.41 for digital methods. The study found that both manual (r = 0.790) and digital (r = 0.819) approaches for monitoring cow body condition were highly correlated with ultrasound BCS measurements. After adjusting correlation coefficients for prediction bias relative to a 45° line through the origin, the digital BCS had a higher CCC of 0.789 when compared to the ultrasound BCS than the manual BCS with a CCC of 0.592. The digital BCS also had a lower prediction error (RMSPE = 28.3%) when compared with ultrasound BCS than the manual BCS (RMSPE = 42.7%). The prediction error for digital and manual BCS methods were similar for cows with a BCS of 2.5 or more (RMSPE = 20.5 and 19.0%, respectively) but digital BCS was more accurate for cows of < 2.5 BCS (RMSPE = 35.5 and 63.8%, respectively). Digital BCS can provide a more accurate assessment of cow body fat than manual BCS observations, with the added benefit of more automated and frequent monitoring potentially improving the welfare and sustainability of high production systems.
Introduction
Originally body condition scoring was developed for management in sheep during the 1960s, before being adopted for use with cattle in the 1970s (Earle, 1976; Bewley and Schutz, 2008). The approach was developed to help farmers monitor the body fat composition of animals at key stages in production i.e., parturition, mating, lactation. Furthermore, assessment of animal body condition is used to inform decisions on appropriate feed allocation at an animal's given stage of production (Keady et al., 2005). This is therefore a valuable tool to manage animal productivity and feed utilization (Roche et al., 2009).
Garnsworthy (2007) suggests that cows have a physiological target level for body reserves in early lactation, and cows will try to reach a target BCS of 2.5 at around 12–15 weeks post-partum. Target BCS is influenced by genetics. Given the importance of body condition at different stages of production and their physiological target, a reliable phenotypic measure of BCS would be extremely beneficial. Typically, body condition is managed by appropriate nutrition, and Garnsworthy and Jones (1987) proposed that cows with low BCS (2.0) should be fed a high protein diet which maintains BCS by using excess protein for gluconeogenesis rather than body reserves, whereas fatter cows (BCS 3.5) had a greater loss of condition. Alternatively, high BCS cows can be fed a low fiber, high starch diet to reduce BCS loss, and this type of diet will also increase BCS in cows with a low BCS (Garnsworthy and Jones, 1993). The need to frequently monitor changes in body condition and prevent excessive body condition loss (more than 0.5 BCS) is further supported by studies highlighting associations with poor health, fertility, and ultimately survival. Research has shown that cows with a (high) BCS of 3.5 are twice more likely to develop ketosis than cows with a (low) BCS of 2.0 (Reid et al., 1986); and a 2–4 times higher risk of having ketosis in the next lactation (Rasmussen et al., 1999). Other health risks include increased chance of a retained placenta and/or metritis, and oestrus not being observed if cows have a low BCS (Markusfeld et al., 1997). It is estimated that conception rate decreases by 10% for every 0.5 BCS lost (Butler, 2005) and cows losing >1.0 BCS post-partum take on average 11 days longer to conceive than those that maintained or only lost a 0.5 BCS (Lopez-Gatius et al., 2003). Oestrus in cattle occurs when they are also lactating. For high milk yielding dairy cows this can pose a challenge, as the metabolic demands of milk production, and the mobilizing of body fat to produce milk, tend to take priority over reproduction, and can lead to conception failure due to a low negative energy balance (Collard et al., 2000). Therefore, monitoring individual cow body fat and maintaining adequate body condition is essential to maintain a productive animal that has appropriate nutrition and fertility, whilst also producing acceptable amounts of milk. While Holstein dairy cows are a popular breed for producing high volumes of milk, they are also characterized by having lower body condition score (BCS), and reduced fertility and survival compared to other breeds (Dillon et al., 2006). Bell and Wilson (2018) identified body condition as an important phenotypic trait, along with feed utilization, enteric methane emissions, health, fertility, and survival, associated with more sustainable milk production in UK dairy herds. The authors found that the cost of poor fertility in the UK (each day over the optimal calving interval length of 365 days) is about £2.80 per day with an associated increase in emissions of greenhouse gases for each extra day of about 15 kg of carbon dioxide equivalent (CO2-eq.) emissions per cow and 23 kg CO2-eq. emissions per kilogram milk solids. Ultimately poor health and fertility can lead to poor survival. The cost of poor survival in the UK (each percentage increase in cows culled or died within a herd) is estimated at about £13.50 per percentage of cows lost from a herd, with each percentage change resulting in an increase in CO2-eq. emissions of about 50 kg per cow and 91 kg per kilogram milk solids due to resources required by replacement animals (Bell and Wilson, 2018).
The most widely used and traditional method of body condition scoring is by manual observation and/or physical examination of the animal to form an assessment of overall body condition (Edmonson et al., 1989; Roche et al., 2004). Body condition is scored using a variety of scales and approaches (Bewley and Schutz, 2008), but typically on a scale of extremely thin (1) to very fat (5 or 9 depending on scale adopted) in quarter intervals. To reduce the subjective nature of scoring, manual observers require training to ensure a consistent, and reliable measure. The approach also requires labor time and is therefore generally done once per week or only at key stages of production, if at all. The scoring method provides a simple means for people to manually monitor the body fat of animals. In recent years the expectation has been for each stockperson to look after more animals, as input costs (such as labor and feed) have increased. Also, finding skilled farm workers has become more difficult. With these developments has come new and more mobile technologies such as ultrasound for measuring body composition (fat and muscle) and digital image analysis software. These new technologies provide the potential to produce more objective measures for monitoring body condition (body fat) of livestock. While the use of ultrasound scanners requires a trained operator and can be an expensive device, the opposite is true of camera surveillance systems with digital image analysis software. Rather than rely on more specialized ultrasound equipment to accurately measure body fat and obtain a BCS (Domecq et al., 1995; Hussein et al., 2013; Singh et al., 2015), digital camera systems provide the opportunity for continuous and automated monitoring in real-time and potentially requires no prior training by the user other than interpreting the output. Several commercially available digital BCS tools exist (Bewley et al., 2008; Halachmi et al., 2008; Azzaro et al., 2011) and take images from above the animal to relate body shape angles around the hook bones and caudal area to BCS. Due to the images being taken from directly above the animal, the curvature around the hook bones has proved more useful in predictions than when including the tail head (Bewley et al., 2008). However, this is partly a function of the camera angle used to obtain the digital image. Also, the body curvature around the hook bones can be influenced by gut fill and pregnancy, and stage of production.
The objective of this study was to compare three different methods for measuring the body condition of dairy cows using an ultrasound scanner, manual observation, and a still digital image of the cow. An objective measure (i.e., still digital image) may provide a more accurate approach to identify animals that are too thin or too fat compared to a subjective measure (i.e., manual observations).
Materials and Methods
Approval for this study was obtained from the University of Nottingham animal ethics committee before commencement of the study.
Data
Data were obtained from a total of 209 cows from two Holstein dairy herds, with 87 cows from Farm A, and 122 cows from Farm B. The cows used in this study represented a range of stages of production from early, mid and late lactation, and prior to calving. Farms were visited between May and July 2017, and cows were randomly selected from each herd. Lactating cows at Farm A were milked twice per day using a traditional herringbone parlor and had access to grazing, whereas cows at Farm B used an automatic milking station and were housed throughout lactation. Whilst lactating, cows at Farm A were grouped and fed according to stage of production (i.e., early, mid, or late lactation), whereas at Farm B cows were of various stages of production within a group of about 40 cows allocated to three automatic milking stations and fed the same diet. Both farms had a similar average daily milk yield of 30.1 L/day at Farm A and 32.1 L/day at Farm B.
Body Fat and Body Condition Measurements
There were three methods used to measure the body condition of each cow, which were (1) manual observation, (2) ultrasound scanner, and (3) a still digital image. The body condition and fat depth measurements for all cows were assessed by the same operator with experience and training in assessment of body condition and ultrasound measurements. For the purpose of comparing different BCS methods, all measurements were taken in the same caudal area.
Manually Observed Body Condition
A combination of a visual observation and physical examination of the cow's body fat around its tail head was carried out following the condition scoring method of Edmonson et al. (1989). The amount of subcutaneous fat of each animal is assessed by a combination of manual palpation by hand of the tail head and observing from directly behind the cow the shape of the loins (e.g., spinous processes), pelvis (e.g., hook and pin bones), and tail head (e.g., tail and depression beneath the tail) areas. Based on the assessment an overall BCS was then attributed on a scale of extremely thin (1) to very fat (5) in quarter intervals (Edmonson et al., 1989).
Ultrasound Fat Depth
After the manual body condition assessment, an Easy-scan 4 (BCF, Livingstone, UK) ultrasound scanner was used to measure body fat on the rump of each cow, as illustrated in Figure 1. The rump of the cow was cleaned, and ultrasound gel was applied to the area prior to obtaining an ultrasound image (Figure 2) showing skin, subcutaneous fat, and muscle depths. The scanner has a linear multi-frequency (4.5–8.5 MHz) probe, and the body composition mode with inbuilt manual caliper function was used to measure subcutaneous fat depth in millimeters. The examination site was specifically located in front of the tuber ischia (pin bone) and following a line to the tuber coxae (hook bone). This location has been found by others to be the most appropriate (Schroder and Staufenbiel, 2006) and also ensuring suitable contact between the ultrasound probe head and the cow's body for better image quality.
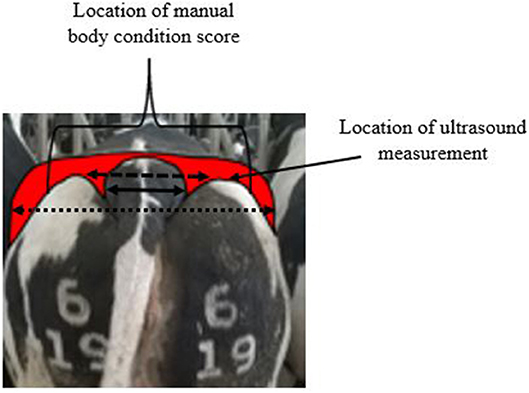
Figure 1. Example of a digital image taken of the caudal area of the cow showing annotation for measurement of tail head width (solid line), distance between hook bones (dotted line), and pin bones (dashed line), and location of manual observed body condition and ultrasound measurement.
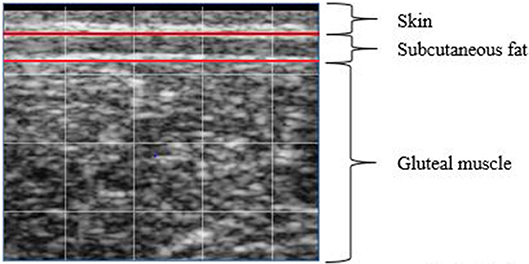
Figure 2. Example of an ultrasound image used to measure subcutaneous fat depth (mm) between the red lines.
Digital Photo Measurements
After obtaining the manual score and ultrasound measurement, a handheld 5 megapixel camera (Vodafone Smart Tab 4G, Newbury, UK) of 2,592 × 1,944 pixel resolution was used to obtain a still digital photo of the caudal area of each cow (Figure 2), and the area where manual and ultrasound measurements had been obtained. The image photo was taken from directly behind the cow at a 10° angle above the tail head and from 2 m behind the cow. No adjustment for lighting was required. Digital software (Inkscape 0.91, Boston, US) was subsequently then used to measure the tail head width distance, distance between the hook bones and distance between the pin bones of each cow. The distances were measured in pixels and the width of the tail head was expressed as a percentage of the distance between the pin bones or the distance between the hook bones.
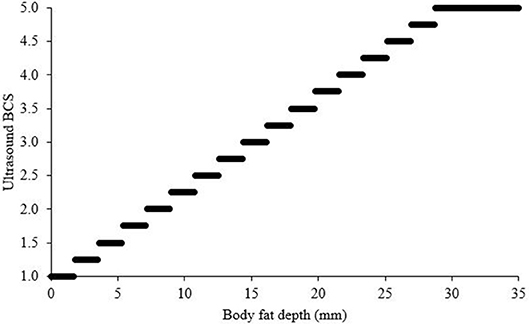
The ultrasound body fat measurement was used to test the accuracy of manual and digital body condition measures. The ultrasound fat depth measurement was converted to a linear BCS from 1 to 5 with quarters by attributing the fat depth value to one of 17 categories, as shown in Figure 3.
Statistical Analysis
Pearson correlation coefficient (r) was multiplied by Lin's bias correction factor (Cb), which determines how far the best-fit line deviates from the 45° line through the origin, to derive the concordance correlation coefficient (CCC) (Lin, 1989). The coefficient CCC was used to test the association between ultrasound BCS and manual or digital BCS. Ultrasound (Oi) and manual or digital BCS (Pi) were also compared by their overall prediction error, and prediction error associated with cows < 2.5 BCS and cows 2.5 BCS or more, using the square root of the mean square prediction error (RMSPE) expressed as a percentage of the observed mean ultrasound BCS. The mean square prediction error (MSPE) was calculated (Equation 1) for all 209 observations (n):
Results
Farm Data
On average cows at Farm A had less body fat (5.28 mm) than cows at Farm B (11.32 mm) (Table 1). The coefficient of variation for measured fat depth was greater at 81% for Farm A compared to 68% for Farm B.

Table 1. Mean (s.d.) body fat depth, tail head to pin and hook bone widths, ultrasound, manual, and digital body condition scores at Farm A and B and across farms.
For the analysis, the data from both farms was combined into a single dataset with animals of BCS from extremely thin (1) to very fat (5).
Body Condition Score Measures
The ultrasound BCS was compared to the digital measurements of tail head to pin bones and hook bones dimensions. There was a strong positive relationship between ultrasound BCS and the tail head to pin bones width (Figure 4). There was a poor relationship between the ultrasound BCS and the tail head to hook bones width (Figure 5).
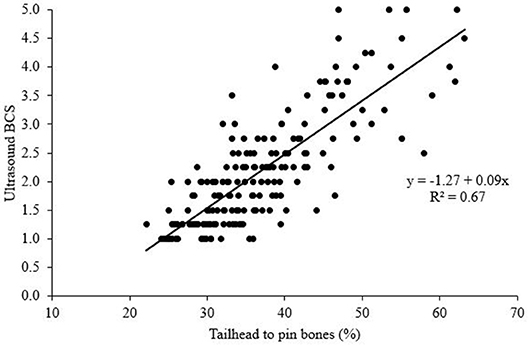
Figure 4. Relationship between the tail head to pin bones width and ultrasound body condition score (BCS).
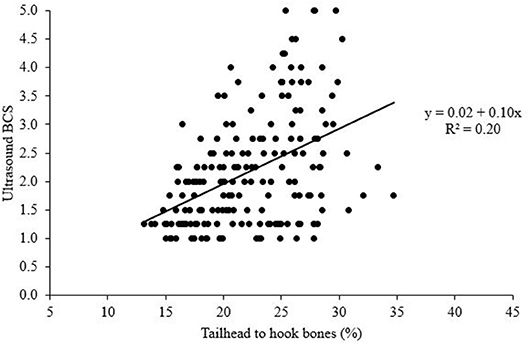
Figure 5. Relationship between the tail head to hook bones width and ultrasound body condition score (BCS).
Given the relationship between the tail head to pin bones width and ultrasound BCS (Figure 4), the values for tail head to pin bones (ranging from 22.2 to 63.2%) were converted to a linear digital BCS with 17 classifications for comparison with other scoring methods, as shown in Figure 6.
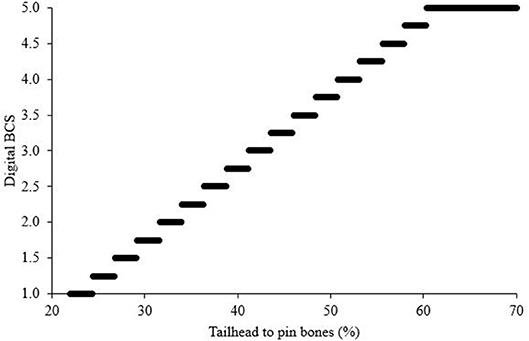
Figure 6. Classification of digital measure of tail head to pin bones width into 17 body condition scores (BCS).
The manual BCS had a high and positive correlation with the ultrasound BCS (r = 0.790) and had a high Lin's bias correction factor (Cb = 0.749), resulting in a moderate CCC of 0.592. However, the manual BCS tended to over predict the body fat of cows when compared to the ultrasound fat depth measure (Figure 7), and particularly at lower body condition scores. The manual BCS had a relatively high prediction error (RMSPE = 42.7%) when compared with the ultrasound BCS, with the error being lower for cows of 2.5 BCS or more (RMSPE = 19.0%) compared to cows of < 2.5 BCS (RMSPE = 63.8%).
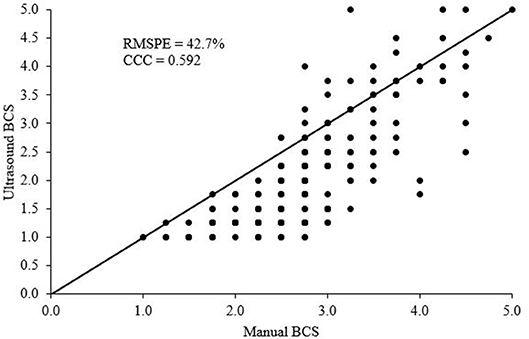
Figure 7. Relationship between manual observed and ultrasound body condition score (BCS). Root mean square prediction error (RMSPE) expressed as a percentage of the observed mean for ultrasound BCS and Lin's concordance correlation coefficient (CCC) are shown, and the 45° line through the origin.
The digital BCS had a high and positive correlation with the ultrasound BCS (r = 0.819) and had a high Lin's bias correction factor (Cb = 0.964), resulting in a high CCC of 0.789. The prediction error of the digital BCS was moderately low (RMSPE = 28.3%) when compared with the ultrasound BCS (Figure 8) and was even lower for cows of 2.5 BCS or more (RMSPE = 20.5%) compared to cows of < 2.5 BCS (RMSPE = 35.5%).
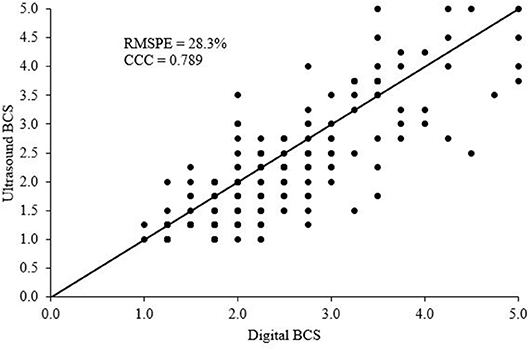
Figure 8. Relationship between digital and ultrasound body condition score (BCS). Root mean square prediction error (RMSPE) expressed as a percentage of the observed mean for ultrasound BCS and Lin's concordance correlation coefficient (CCC) are shown, and the 45° line through the origin.
Discussion
The current study compared manual observations of BCS and digital BCS methods with detailed body fat depth measurements using an ultrasound scanner, taken in the same caudal area for each cow. The dataset provided the necessary range of animals with body condition scores from extremely thin (1) to very fat (5) for the analysis and comparison of scoring methods (Edmonson et al., 1989; Schroder and Staufenbiel, 2006). The linear classification of ultrasound measured subcutaneous fat into 17 BCS categories from 1 to 5, and subcutaneous body fat values ranging from 0.9 to 33.2 mm, was comparable in the current study (Figure 3) to that found by Schroder and Staufenbiel (2006). Both herds used in the current study consisted of high milk yielding Holstein dairy cows, with a similar average daily milk yield (30.1 L/day at Farm A and 32.1 L/day at Farm B), however, the herds were managed differently with cows at Farm A grouped and fed according to stage of production whereas at Farm B cows were of various stages of production within a group using an automatic milking station. The difference in management meant that at farm B the cows had a higher average body fat (11.3 mm) than the cows at Farm A (5.3 mm). The methods assessed all measured subcutaneous fat depth, expressed as a BCS, and assumed that this provided an appropriate assessment to the animal's subcutaneous fat and overall body fat reserves (Domecq et al., 1995; Schroder and Staufenbiel, 2006; Hussein et al., 2013). The data obtained in the current study would suggest that optimum BCS of 2.5 at about 50 days postpartum to 3.0 at calving and toward the end of lactation (Chagas et al., 2007) is often not achieved for modern high milk yielding dairy cows. This is considered the optimum range, with an acceptable change of 0.5 BCS, so dairy cows can minimize the impact of mobilizing body reserves for milk production and negative energy balance on health, fertility, and well-being, whilst still allowing cows to achieve adequate milk production (Roche et al., 2009). Across all cows, the manual BCS produced the highest average BCS of 2.76, compared to 2.41 for digital BCS and 2.10 for ultraound BCS. The ultrasound and digital methods were below the recommended “ideal” range of 2.5–3.0 (Chagas et al., 2007). On average, the manual BCS overpredicted body condition when compared to ultrasound measurements by 31%. This over prediction of manual BCS was greater in low BCS cows at 57% higher than ultrasound measurements (Figure 7). A limitation of visual assessment of body condition is that it is unlikely to accurately detect subtle changes in body composition change at a BCS of < 2.5 (low), which equates to a subcutaneous fat depth of < 13 mm (Figure 3). Also, at very low subcutaneous fat depths, the decrease in BCS may represent protein loss and not changes in body fat reserves (MacDonald et al., 1999). The cows in the current study had high genetic potentials for milk, which is known to result in greater loss of BCS over a longer period postpartum and a failure to repartition significant amounts of energy toward body reserves until later in lactation or when lactation ceases (Roche et al., 2006). The main benefit of better monitoring of cow body condition is to improve awareness of animals that are too thin or too fat, and consequently of higher risk from poor health, fertility, and survival (Reid et al., 1986; Markusfeld et al., 1997; Lopez-Gatius et al., 2003). There is little evidence to suggest that improvements have been made with regard to health and fertility in recent decades (Farm Animal Welfare Council (FAWC), 2009), and therefore supporting the case for enhanced monitoring of animals and their body condition. With less wastage of resources such as feed, a 1-kg improvement in feed utilization per cow per year would mitigate 1.3 kg of CO2-eq. emissions each year, which for the UK dairy cow population of 1.8 million cows would equate to a reduction of 2,340 t CO2-eq. emissions and more profit of £324,000 to the dairy industry (Bell et al., 2015). Improving health, fertility, and survival of cows will increase profitability and reduce greenhouse gas emissions intensity of milk production (Bell and Wilson, 2018), leading to more sustainable milk production systems.
To address the need for better and frequent monitoring of cow body condition, there has been considerable interest in the use and application of digital technologies to predict body condition. Taking digital images of the rear or caudal area has also been shown to provide a reliable measure of body condition (Ferguson et al., 2006). Therefore, the current study focused on measuring caudal subcutaneous fat and body condition, which are not influenced by gut fill or pregnancy or stage of production and have been shown to provide a reliable measure of body fat (Schroder and Staufenbiel, 2006). In the current study a digital BCS of cows was also estimated from the tail head to pin bones width, which had a similar accuracy to manual BCS for cows of 2.5 BCS or more (RMSPE of 20.5 and 19.0%, respectively) but higher accuracy for thinner cows of < 2.5 BCS (RMSPE of 35.5 and 63.8%, respectively). This suggests that digital images from tail head dimensions can be used to monitor cows with a broad range of body conditions. The accuracy of the digital BCS prediction can be further refined using computer vision techniques to automatically extract image measurements and can also be estimated by Equation (2) (Figure 4):
There are several factors that can reduce the reliability of digital BCS predictions and therefore need to be considered. The current study supports the finding of Ferguson et al. (2006) that the image photo needs to be taken at a 0–20° angle above the tail head to get an optimum image for assessment. Also, the influence of changing light, cow posture and color, and tail movement may be causes of error, however, they were not a problem when conducting measurements in the current study.
If an accurate method was developed that could detect low body fat changes and monitor animals frequently, then impacts on the well-being of a cow can be minimized and managed better than current practice. The different methods (ultrasound, manual, or digital) assessed can all provide an easy, quick, and practical measure for monitoring body condition on farms. For large numbers of animals, the use of an ultrasound scanner can be more time consuming than manual or digital camera methods. Ultrasound measurements are more expensive, but accurate, and can be used for other tasks such as pregnancy diagnosis of animals. Both ultrasound and manual BCS methods can be done infrequently whilst performing other routine animal husbandry tasks, while automated digital analysis may provide the “ideal” cow BCS profile based on frequent measurements.
The methods assessed all provide a useful and easily implemented tool for monitoring cow BCS on commercial farms to improve farm level decision making and awareness of cow body condition. The approaches compared offer different levels of complexity to monitoring cow body condition, with manual and ultrasound methods requiring operator training, whereas digital photos require minimal user input and provide an automated objective measure. Across a wide range of BCS, digital BCS was found to provide a more accurate assessment of cow body condition than manual BCS observations when compared to ultrasound body fat measurements. The digital BCS can remove operator error and provide frequent monitoring to allow detection of short-term changes in body condition, which will ultimately improve cow performance and well-being, and enhance the sustainability of high milk production systems.
Author Contributions
MB, MM, MS, and RP collected the data. MB and RP carried out the analysis and wrote the paper.
Conflict of Interest Statement
The authors declare that the research was conducted in the absence of any commercial or financial relationships that could be construed as a potential conflict of interest.
Acknowledgments
The authors are grateful to both farms included in the study for allowing use of their animals. The research received funding from the University of Nottingham RPA. MM is grateful to the Erasmus Programme that enabled her research placement at The University of Nottingham.
References
Azzaro, G., Caccamo, M., Ferguson, J. D., Battiato, S., Farinella, G. M., Guarnera, G. C., et al. (2011). Objective estimation of body condition score by modelling cow body shape from digital images. J. Dairy Sci. 94, 2126–2137. doi: 10.3168/jds.2010-3467
Bell, M. J., Garnsworthy, P. C., and Stott, A. W. Pryce, J. E. (2015). The effect of changing cow production and fitness traits on profit and greenhouse gas emissions from UK Dairy systems. J. Ag. Sci. 153, 138–151. doi: 10.1017/S0021859614000847
Bell, M. J., and Wilson, P. (2018). Estimated differences in economic and environmental performance of forage-based dairy herds across the UK. Food Energy Secur. 7:e00127. doi: 10.1002/fes3.127
Bewley, J. M., Peacock, A. M., Lewis, O., Boyce, R. E., Roberts, D. J., Coffey, M. P., et al. (2008). Potential for estimation of body condition scores in dairy cattle from digital images. J. Dairy Sci. 91, 3439–3453. doi: 10.3168/jds.2007-0836
Bewley, J. M., and Schutz, M. M. (2008). Review: an interdisciplinary review of body condition scoring for dairy cattle. Prof. Anim. Sci. 24, 507–529. doi: 10.15232/S1080-7446(15)30901-3
Butler, W. R. (2005). Nutrition, negative energy balance and fertility in the postpartum dairy cow. Cattle Pract. 13, 13–18. Available online at: https://www.bcva.eu/cattle-practice/documents/1754
Chagas, L. M., Bass, J. J., Blache, D., Burke, C. R., Kay, J. K., Lindsay, D. R., et al. (2007). Invited review: new perspectives on the roles of nutrition and metabolic priorities in the subfertility of high-producing dairy cows. J. Dairy Sci. 90, 4022–4032. doi: 10.3168/jds.2006-852
Collard, B. L., Boettcher, P. J., Dekkers, J. C., Petitclerc, D., and Schaeffer, L. R. (2000). Relationships between energy balance and health traits of dairy cattle in early lactation. J. Dairy Sci. 83, 2683–2690. doi: 10.3168/jds.S0022-0302(00)75162-9
Dillon, P., Berry, D. P., Evans, R. D., Buckley, F., and Horan, B. (2006). Consequences of genetic selection for increased milk production in European seasonal pasture based systems of milk production. Livest. Sci. 99, 141–158. doi: 10.1016/j.livprodsci.2005.06.011
Domecq, J. J., Skidmore, A. L., Lloyd, J. W., and Kaneene, J. B. (1995). Validation of body condition scores with ultrasound measurements of subcutaneous fat of dairy cows. J. Dairy Sci. 78, 2308–2313. doi: 10.3168/jds.S0022-0302(95)76857-6
Edmonson, A. J., Lean, I. J., Weaver, L. D., Farver, T., and Webster, G. (1989). A body condition scoring chart for Holstein dairy cows. J. Dairy Sci. 72, 68–78. doi: 10.3168/jds.S0022-0302(89)79081-0
Farm Animal Welfare Council (FAWC) (2009). Opinion on the Welfare of the Dairy Cow. London: Farm Animal Welfare Council.
Ferguson, J. D., Azzaro, G., and Licitra, G. (2006). Body condition assessment using digital images. J. Dairy Sci. 89, 3833–3841. doi: 10.3168/jds.S0022-0302(06)72425-0
Garnsworthy, P. C. (2007). “Body condition score in dairy cows: targets for production and fertility,” in Recent Advances in Animal Nutrition 2006, eds P. C. Garnsworthy and J. Wiseman (Nottingham: Nottingham University Press), 61–86.
Garnsworthy, P. C., and Jones, G. P. (1987). The influence of body condition at calving and dietary protein supply on voluntary food intake and performance in dairy cows. Anim. Prod. 44, 347–353. doi: 10.1017/S0003356100012277
Garnsworthy, P. C., and Jones, G. P. (1993). The effects of dietary fibre and starch concentrations on the response by dairy cows to body condition at calving. Anim. Prod. 57, 15–21. doi: 10.1017/S0003356100006553
Halachmi, I., Polak, P., Roberts, D. J., and Klopcic, M. (2008). Cow body shape and automation of condition scoring. J. Dairy Sci. 91, 4444–4451. doi: 10.3168/jds.2007-0785
Hussein, H. A., Westphal, A., and Staufenbiel, R. (2013). Relationship between body condition score and ultrasound measurement of backfat thickness in multiparous Holstein dairy cows at different production phases. Aust. Vet. J. 91, 185–189. doi: 10.1111/avj.12033
Keady, T. W. J., Mayne, C. S., Kilpatrick, D. J., and McCoy, M. A. (2005). Effect of level and source of nutrients in late gestation on subsequent milk yield and composition and fertility of dairy cows. Livest. Prod. Sci. 94, 237–248. doi: 10.1016/j.livprodsci.2004.12.001
Lin, L. I. (1989). A concordance correlation coefficient to evaluate reproducibility. Biometrics 45, 255–268. doi: 10.2307/2532051
Lopez-Gatius, F., Yaniz, J., and Madriles-Helm, D. (2003). Effects of body condition score and score change on the reproductive performance of dairy cows: a meta-analysis. Theriogenology 59, 801–812. doi: 10.1016/S0093-691X(02)01156-1
MacDonald, K. A., Verkerk, G. A., and Penno, J. W. (1999). Validation of body condition scoring by using ultrasound measurements of subcutaneous fat. Proc. N. Z. Soc. Anim. Prod. 59, 177–179.
Markusfeld, O., Galon, N., and Ezra, E. (1997). Body condition score, health, yield and fertility in dairy cows. Vet. Record. 141, 67–72. doi: 10.1136/vr.141.3.67
Rasmussen, L. K., Nielsen, B. L., Pryce, J. E., Mottram, T. T., and Veerkamp, R. F. (1999). Risk factors associated with the incidence of ketosis in dairy cows. Anim. Sci. 68, 379–386. doi: 10.1017/S1357729800050372
Reid, I. M., Roberts, C. J., Treacher, R. J., and Williams, L. A. (1986). Effect of body condition at calving on tissue mobilisation, development of fatty liver and blood chemistry of dairy cows. Anim. Prod. 43, 7–15. doi: 10.1017/S0003356100018298
Roche, J. R., Berry, D. P., and Kolver, E. S. (2006). Holstein-friesian strain and feed effects on milk production, body weight, and body condition score profiles in grazing dairy cows. J. Dairy Sci. 89, 3532–3543. doi: 10.3168/jds.S0022-0302(06)72393-1
Roche, J. R., Dillon, P. G., Stockdale, C. R., Baumgard, L. H., and VanBaale, M. J. (2004). Relationships among international body condition scoring systems. J. Dairy Sci. 87, 3076–3079. doi: 10.3168/jds.S0022-0302(04)73441-4
Roche, J. R., Friggens, N. C., Kay, J. K., Fisher, M. W., Stafford, K. J., and Berry, D. P. (2009). Invited review: body condition score and its association with dairy cow productivity, health, and welfare. J. Dairy Sci. 92, 5769–5801. doi: 10.3168/jds.2009-2431
Schroder, U. J., and Staufenbiel, R. (2006). Invited review: methods to determine body fat reserves in the dairy cow with special regard to ultrasonographic measurement of backfat thickness. J. Dairy Sci. 89, 1–14. doi: 10.3168/jds.S0022-0302(06)72064-1
Keywords: cattle, body fat, objective assessment, health, wellbeing
Citation: Bell MJ, Maak M, Sorley M and Proud R (2018) Comparison of Methods for Monitoring the Body Condition of Dairy Cows. Front. Sustain. Food Syst. 2:80. doi: 10.3389/fsufs.2018.00080
Received: 24 July 2018; Accepted: 08 November 2018;
Published: 26 November 2018.
Edited by:
Will Peach, Royal Society for the Protection of Birds, United KingdomReviewed by:
Yiorgos Gadanakis, University of Reading, United KingdomEmma Louise Burns, Australian National University, Australia
Copyright © 2018 Bell, Maak, Sorley and Proud. This is an open-access article distributed under the terms of the Creative Commons Attribution License (CC BY). The use, distribution or reproduction in other forums is permitted, provided the original author(s) or licensor are credited and that the original publication in this journal is cited, in accordance with accepted academic practice. No use, distribution or reproduction is permitted which does not comply with these terms.
*Correspondence: Matt J. Bell, bWF0dC5iZWxsQG5vdHRpbmdoYW0uYWMudWs=
 Matt J. Bell
 Mareike Maak