 Diego Pizzeghello1*
 Michela Schiavon1
 Laura Maretto1
 Piergiorgio Stevanato1
 Andrea Ertani1
 Adriano Altissimo2
 Serenella Nardi1
- 1Department of Agronomy, Food, Natural resources, Animals and Environment (DAFNAE), University of Padua, Padua, Italy
- 2Landlab S.r.l., Vicenza, Italy
Mineral phosphorus (P) fertilization in calcareous soils is not efficient enough to ensure optimal plant growth. Therefore, a higher P input is generally needed. Polymer-coated fertilizers are a promising fertilizer category that seems to affect soil extractable P, thus permitting a reduction in fertilizer rates. We tested this hypothesis in a short-term (45 days) field trial by evaluating both the agronomic and the environmental implications. In this study, two conventional fertilizers (single superphosphate, SSP; mono-ammonium phosphate, MAP) and a slow P-release fertilizer (polymer-coated MAP, PCMAP) were tested for their effects on soil P pools by combining different P rates and degrees of coating. The P soil test was determined with either Olsen or Mehlich-3 solution (available P), whereas the P soil release was estimated through water extraction. The efficiency of fertilizers was evaluated by assessing the growth of Hypericum × moserianum (L.) plants. As expected, both SSP and MAP influenced the soil Mehlich-3-P, Olsen-P, and water-P, as concentrations increased with the fertilizer rate. Conversely, PCMAP decreased the soil extractable P with increasing coating. The plant dry weight and P uptake linearly correlated with the fertilizer rate for SSP and MAP, whilst they achieved the maximum yield with PCMAP. This result indicates the underdosing for conventional fertilizers. With reference to the soil test P with water-P, the presence of change points showed low water-P release concentrations for PCMAP and SSP, and high water-P release for MAP. In conclusion, in the short-term period both soil extractable P and water-P depend on the type of fertilizer, whereas the amount of added P has rather a secondary role. PCMAP, in particular, ensures high plant P use efficiency with minimum environmental impacts.
Introduction
The efficiency of mineral phosphorus (P) fertilizers is generally questionable when applied to calcareous soils due to the rapid fixation of P into sparingly soluble forms that are not promptly available for the plant uptake (Chien et al., 2011). Indeed, under alkaline conditions a large proportion of P added to the soil through inorganic fertilizers can be rapidly converted into pools unavailable to plants via precipitation of Ca-P compounds (Bertrand et al., 2006). The importance of P precipitation reactions in controlling P availability and the fertilizer efficiency has been previously reported by Lombi et al. (2006), who pinpointed the presence of apatite-like compounds among the P species in the soil around mono-ammonium phosphate (MAP) fertilizer granules.
Recent evidence shows that recurrent applications of inorganic P fertilizers and livestock manure that exceed the P removal capacity by crops thriving on calcareous soils can result in P concentrations in the upper soil layers higher than those required for the optimal plant growth (Hao et al., 2008; Vu et al., 2009; Pizzeghello et al., 2011). Furthermore, changes in P sorption properties may occur in the deeper soil layers (Olson et al., 2010; Pizzeghello et al., 2014, 2016), which can cause P losses by leaching, and thus increased risk of eutrophication of aquatic ecosystems (Frossard et al., 2000). In this respect, while investigating the influence of soil texture on P extractability and sorption in a wide range of calcareous soils, Jalali and Jalali (2016) discovered that most of them contained very high P concentrations that might cause environmental risks, therefore pointing out that inorganic and organic P fertilizer inputs in this type of soil should be reduced.
In Italy, most agricultural soils are rich in P due to the intensive and long-term application of animal manure and P fertilizers (ISPRA, 2011), which has led to soil P saturation and increased risk of P losses (Scalenghe et al., 2014; Pizzeghello et al., 2016). Although mineral phosphate fertilizers are still largely imported in this country, their consumption has decreased from more than 700,000 tons per year of phosphoric anhydride in the 70's−200,000 tons current, with mineral fertilizers representing 45% of all the used fertilizers and 60% of the total invoiced (Federchimica Assofertilizzanti, 2017). A similar scenario occurs in the other European Union member states (van Dijk et al., 2016), and recommendations for the use of P fertilizers in agriculture have been recently established in relation to environmental risk assessment (Sharpley et al., 2003). Furthermore, values of P extracted by using either Olsen or Mehlich-3 extractants have been employed as a tool for soil monitoring (Bai et al., 2013; Jalali and Jalali, 2016) since they well correlate with P losses resulting from runoff and/or leaching (Wang et al., 2012).
Among the strategies that could be used in order to improve nutrient availability and use efficiency by plants, the utilization of controlled or slow-release fertilizers has gained increased recognition (Chien et al., 2009, 2011; McLaughlin et al., 2011; Chen et al., 2018). Among the slow P-release fertilizers, the major categories include those based on coating. Coated fertilizers are physically prepared by coating granules of conventional fertilizers with various materials to reduce their dissolution rate (Shaviv, 2000). Recently, several materials were tested, such as biodegradable polymers (Sanders et al., 2012; Lubkowski et al., 2015), superabsorbent polymers (Wu et al., 2008), commercial polymers (Ma et al., 2013), oxides (Zhang et al., 2014), and fly ash (Dong et al., 2016). For instance, in the case of MAP, P was shown to be more slowly released from a thin polymer-coated fertilizer granule, and P availability, P uptake and P use efficiency were reported to increase in barley and rice (Pauly et al., 2002; Fageria et al., 2014). More recently, Teixeira et al. (2016) studied different types of granular MAP coated with organic acids in a greenhouse pot experiment, and observed some differences in release rate and agronomic efficiency. By contrast, Silva et al. (2012) found no differences in the dry matter of maize plants treated with different doses of P using either MAP coated or uncoated. Such inconsistencies may depend on the distinct effectiveness of the applied coating material, initial soil P level, fertilizer type and dose.
Although the risk of P leaching in calcareous soils has already been investigated (e.g., Ige et al., 2005a,b; Olson et al., 2010; Jalali and Jalali, 2017), relatively few studies have been conducted to determine the relationship between P released in water and soil tests for monitoring P mineral fertilizers. Therefore, the main starting hypotheses of this paper are: (a) single superphosphate (SSP) and MAP fertilizers have different effects on the pools of soil P in calcareous soils, (b) polymer-coated P fertilizers might affect the soil extractable P, (c) soil P tests, notoriously developed for agronomic purposes, can be used to evaluate the potential risk of P losses from soils and the efficiency of fertilizers. To address these hypotheses, the objectives of the current study were (i) to determine how the pools of available P varied in a calcareous soil following a short-term (45 days) mineral P fertilization using two conventional fertilizers and a polymer-coated fertilizer, (ii) to determine how P coating influenced the growth of plants, and (iii) to reconsider agronomic indicators of available P along with environmental purposes. We considered such as short period also because plant early P requirements is critical. Indeed, plants absorb about 50% of their seasonal P requirements by the time they have accumulated 25% of their total seasonal dry mass (Chien et al., 2011).
Materials and Methods
Climate
The trial was performed at the Experimental Farm of Landlab S.r.l. in the Veneto region, NE Italy (Quinto Vicentino, Vicenza, 45°34′N; 11°37′E; 37 m a.s.l.). The climate in this location is semi–continental, with a mean annual rainfall of 850 mm. Rainfall is higher in June and October (100–90 mm) and lower in the winter months (50–60 mm). Air temperature increases from January (−1.5°C) to July (27.2°C). The reference evapotranspiration (ET0) is 945 mm, with a peak of 5 mm day−1 in July. The reference evapotranspiration exceeds rainfall from April to September.
Experimental Setup
The experimental field trial began in June 2014, in a 20 × 10 m area on a Calcaric Cambisol (IUSS Working Group WRB, 2015). The treatments derived from the factorial combination of three types of mineral P fertilizers (single superphosphate, SSP, mono-ammonium phosphate, MAP, and polymer-coated controlled-release MAP, PCMAP) with three rates of P, i.e., 0 = untreated (UNT), 0.7 and 1.4 g P plant−1, these last two corresponding to 23 and 46 kg P ha−1 (i.e., to 50% and 100% of plant needs) according to the guidelines for nursery crops (Aendekerk, 1997). Mono-ammonium phosphate had three levels of polymeric coating (no coating, 25 and 50% coating) obtained by mixing uncoated and coated P fertilizers with different persistence times: MAP (12-52-0), SSP (0-19-0), PCMAP (11-49-0) 2-month persistence, and PCMAP (10-48-0) 4-month persistence (Table 1). The two polymer-coated fertilizers were polyurethane-like coating provided by Haifa Chemical Co. Ltd with the commercial name Multicote. The nine treatments were organized in five randomized blocks (45 plots). In each plot (1.3 × 2.1 m), nine plants of Hypericum × moserianum (L.) were planted with a spacing of 0.5 × 0.3 m. In total, the trial consisted of 405 plants. In order to provide the right nutritional supplements, 3 g plant−1 of K (KNO3 13-0-46) and 3 g plant−1 of N (Multicote Urea, a slow-release nitrogen fertilizer 43-0-0 and 42-0-0) were added to the treatments. The information of fertilizers persistence was given by Haifa Chemical. Just before plants transplantation, the fertilizers were broadcasted onto the soil and the top 10 cm tilled by hand. A drip irrigation system was installed in the field during all the experiment long to ensure an adequate water supply. The irrigation requirements of plants was predicted by estimating the evapotranspiration calculated through the weather station located at the farm.
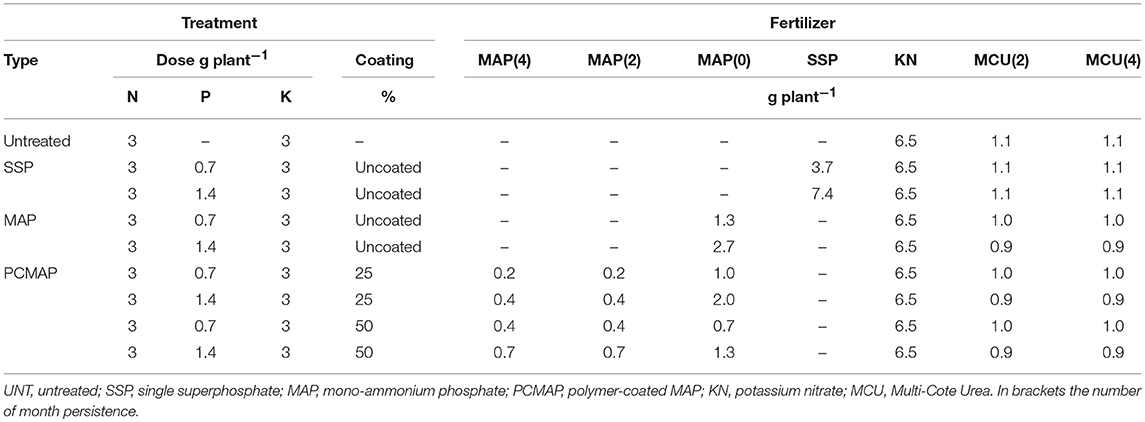
Table 1. Experimental treatments: type, dose, coating, and formulations.
Soil Sampling and Analyses
Soil samples were collected 45 days from the beginning of the experiment. In each plot, samples were taken from the shallower 10 cm layer using an auger. Sub-samples from four points were then bulked to obtain a homogenous sample of about 0.5 kg per plot. Individual samples were air dried, crushed with a rolling pin to break up clods, passed through a 2 mm sieve, and stored at low humidity.
Soil pH was measured potentiometrically on 1:2.5 soil/water extracts. Organic carbon was determined by dry combustion in a CNS Vario Macro elemental analyzer (Elementar, Hanau, Germany), correcting for the inorganic carbon. Carbonate content was quantified using the calcimeter method and gravimetric loss of CO2, and active carbonate was measured by reaction with 0.1 M NH4-oxalate (Drouineau, 1942). Particle size analysis was performed according to the hydrometer method, using sodium hexametaphosphate as a dispersant (Gee and Bauder, 1986). Exchangeable bases, including calcium (Ca), magnesium (Mg), potassium (K), and sodium (Na), were extracted using barium chloride (Sumner and Miller, 1996), and their concentration was determined by inductively coupled plasma-optical emission spectroscopy (ICP-OES) on a SPECTRO CIROS (Spectro Analytical Instruments, Kleve, Germany). The cation exchange capacity (CEC) was calculated as the sum of the four basis.
Extractable soil P was analyzed using the Mehlich-3 and Olsen methods, whereas soil P release was estimated via water extraction. Mehlich-3-P was determined by shaking 2.5 g of soil with 25 mL of Mehlich-3 extracting reagent for 5 min (Mehlich, 1984). Olsen extractable P was obtained by shaking 1.0 g of soil with 20 mL of 0.5 mol L−1 sodium bicarbonate solution (pH 8.5) for 30 min (Olsen and Sommers, 1982). Water extractable P was determined in a soil: water ratio of 1:10 (w/v) at 23°C for 1 h (Börling et al., 2004). After filtration through Whatman No. 42 filter paper, P in the extracts was determined colorimetrically using the malachite green method (Martin et al., 1999), except for Olsen as in this case the procedure reported by Murphy and Riley (1962) was followed. Total P was determined by ignition and HCl extraction (Kuo, 1996). Phosphorus concentration in the extracts was determined colorimetrically by the malachite green method. The organic P was calculated as the difference between the HCl-extractable P of a sample ignited at 513 K and that extracted from an untreated sample (Legg and Black, 1955).
Relationship Between Extractable P Forms and Water P
The relationship between extractable P (x) and water-P (y) was modeled as a segmented-line (Equation 1), with parameters estimated using a nonlinear least squares method as reported by Heckrath et al. (1995). The change point of P release was defined as the intersection of the two linear relationships while standard errors were estimated from the Fisher information matrix and confidence intervals.
Where b1 is the slope of the linear relationships for values of extractable P less than the change point, and b2 is slope of the second tract.
Plant Material and Analyses
Hypericum × moseranum (L.) was chosen as a model plant because it thrives on many environments and different types of soil, and foremost for its high sensitivity to P deficiencies and tolerance to repeated biomass sampling (Aendekerk, 1997). Plant growth was recorded at the end of the experiment by determining living ground cover (LGC), which is a non-destructive index of canopy development, and by measuring the dry weight. Just before harvesting, three zenithal photos per plot were taken, for a total of 15 photos per treatment. To avoid the variability induced by the environmental conditions, the photos were taken inside a box equipped with an artificial light source. The box was open, parallelepiped shaped and without a base, so when it was placed on the plant it used the ground as a base. The camera was installed on the upper side facing toward the inside of the box. The photos were processed by digital image analysis with the WinCAM software (Regent Instruments, Quebec, Canada). The LGC index was further calculated as a percentage of the total area, i.e., the difference between the area of the plant and the area of the background (floor and walls). For the dry weight (DW) measurement, plants were harvested at the end of the trial by cutting at 10 cm height, rinsed three times with deionized water and dried with filter paper. The plants were oven dried at 65°C until constant weight was obtained. Dried plants were then ground, digested in 0.1 N HCl and analyzed for P concentration using optical emission spectroscopy with inductively-coupled plasma (ICP-OES, Spectro, Kleve, Germany). Plant P uptake was calculated as the product of plant DW and P concentration.
Statistical Analyses
All examined variables were tested for normality and homoscedasticity (by Shapiro–Wilk's and Levene's tests, respectively) and transformed—when necessary—to satisfy assumptions required by parametric statistics. Two two-way completely randomized ANOVA were used to compare the treatment effects: one for type of fertilizer (SSP and MAP) and rate of P (0 = untreated control, 0.7 and 1.4 g plant−1), and the second for rate of P (0.7 and 1.4 g plant−1) and polymeric coating (uncoated, 25% coated and 50% coated). In the second case, to better dissect the results, the ANOVA was made with untreated control (df = 6) and without untreated control (df = 5). The Student Newman Keuls test was applied to compare the differences among group means and the results were indicated with letters directly in the figures. Linear responses were tested to interpret the interactions (Vargas et al., 2015). The statistical analyses were performed using SPSS for Windows software, version 19.0 (SPSS, Chicago, IL).
Results
General Properties
Table 2 summarizes the main characteristics of the soil at the beginning of the experiment. The soil displayed an alkaline reaction, as confirmed by the high concentration of total carbonates and active carbonates. The natural soil fertility was poor, being low in cation exchange capacity, soil organic carbon, Olsen-P and Mehlich-3-P concentrations. After the treatment, the soil extractable P (i.e., Mehlich-3-P, Olsen-P, water-P) concentrations widely varied, ranging within 7.5–96.5 mg P kg−1 (Figures 1A–C), whereas the plant LGC index was strongly and linearly related to both the plant DW (R2 = 0.76, p ≤ 0.001) and plant P uptake (R2 = 0.85, p ≤ 0.001) (data not shown).
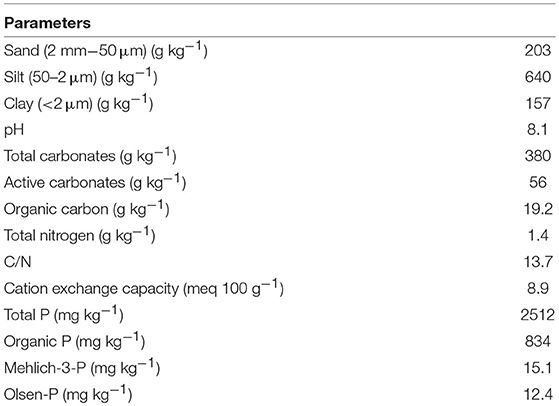
Table 2. Main physical and chemical characteristics of the soil (0–20 cm) at the beginning of the experiment.
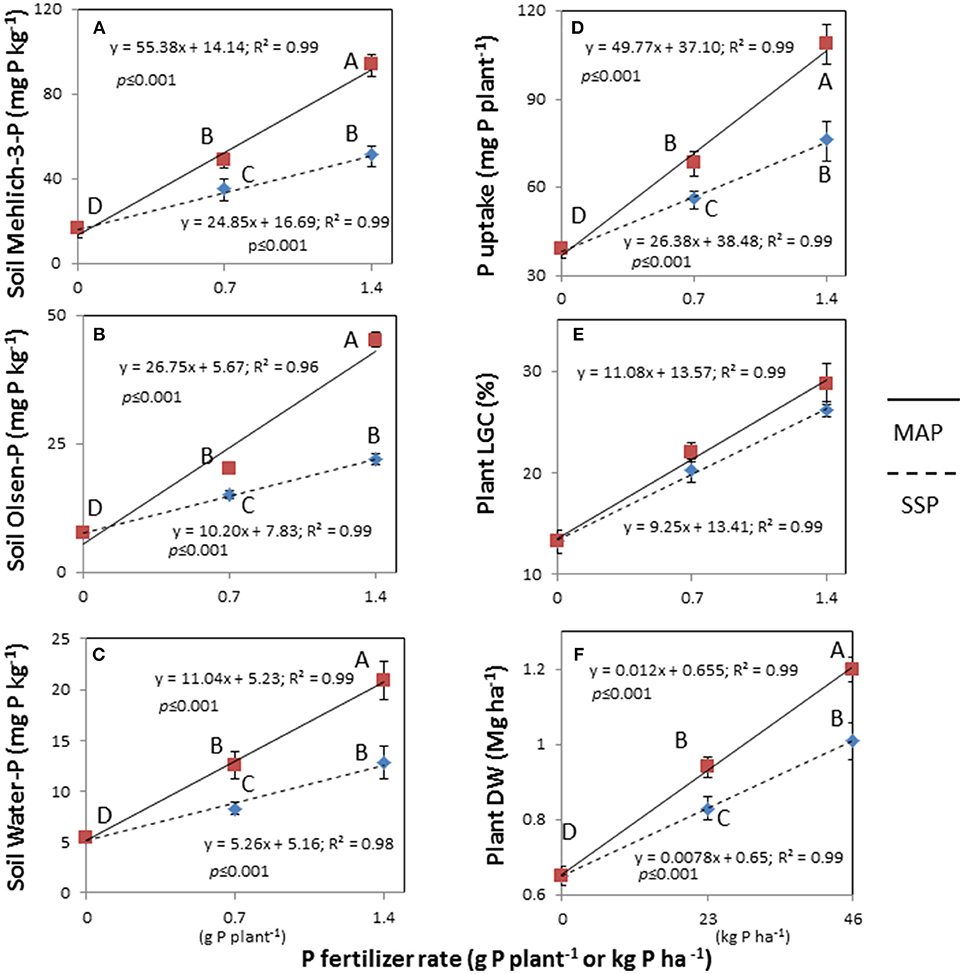
Figure 1. Linear response of soil Mehlich-3-P (A), Olsen-P (B), and water-P (C) concentrations, plant's P uptake (D), living ground cover (LGC) index (E), and dry weight (DW) (F) on two fertilizers (single superphosphate, SSP and mono-ammonium phosphate, MAP) at two fertilizer rates (0.7 and 1.4 g P plant−1) and untreated. Treatments were: MAP, continuous line with red squares; SSP, dotted line with blue rhombus. Means with the same letter are not significantly different at the 0.05 probability level. Bars indicate standard deviation.
Soil Test P-Values and Plant Growth in Response to SSP and MAP Fertilizers
The soil extractable P was significantly affected by the two-way fertilizer × rate of P (FRP) interaction (Table 3). The FRP exhibited more pronounced linear responses with higher Mehlich-3-P, Olsen-P and water-P concentrations for MAP than for SSP (Figures 1A–C), demonstrating a change in the scale trend. In particular, MAP at 1.4 g P plant−1 produced the highest soil test P concentrations with increments by 5.7-fold for Mehlich-3-P (93.7; 16.2 mg kg−1) (p < 0.001), 5.8-fold for Olsen-P (45.2; 7.7 mg kg−1) (p < 0.001), and 3.8-fold for water-P (20.9; 5.4 mg kg−1) (p < 0.001) compared to the unfertilized treatment. As a consequence, the plant DW and P uptake were significantly affected by the FRP interaction as well (Table 3; Figures 1D,F). Dry weight yield linearly increased at the rate of 0.012 Mg ha−1 with incremental 1 kg ha−1 increase in P fertilizer with MAP, while it linearly increased at slower rate (0.0078 Mg ha−1 per 1 kg ha−1 incremental increase in P) using SSP. Likewise, the plant P uptake displayed a linear increase, with a rate 1.9-fold higher for MAP than SSP. With respect to the LGC index, the non-significant FRP interaction could have been perhaps ascribed to the very small difference between the angular coefficients of linear response to P rates, as it is clearly depicted in Figure 1E. Nevertheless, the main factors were significant (Table 3), and increasing LGC values followed the untreated (13.2%) < SSP (23.1%) < MAP (26.3%) (p < 0.05) order, as well as followed the rate of P (untreated 13.2% < 0.7 g P plant−1 21.1% < 1.4 g P plant−1 27.4%) (p < 0.05) (data not shown).
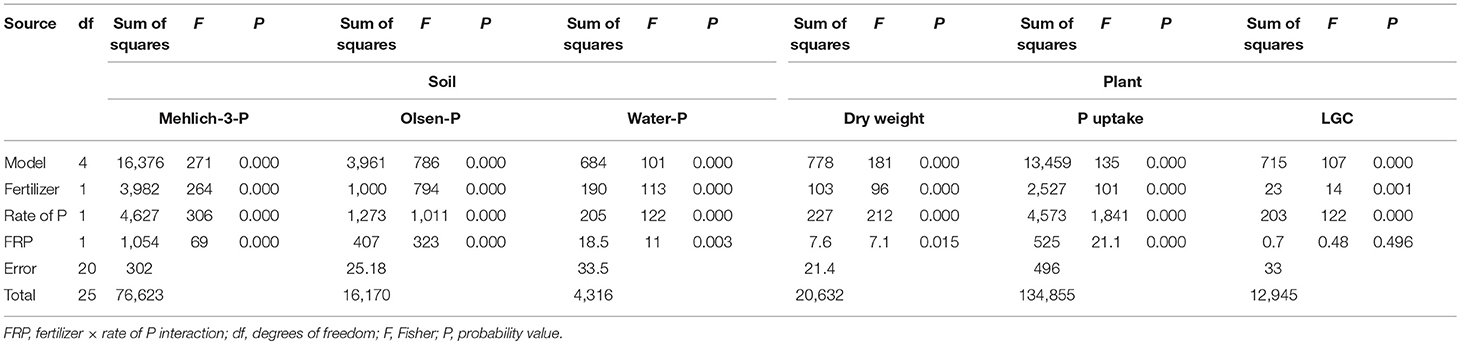
Table 3. Main effects and two-way interaction ANOVA for soil Mehlich-3-P, Olsen-P and water-P (mg P kg−1), and plant dry weight (Mg ha−1), P uptake (mg P plant−1) and living ground cover (LGC) index (%) in an experiment with type of fertilizer (SSP and MAP) at two P rates (0.7 and 1.4 g plant−1) and untreated control.
Soil Test P-Values and Plant Growth in Response to Coated and Uncoated MAP
The two-way rate of P × coating (RPC) interaction was not significant for the soil Mehlich-3-P and Olsen-P concentrations, while it significantly affected the soil water-P concentrations (Table 4, in both df 6 and df 5). The water-P data fitted linear responses (Figure 2A), with higher concentrations in the dose of 1.4 g P plant−1 than 0.7 g P plant−1, but with strongly decreasing concentrations from uncoated MAP (0) to PCMAP 25% and PCMAP 50% (20.9 > 12.8 > 8.2 mg kg−1 and 12.5 > 7.6 > 5.5 mg kg−1 for 1.4 and 0.7 g P plant−1, respectively). In contrast to the water-P, the coating grade affected both Mehlich-3-P and Olsen-P concentrations (Table 4) with decreasing values following the uncoated MAP > PCMAP 25% > PCMAP 50% (p < 0.05) order (71.3-56.9-43.4 mg kg−1 for Mehlich-3-P, and 32.7-29.5-25.3 mg kg−1 for Olsen-P).
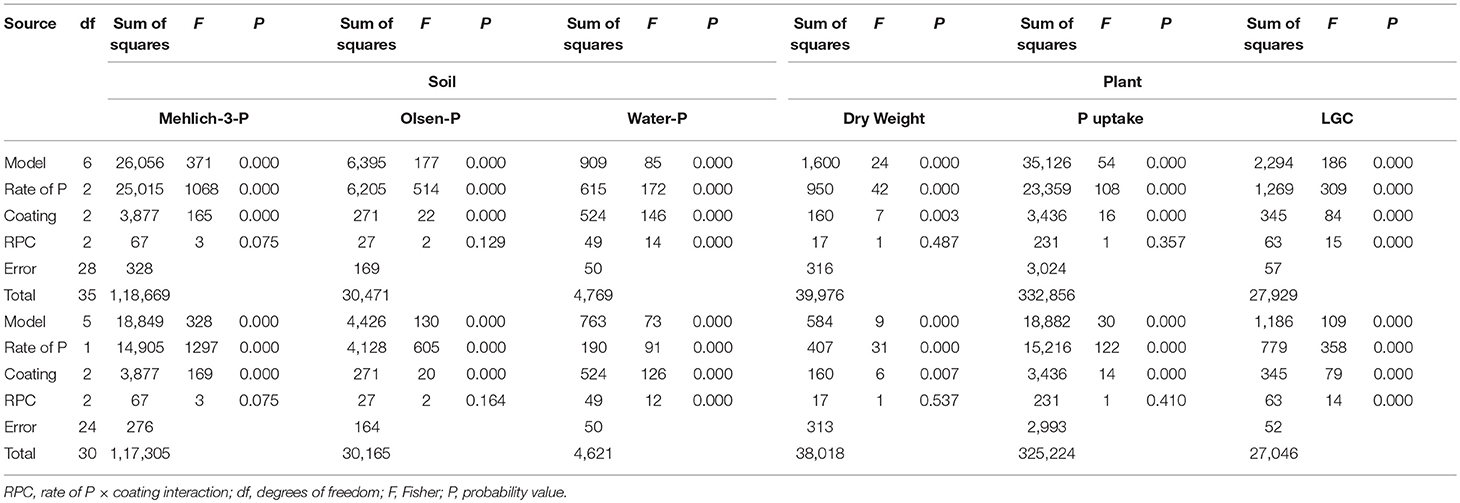
Table 4. Main effects and two-way interaction ANOVA for soil Mehlich-3-P, Olsen-P and water-P (mg P kg−1), and plant dry weight (Mg ha−1), P uptake (mg P plant−1) and living ground cover (LGC) index (%) in an experiment in which polymer-coated MAP fertilizer was used at two P rates (0.7 and 1.4 g plant−1) and three rates of coating (uncoated, 25, 50%), with untreated control (df = 6) and without untreated control (df = 5).
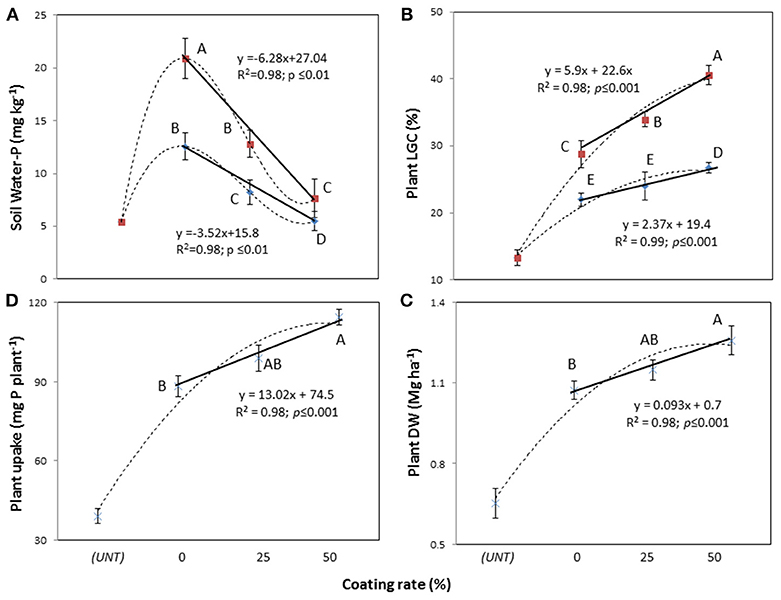
Figure 2. Linear response of soil water-P concentrations (A), plant's living ground cover (LGC) index (B), dry weight (DW) (C), and P uptake (D) on polymer-coated mono-ammonium phosphate at two rates of coating (25 and 50%) and untreated (UNT). Treatments were: 0.7 g P plant−1, line with blue rhombus; 1.4 g P plant−1, line with red squares; continuous line, relationship considering coating rate; dotted line, relationship considering coated and untreated soils. Means with the same letter are not significantly different at the 0.05 probability level. Bars indicate standard deviation.
Concerning plants, the LGC index was significantly affected by the two-way RPC interaction (Table 4, in both df 6 and df 5), giving linear responses to the coating with higher LGC in the dose of 1.4 g P plant−1 (28.7 < 33.9 < 40.5%) than 0.7 g P plant−1 (21.9, 23.9 < 26.7%) (Figure 2B). With respect to the plant DW and P uptake, only the main factors were significant (Table 4). In particular, the DW yield exhibited a significant linear response to coating (Figure 2C), showing that the PCMAP 50% (1.3 Mg ha−1) differed from uncoated MAP (1 Mg ha−1), whereas PCMAP 25% (1.1 Mg ha−1) was intermediate between them. A similar behavior to the DW was found for the response to coating by plant P uptake (Figure 2D). Pseudo-relationships were additionally determined including the unfertilized treatment (UNT, control) (dotted lines in the graphs). In this way, it is clear that the coating at 50% dose gave soil water-P values very close to those reported for the control (Figure 2A). Concerning plants, instead, the pseudo-relationships showed the reaching for the maximum yield (Figures 2B–D).
Relationships Among Mehlich-3-P, Olsen-P, and Water-P
Mehlich-3-P concentrations were strongly and linearly related to Olsen-P concentrations (p < 0.001) (Figure 3A), explaining 93% of the Olsen-P variability. For the relationship with water-P, the segmented-line model (Equation 1) was used and it demonstrated that at low Olsen-P and Mehlich-3-P concentrations the water-P remained low, while at high concentrations it markedly increased. In other words, the water-P exhibited a change point at a concentration of 37 mg kg−1 for the Olsen-P (R2 = 0.56, p < 0.001) (Figure 3B) and at 65 mg kg−1 for the Mehlich-3-P (R2 = 0.69, p < 0.001) (Figure 3C). It is noteworthy that the points in SSP and those in PCMAP were placed in the initial section of the curves, thus evidencing low water-P concentrations. Conversely, the points in MAP were found in the final section of the curves, showing high water-P concentrations.
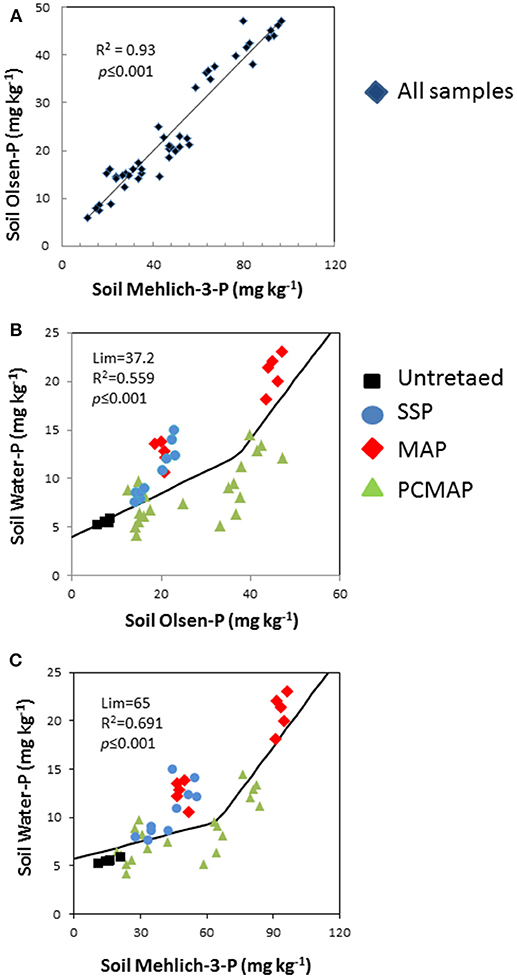
Figure 3. (A–C) Relationship among soil Mehlich-3 P, Olsen P, and water P concentrations after 45 days application of treatment. In the graph split-line model fitted Equation (1). To appreciate the effect of the treatment on the model, the cases were differently colored: untreated, black squares; single superphosphate, SSP, blue circles; mono-ammonium phosphate, MAP, red rhombuses; polymer-coated mono-ammonium phosphate, PCMAP, green triangles.
Discussion
General View
Phosphorus can limit crop production in calcareous soils, therefore fertilization is frequently required (Chien et al., 2011). It is well known that there are differences in the reaction and time-availability of P fertilizers, depending on the type of fertilization and application rate (Castro and Torrent, 1994; McLaughlin et al., 2011). The soil tested in the current study has developed from calcareous material, as indicated by the soil reaction and abundance of total and active carbonates. With respect to the Olsen-P concentration in the unfertilized soil, the available P should be considered low. Indeed, the addition of conventional fertilizers (i.e., SSP or MAP) resulted in the increase of soil extractable P concentrations and plants growth (Haden et al., 2007; Jiao et al., 2007; Chien et al., 2011; Fageria et al., 2014; AlKhader and Rayyan, 2015).
Soil Extractable P and Plant Growth
MAP affected the extractable soil P more than SSP, with values that proportionally increased with the P fertilizer rate. The close linear relationship found between the Olsen-P and Mehlich-3-P confirms that the extracting methods give from the same P pool and with relatively similar intensity (Mallarino and Atia, 2005). As agronomic soil test P, the concentrations of the extractable P varied widely up to 45.2 and 93.7 mg kg−1 for the Olsen-P and Mehlich-3-P, respectively. Conversely, while calibrating these results with plant requirements for P, the P rate applied seemed insufficient. This is clearly because the relationship between plants DW and P uptake with the P fertilizer rate fitted linearly, and did not reach the typical curvature zone and flattening for the maximum yield. However, MAP increased the soil P concentrations and plant DW and P uptake more than SSP, as suggested by the higher incremental rate per unit of P fertilizer. An explanation for the different behavior of the two fertilizers could be found considering that P reaction products vary in solubility and that different sources of P fertilizers are not equally effective. It is possible that nitrification of NH4-N to NO3-N in MAP could increase the acidity levels around the fertilizer granules in the soil, and that root absorption of NH4-N enhanced the dissolution of precipitated Ca-P compounds (Chien et al., 2011) and P availability (Leytem et al., 2011) through promotion of rhizosphere acidity (Nardi et al., 2005).
Polymer-coated MAP compared to the uncoated MAP affected the soil extractable P, but strongly decreasing concentrations were observed at the increasing grade of coating. Plants treated with PCMAP were also affected in terms of yield. It is noteworthy that when PCMAP was used, plants LGC, DW, and P uptake reached the maximum, as clearly showed by dotted lines in Figure 2. This indicates that conventional fertilizers at the tested doses do not allow plants to achieve the maximum yield, thus suggesting the need to increase the rate of P to the soil. Conversely, PCMAP enables the maximum plant yield and at lower soil extractable P concentrations. Coating, allowing a release of P that follows flow and diffusion mechanisms, induces a slow P release (Shaviv and Mikkelsen, 1993; Du et al., 2006), as found in our study when coated and uncoated MAP were compared. The gradual P solubilisation from PCMAP can provide a more constant P supply toward the soil where roots are developing thus enabling greater efficiency as also reported by other authors (Pauly et al., 2002; Sanders et al., 2012; Teixeira et al., 2016). In fact, the higher the coating, the lower the P availability (Mehlich-3, Olsen, water) and the higher the plant LGC, DW, and P uptake were.
Soil P Release and Environmental Aspects
The relationship found between Mehlich-3-P and water-P, and between Olsen-P and water-P, is considered due to a change of the relative efficiency of P extraction by water as soil P concentration increased (Atia and Mallarino, 2002; Ige et al., 2006; Jalali and Jalali, 2017). The increased proportion of water-P with the increasing rate of fertilizer indicates that the soil does not have endless capacity to retain the added P, and when talking about the capacity of the soil to retain P, there is a further increase in the proportion of P occurring in the labile fraction. Indeed, a change point was reached and exceeded both in the Olsen-P and Mehlich-3-P relationships with water-P. The results show that the P concentration released in water remained low in most cases, specifically below the Olsen-P change point of 37 mg kg−1, while above this value the water-P rapidly increased. A similar pattern of higher P concentrations in water above a change point of 65 mg kg−1 was observed for Mehlich-3-P. At the change point, the water-P concentration was 12.5 mg kg−1 for Olsen-P and 9 mg kg−1 for Mehlich-3-P, which corresponded to water-P ranging between 1.2 and 0.9 mg l−1, so far above the value of 0.1 mg P l−1 used as environmental threshold by USEPA (2000). Note, above the change points, the water-P rapidly increased with the increase of Olsen-P and Mehlich-3-P. Thus, while the exceeding of the change point values show environmental risks, of the two soil test P, the Mehlich-3 better predicts the P loss than the Olsen. Nevertheless, these results should be considered with caution. Indeed, while Mehlich-3-P concentration is often determined by ICP, water extractable P was determined colorimetrically, thus making spurious relationships. Indeed, while ICP measures the total P in the extract, which can include organic P, the colorimetrically determination only measures P in orthophosphate. However, our results are in line with those reported in literature. Indeed, in other soils of NE-Italy, we found change point values of 54 mg kg−1 for Olsen-P and ca 100 mg kg−1 for Mehlich-3-P (Pizzeghello et al., 2016), whereas values ranging 39.9–90.2 mg kg−1 for the Olsen-P where reported by Bai et al. (2013). The differences are likely due to changes in the soil's chemical properties (i.e., clay, organic carbon, carbonates) which influence the soil P sorption capacity (Zhao et al., 2007; Memon et al., 2009; Pizzeghello et al., 2014).
Considering the treatment, it is noteworthy that SSP and PCMAP showed a lower P release in water than MAP, as evidenced by the clustering of the soil plots at the initial and final section of the segmented-line. Uncoated fertilizers, in fact, had high rate of P release and led to a fast increase of the P concentration in the soil solution (Silva et al., 2012; Teixeira et al., 2016). The slower P release of the coated fertilizer might be a result of physical and chemical barriers, whereas issues such as porosity, thickness and coating layer composition determine the P diffusion from the granule to the soil (Shavit et al., 1997; Du et al., 2006). Overall, our results point out that MAP needs to be carefully used, as high soil extractable P concentrations are released into the water, thus suggesting possible movement of P via runoff and/or through the soil profile. The use of PCMAP, conversely, appears to be more environmentally friendly than MAP.
Conclusions
In the short-period conventional and unconventional mineral P fertilizers affected the soil P pools and plant growth in a different way, as depicted in the summary chart (Figure 4). The figure recalls the graphs of Figure 2, but reveals at a more general level the extent of all the main variables according to the two studied factors (fertilization and coating), whereas the arrows should help the reader making sense of the path. However, while MAP and SSP induced higher soil Mehlich-3-P, Olsen-P, and water-P concentrations and high plant yields and P uptake compared to the untreated (Figure 4, left), PCMAP (Figure 4, right) decreased soil Mehlich-3-P, Olsen-P, and water-P concentrations but allowed achieving higher plant yields and P accumulation than conventional fertilizers. Moreover, from the segmented-line model between the P released in water and Olsen-P and Mehlich-3-P, the presence of change points give suggestion for possible environmental P risks. Thus, disentangling among fertilizers, SSP and PCMAP display a lower P release in water than MAP, but PCMAP also produces higher agronomic efficiency than SSP. Due to the short duration of the trial, maybe not all granules of PCMAP solubilized. Therefore, in order to achieve the optimization of P, for both the soil and the plant systems, the use of polymer-coated fertilizers seems to be required. These results also suggests that in the short period, and using rates of fertilizer similar to those applied in this study, both soil extractable P and water-P depend on the type of fertilizer, whereas the amounts of added P have rather a secondary role. Nevertheless, these results must be taken with caution because they are the result of replicas in space but not in time.
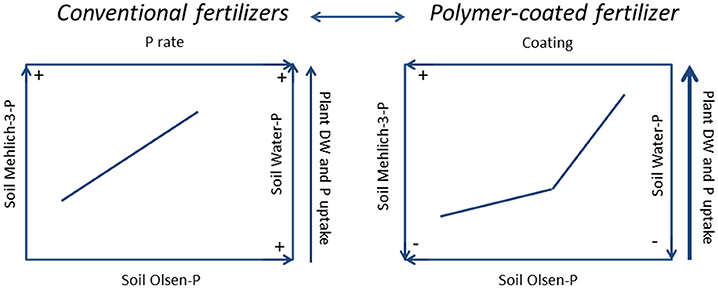
Figure 4. Summary chart. The picture depicts the results from conventional P fertilizers (single superphosphate and mono-ammonium phosphate) (LEFT) vs. polymer-coated mono-ammonium phosphate (RIGHT) on soil Olsen-P, Mehlich-3-P on water-P, on plant dry weight (DW) and on P uptake after 45 d from the treatment. The arrows should facilitate making sense of the path. On the left, at the increasing of P fertilizer rate, soil Olsen-P, Mehlich-3-P, water-P, plant DW and P uptake all increased. On the right, at the increasing of coating, soil Olsen-P, Mehlich-3-P and water-P decreased, whereas plant DW and P uptake increased. Overall, the soil P pools extracted after the treatment with polymer-coated mono-ammonium phosphate were lower than those from conventional fertilizers.
Author Contributions
AA conceived and designed the study. LM collected the samples. LM, DP, and AE performed the analyses. DP analyzed the data and wrote the manuscript. SN, MS, and PS reviewed the manuscript.
Funding
This research was funded by Landlab S.r.l. (Quinto Vicentino, Italy).
Conflict of Interest Statement
The authors declare that the research was conducted in the absence of any commercial or financial relationships that could be construed as a potential conflict of interest.
Acknowledgments
Polymer-coated MAP was provided by Haifa Chemicals Ltd. (Haifa, Israel). We wish to thank Simon Lee Cox-Hazelton and Ilaria Pasin for the language revision.
References
Aendekerk, T. (1997). Fertilization Guide for Nursery Crops. Boskoop: Boomteeltpraktijkonderzoek. p. 154.
AlKhader, A. M. F., and Rayyan, A. M. A. (2015). The impact of phosphorus fertilizers on nutrients content and uptake in lettuce (Lactuca sativa L.) and on selected chemical properties of a calcareous soil. Jordan J. Agric. Sci. 11, 1021–1035.
Atia, A. M., and Mallarino, A. P. (2002). Agronomic and environmental soil phosphorus testing in soils receiving liquid swine manure. Soil Sci. Soc. Am. J. 66, 1696–1705. doi: 10.2136/sssaj2002.1696
Bai, Z., Li, H., Yang, X., Zhou, B., Shi, X., Wang, B., et al. (2013). The critical soil P levels for drop yield, soil fertility and environmental safety in different soil types. Plant Soil 372, 27–37. doi: 10.1007/s11104-013-1696-y
Bertrand, I., McLaughlin, M. J., Holloway, R. E., Armstrong, R. D., and McBeath, T. (2006). Changes in P availability induced by the application of liquid and powder sources of P, N and Zn fertilizers in alkaline soils. Nutr. Cycl. Agroecosyst. 74, 27–40. doi: 10.1007/s10705-005-4404-3
Börling, K., Barberis, E., and Otabbong, E. (2004). Impact of long-term inorganic phosphorus fertilization on accumulation, sorption and release of phosphorus in five Swedish soil profiles. Nutr. Cycl. Agroecosyst. 69, 11–21. doi: 10.1023/B:FRES.0000025286.30243.c0
Castro, B., and Torrent, J. (1994). Phosphate availability in calcareous Vertisols and Inceptisols in relation to fertilizer type and soil properties. Fertilizer Res. 40, 109–119. doi: 10.1007/BF00750095
Chen, J., Lü, S., Zhang, Z., Zhao, X., Li, X., Ning, P., et al. (2018). Environmentally friendly fertilizers: a review of materials used and their effects on the environment. Sci. Total Environ. 613–614, 829–830. doi: 10.1016/j.scitotenv.2017.09.186
Chien, S. H., Prochnow, L. I., and Cantarella, H. (2009). Recent developments of fertilizer production and use to increase nutrient efficiency and minimize environmental impacts. Adv. Agron. 102, 261–316. doi: 10.1016/S0065-2113(09)01008-6
Chien, S. H., Prochnow, L. I., Tu, S., and Snyder, C. S. (2011). Agronomic and environmental aspects of phosphate fertilizers varying in source and solubility: An update review. Nutr. Cycl. Agroecosyst. 89, 229–255. doi: 10.1007/s10705-010-9390-4
Dong, Y. J., He, M. R., Wang, Z. L., Chen, W. F., Hou, J., Qiu, X. K., et al. (2016). Effects of new coated release fertilizer on the growth of maize. J. Soil Sci. Plant Nutr. 16, 637–649. doi: 10.4067/S0718-95162016005000046
Drouineau, G. (1942). Dosage rapide du calcaire actif du sol: nouvelles données sur la séparation et la nature des fractions calcaires. Ann. Agron. 12, 441–450.
Du, C.-W., Zhou, J.-M., and Shaviv, A. (2006). Release characteristics of nutrients from polymer-coated compound controlled release fertilizers. J. Polym. Environ. 14, 223–230. doi: 10.1007/s10924-006-0025-4
Fageria, N. K., Santos, A. B., and Reis, R. A Jr. (2014). Agronomic evaluation of phosphorus sources in lowland rice production. Commun. Soil Sci. Plant Anal. 45, 2067–2091. doi: 10.1080/00103624.2014.911302
Federchimica Assofertilizzanti, I. T. (2017). Associazione Nazionale Produttori di Fertilizzanti. Available online at: http://assofertilizzanti.federchimica.it/docs/default-source/cartella-stampa/151109-cartella-stampa-assofertilizzanti.pdf?sfvrsn=2 (Accessed August 1, 2017).
Frossard, E., Condron, L. M., Oberson, A., Sinaj, S., and Fardeau, J. C. (2000). Processes governing phosphorus availability in temperate soils. J. Environ. Qual. 29, 15–23. doi: 10.2134/jeq2000.00472425002900010003x
Gee, G. W., and Bauder, J. W. (1986). “Particle-size analysis,” in Methods of Soil Analysis, Part 1. Physical and Mineralogical Methods. Agronomy Monograph, 2nd Edn, Vol 9, ed A. Klute (Madison, WI: American Society of Agronomy/Soil Science Society of America), 383–411.
Haden, V. R., Ketterings, Q. M., and Kahabka, J. E. (2007). Factors affecting change in soil test phosphorus following manure and fertilizer application. Soil Sci. Soc. Am. J. 71, 1225–1232. doi: 10.2136/sssaj2006.0230
Hao, X., Godlinski, F., and Chang, C. (2008). Distribution of phosphorus forms in soil following long-term continuous and discontinuous cattle manure applications. Soil Sci. Soc. Am. J. 72, 90–97. doi: 10.2136/sssaj2006.0344
Heckrath, G., Brookes, P. C., Poulton, P. R., and Goulding, K. W. T. (1995). Phosphorus leaching from soils containing different phosphorus concentrations in the Broadbalk experiment. J. Environ. Qual. 24, 904–910. doi: 10.2134/jeq1995.00472425002400050018x
Ige, D. V., Akinremi, O. O., and Flaten, D. (2005a). Environmental index for estimating the risk of phosphorus loss in calcareous soils of Manitoba. J. Environ. Qual. 34, 1944–1951. doi: 10.2134/jeq2004.0468
Ige, D. V., Akinremi, O. O., Flaten, D., and Kashem, M. A. (2006). Comparison of soil test phosphorus methods in neutral to calcareous Manitoba soils. Can. J. Soil Sci. 86, 691–699. doi: 10.4141/S.05-045
Ige, D. V., Akinremi, O. O., Flaten, D. N., Ajiboye, B., and Kashem, M. A. (2005b). Phosphorus sorption capacity of alkaline Manitoba soils and its relationship to soil properties. Can. J. Soil Sci. 85, 417–426. doi: 10.4141/S04-064
ISPRA (2011). Suolo e Territorio. Rome: Istituto Superiore per la Protezione e la Ricerca Ambientale. Available online at: http://annuario.isprambiente.it/sites/default/files/pdf/2014/tematiche/10_Suolo%20e%20territorio_mg.pdf
IUSS Working Group WRB (2015). World Reference Base for Soil Resources, 2014, Update 2015. International Soil Classification System for Naming Soils and Creating Legends for Soil Maps. World Soil Resources Reports No 106. Rome: FAO, 193.
Jalali, M., and Jalali, M. (2016). Relation between various soil phosphorus extraction methods and sorption parameters in calcareous soils with different texture. Sci. Total Environ. 566–567, 1080–1093. doi: 10.1016/j.scitotenv.2016.05.133
Jalali, M., and Jalali, M. (2017). Assessment risk of phosphorus leaching from calcareous soils using soil test phosphorus. Chemosphere 171, 106–117. doi: 10.1016/j.chemosphere.2016.12.042
Jiao, Y., Whalen, J. K., and Hendershot, W. H. (2007). Phosphate sorption and release in a sandy-loam soil as influenced by fertilizer sources. Soil Sci. Soc. Am. J. 71, 118–124. doi: 10.2136/sssaj2006.0028
Kuo, S. (1996). “Phosphorus,” in Methods of Soil Analysis, Vol. 5, ed D. L. Sparks (Madison, WI: Soil Sci. Soc. A), 869.
Legg, J. O., and Black, C. A. (1955). Determination of organic phosphorus in soils: II. Ignition method. Soil Sci. Soc. Am. J. 19, 139–143. doi: 10.2136/sssaj1955.03615995001900020007x
Leytem, A. B., Dungan, R. S., and Moore, A. (2011). Nutrient availability to corn from dairy manures and fertilizer in a calcareous soil. Soil Sci. 176, 426–434. doi: 10.1097/SS.0b013e31822391a6
Lombi, E., Scheckel, K. G., Armstrong, R. D., Forrester, S., Cutler, J. N., and Patersen, D. (2006). Speciation and distribution of phosphorus in a fertilized soil: a synchrotron-based investigation. Soil Sci. Soc. Am. J. 70, 2038–2048. doi: 10.2136/sssaj2006.0051
Lubkowski, K., Smorowska, A., Grzmil, B., and Kozlowska, A. (2015). Controlled-release fertilizer prepared using a biodegradable aliphatic copolyester of poly(butylene succinate) and dimerized fatty acid. J. Agric. Food Chem. 63, 2597–2605. doi: 10.1021/acs.jafc.5b00518
Ma, Z., Jia, X., Zhang, G., Hu, J., Zhang, X., Liu, Z., et al. (2013). pH-Responsive controlled-release fertilizer with water retention via atom transfer radical polymerization of acrylic acid on mussel-inspired initiator. J. Agric. Food Chem. 61, 5474–5482. doi: 10.1021/jf401102a
Mallarino, A. P., and Atia, A. M. (2005). Correlation of a resin membrane soil phosphorus test with corn yield and routine soil tests. Soil Sci. Soc. Am. J. 69, 266–272. doi: 10.2136/sssaj2005.0266
Martin, M., Celi, L., and Barberis, E. (1999). Determination of low concentrations of organic phosphorus in soil solution. Commun. Soil Sci. Plant Anal. 30, 1909–1917. doi: 10.1080/00103629909370341
McLaughlin, M. J., McBeath, T. M., Smernik, R., Stacey, S. P., Ajiboye, B., and Guppy, C. (2011). The chemical nature of P accumulation in agricultural soils-implications for fertilizer management and design: an Australian perspective. Plant Soil 349, 69–87. doi: 10.1007/s11104-011-0907-7
Mehlich, A. (1984). Mehlich III soil test extractant: a modification of Mehlich II extractant. Comm. Soil Sci. Plant Anal. 15, 1409–1416. doi: 10.1080/00103628409367568
Memon, M., Memon, K. S., Akhtar, M. S., and Stüben, D. (2009). Characterization and quantification of iron oxides in low concentration in soils. Comm. Soil Sci. Plant Anal. 40, 162–178. doi: 10.1080/00103620802649005
Murphy, J., and Riley, J. P. (1962). A modified single solution method for determination of phosphate in natural waters. Anal. Chim. Acta 27, 31–36. doi: 10.1016/S0003-2670(00)88444-5
Nardi, S., Tosoni, M., Pizzeghello, D., Provenzano, M. R., Cilenti, A., Sturaro, R., et al. (2005). A comparison between humic substances extracted by root exudates and alkaline solution. Soil Sci. Soc. Am. J. 69, 2012–2019. doi: 10.2136/sssaj2004.0401
Olsen, S. L., and Sommers, L. E. (1982). “Phosphorus,” in Methods of Soil Analysis. Part 2: Chemical and Microbiological Properties, 2nd Edn., eds A. L. Page, R. H. Miller, and D. R. Keeney (Madison, WI: American Society of Agronomy), 403–427.
Olson, B. M., Bremer, E., McKenzie, R. H., and Bennet, D. R. (2010). Phosphorus accumulation and leaching in two irrigated soils with incremental rates of cattle manure. Can. J. Soil Sci. 90, 355–362. doi: 10.4141/CJSS09025
Pauly, D. G., Mahli, S. S., and Nyborg, M. (2002). Controlled-release P fertilizer concept evaluation using growth and P uptake of barley from three soils in greenhouse. Can. J. Soil Sci. 82, 201–210. doi: 10.4141/S01-021
Pizzeghello, D., Berti, A., Nardi, S., and Morari, F. (2011). Phosphorus forms and P sorption in three alkaline soils after long-term mineral and manure applications. Agric. Ecosyst. Environ. 141, 58–66. doi: 10.1016/j.agee.2011.02.011
Pizzeghello, D., Berti, A., Nardi, S., and Morari, F. (2014). Phosphorus-related properties in the profiles of three Italian soils after long-term mineral and manure applications. Agric. Ecosyst. Environ. 189, 216–228. doi: 10.1016/j.agee.2014.03.047
Pizzeghello, D., Berti, A., Nardi, S., and Morari, F. (2016). Relationship between soil test phosphorus and phosphorus release to solution in three soils after long-term mineral and manure application. Agric. Ecosyst. Environ. 233, 214–223. doi: 10.1016/j.agee.2016.09.015
Sanders, J. L., Murphy, L. S., Noble, A., Melgar, R. J., and Perkins, J. (2012). Improving phosphorus use efficiency with polymer technology. Proc. Eng. 46, 178–184. doi: 10.1016/j.proeng.2012.09.463
Scalenghe, R., Edwards, A. C., Barberis, E., and Ajmone-Marsan, F. (2014). Release of phosphorus under reducing and simulated open drainage conditions from overfertilised soils. Chemosphere 95, 289–294. doi: 10.1016/j.chemosphere.2013.09.016
Sharpley, A. N., Weld, J. L., Beegle, D. B., Kleinman, P. J. A., Gburek, W. J., Moore, P. A., et al. (2003). Development of phosphorus indices for nutrient management planning strategies in the United States. J. Soil Water Conserv. 58, 137–152.
Shavit, U., Shaviv, A., Shalit, G., and Zaslavsky, D. (1997). Release characteristics of a new controlled release fertilizer. J. Control Release 43, 131–138. doi: 10.1016/S0168-3659(96)01478-2
Shaviv, A. (2000). Advances in controlled release fertilizers. Adv. Agron. 71, 1–49. doi: 10.1016/S0065-2113(01)71011-5
Shaviv, A., and Mikkelsen, R. L. (1993). Controlled-release fertilizers to increase efficiency of nutrient use and minimize environmental degradation – a review. Fertil. Res. 35, 1–12. doi: 10.1007/BF00750215
Silva, A. A., Silva, T. S., Vasconcelos, A. C. P., and Lana, R. M. Q. (2012). Influence of application of different sources of map coated with gradual release polymers in corn culture. Biosci. J. 28, 240–250.
Sumner, M. E., and Miller, W. P. (1996). “Cation exchange capacity, and exchange coefficients,” in Methods of soil analysis. Part 2: Chemical properties, 3rd Edn, ed D. L. Sparks (Madison, WI: Soil Science Society of America), 1201–1229.
Teixeira, R. S., Ribeiro da Silva, I., Nogueira de Sousa, R., Márcio Mattiello, E., and Barros Soares, E. M. (2016). Organic acid coated-slow-release phosphorus fertilizers improve P availability and maize growth in a tropical soil. J. Soil Sci. Plant Nutr. 16, 1097–1112. doi: 10.4067/S0718-95162016005000081
USEPA (2000). Nutrient Criteria Technical Guidance Manual: Rivers and Streams. EPA 822-B-00-002. Washington: DC, USEPA, Office of Science and Technology, Office of Water.
van Dijk, K. C., Lesschen, J. P., and Oenema, O. (2016). Phosphorus flows and balances of the European Union Member States. Sci. Total Environ. 542, 1078–1093. doi: 10.1016/j.scitotenv.2015.08.048
Vargas, M., Glaz, B., Alvarado, G., Pietragalla, J., Morgounov, A., Zelenskiy, Y., et al. (2015). Analysis and interpretation of interactions in agricultural research. Agron. J. 107, 748–762. doi: 10.2134/agronj13.0405
Vu, D. T., Tang, C., and Armstrong, R. D. (2009). Tillage system affects phosphorus form and distribution in three contrasting Victorian soils. Aust. J. Soil Res. 47, 33–45. doi: 10.1071/SR08108
Wang, Y. T., Zhang, T. Q., O'Halloran, L. P., Tan, C. S., Hu, Q. C., and Reid, D. K. (2012). Soil tests as risk indicators for leaching of dissolved phosphorus from agricultural soils in Ontario. Soil Sci. Soc. Am. J. 76, 220–229. doi: 10.2136/sssaj2011.0175
Wu, L., Liu, M., and Rui, L. (2008). Preparation and properties of a double-coated slow-release NPK compound fertilizer with superabsorbent and water retention. Biores. Technol. 99, 547–554. doi: 10.1016/j.biortech.2006.12.027
Zhang, M., Gao, B., Chen, J., Li, Y., Creamer, A. E., and Chen, H. (2014). Slow-release fertilizer encapsulated by graphene oxide films. Chem. Eng. J. 255, 107–113. doi: 10.1016/j.cej.2014.06.023
Keywords: phosphorus, calcareous soil, short-term fertilization, polymer-coated, fertilizer rate, soil test P, change point, plant yield
Citation: Pizzeghello D, Schiavon M, Maretto L, Stevanato P, Ertani A, Altissimo A and Nardi S (2019) Short-Term Application of Polymer-Coated Mono-Ammonium Phosphate in a Calcareous Soil Affects the Pools of Available Phosphorus and the Growth of Hypericum × moserianum (L.). Front. Sustain. Food Syst. 3:4. doi: 10.3389/fsufs.2019.00004
Received: 10 October 2018; Accepted: 17 January 2019;
Published: 06 February 2019.
Edited by:
Matteo Balderacchi, Independent Researcher, Piacenza, ItalyReviewed by:
Luciano Gebler, Empresa Brasileira de Pesquisa Agropecuária (EMBRAPA), BrazilLaura Zavattaro, University of Turin, Italy
Copyright © 2019 Pizzeghello, Schiavon, Maretto, Stevanato, Ertani, Altissimo and Nardi. This is an open-access article distributed under the terms of the Creative Commons Attribution License (CC BY). The use, distribution or reproduction in other forums is permitted, provided the original author(s) and the copyright owner(s) are credited and that the original publication in this journal is cited, in accordance with accepted academic practice. No use, distribution or reproduction is permitted which does not comply with these terms.
*Correspondence: Diego Pizzeghello, ZGllZ28ucGl6emVnaGVsbG9AdW5pcGQuaXQ=